
A neuro-symbolic system over knowledge graphs for link prediction
Abstract
Neuro-Symbolic Artificial Intelligence (AI) focuses on integrating symbolic and sub-symbolic systems to enhance the performance and explainability of predictive models. Symbolic and sub-symbolic approaches differ fundamentally in how they represent data and make use of data features to reach conclusions. Neuro-symbolic systems have recently received significant attention in the scientific community. However, despite efforts in neural-symbolic integration, symbolic processing can still be better exploited, mainly when these hybrid approaches are defined on top of knowledge graphs. This work is built on the statement that knowledge graphs can naturally represent the convergence between data and their contextual meaning (i.e., knowledge). We propose a hybrid system that resorts to symbolic reasoning, expressed as a deductive database, to augment the contextual meaning of entities in a knowledge graph, thus, improving the performance of link prediction implemented using knowledge graph embedding (KGE) models. An entity context is defined as the ego network of the entity in a knowledge graph. Given a link prediction task, the proposed approach deduces new RDF triples in the ego networks of the entities corresponding to the heads and tails of the prediction task on the knowledge graph (KG). Since knowledge graphs may be incomplete and sparse, the facts deduced by the symbolic system not only reduce sparsity but also make explicit meaningful relations among the entities that compose an entity ego network. As a proof of concept, our approach is applied over a KG for lung cancer to predict treatment effectiveness. The empirical results put the deduction power of deductive databases into perspective. They indicate that making explicit deduced relationships in the ego networks empowers all the studied KGE models to generate more accurate links.
1.Introduction
Neuro-Symbolic Artificial Intelligence is a research field that combines symbolic and sub-symbolic AI models [3,8,35]. The symbolic models refer to AI approaches based on handling explicit symbols to conduct reasoning and support explainability. On the other hand, AI sub-symbolic systems are based on statistical and probabilistic learning from data mining and neural network models. Symbolic and sub-symbolic systems differ in how they represent and manage data to perform reasoning and prediction. As a result, they aim at solving complementary tasks whose integration has the potential to empower prediction with reasoning supported by symbolic formal frameworks [3,15].
Neuro-symbolic integration aims to bridge the gap between symbolic and sub-symbolic systems; it resorts to translation algorithms to align symbolic to sub-symbolic representations and improve performance [3,8,38]. However, integrating neuro-symbolic into real-world applications is a challenging task. Even in controlled environments, neuro-symbolic integration may not be completed performed [14]. For instance, Fernlund et al. [11] describe systems that use machine learning to learn relations from expert observations. While these systems are successful in learning, they lack the expressive power of symbolic systems. Another example of neuro-symbolic systems combining connectionist inductive learning and logic programming to solve the problems in the molecular biology and power plant fault diagnosis [9]. Furthermore, Karpathy et al. [19] combine convolutional neural networks with bidirectional recurrent neural networks over sentences to recognize and label image regions. Despite these advances in neuro-symbolic AI integration, symbolic processing is not fully exploited, in particular, if reasoning methods are implemented on top of knowledge graphs [38].
Problem Statement and Proposed Solution: We tackle the problem of link prediction over knowledge graphs and propose an approach combining symbolic reasoning and sub-symbolic prediction. Our approach integrates a domain-agnostic symbolic system with knowledge graph embedding models. It resorts to symbolic reasoning to deduce relationships between entities that compose the ego network of the entities in a knowledge graph, where the ego network of an entity v is the set of edges connected to v in the knowledge graph. Thus, contextual knowledge, represented by ego networks, is enhanced, and the sparsity of knowledge graphs is reduced. Since the behavior of knowledge graph embedding models can be affected in sparse graphs [45], training these models with these enhanced ego networks increases the chances of predicting accurate links between entities associated with these networks. We apply our hybrid approach in the context of lung cancer. The symbolic system implements a deductive database to infer drug-drug interactions in lung cancer treatments. Complementary, the sub-symbolic system resorts to knowledge graph embedding models to predict the effectiveness of a lung cancer treatment. These models transform RDF triples representing treatments, their drugs, and interactions among these drugs into a low-dimensional continuous vector space that preserves the knowledge graph structure. The integration of both systems enables the prediction of a treatment’s response, taking into account the potential effect that drug-drug interactions have on the effectiveness of the treatment.
Results: We assess the performance of the proposed neuro-symbolic system on a knowledge graph built from clinical records of lung cancer patients; it comprises treatments prescribed to these patients, the responses of these treatments, and the drugs that have been administrated. Additionally, this knowledge graph integrates information about the drug-drug interactions between the oncological and non-oncological drugs composing a lung cancer treatment. These drug-drug interactions have been extracted from DrugBank11 following the named entity recognition, and linking techniques proposed by Sakor et al. [33]. The prediction task is defined in terms of predicting links between treatments (i.e., heads) and instances of a class representing the different types of lung cancer responses (i.e., tails). The link prediction task is implemented using eleven state-of-the-art KGE models. The experiments are executed following different configurations and baselines, with the goal of assessing the accuracy of our proposed neuro-symbolic system. Results of a 5-fold cross-validation process demonstrate that our integrated system improves the prediction accuracy of studied state-of-the-art KGE models. Moreover, the outcomes of this experimental study put the power of deductive databases into perspective, showing how they can empower the accuracy of link prediction tasks. More importantly, these results provide evidence of the paramount role of deductive reasoning and knowledge graph embedding models in predicting treatment response.
Contributions: This paper resorts to our previous work [29], where we propose a deductive system over knowledge graphs to formalize the process of drug-drug interactions. Built on these results, we present a hybrid approach combining symbolic reasoning expressed by deductive systems with the sub-symbolic expressiveness of KGE models to enhance prediction accuracy. In a nutshell, our novel contributions are:
1. A domain-agnostic approach able to empower the predictive performance of sub-symbolic systems with a deductive database system. The deductive system reduces data sparsity issues by inferring implicit relationships in a KG. Consequently, the sub-symbolic system, implemented by KGE models, better represents statements described in the KG into a low-dimensional continuous vector space.
2. An extensive evaluation of our neuro-symbolic system with state-of-the-art KGE models demonstrates the benefit of integrating deductive reasoning and sub-symbolic systems. The evaluation is performed on the problem of predicting the effectiveness of lung cancer treatments composed of multiple drugs, i.e., polypharmacy treatments.
2.Preliminaries and motivation
Knowledge Graphs (KGs) are data structures converging data and knowledge as factual statements of a graph data model [13,16]. Formally, a knowledge graph is a 10-tuple
– V is a set of nodes corresponding to concepts (e.g., classes and entities).
–
– L is a set of properties.
– C is a set of classes
–
–
–
–
–
–
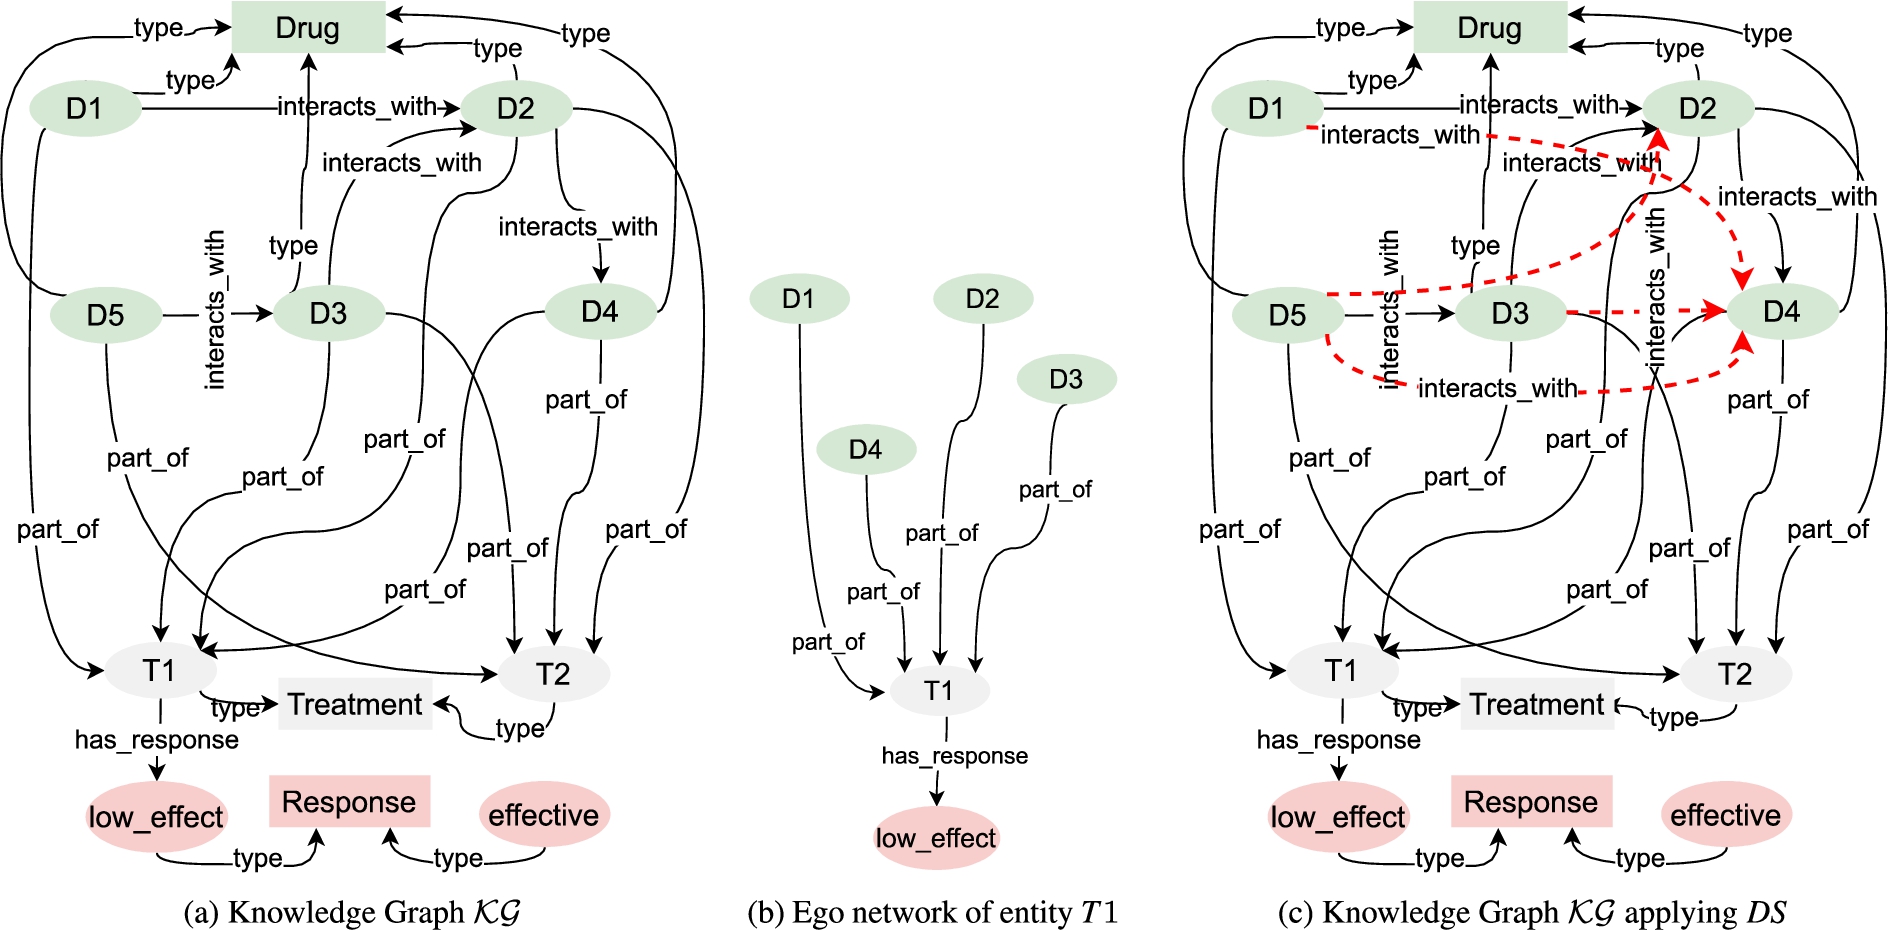
Fig. 1.
Example knowledge graph. Fig. 1(a) shows a KG with three classes, five green entities belonging to class
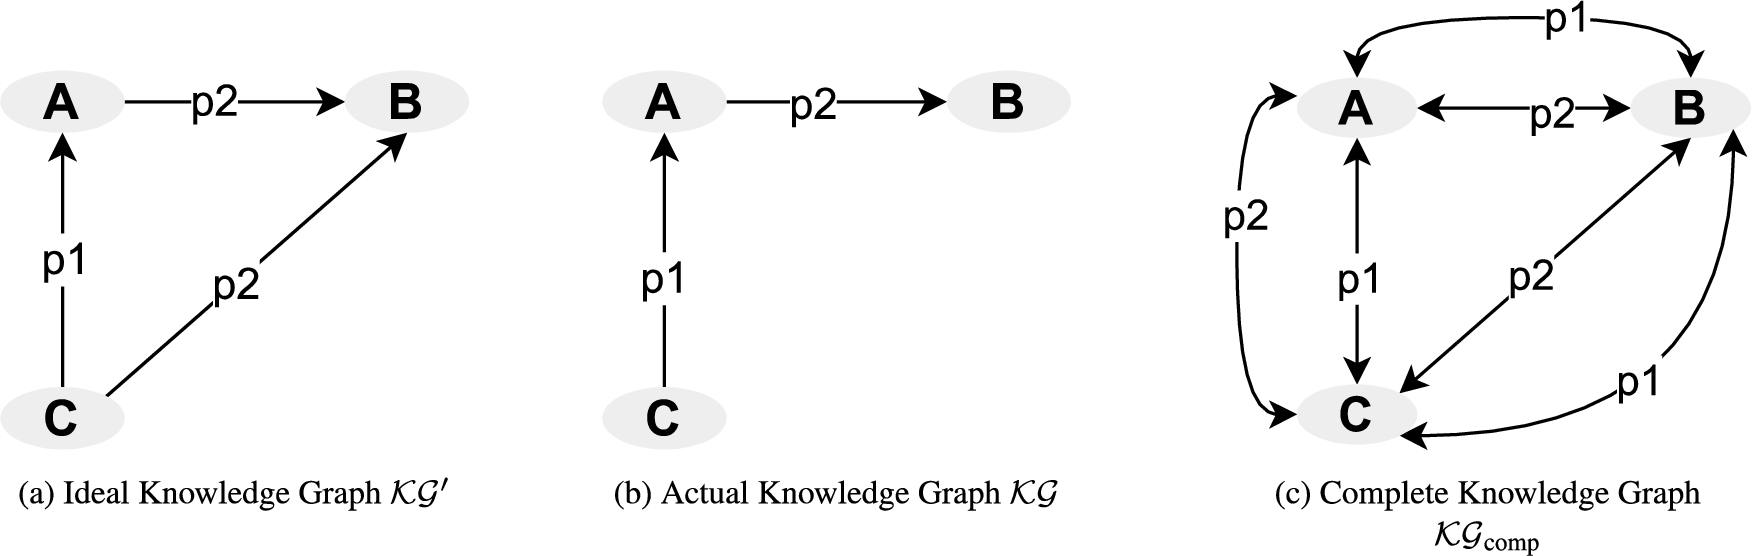
An ideal knowledge graph. An ideal knowledge graph is a knowledge graph
An actual knowledge graph. An actual knowledge graph
A complete knowledge graph. A complete knowledge graph
A knowledge graph
Fig. 2.
Example of actual, ideal, and complete knowledge graph.
An abstract target prediction over a knowledge graph
–
– r represents a prediction property,
–
–
–
The deductive system
An example of EDB is the set of facts
Suppose the abstract target prediction is defined for the current knowledge graph
2.1.Motivating example
We motivate our work in healthcare, specifically for predicting polypharmacy treatment response. Polypharmacy is the concurrent use of multiple drugs in treatments, and it is a standard procedure to treat severe diseases, e.g., lung cancer. Polypharmacy is a topic of concern due to the increasing number of unknown drug-drug interactions (DDIs) that may affect the response to medical treatment. Pharmacokinetics is a type of DDIs, i.e., the course of a drug in the body. Pharmacokinetics DDIs alter a drug’s absorption, distribution, metabolism, or excretion. For example, an increase in absorption will increase the object drug’s bioavailability and vice versa. If a DDI affects the object’s drug distribution, the drug transport by plasma proteins is altered. Moreover, a drug’s therapeutic efficacy and toxicity are affected when a pharmacokinetics DDI alters the object’s drug metabolism. Lastly, if the excretion of an object drug is reduced, the drug’s elimination half-life will be increased. Notice that the pharmacokinetic interactions can be encoded in a symbolic system.
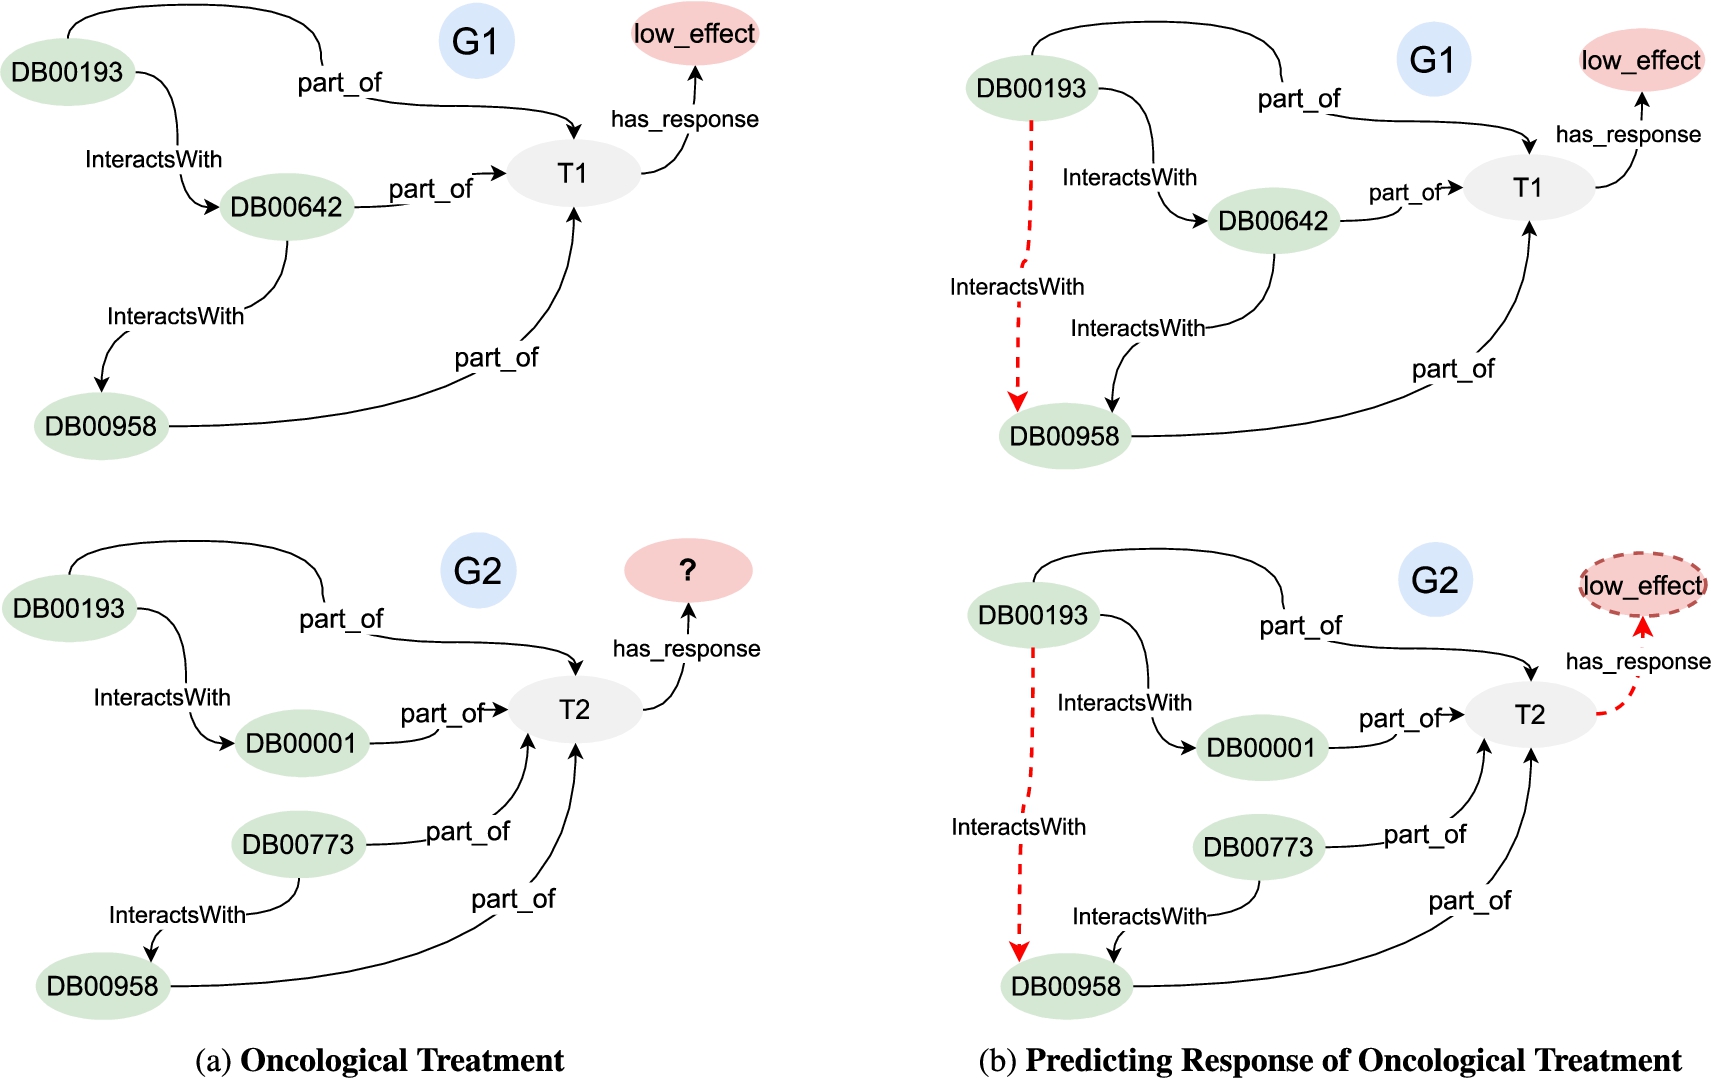
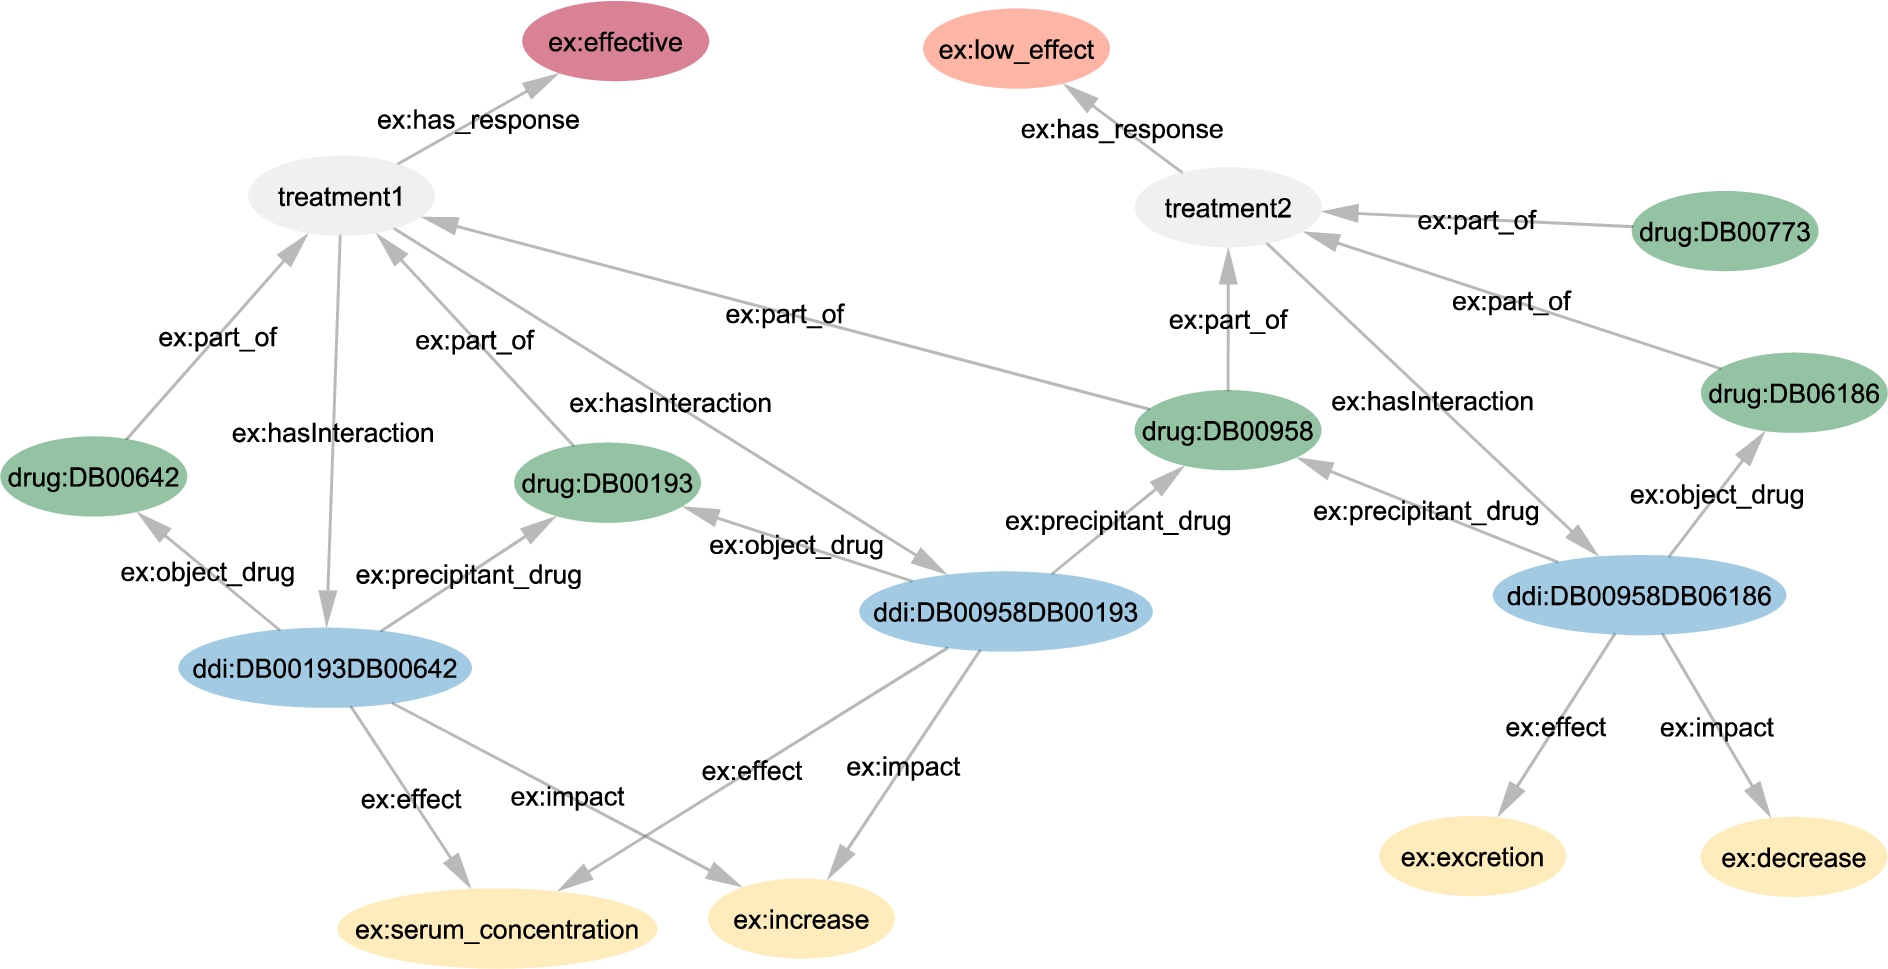
Figure 3(a) shows two polypharmacy oncological treatments encoded in RDF. We extract the known DDIs between the drugs of these treatments from DrugBank. However, polypharmacy therapies produce unforeseen DDIs due to drug interactions in the treatment. Since DDIs affect the effectiveness of a treatment, there is a great interest in uncovering these DDIs. Figure 3(b) depicts an ideal RDF graph where all the existing relations are explicitly represented. Dotted red arrows represent DDI between the drugs DB00193 and DB00958 that are generated as the result of DDIs among drugs in the treatment. A Datalog program represents the rules that state when these DDIs are produced between the drugs administrated in a treatment. The extensional database corresponds to facts representing explicit relationships; in our case, these facts are extracted from DrugBank. The intensional database corresponds to intensional rules that define all the combinations of DDIs that may produce new DDIs; they allow for deducing implicit DDIs in a treatment. The DDI between DB00193 and DB00958 increases the information of treatments T1 and T2, enabling both treatments to share more relationships. Then, a sub-symbolic system, e.g., a knowledge graph embedding model, can explore these enhanced relationships and make a more accurate prediction of the treatment response by employing the deduced DDIs. For example, the geometric model TransH places T1 and T2 nearby in the embedding space after deducing DDIs and predicts the therapeutic response of T2. As a result, this neuro-symbolic system enhances treatment information by identifying drug combinations whose interactions may affect treatment effectiveness. We propose an approach that resorts to symbolic reasoning implemented by a Datalog database and stage-of-the-art KGE models; it deduces DDIs within a treatment. Then, the KGE model embeds all the knowledge in the graph and predicts treatment responses. Although we depict the method in the context of treatment effectiveness, this approach is domain-agnostic and could be applied to any other link prediction task.
Fig. 3.
Motivating example. Fig. 3(a) shows two polypharmacy oncological treatments, T1 and T2, represented in RDF. The drugs DB00193, DB00642, and DB00958 are part of T1, and the drug-drug interactions are represented by the property InteractsWith. The therapeutic response of T1 is annotated as low_effect by the property has_response, while the therapeutic response of T2 is unknown. Figure 3(b) depicts the ideal RDF graph, where a symbolic system generates a new DDI between DB00193 and DB00958. Ideally, a sub-symbolic system detects that both treatments are similar and predicts the effectiveness of T2 as low effective.
3.Proposed symbolic and sub-symbolic system
3.1.Problem statement
Given an actual knowledge graph
Given a relation,
3.2.Proposed solution
Our proposed solution resorts to a symbolic system implemented by a deductive database to enhance the predictive precision of the link prediction task solved by knowledge graph embedding models. The approach assumes that a link prediction problem is defined in terms of an abstract target prediction
A Symbolic System: Deductive system
A Sub-symbolic System: A model to learn Knowledge Graph Embeddings solves the abstract target prediction τ over
The Integration of Symbolic and Sub-symbolic Systems: The ego network
3.3.The symbolic and sub-symbolic system architecture
Figure 4 depicts the architecture that implements the proposed approach. The architecture receives a knowledge graph
Fig. 4.
Approach. The input is a knowledge graph (
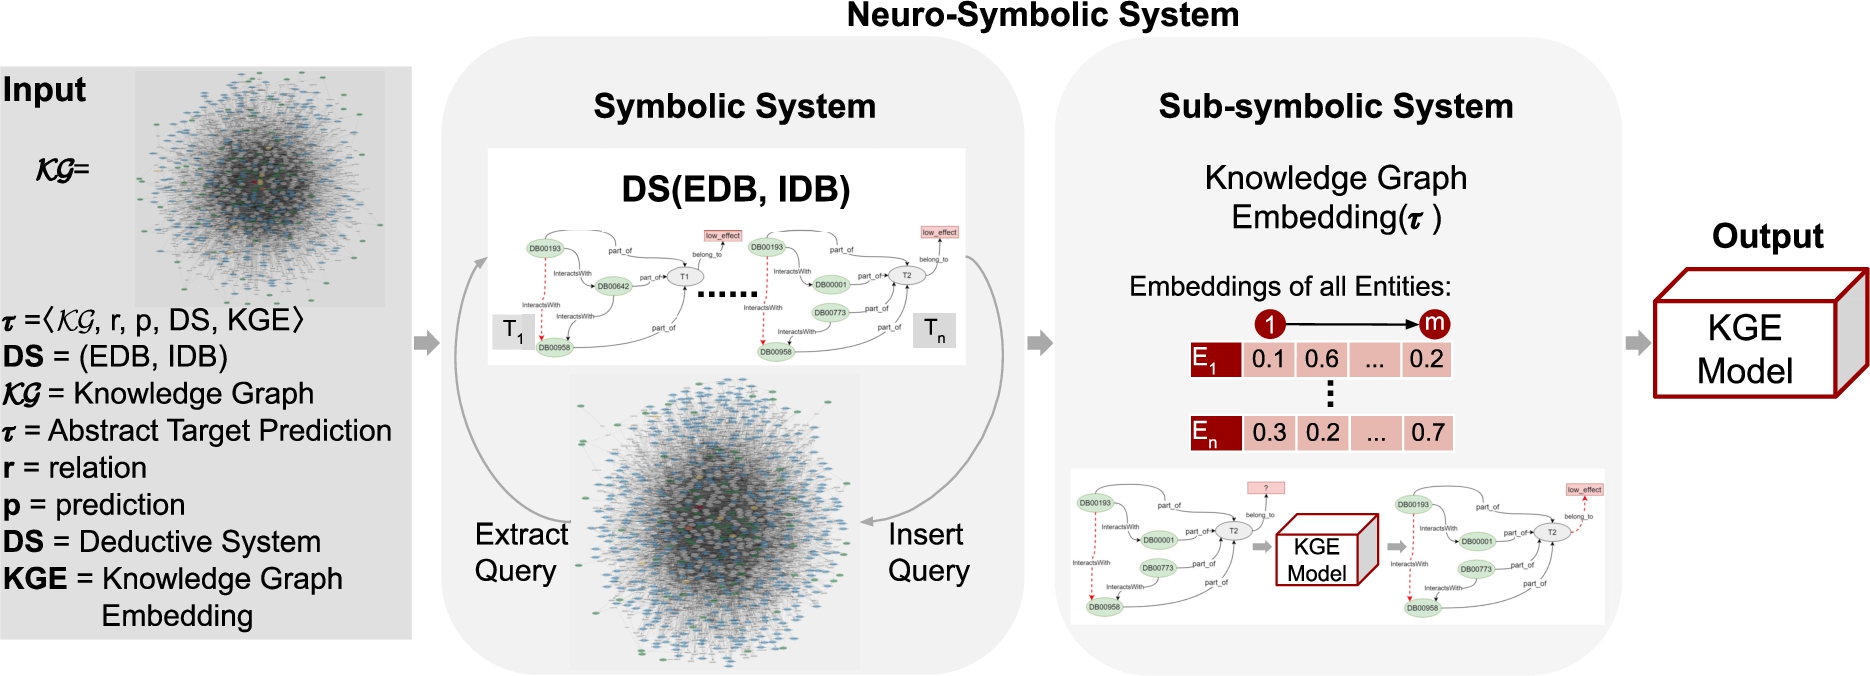
The architecture is composed of two main steps. First, the relationships implicitly defined by the deductive system are deduced by means of a Datalog program. Second, once
3.4.Abstract target prediction task. Running example
Albeit illustrated in the context of treatment response, the proposed method is domain-agnostic. It only requires the definition of the deductive system to enhance the relationships in the ego network of the entities v where
Fig. 5.
Running example. Figure 5 illustrates the proposed steps to enhance the predictive performance of KGE models. Step A: given a KG and an abstract target prediction
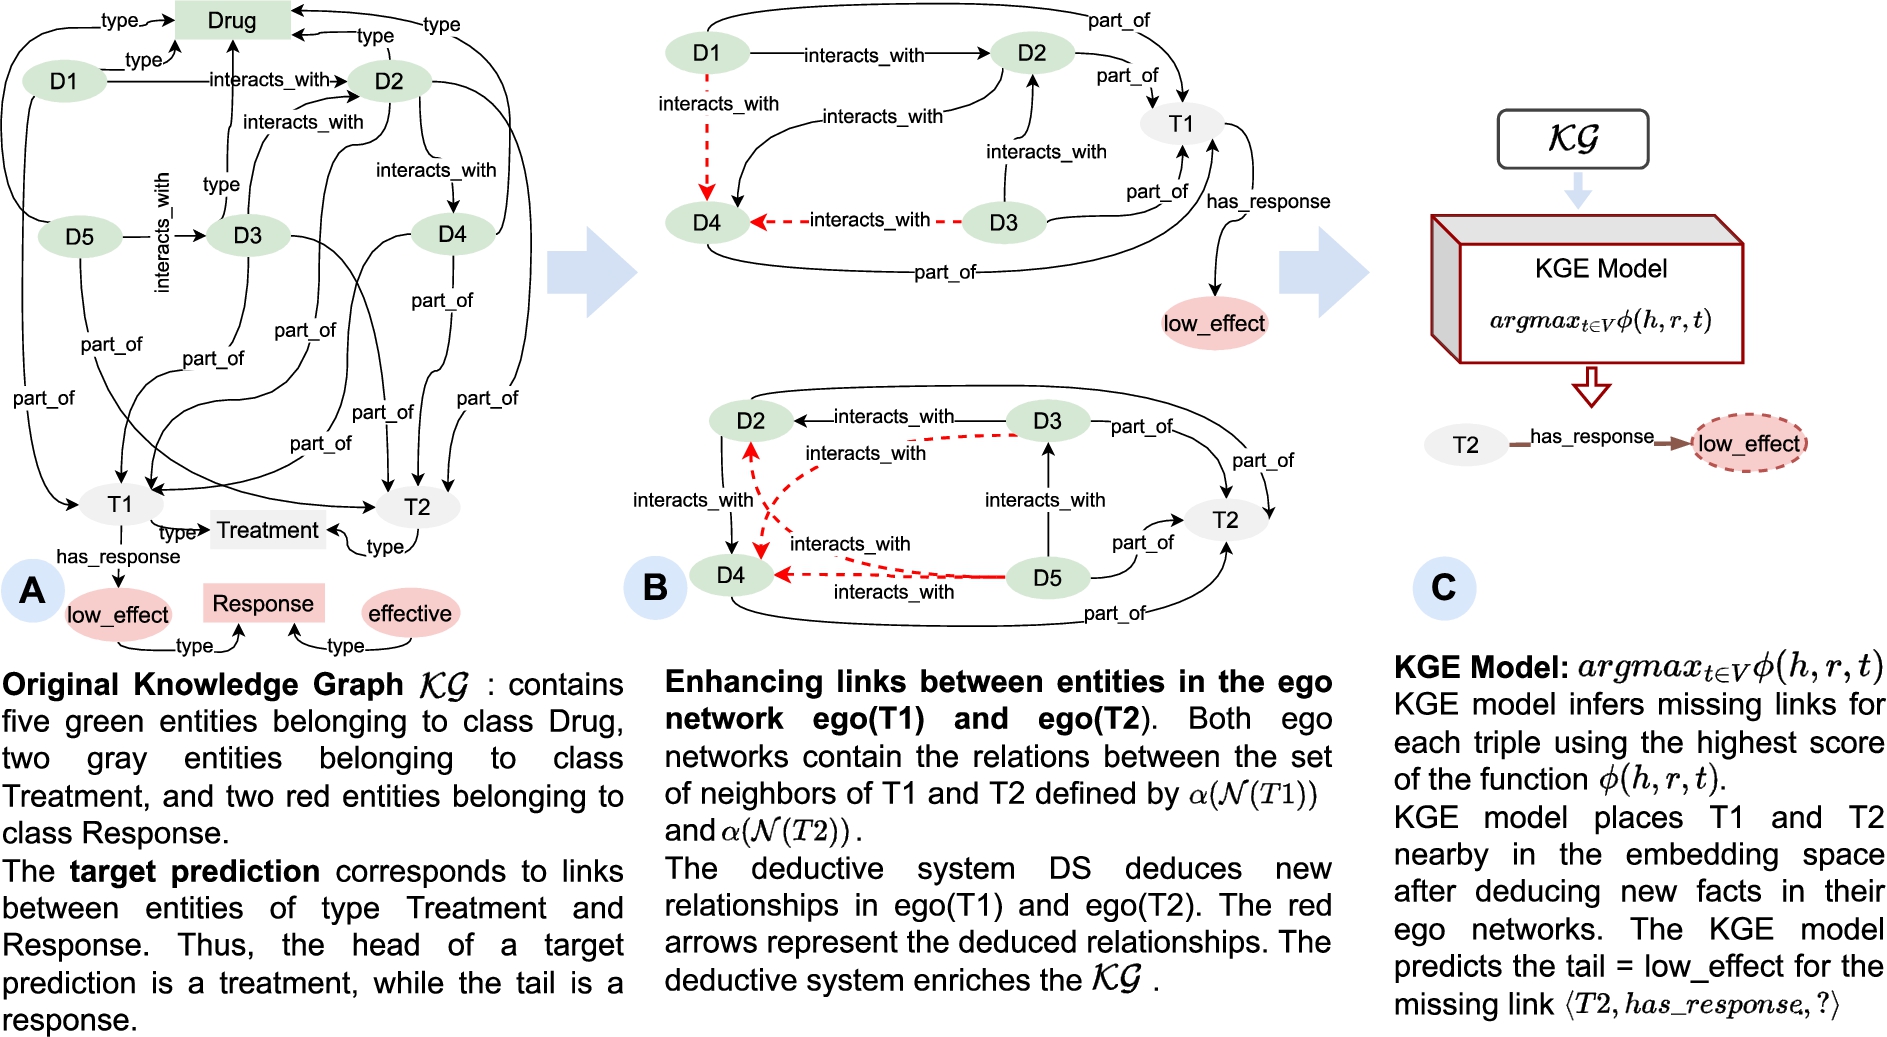
The EDB comprises all the ground facts defined by the ego networks:
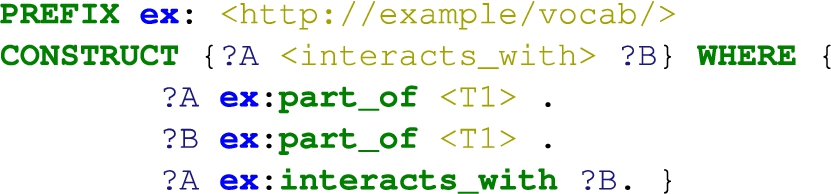
The SPARQL query in Listing 1 extracts the ego network
Listing 1.
SPARQL query to ground the extensional predicate
The IDB described by the Datalog program P(1) allows deducing new relationships and increasing the ego networks
Listing 2.
SPARQL query to insert the deduced relationships from the intensional predicate inferred_interaction(A,X)
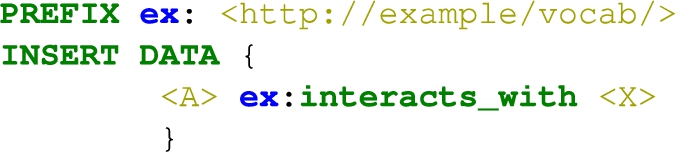
Figure 5(C) illustrates a
4.Use case: Prediction of polypharmacy treatment effectiveness
As a proof concept, we apply our neuro-symbolic approach to address the problem of predicting polypharmacy treatment effectiveness. We have implemented a deductive system on top of a Treatment Knowledge Graph (
4.1.Treatment knowledge graph creation
The P4-LUCAT consortium22 collected heterogeneous data sources that comprise clinical records, drugs, and scientific publications and built a knowledge graph that provides an integrated view of these data. The KG is built with the aim of personalized medicine for Lung Cancer treatments. The treatments are extracted from Electronic Health Records (EHRs) from the Hospital Universitario Puerta del Hierro of Majadahonda of Madrid (HUPHM). Furthermore, the DDIs are extracted from DrugBank, in the approved category. The interactions’ type and effect are extracted using named entity and linking methods implemented by Sakor et al. [34]. These methods have also been used to extract DDIs in covid-19 and lung cancer treatments [1,33,39]. Table 1 contains a summary of the number of annotations by classes in the Lung Cancer Knowledge Graph.
Table 1
Summary of the lung cancer knowledge graph
| Knowledge graph for lung cancer | Records |
| Lung Cancer Patients | 1’242 |
| Lung Cancer Drug | 45 |
| Chemotherapy Drug | 7 |
| Immunotherapy Drug | 3 |
| Antiangiogenic Drug | 2 |
| Tki Drug | 5 |
| Non Oncological Drug | 41 |
| Oncological Surgery | 9 |
| Tumor Stage | 6 |
| Publications | 178’265 |
| Drugs | 8’453 |
| Drug-Drug Interactions | 1’550’586 |
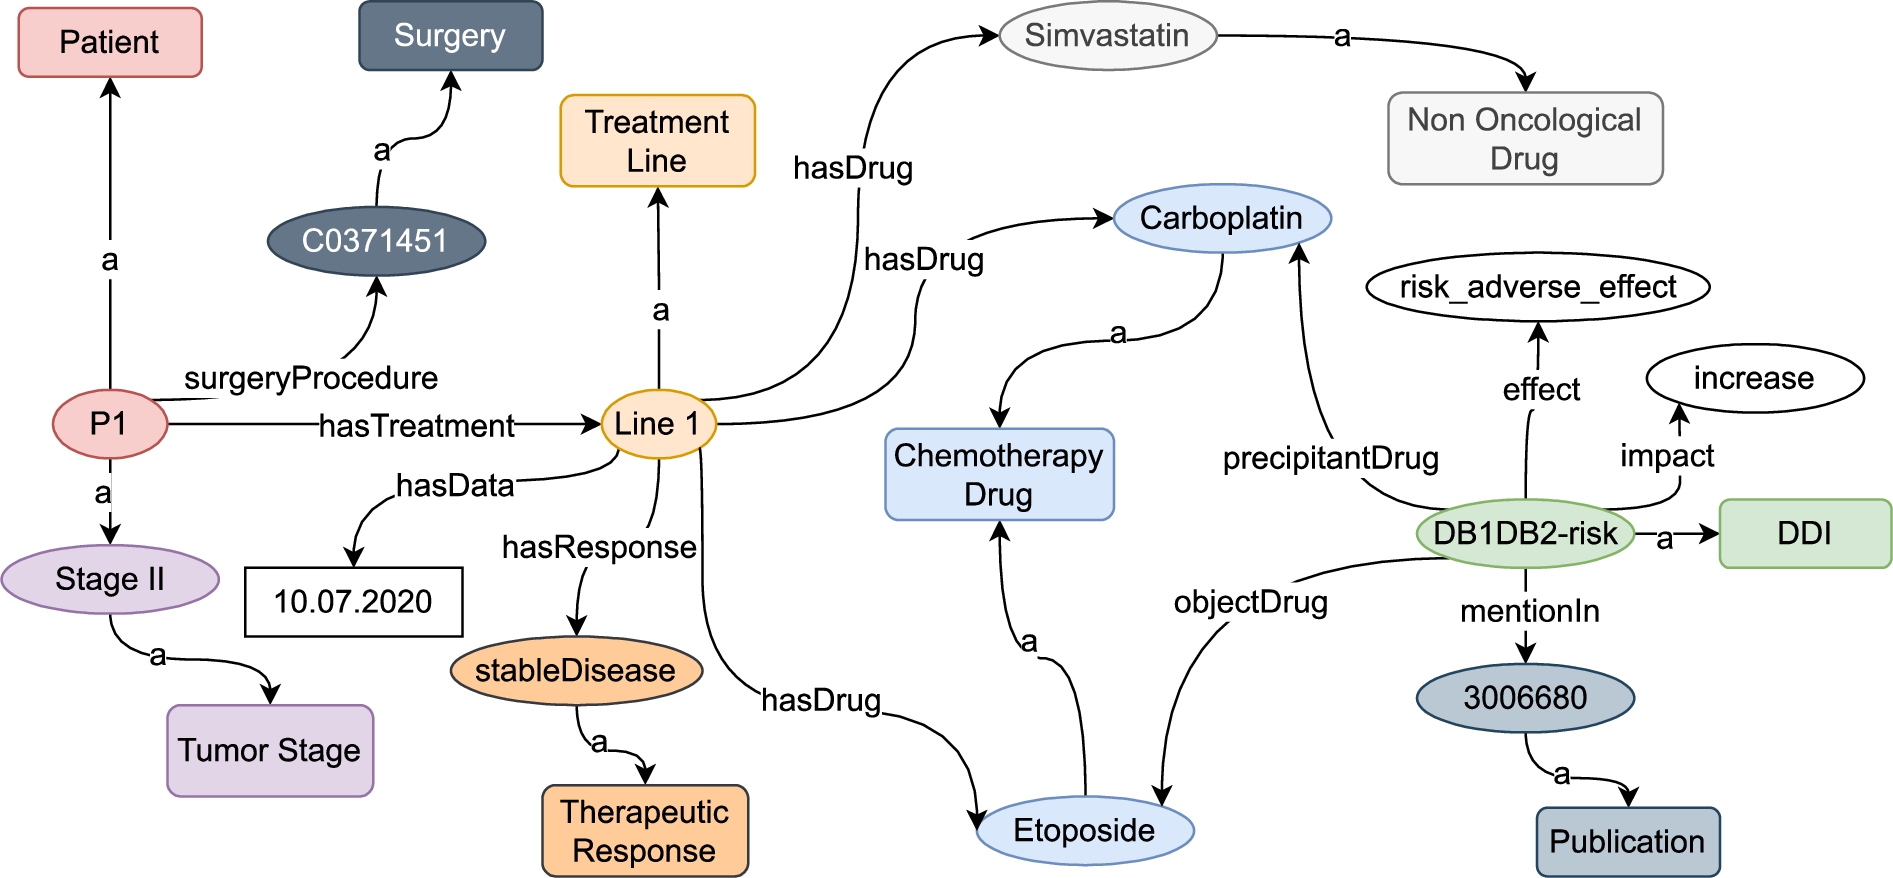
Figure 6 describes a Lung Cancer patient in the Lung Cancer Knowledge Graph. The patient P1 is in stage II and has surgery. Also, P1 received treatment on 10.07.2020 with an effective therapeutic response. In that treatment, P1 was treated with a combination of chemotherapy drugs and one non-oncological drug. Drug-Drug Interactions with the effect and the impact are reported.
Fig. 6.
Representation of a patient in the lung cancer knowledge graph.
The input
Fig. 7.
Descriptive analysis of the treatment responses.
For each treatment,
The types Drug, Treatment, DDI, Effect of DDI, and Treatment Response belong to
Drugs, Treatments, DDIs, Effect of DDI, and Treatment Response are represented as instances of V.
Edges in E that belong to
Properties ex:has_response, part_of, ex:precipitant_drug, ex:object_drug, ex:effect, ex:impact, and ex:hasInteraction correspond to labels in L.
Fig. 8.
Portion of treatment knowledge graph
4.2.Symbolic system. Deductive database
Let
SPARQL queries in Listing 3 and Listing 4 declaratively define the ground
Listing 3.
SPARQL query to ground the extensional predicate

Listing 4.
SPARQL query to ground the extensional predicate
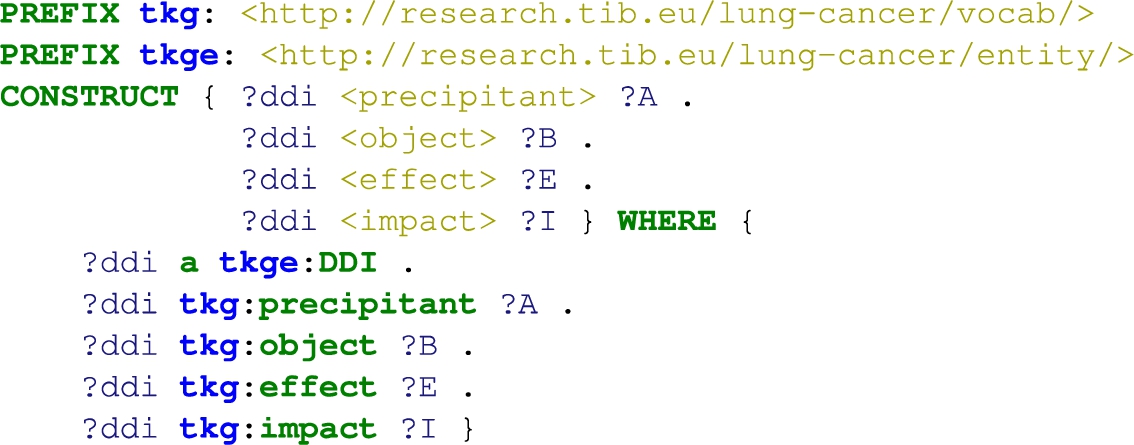
The facts included in the ground predicates precipitant, object, effect, and impact from the EDB are extracted using the CONSTRUCT query of Listing 5. The EDB contains thousands of facts for those predicates; therefore, only a few ground facts are presented.
Listing 5.
SPARQL query to extract the ground the extensional predicates precipitant(ddi,A), object(ddi,B), effect(ddi,E), and impact(ddi,I)
The above-mentioned
Rule (3) states the base case of the
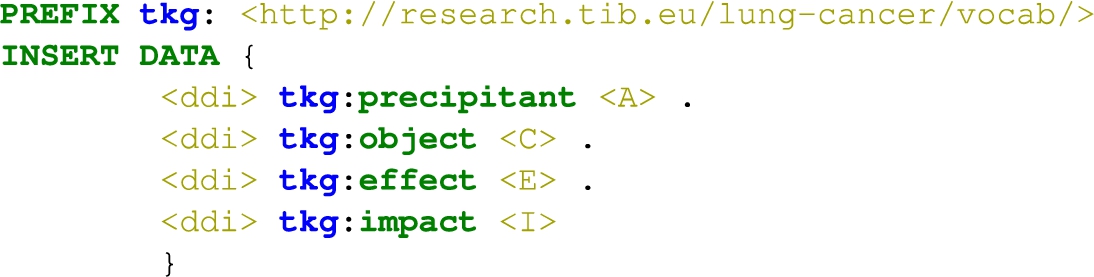
Listing 6.
SPARQL query to insert the deduced DDI from the intensional predicate inferred_ddi(A,E,I,C)
4.3.Sub-symbolic system. Knowledge graph embedding model
Once the deductive system
5.Experimental study
We empirically assess the impact of the DDIs encoded in
5.1.Experiment setup
We empirically evaluate the effectiveness of our approach to capture knowledge encoded in
5.1.1.Benchmarks
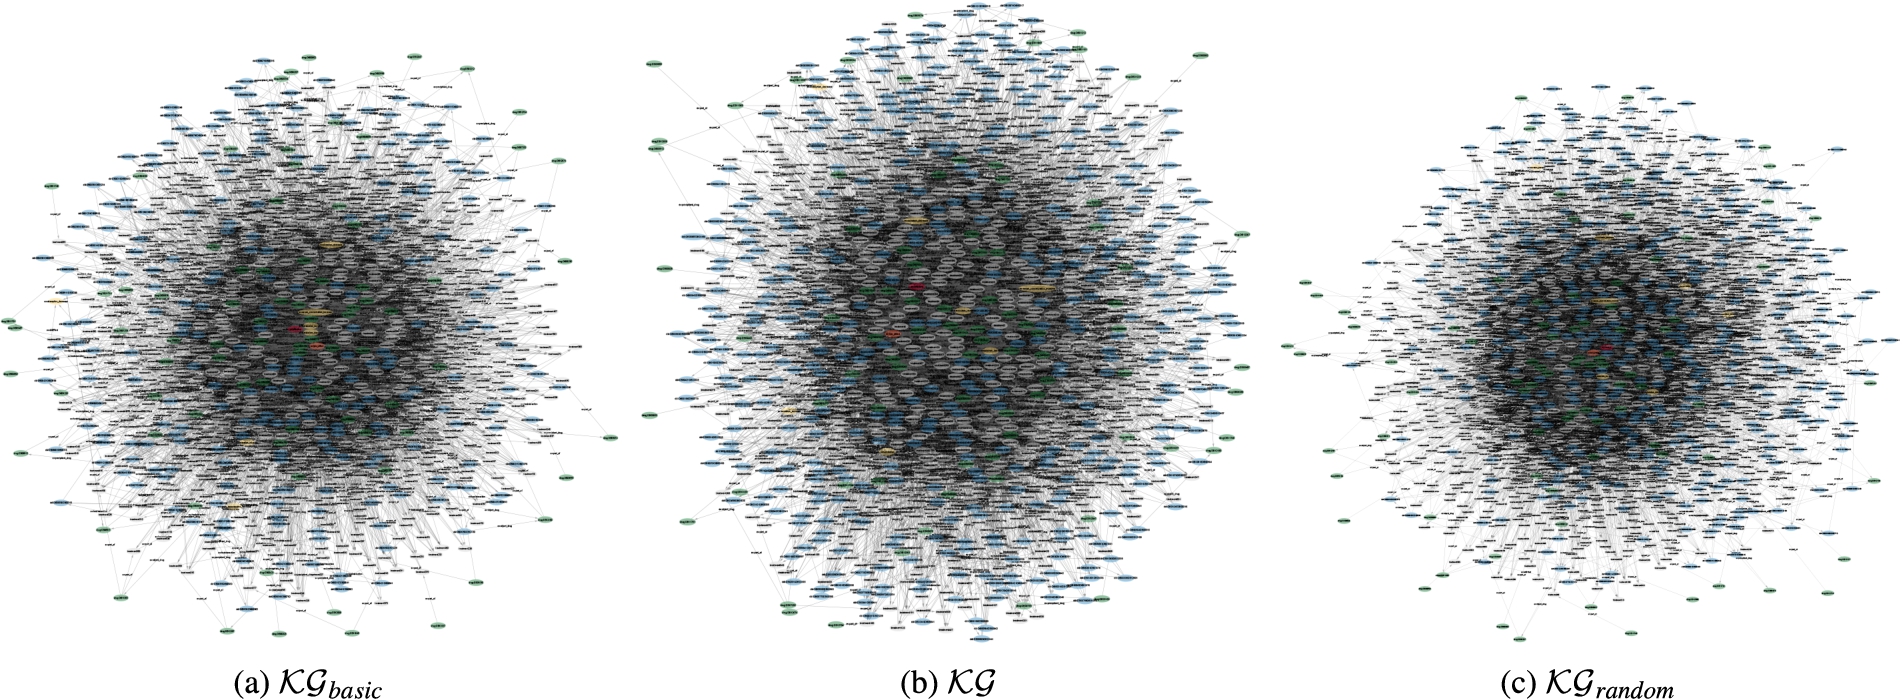
We conduct our evaluation over three Knowledge Graphs represented in Fig. 9.
Fig. 9.
Benchmarks to evaluate. Fig. 9(a) represents the
5.1.2.Knowledge graph embedding models
We utilize eleven models to compute latent representations, e.g., vectors, of entities and relations in the three KGs and then employ them to infer new facts. In particular, we utilize three main families of models:
Tensor Decomposition models such as HolE and RESCAL.
Geometric models such as RotatE, QuatE, and the Trans* family models TransE, TransH, TransD, TransR.
Deep Learning models such as UM, SE and ERMLP.
Table 2
Scoring function and complexity of embedding models. Adapted from [31]
| Embedding model | Scoring function | Complexity |
| HolE | ||
| RESCAL | ||
| RotatE | ||
| QuatE | ||
| TransE | ||
| TransH | ||
| TransD | ||
| TransR | ||
| UM | ||
| SE | ||
| ERMLP |
The PyKEEN (Python KnowlEdge EmbeddiNgs) framework [2] is used to learn the embeddings. The hyperparameters utilized to train the model are epoch number 200 and training loops: stochastic local closed world assumption (sLCWA). The negative sampling techniques used are Uniform negative sampling and Bernoulli negative sampling. The embedding dimensions and the rest of the parameters are set by default. To assure statistical robustness, we apply 5-fold cross-validation. For evaluating the performance of embeddings methods, we measure the metrics:
5.1.3.Implementations
The pipeline for predicting polypharmacy treatment response has been implemented in Python 3.9. Experiments were executed using 12 CPUs Intel® Xeon(R) W-2133 at 3.60 GHz, 64 GB RAM, and 1 GPU GeForce GTX 1080 Ti/PCIe/SSE2 with 12 GB VRAM. We used the library pyDatalog33 to develop the Deductive System and the library PyKEEN,44 to learn the embeddings.
5.2.Metrics to characterize the benchmarks
Table 3 shows the statistics of the three KGs. We considered the metrics, Number of Triples (T), Entities (E), and Relations (R), to measure the size in KG. The metrics Relation entropy (
Table 3
Statistics of knowledge graph. Metrics to measure size, diversity, and sparsity in knowledge graph
| KG | T | E | R | RE | EE | RD | ED |
| 5630 | 1069 | 7 | 1.615 | 10.846 | 804.286 | 10.533 | |
| 6675 | 1069 | 7 | 1.726 | 10.989 | 953.571 | 12.488 | |
| 6675 | 1069 | 7 | 1.710 | 11.291 | 953.571 | 12.488 |
The metrics
5.3.Impact of capturing symbolic knowledge
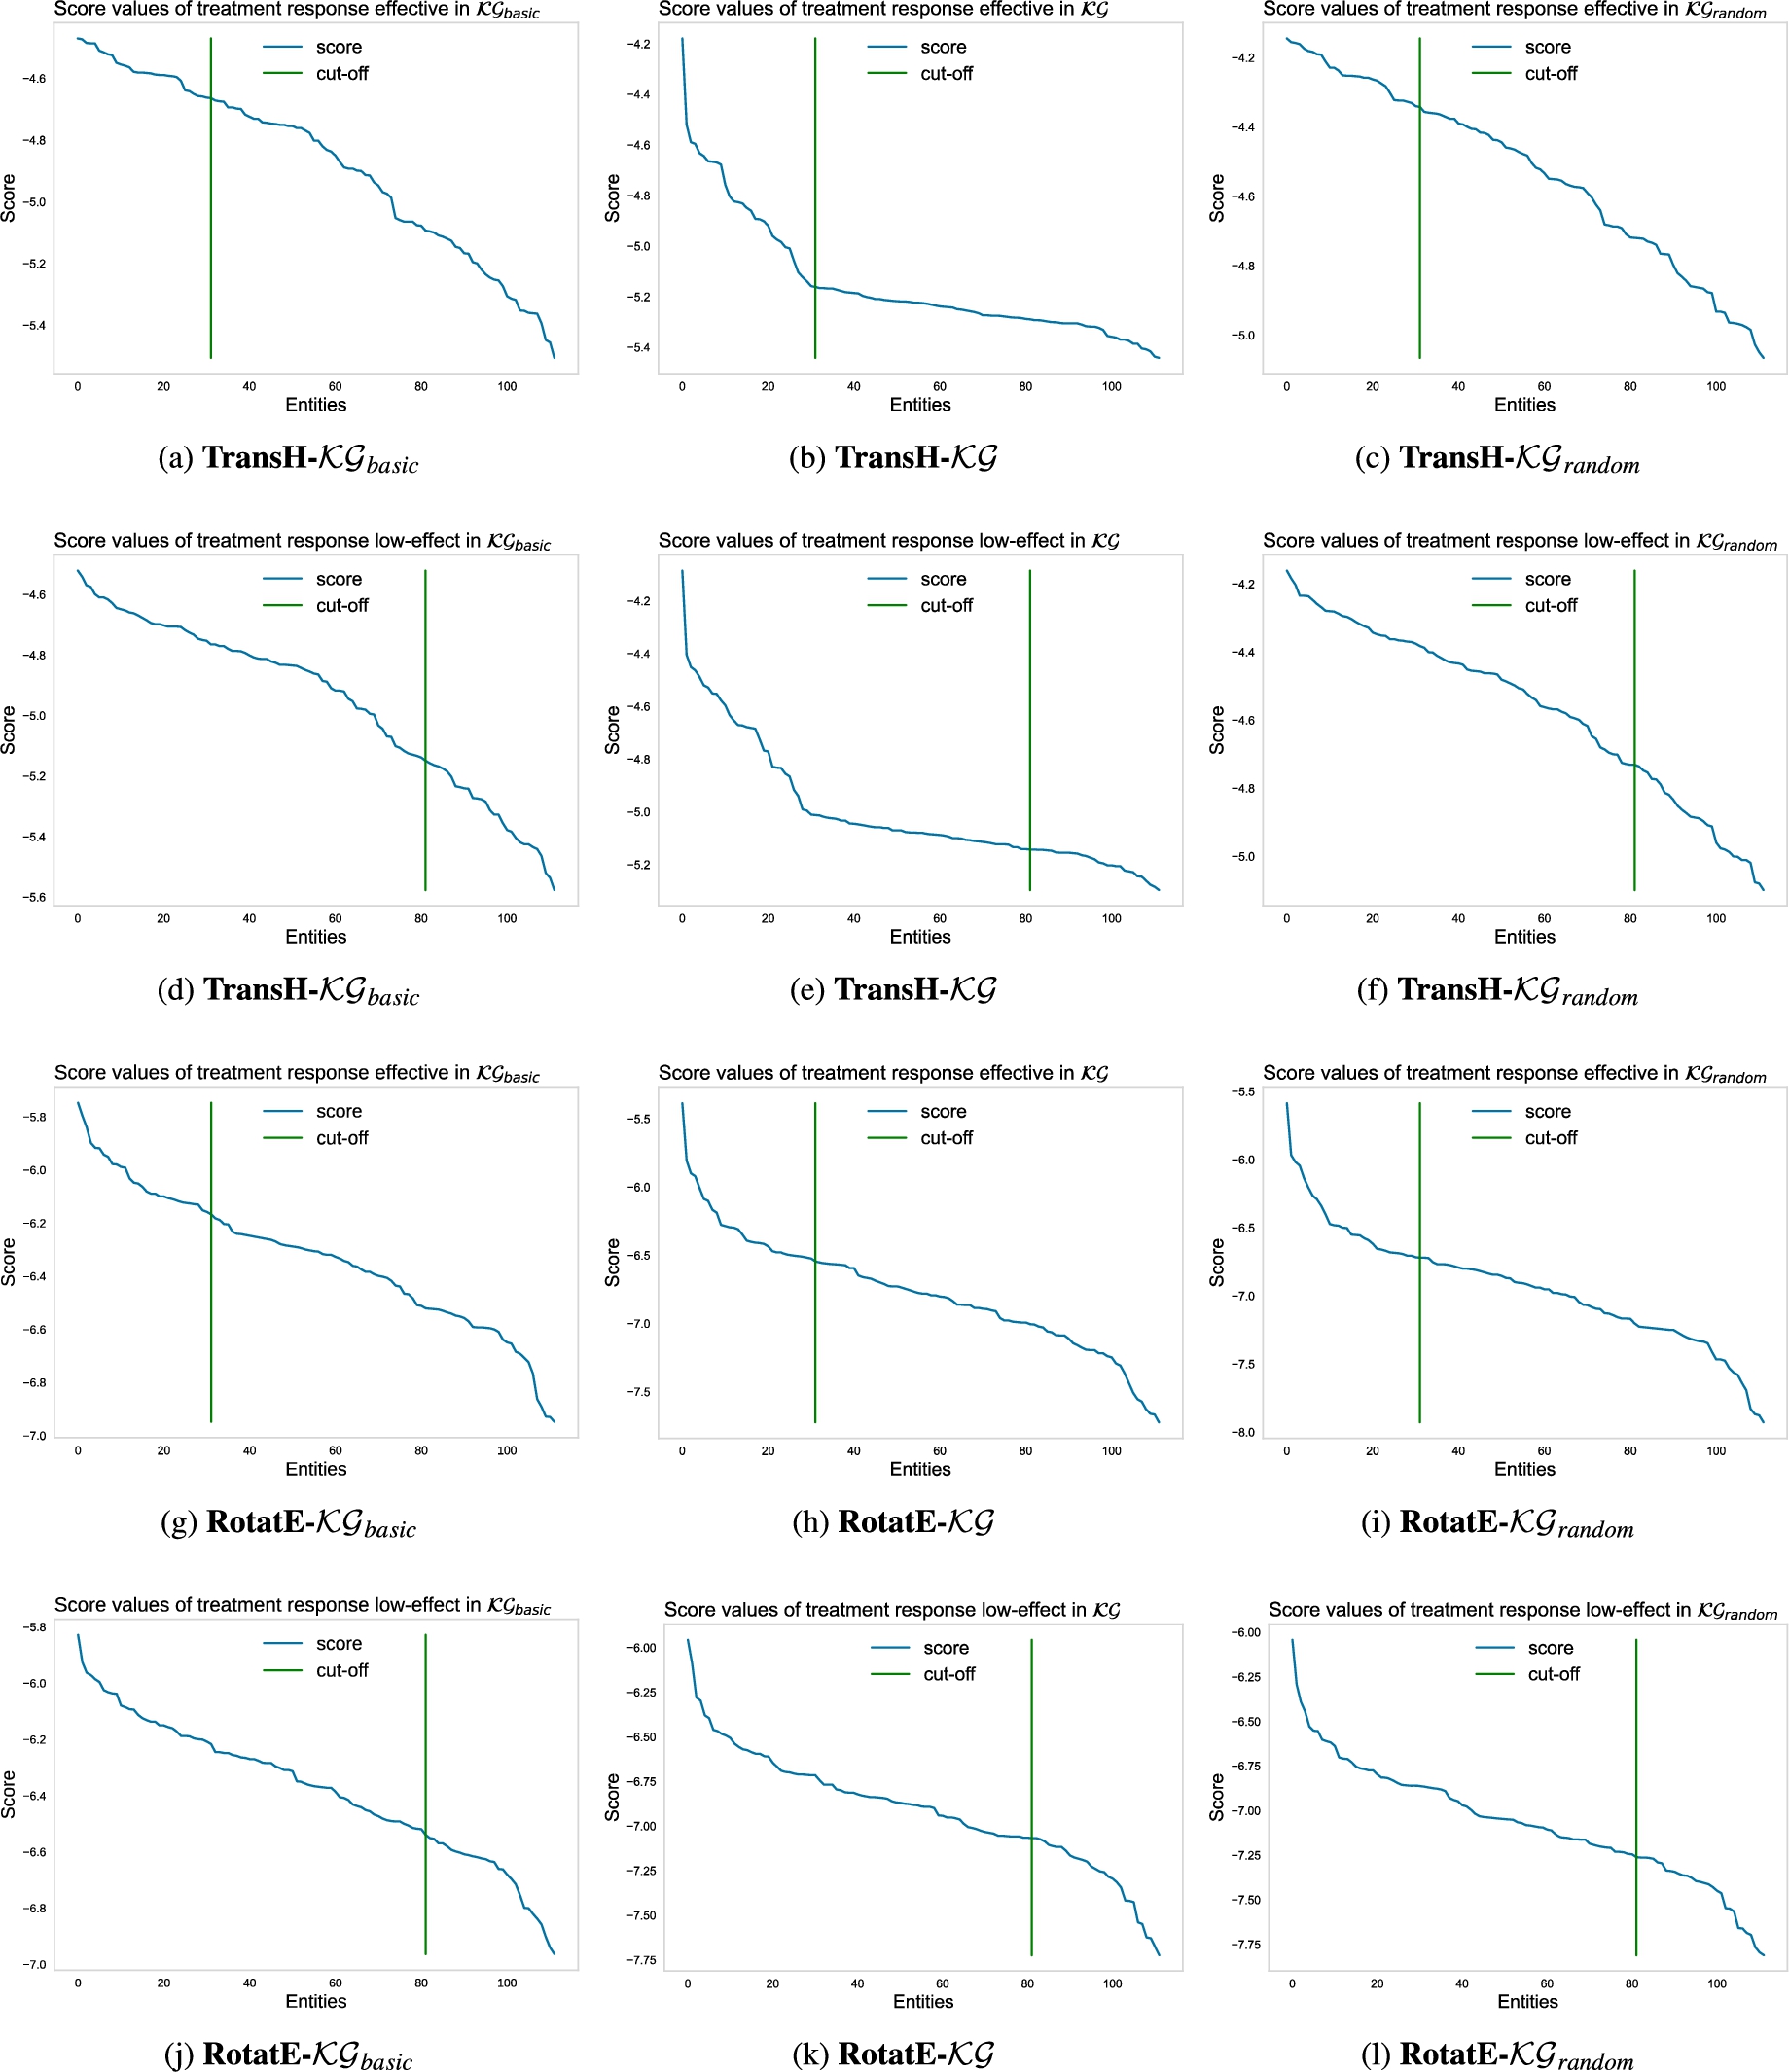
Figure 10 shows the behavior of the scoring function for the entities predicted by TransH and RotatE embedding models. For the purpose of brevity, we only show the score value results for two embedding models. The evaluation material is available .66 We can notice how
Fig. 10.
Score value of the predicted entities. The green line represents the cut-off at the percentile 27 for effective treatments and 73 for low-effect treatments for the three KGs.
5.4.Evaluating the performance of our integrated symbolic-sub-symbolic system
The selected portions of entities predicted are measured precision, recall, and f1-score on average because of cross-validation. Figure 11 and Fig. 12 show the evaluation of the Link Prediction task through Uniform negative sampling and Bernoulli negative sampling, respectively. Uniform sampling randomly chooses the candidate entity based on a uniform probability between all possible entities. Bernoulli sampling corrupts the head with probability p and the tail with
Fig. 11.
Evaluation of the link prediction task in terms of precision, recall, and f-measure. Utilizing uniform negative sampling.
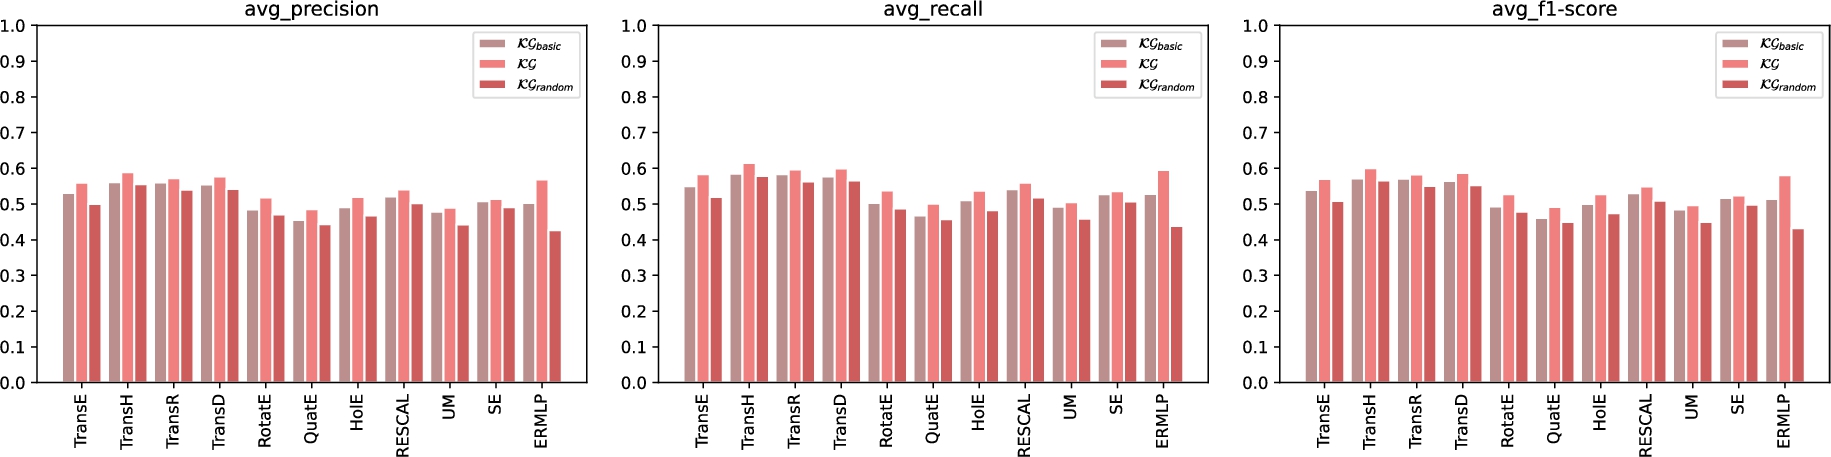
Fig. 12.
Evaluation of the link prediction task in terms of precision, recall, and f-measure. Utilizing Bernoulli negative sampling.

5.5.Discussion
The techniques proposed in this paper rely on known relations between entities to predict novel links in the KG. During the experimental study, we observed that these techniques could improve the prediction of treatment effectiveness. Figure 13 shows a box plot of cosine similarity. Considering the KGE model with better performance TransH, we computed the cosine similarity between the embedding entities of type treatment. Five treatments with a low-effect response are selected, and TransH in
Fig. 13.
Boxplot of cosine similarity. The boxplot illustrates the distribution of cosine similarity values between treatments in x-axe with a list of treatments. We observe the five treatments in the x-axe are more similar to the treatments in
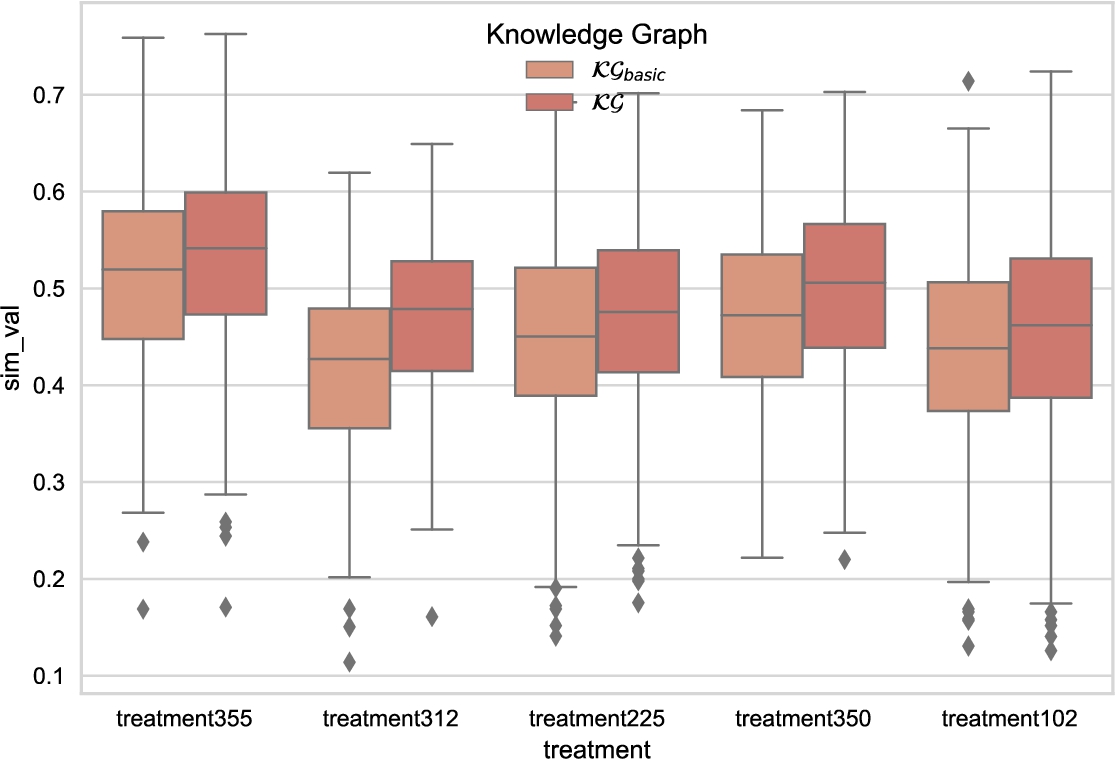
Fig. 14.
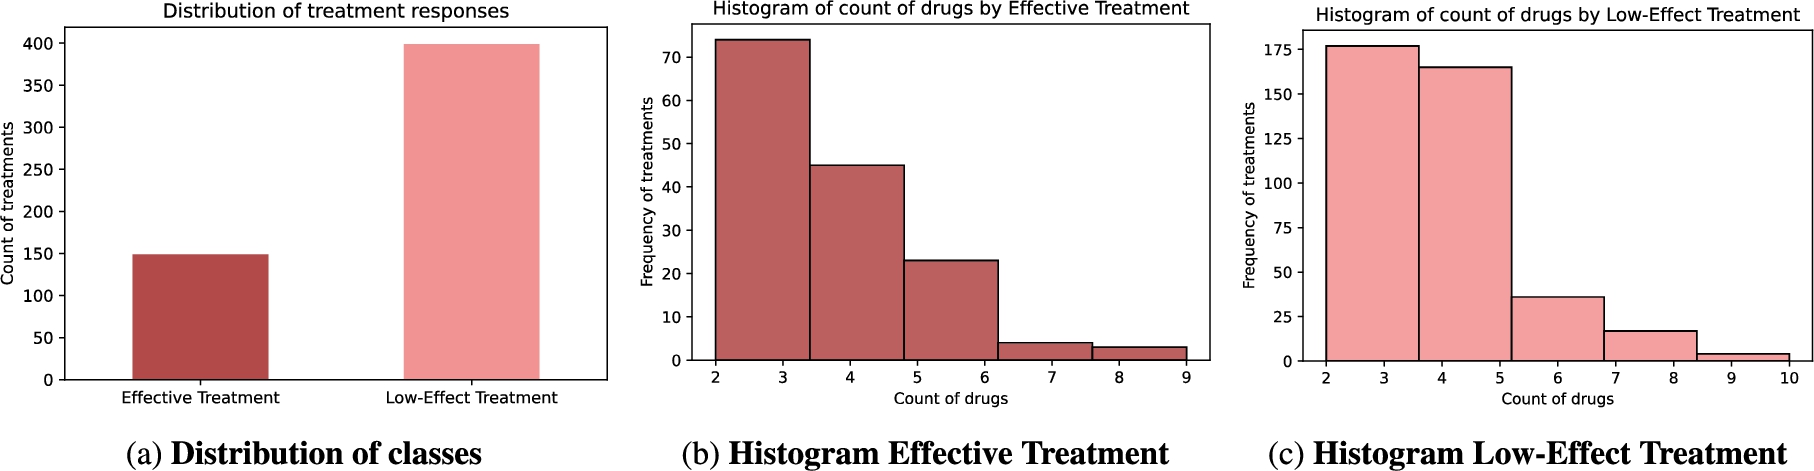
The distribution of DDIs by treatment for each KG. Figure 14(a) shows the density of treatments by DDIs for the treatment response effective in
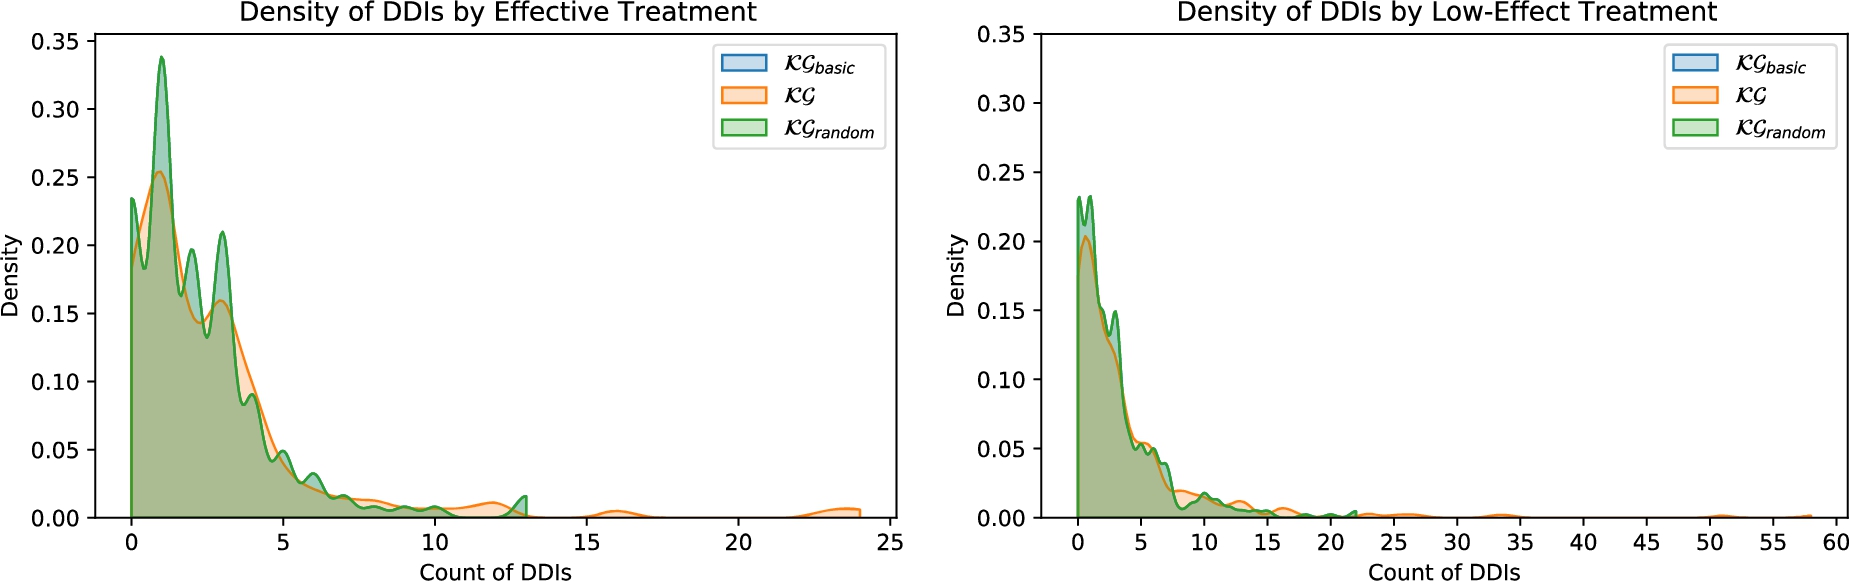
Figure 14 shows the distribution of DDIs by treatment in
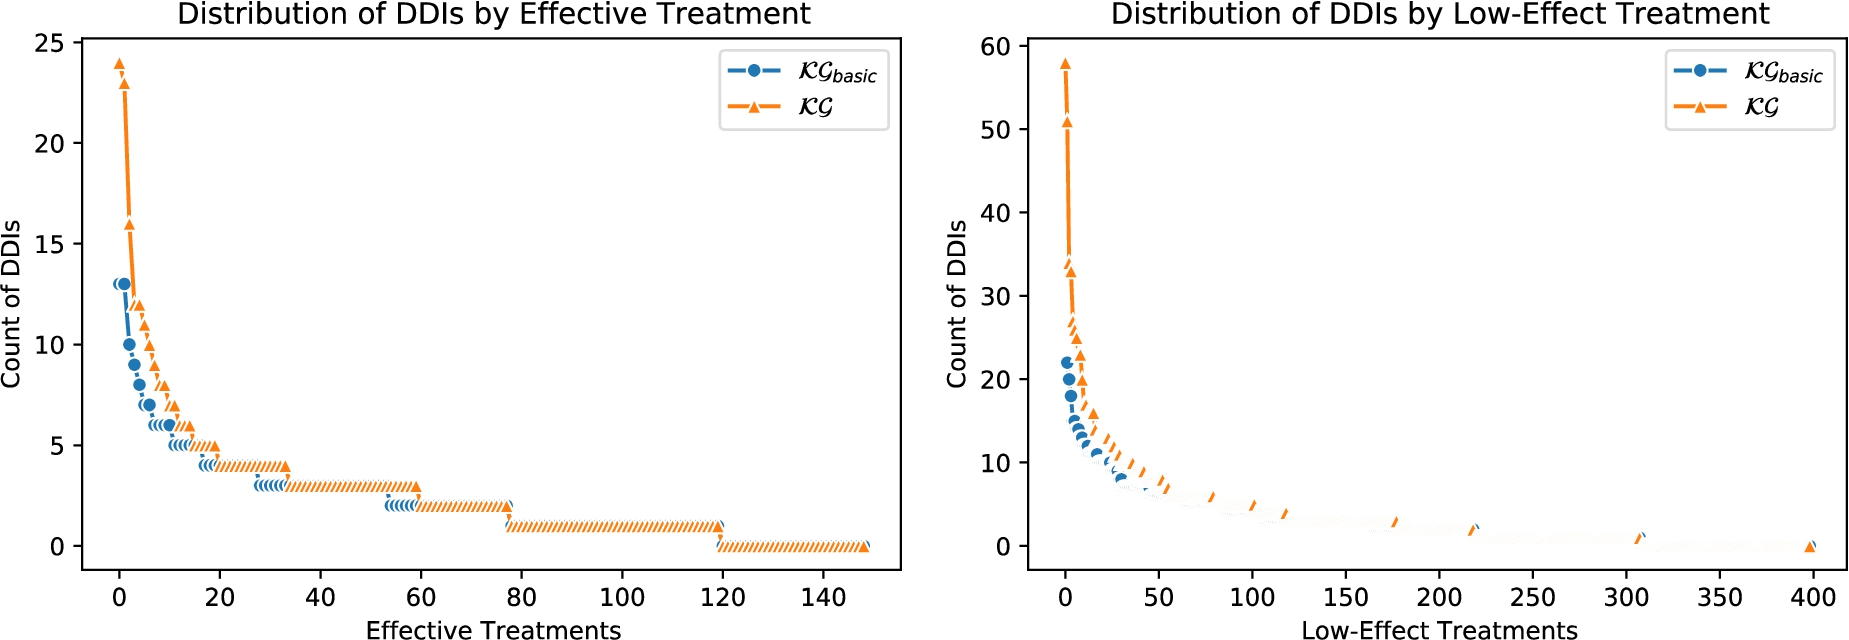
Analysis of deduced DDI by Treatment classes: Fig. 15 exhibits the distribution of DDIs by treatment response in both
Fig. 15.
Distribution of DDIs by treatment response.
6.Related work
6.1.Neuro-symbolic artificial intelligence
Neuro-Symbolic Artificial Intelligence is a highly active area that has been studied for decades [8]. Neuro-symbolic AI focuses on integrating symbolic and sub-symbolic systems. Several approaches employ translation algorithms from a symbolic representation to a sub-symbolic representation and vice versa [3]. The aim is to provide a neuro-symbolic implementation of logic, a logical characterization of a neuro-system, or a hybrid learning system that contributes features of symbolic and sub-symbolic systems [8,38]. Real applications are possible in areas with social relevance and high economic impacts, such as bioinformatics, robotics, fraud prevention, and the semantic web [3]. Methods utilized in neuro-symbolic integration in some of the aforementioned applications include translation algorithms between logic and networks. Also, the community has focused on studying the systems empirically through case studies and real-world applications. An example of a neuro-symbolic system in the field of bioinformatics is the Connectionist Inductive Learning and Logic Programming (CILP) [9]. In the field of vision-based tasks, such as semantic image labeling, high-performance systems have been produced. Karpathy et al. [19] propose an approach introduced for the recognition and labeling tasks for the content of different regions of the images; it combines Convolutional Neural Networks over the image regions together with bidirectional Recurrent Neural Networks over sentences. Once this mapping of images and sentences in the embedding space has been established, a structured objective is introduced that aligns the two modalities through multimodal embedding. The emerging system performs better than classical approaches, where tasks involving semantic descriptions are associated with databases that contain background knowledge, and computer image processing approaches are based on rule-based techniques.
Despite the progress of Neuro-Symbolic Artificial Intelligence, the scope and applicability of symbol processing are limited. Furthermore, these systems do not examine polynomial overload when integrating both paradigms. Our work leverages the symbolic system, independent of the application domain, and improves the predictive precision of KGE models. Moreover, in our approach, the deductive database is addressed to an abstract target prediction which renders the computational complexity polynomial-time. Thus, we show the positive impact on the overall performance of a predictive model implemented using KGEs considering a deductive system.
6.2.Knowledge graph embedding in biomedical field
Knowledge graphs are becoming increasingly important in the biomedical field. Discovering new and reliable facts from existing knowledge using KGE is a cutting-edge method. KG allows a variety of additional information to be added to aid reasoning and obtain better predictions.
Zhu et al. [46] develop a process for constructing and reasoning multimodal Specific Disease Knowledge Graphs (SDKG). SDKG is based on five cancers and six non-cancer diseases. The principal purpose is to discover reliable knowledge and provide a pre-trained universal model in that specific disease field. The model is built in three parts: structure embedding (S) with TransE, TransD, and ConvKB, category embedding (C), and description embedding (D) with BioBERT to convert description annotations into vectors. The best results are obtained when description embedding is combined with structure embedding, specifically with the ConvKB embedding model. Karim et al. [18] propose a new machine-learning approach for predicting DDIs based on multiple data sources. They integrated drug-related information such as diseases, pathways, proteins, enzymes, and chemical structures from different sources into a KG. Then different embedding techniques are used to create a dense vector representation for each entity in the KG. These representations are introduced in traditional machine learning classifiers and a neural network architecture based on a convolutional LSTM (Conv-LSTM), which was modified to predict DDIs. The results show that the combination of KGE and Conv-LSTM performs state-of-the-art results.
The above-mentioned research aims to discover reliable knowledge based on knowledge graphs using KGE models. However, they are limited by the data sparsity issue of the KGE models and the lack of symbolic reasoning. We overcome this limitation by integrating a Neuro-Symbolic AI system, enabling expressive reasoning and robust learning to improve the predictive performance of KGE models.
6.3.Polypharmacy side effect prediction and drug-drug interactions prediction
In recent years, there has been a growing interest in Pharmacovigilance. Extensive research has been conducted to predict potential DDI. One approach to predicting potential DDI is based on similarity [12,36,40,43], with the core idea of predicting the existence of a DDI by comparing candidate drug pairs with known interacting drug pairs. These approaches define a wide variety of drug similarity measures for comparison. The known DDIs that are very similar to a candidate pair provide evidence for the presence of a DDI between the candidate pair drugs. Sridhar et al. [36] propose a probabilistic approach for inferring unknown DDIs from a network of multiple drug-based similarities and known DDIs. They used the probabilistic programming framework Probabilistic Soft Logic. This symbolic approach predicts three types of interactions [36], CYP-related interactions (CRDs), where both drugs are metabolized by the same CYP enzyme, NCRDs, where no CYP is shared between the drugs and general DDI from Drugbank. Furthermore, they considered seven drug-drug similarities. Thus, they found five novel DDIs validated by external sources. A framework to predict DDIs is presented in [12]; they exploit information from multiple linked data sources to create various drug similarity measures. Then, they build a large-scale and distributed linear regression learning model to predict DDIs. They evaluate their model to predict the existence of drug interactions, considering the DDIs as symmetric. A neural network-based method for drug-drug interaction prediction is proposed in [30]. They use various drug data sources in order to compute multiple drug similarities. They computed drug similarity based on drug substructure, target, side effect, off-label side effect, pathway, transporter, and indication data. The proposed method first performs similarity selection and then integrates the selected similarities with a nonlinear similarity fusion method to obtain high-level features. Thus, they represent each drug by a feature vector and are used as input to the neural network to predict DDIs.
Other approaches focus on predicting DDIs and their effects [20,22,32,47]. Beyond knowing that a pair of drugs interact, it is essential to know the effect of DDI in polypharmacy treatments. In [20], propose a novel deep learning model to predict DDIs and their effects. They use additional features based on structural similarity profiles (SSP), Gene Ontology term similarity profiles (GSP), and target gene similarity profiles (TSP) to increase the classification accuracy. The proposed model uses an auto-encoder to reduce the dimension of the resulting vector from the combination of SSP, TSP, and GSP. The benchmark used has 1597 drugs and 188’258 DDIs with 106 different types. The model works as a multi-label classification model where the deep feed-forward network has an output layer of size 106, representing the number of DDI types. The results show that the model obtains equal or better results in 101 out of 106 DDI types than baseline methods. Also, they demonstrate how adding the features GSP and TSP increases the accuracy of DDIs prediction. Marinka Zitnik et al. [47] present Decagon, an approach for predicting the side effects of drug pairs. The approach develops a new convolutional graph neural network for link prediction. They construct a multi-modal graph of protein-protein interactions, drug-protein target interactions, and the DDI side effects. The graph encoder model produces embeddings for each node in the graph. They proposed a new model that assigns separate processing channels for each relation type and returns an embedding for each node in the graph. Then, the Decagon decoder for polypharmacy side effects relation types takes pairs of embeddings and produces a score. Thus, Decagon can predict the side effect of a pair of drugs.
All the approaches mentioned above are limited to predicting DDIs and their effects between pairs of drugs. However, in our view, the interactions and their effects need to be considered as a whole and not in pairs in polypharmacy treatments. Our symbolic system resorts to a set of rules that state the implicit definition of new DDIs generated as a result of the combination of multiple drugs in treatment. Since cancer treatment schemes are usually composed of more than one drug, and patients may have several co-existing diseases requiring additional medications, it is of significant relevance to the deduction of DDIs holistically in a given treatment.
7.Conclusions and future work
This paper addresses the problem of Neuro-Symbolic AI integration, enabling expressive reasoning and robust learning to discover relationships over knowledge graphs. We have presented an approach that integrates symbolic-sub-symbolic systems to enhance the predictive performance of abstract target prediction in KGE models. The symbolic system is implemented by a deductive database defined for an abstract target prediction over a KG. The proposed solution builds the ego networks of the head and tail of the abstract target prediction to deduce new relationships in the ego network; it is able to enhance the ego networks of the abstract target prediction and effectively predict treatment effectiveness. Further, the sub-symbolic system implemented by a KGE model enhances the predictive performance of the abstract target prediction and completes the KG. The performance of the proposed approach is assessed in a knowledge graph for lung cancer to discover treatment effectiveness. Predicting treatment effectiveness is effectively modeled as a link prediction problem, and exploiting DDI Deductive System improves existing embedding models by performing the treatment prediction task. Results of a 5-fold cross-validation process demonstrate that our approach, integrating neuro-symbolic systems, improves the eleven KGE models evaluated. The presented approach using the symbolic system’s reasoning can enhance the ego networks of the abstract target prediction and effectively predict treatment effectiveness. Thus, our work broadens the repertoire of Neuro-Symbolic AI systems for discovering relationships over a KG. As for future work, we envision having a more fine-grained description of the DDIs and a descriptive profile of the patients and improving the model.
Notes
Acknowledgements
Ariam Rivas is supported by the German Academic Exchange Service (DAAD). The authors thank the BIOMEDAS program for training. This work has been partially supported by the EU H2020 RIA funded projects CLARIFY with grant agreement No 875160, EraMed P4-LUCAT No 53000015, and Opertus Mundi GA 870228, as well as the Federal Ministry for Economic Affairs and Energy (BMWi) project SPEAKER (FKZ 01MK20011A). Furthermore, Maria-Esther Vidal is partially supported by Leibniz Association in the program “Leibniz Best Minds: Programme for Women Professors”, project TrustKG-Transforming Data in Trustable Insights with grant P99/2020.
References
[1] | F. Aisopos, S. Jozashoori, E. Niazmand, D. Purohit, A. Rivas, A. Sakor, E. Iglesias, D. Vogiatzis, E. Menasalvas, A.R. Gonzalez, G. Vigueras, D. Gomez-Bravo, M. Torrente, R. Lopez, M.P. Pulla, A. Dalianis, A. Triantafillou, G. Paliouras and M.-E. Vidal, Knowledge graphs for enhancing transparency in health data ecosystems, in: Semantic Web, (2023) , https://www.semantic-web-journal.net/content/knowledge-graphs-enhancing-transparency-health-data-ecosystems-0. |
[2] | M. Ali, H. Jabeen, C.T. Hoyt and J. Lehmann, The KEEN universe: An ecosystem for knowledge graph embeddings with a focus on reproducibility and transferability, 2020, in press. ISBN 978-3-030-30796-7. |
[3] | T.R. Besold, A. d’Avila Garcez, S. Bader, H. Bowman, P. Domingos, P. Hitzler, K.-U. Kühnberger, L.C. Lamb, P.M.V. Lima, L. de Penning, G. Pinkas, H. Poon and G. Zaverucha, Chapter 1. Neural-Symbolic Learning and Reasoning: A Survey and Interpretation1, Neuro-Symbolic Artificial Intelligence: The State of the Art, (2021) . doi:10.3233/faia210348. |
[4] | A. Bordes, X. Glorot, J. Weston and Y. Bengio, A semantic matching energy function for learning with multi-relational data, Machine Learning (2014), 1–30, https://hal.archives-ouvertes.fr/hal-00835282. doi:10.1007/s10994-013-5363-6. |
[5] | A. Bordes, N. Usunier, A. Garcia-Duran, J. Weston and O. Yakhnenko, Translating embeddings for modeling multi-relational data, in: Advances in Neural Information Processing Systems, C.J.C. Burges, L. Bottou, M. Welling, Z. Ghahramani and K.Q. Weinberger, eds, Vol. 26: , Curran Associates, Inc., (2013) , https://proceedings.neurips.cc/paper/2013/file/1cecc7a77928ca8133fa24680a88d2f9-Paper.pdf. |
[6] | A. Bordes, J. Weston, R. Collobert and Y. Bengio, Learning structured embeddings of knowledge bases, in: 25th Conference on Artificial Intelligence (AAAI), San Francisco, United States, (2011) , pp. 301–306, https://hal.archives-ouvertes.fr/hal-00752498. |
[7] | S. Ceri, G. Gottlob and L. Tanca, What you always wanted to know about datalog (and never dared to ask), IEEE Transactions on Knowledge and Data Engineering 1: (1) ((1989) ), 146–166. doi:10.1109/69.43410. |
[8] | A. d’Avila Garcez and L.C. Lamb, Neurosymbolic AI: The 3rd Wave, (2020) , arXiv:2012.05876. |
[9] | A.S. d’Avila Garcez, K. Broda and D.M. Gabbay, Neural-symbolic learning systems – foundations and applications, in: Perspectives in Neural Computing, (2002) . |
[10] | X. Dong, E. Gabrilovich, G. Heitz, W. Horn, N. Lao, K. Murphy, T. Strohmann, S. Sun and W. Zhang, Knowledge vault: A web-scale approach to probabilistic knowledge fusion, in: Proceedings of the 20th ACM SIGKDD International Conference on Knowledge Discovery and Data Mining, KDD’14, Association for Computing Machinery, New York, NY, USA, (2014) , pp. 601–610. ISBN 9781450329569. doi:10.1145/2623330.2623623. |
[11] | H.K.G. Fernlund, A.J. Gonzalez, M. Georgiopoulos and R.F. DeMara, Learning tactical human behavior through observation of human performance, IEEE Transactions on Systems, Man, and Cybernetics, Part B (Cybernetics) 36: (1) ((2006) ), 128–140. doi:10.1109/TSMCB.2005.855568. |
[12] | A. Fokoue, M. Sadoghi, O. Hassanzadeh and P. Zhang, Predicting drug-drug interactions through large-scale similarity-based link prediction, in: The Semantic Web. Latest Advances and New Domains, Springer International Publishing, (2016) . ISBN 978-3-319-34129-3. |
[13] | C. Gutierrez and J.F. Sequeda, Knowledge graphs, Commun. ACM 64: (3) ((2021) ), 96–104. doi:10.1145/3418294. |
[14] | A. Heuvelink, Cognitive models for training simulations, PhD thesis, Vrije Universiteit Amsterdam, 2009, https://research.vu.nl/en/publications/cognitive-models-for-training-simulations. |
[15] | P. Hitzler, A. Eberhart, M. Ebrahimi, M.K. Sarker and L. Zhou, Neuro-symbolic approaches in artificial intelligence, National Science Review 9: (6) ((2022) ), nwac035. doi:10.1093/nsr/nwac035. |
[16] | A. Hogan, E. Blomqvist, M. Cochez, C. D’amato, G.D. Melo, C. Gutierrez, S. Kirrane, J.E.L. Gayo, R. Navigli, S. Neumaier, A.-C.N. Ngomo, A. Polleres, S.M. Rashid, A. Rula, L. Schmelzeisen, J. Sequeda, S. Staab and A. Zimmermann, Knowledge Graphs, ACM Comput. Surv. 54: (4) ((2021) ), 37. doi:10.1145/3447772. |
[17] | G. Ji, S. He, L. Xu, K. Liu and J. Zhao, Knowledge graph embedding via dynamic mapping matrix, in: Proceedings of the 53rd Annual Meeting of the Association for Computational Linguistics and the 7th International Joint Conference on Natural Language Processing (Volume 1: Long Papers), Association for Computational Linguistics, Beijing, China, (2015) , pp. 687–696, https://aclanthology.org/P15-1067. doi:10.3115/v1/P15-1067. |
[18] | M.R. Karim, M. Cochez, J.B. Jares, M. Uddin, O.D. Beyan and S. Decker, Drug-drug interaction prediction based on knowledge graph embeddings and convolutional-LSTM network, in: Proceedings of the 10th ACM International Conference on Bioinformatics, Computational Biology and Health Informatics, BCB 2019, Niagara Falls, NY, USA, September 7–10, 2019, X.M. Shi, M. Buck, J. Ma and P. Veltri, eds, ACM, (2019) , pp. 113–123. doi:10.1145/3307339.3342161. |
[19] | A. Karpathy and L. Fei-Fei, Deep visual-semantic alignments for generating image descriptions, IEEE Transactions on Pattern Analysis and Machine Intelligence 39: (4) ((2017) ), 664–676. doi:10.1109/TPAMI.2016.2598339. |
[20] | G. Lee, C. Park and J. Ahn, Novel deep learning model for more accurate prediction of drug-drug interaction effects, BMC Bioinformatics 20 (2019). doi:10.1186/s12859-019-3013-0. |
[21] | Y. Lin, Z. Liu, M. Sun, Y. Liu and X. Zhu, Learning entity and relation embeddings for knowledge graph completion, in: Proceedings of the AAAI Conference on Artificial Intelligence 29(1), (2015) , https://ojs.aaai.org/index.php/AAAI/article/view/9491. |
[22] | R. Masumshah, R. Aghdam and C. Eslahchi, A neural network-based method for polypharmacy side effects prediction, BMC Bioinformatics 22(385) (2021). doi:10.1186/s12859-021-04298-y. |
[23] | M. Nickel, L. Rosasco and T. Poggio, Holographic embeddings of knowledge graphs, 2015, arXiv:1510.04935. doi:10.48550/ARXIV.1510.04935. |
[24] | M. Nickel, V. Tresp and H.-P. Kriegel, A three-way model for collective learning on multi-relational data, in: Proceedings of the 28th International Conference on International Conference on Machine Learning, ICML’11, Omnipress, Madison, WI, USA, (2011) , pp. 809–816. ISBN 9781450306195. |
[25] | J. Pujara, E. Augustine and L. Getoor, Sparsity and noise: Where knowledge graph embeddings fall short, in: Proceedings of the 2017 Conference on Empirical Methods in Natural Language Processing, EMNLP 2017, Copenhagen, Denmark, September 9–11, 2017, M. Palmer, R. Hwa and S. Riedel, eds, Association for Computational Linguistics, (2017) , pp. 1751–1756. doi:10.18653/v1/d17-1184. |
[26] | R. Ramakrishnan and J.D. Ullman, A survey of deductive database systems, The Journal of Logic Programming 23: (2) ((1995) ), 125–149, https://www.sciencedirect.com/science/article/pii/0743106694000399. doi:10.1016/0743-1066(94)00039-9. |
[27] | A. Rivas, I. Grangel-González, D. Collarana, J. Lehmann and M.-E. Vidal, Unveiling relations in the industry 4.0 standards landscape based on knowledge graph embeddings, in: Database and Expert Systems Applications, (2020) . doi:10.1007/978-3-030-59051-2_12. |
[28] | A. Rivas, I. Grangel-Gonzalez, D. Collarana, J. Lehmann and M.-E. Vidal, Discover relations in the industry 4.0 standards via unsupervised learning on knowledge graph embeddings, Journal of Data Intelligence 2: (3) ((2021) ), 336–347. doi:10.26421/JDI2.3-2. |
[29] | A. Rivas and M.-E. Vidal, Capturing knowledge about drug-drug interactions to enhance treatment effectiveness, in: Proceedings of the 11th on Knowledge Capture Conference, K-CAP’21, Association for Computing Machinery, New York, NY, USA, (2021) , pp. 33–40. ISBN 9781450384575. doi:10.1145/3460210.3493560. |
[30] | N. Rohani and C. Eslahchi, Drug-drug interaction predicting by neural network using integrated similarity, Scientific Reports 9 (2019). doi:10.1038/s41598-019-50121-3. |
[31] | A. Rossi, D. Barbosa, D. Firmani, A. Matinata and P. Merialdo, Knowledge graph embedding for link prediction: A comparative analysis, ACM Trans. Knowl. Discov. Data 15(2) (2021). doi:10.1145/3424672. |
[32] | J.Y. Ryu, H.U. Kim and S.Y. Lee, Deep learning improves prediction of drug-drug and drug-food interactions, Proceedings of the National Academy of Sciences 115: (18) ((2018) ), E4304–E4311. doi:10.1073/pnas.1803294115. |
[33] | A. Sakor, S. Jozashoori, E. Niazmand, A. Rivas, K. Bougiatiotis, F. Aisopos, E. Iglesias, P.D. Rohde, T. Padiya, A. Krithara, G. Paliouras and M. Vidal, Knowledge4Covid-19: A semantic-based approach for constructing a Covid-19 related knowledge graph from various sources and analyzing treatments’ toxicities, J. Web Semant. 75: ((2023) ), 100760. doi:10.1016/j.websem.2022.100760. |
[34] | A. Sakor, K. Singh, A. Patel and M. Vidal, Falcon 2.0: An entity and relation linking tool over Wikidata, in: CIKM’20: The 29th ACM International Conference on Information and Knowledge Management, Virtual Event, Ireland, October 19–23, 2020, M. d’Aquin, S. Dietze, C. Hauff, E. Curry and P. Cudré-Mauroux, eds, ACM, (2020) , pp. 3141–3148. doi:10.1145/3340531.3412777. |
[35] | M.K. Sarker, L. Zhou, A. Eberhart and P. Hitzler, Neuro-Symbolic Artificial Intelligence: Current Trends, (2021) , arXiv:2105.05330. doi:10.48550/ARXIV.2105.05330. |
[36] | D. Sridhar, S. Fakhraei and L. Getoor, A probabilistic approach for collective similarity-based drug-drug interaction prediction, Bioinformatics 32: (20) ((2016) ), 3175–3182. doi:10.1093/bioinformatics/btw342. |
[37] | Z. Sun, Z.-H. Deng, J.-Y. Nie and J. Tang, RotatE: Knowledge graph embedding by relational rotation in complex space, 2019, arXiv:1902.10197. doi:10.48550/ARXIV.1902.10197. |
[38] | Z. Susskind, B. Arden, L.K. John, P. Stockton and E.B. John, Neuro-symbolic AI: An emerging class of AI workloads and their characterization, 2021, CoRR, arXiv:2109.06133. |
[39] | M. Vidal, K.M. Endris, S. Jazashoori, A. Sakor and A. Rivas, Transforming heterogeneous data into knowledge for personalized treatments – a use case, Datenbank-Spektrum 19: (2) ((2019) ), 95–106. doi:10.1007/s13222-019-00312-z. |
[40] | S. Vilar, E. Uriarte, L. Santana, T. Lorberbaum, G. Hripcsak, C. Friedman and N.P. Tatonetti, Similarity-based modeling in large-scale prediction of drug-drug interactions, Nature Protocols 9 (2014). doi:10.1038/nprot.2014.151. |
[41] | Z. Wang, J. Zhang, J. Feng and Z. Chen, Knowledge graph embedding by translating on hyperplanes, in: Proceedings of the AAAI Conference on Artificial Intelligence 28(1), (2014) , https://ojs.aaai.org/index.php/AAAI/article/view/8870. |
[42] | D.S. Wishart, C. Knox, A.C. Guo, S. Shrivastava, M. Hassanali, P. Stothard, Z. Chang and J. Woolsey, DrugBank: A comprehensive resource for in silico drug discovery and exploration, Nucleic Acids Research 34: ((2006) ), 668–672. doi:10.1093/nar/gkj067. |
[43] | P. Zhang, F. Wang, J. Hu and R. Sorrentino, Label propagation prediction of drug-drug interactions based on clinical side effects, Scientific Reports 5 (2015). doi:10.1038/srep12339. |
[44] | S. Zhang, Y. Tay, L. Yao and Q. Liu, Quaternion knowledge graph embeddings, in: NeurIPS, (2019) , pp. 2731–2741, http://papers.nips.cc/paper/8541-quaternion-knowledge-graph-embeddings. |
[45] | Q. Zhao, J. Li, L. Zhao and Z. Zhu, Knowledge guided feature aggregation for the prediction of chronic obstructive pulmonary disease with chinese EMRs, IEEE/ACM Transactions on Computational Biology and Bioinformatics (2022), 1–10. doi:10.1109/TCBB.2022.3198798. |
[46] | C. Zhu, Z. Yang, X. Xia, N. Li, F. Zhong and L. Liu, Multimodal reasoning based on knowledge graph embedding for specific diseases, Bioinformatics 38: (8) ((2022) ), 2235–2245. doi:10.1093/bioinformatics/btac085. |
[47] | M. Zitnik, M. Agrawal and J. Leskovec, Modeling polypharmacy side effects with graph convolutional networks, Bioinformatics 34: (13) ((2018) ), i457–i466. doi:10.1093/bioinformatics/bty294. |

