


Introduction
Microcrystalline quartz occurs ubiquitously in geological environments and is generally classified by compositional and structural features (Graetsch, Reference Graetsch, Heaney, Prewitt and Gibbs1994). Microcrystalline fibrous varieties are called chalcedony and consist of 50–100 nm α-quartz crystallites (Miehe et al., Reference Miehe, Graetsch and Flörke1984; Cady et al., Reference Cady, Wenk and Sintubin1998; Ríos et al., Reference Ríos, Salje and Redfern2001) arranged in a fibre-like texture. Traditionally, chalcedony has been subdivided into two groups (Michel-Lévy and Munier-Chalmas, Reference Michel-Lévy and Munier-Chalmas1892): (1) length-fast chalcedony, showing fibres and with crystallites having their c-axis orientated perpendicularly to the fibre axis (the fibrous ‘chalcedony crystals’ have polysynthetic twinning according to the Brazil-twin law, with the c-axis of quartz fibres twisted about the fibre axis) (Miehe et al., Reference Miehe, Graetsch and Flörke1984; Heaney, Reference Heaney1993) and (2) length-slow chalcedony (or quartzine), with fibres composed of crystallites that have their c-axis orientated parallel to the fibre axis (Schmidt et al., Reference Schmidt, Slodczyk, Léa, Davidson, Puaud and Sciau2013b).
In contrast to macrocrystalline quartz, chalcedony often contains H2O in the range of 1 to 2 wt.%, both as molecular H2O and as silanol groups (Flörke et al., Reference Flörke, Köhler-Herbertz, Langer and Tönges1982). Together with chalcedony, it is common to find a polymorph of silica, called moganite, which exhibits a monoclinic crystal lattice formed by a structure of left and right quartz lamellae, alternating at the unit cell scale (Flörke et al.; Reference Flörke, Jones and Schmincke1976; Miehe et al., Reference Miehe, Graetsch and Flörke1984, Miehe, Reference Miehe1986; Miehe and Graetsch, Reference Miehe and Graetsch1992). The structure has therefore been associated with Brazil-law twin boundaries, as they are found frequently in the quartz crystallites of chalcedony (Miehe et al., Reference Miehe, Graetsch and Flörke1984; Cady et al., Reference Cady, Wenk and Sintubin1998). Moganite is present in chalcedony at 5 to 20 wt.% (Heaney and Post, Reference Heaney and Post1992; Gliozzo, Reference Gliozzo2019).
The most favourable geological settings for the formation of chalcedony are low temperatures and under near-surface conditions (White and Corwin, Reference White and Corwin1961; Cady et al., Reference Cady, Wenk and Sintubin1998). Chalcedony is found typically in sedimentary environments, where it precipitates within rock pore spaces and fractures from percolating silica-rich solutions. Additionally, it can form through hydrothermal activity and in volcanic environments, often filling cavities as a mineral deposit.
Chalcedony has several varieties, based on colour, which have been appreciated and used for making jewellery and ornaments since ancient times. Agate is one of the most famous varieties of chalcedony because of its wide spectrum of colours (white, yellow, red, green and blue) and spectacular banded features (Graetsch, Reference Graetsch, Heaney, Prewitt and Gibbs1994; Gliozzo, Reference Gliozzo2019). It can be regarded as banded chalcedony, which is intergrown or intercalated with other silica phases. Moreover, agate often contains considerable amounts of mineral inclusions and these impurities can form spectacular internal structures or be responsible for the different colouration of agates. The chemical and mineralogical complexity of agate is the result of its formation conditions.
Another variety, much appreciated for its charming apple green colour, is chrysoprase (Caucia et al., Reference Caucia, Marinoni, Ghisoli and Leone2016). It has been used since ancient times (Hatipoğlu et al., Reference Hatipoğlu, Ören and Kibici2011) and its most famous localities of extraction are in Australia (Jiang et al., Reference Jiang, Guo, Zhou, Li and Liu2021). The origin of chrysoprase colour is a controversial topic (Jiang et al., Reference Jiang, Guo, Zhou, Li and Liu2021): some authors believe that the colour can be attributed to the presence of finely dispersed nickel-bearing layered silicate minerals from the stones that usually occur in the chrysoprase deposits, such as willemseite (Eggleton et al., Reference Eggleton, Fitz Gerald and Foster2011) or ‘kerolite’ (Sachanbiński et al., Reference Sachanbiński, Janeczek, Platonov and Rietmeijer2002) and ‘pimelite’ (Čermáková et al., Reference Čermáková, Hradil, Bezdička and Hradilová2017; Jiang and Guo, Reference Jiang and Guo2021), however, the latter two have now been discredited as formal mineral names (Eggleton et al., Reference Eggleton, Fitz Gerald and Foster2011). Others have claimed that the green colour is due to the presence of evenly distributed bunsenite (NiO) crystallites within the gemstone (Jiang and Guo, Reference Jiang and Guo2021).
In 2013, the Greek gem explorer and trader Yianni Melas discovered a new bluish green variety of chalcedony in Africa, which is commercially known as aquaprase (Renfro, Reference Renfro2015). AQUAPRASETM is also a trademark used to distribute and market this bluish green chalcedony. Aquaprase has a translucent transparency, typical of chalcedony, and its natural bluish green colour is inhomogeneous, because of the presence of intense and colourless areas with dark brown inclusions due to a combination of the mineral with the rock matrix.
In this study, we compare the chemical, mineralogical and microstructural features of this new variety of chalcedony (aquaprase) with selected samples of agate and chrysoprase.
Materials
Twenty samples of chalcedony belonging to three different varieties, i.e. aquaprase, chrysoprase and agate, were selected, consisting of both polished cabochon-cut gemstones and roughs. Representative samples are shown in Fig. 1, and details given in Table 1. Aquaprase samples have been labelled as AQ_x, chrysoprase as CR_x and agate as AG_x, respectively, and x refers to the sample number.
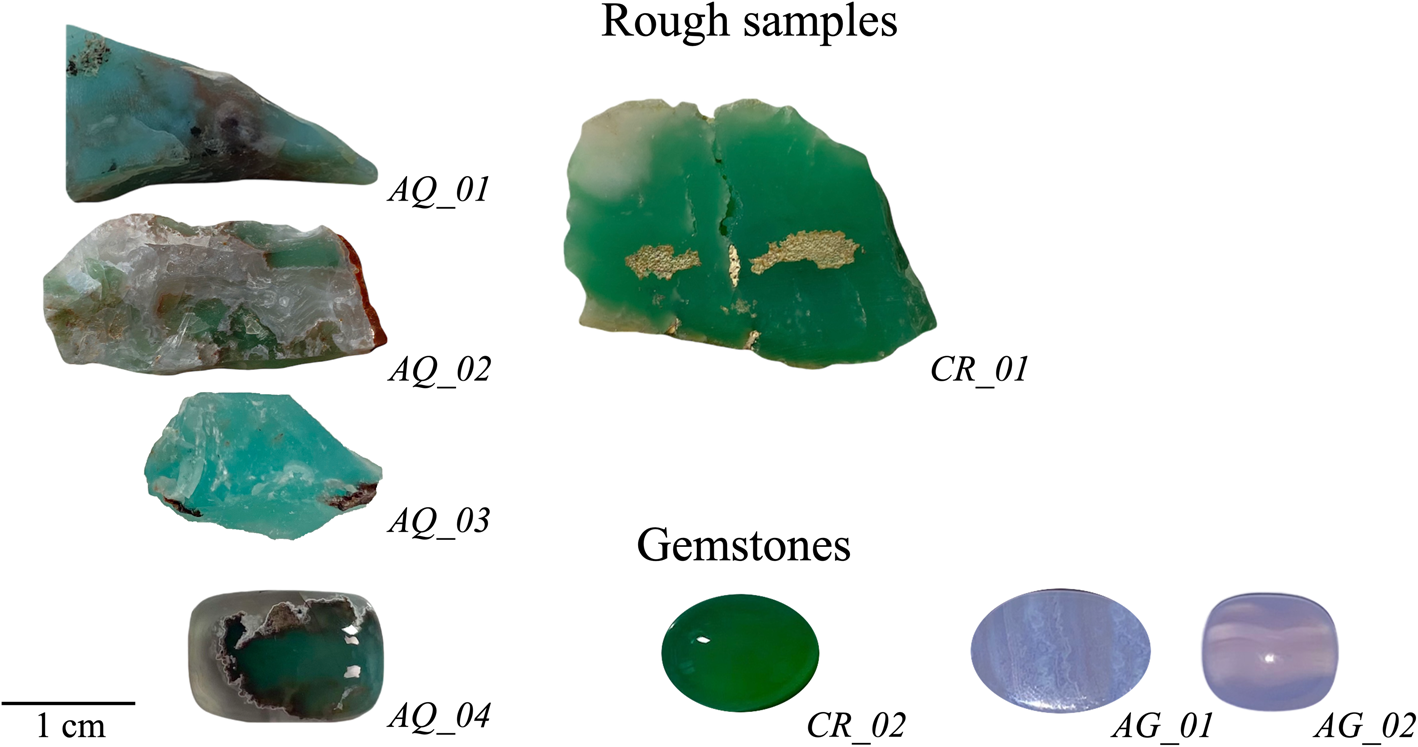
Figure 1. Eight rough and cut gemstone specimens. Aquaprase samples have been labelled as AQ_x, chrysoprase as CR_x and agate as AG_x, respectively, and x refers to the sample number.
Table 1. Chalcedony varieties, provenance and colour of the samples studied.

Experimental methods
Thin sections were studied under a Leitz polarised-light microscope, which was connected to a 51 MP camera. The software Affinity (by Serif (Europe) Ltd, UK) was used to merge photos and create overviews of the samples.
Laboratory powder X-ray diffraction (XRD) data were collected at the Department of Earth Sciences of the University of Milan, Italy, with a Panalytical X'Pert-PROMPD X'Celerator powder X-ray diffractometer, using CuKα radiation (λ = 1.5406 Å), at a beam voltage of 40 kV and a current of 40 mA. Bragg-Brentano diffraction patterns were collected over the 10–60° range of the scattering angle 2θ, with steps of 0.01°2θ and a counting time of 40/60 s per step.
To overcome the main drawbacks of the laboratory XRD experimental set up, such as strong peak overlapping (i.e. moganite vs quartz), peak broadening, and preferred orientation, high-resolution synchrotron powder X-ray diffraction was undertaken, thus allowing detection of minor phases together with a more reliable quantitative phase analysis. The high-resolution synchrotron XRD experiments were performed at beamline ID22 of the European Synchrotron Radiation Facility (Grenoble, France), using a Debye-Scherrer configuration with a wavelength of λ = 0.35456Å, selected by a double-crystal Si (111) monochromator. Samples were loaded in borosilicate glass capillaries (diameter = 2 mm), spinning during data collection. The overall measuring time per sample was 100 min, to obtain very good statistics over the angular 1.0–37.9° in 2θ, or over the interplanar distance range from 20 to 0.5 Å. The data from the monochromator Multi-Analyser Si (111) Stage, coupled with the nine scintillation detectors, were normalised and summed to a 0.002° step size with local software to produce the final raw data.
The Rietveld full profile fit of the XRD patterns was performed using MAUD software (Lutterotti et al., Reference Lutterotti, Bortolotti, Ischia, Lonardelli and Wenk2007; Saville et al., Reference Saville, Creuziger, Mitchell, Vogel, Benzing, Klemm-Toole, Clarke and Clarke2021). Unit cell parameters, zero shift error, crystallite size, microstrain, individual scale factor and a background function (Chebyshev polynomial, three terms) were refined. The refinement of the above-mentioned parameters was performed till an improvement of the fitting was observed. Crystal structural models used are listed below, from the open-access Crystal Open Database (COD) (Gražulis et al., Reference Gražulis, Daškevič, Merkys, Chateigner, Lutterotti, Quirós, Serebryanaya, Moeck, Downs and Le Bail2012): quartz (I, II, III) (ref. COD: 2300370) (Lignie et al., Reference Lignie, Granier, Armand, Haines and Papet2012); moganite (ref. COD: 9002648), (Heaney and Post, Reference Heaney and Post2001); palygorskite (ref. COD: 1533365), (Chiari et al., Reference Chiari, Giustetto and Ricchiardi2003); pyrophyllite (ref. COD:1011153) (Gruner, Reference Gruner1934); phlogopite (ref. COD: 9000111) (Steinfink, Reference Steinfink1962); and willemseite (ref. COD: 8104532) (De Waal, Reference De Waal1970).
Micro-Raman spectroscopic analysis was carried out on thin sections, at the Department of Earth Sciences of the University of Milan, Italy, using a high-resolution confocal micro-Raman system (LabRam HR Evolution-Horiba system), attached to an Olympus petrographic microscope, with a green Nd-YAG laser source (with a wavelength of 532 nm and power of 100 mW), with very low frequency filters (ULF) and a 1 μm spot.
Electron microprobe analyses in wavelength-dispersive mode (EMPA–WDS) were performed on thin sections, at the Department of Earth Sciences of the University of Milan, Italy, using a JEOL JXA-8200 EMP–WDS, with an accelerating voltage of 15 kV, a beam current of 5 nA, and counting times of 30 s on the peak and 10 s on the background. Concentrations of Si, Al, K, Na, Mn, Mg, Ca, Ti, Ni, Zn and Fe were measured. Raw data were corrected for matrix effects using a conventional ΦρZ routine in the JEOL software package (version 3.50).
The samples were analysed using laser ablation inductively coupled plasma mass spectroscopy (LA–ICP–MS) at the Laboratory of Geochemistry, Geochronology and Isotopic Geology (LASA labs) of the University of Milan. The instrument at the LASA Labs consisted of a Teledyne Analite Excite Excimer laser (air-cooled excimer laser with 193 nm ultra-short pulse) coupled to a Thermo Scientific ICP–MS iCAP RQ single quadrupole. The spot size was 65 μm, using Nist612 glass as an external standard and 29Si as an internal standard, as analysed by EMPA–WDS. Precision and accuracy estimated on the USGS basaltic glass standard BCR2 and NIST612 were better than 10%.
Chemical characterisation at the nanoscale of the samples was carried out using a FEI Tecnai F20 Field Emission Gun (FEG) microscope, working at accelerating voltage of 200 kV, available at the Transmission Electron Microscopy Laboratory of the Department of Earth Sciences “Ardito Desio” at the University of Milan. The instrumentation includes an S-Twin system lens that provides a point resolution of 0.24 nm and an energy dispersive X-ray spectrometer (EDS) with an ultra-thin window. The imaging system consists of a 626 Gatan CCD tv rate camera and a 794 Gatan slow scan camera. The detectors are embedded in the microscope control unit, and the sample holder is dual-tilt. The technical specifications of the instrumentation include: a point resolution (nm) of 0.24 and a line resolution (nm) of 0.1; an information limit (nm) of 0.15, a focal length (mm) of 1.7 and a magnification from 25× to 1030 k×.
Results
Optical microscopy
Significant differences in the microstructure of the three chalcedony varieties were found using optical microscopy on the thin sections (Figs 2–4).

Figure 2. Optical micrographs: (a) panoramic picture of the AQ_01 aquaprase sample; and (b) details: fibrous quartz between cryptocrystalline and microcrystalline quartz (XPL, grey scale).
Mineral abbreviations (Warr, Reference Warr2021): MQz: macrocrystalline quartz; mQz: microcrystalline quartz; cQz: cryptocrystalline quartz; fQz: fibrous quartz; incl: inclusions.

Figure 3. Optical micrographs. Details of the AQ_01 aquaprase sample: (a) length-fast spherulitic chalcedony in the cryptocrystalline quartz matrix (XPL, grey scale); (b) + gypsum plate.

Figure 4. Optical micrographs. (a) A panoramic picture of the CR_01 chrysoprase sample and (b) a panoramic picture of the AG_01 agate sample (XPL, grey scale).
In aquaprase, the two areas visible to the naked eye and corresponding (1) to the cloudy inhomogeneous bluish green zone and (2) to the colourless zone, exhibit different silica microstructural features in terms of grain size (from macro to crypto) and morphology (from fibrous to granular). In the former area, cryptocrystalline quartz is predominant and the nano-size of the crystals means they can not be detected individually, thus resulting in a unique mass in which linear and diagonally orientated growth of quartz and spherulites of length-fast chalcedony are observed (Figs 2, 3). Using a gypsum plate, typical interference colours of length-fast chalcedony are observed showing yellow-orange colour in fibres orientated in the NE–SW direction and blue in fibres with the NW–SE direction (crystals that are elongated parallel to their fast direction have a negative sign of elongation) (Fig. 3b). These colours would occur in the opposite directions for the length-slow chalcedony/quartzine fibres, with a positive sign of elongation. At the border between colourless and bluish green zones, bands of length-fast chalcedony in a wall-lining, with a circular shape and with smooth boundaries between nucleation centres and the cryptocrystalline mass of quartz, can be observed. Straight boundaries are evident between the adjacent growth of chalcedony (Fig. 2b). In the colourless area, microcrystalline quartz aggregates predominate with inhomogeneous grain size and different orders of magnitude in size. Length-fast chalcedony bands with a straight boundary between chalcedony quartz growths can be observed while a modest quantity of quartz macrocrystals is found in some areas (Adams et al., Reference Adams, MacKenzie and Guilford1984; Gliozzo et al., Reference Gliozzo, Cairncross and Vennemann2019). The transition from fibrous chalcedony to quartz crystals is smooth (Fig. 2).
The chrysoprase variety consists of crypto- to microcrystalline quartz crystals (Fig. 4a). No microstructural zoning is observed, a modest presence of macro crystals of quartz is easily observable in some areas of the micro- and cryptocrystalline aggregate. Inclusions with an opaque and dark appearance under crossed Nicols are finely dispersed within the SiO2 matrix.
The agate variety displays bands of varying colour intensity (Fig. 4b) characterised by quartz crystals with a distinct grain size. Bands with less intense colouration are composed primarily of granular macrocrystalline quartz. Specifically, the macrocrystals have micrometre-sized lamellae, due to the episodic stages of crystal growth, typical of the so-called ‘Bambauer quartz’ (Bambauer et al., Reference Bambauer, Brunner and Laves1961; Conte et al., Reference Conte, Della Ventura, Rondeau, Romani, Cestelli Guidi, La, Napoleoni and Lucci2022) and a feathery aspect at the margins of quartz grains (Adams, Reference Adams1920; Dong et al., Reference Dong, Morrison and Jaireth1995). Granular quartz occurs with different orders of magnitude in size and exhibits undulose extinction (Adams et al., Reference Adams, MacKenzie and Guilford1984), related to the granules being polycrystalline (Adams et al., Reference Adams, MacKenzie and Guilford1984), denominated strained quartz (Jóźwiak-Niedźwiedzka et al., Reference Jóźwiak-Niedźwiedzka, Gibas and Glinicki2017). This aspect is particularly evident in larger crystallites in the upper right area of Fig. 4b. On the other hand, at the microstructural level, the bands with more intense colour are characterised by a predominance of microcrystalline and macrocrystalline quartz, significantly smaller in size than the bands with less intense colouring. In general, quartz grains also present a mosaic texture with highly irregular and interpenetrating grain boundaries (Dong et al., Reference Dong, Morrison and Jaireth1995).
Powder X-ray diffraction
The laboratory powder XRD patterns of samples AQ_02, CR_01 and AG_02 are shown in Fig. 5. The results show typical chalcedony diffraction patterns characterised by α-quartz peaks and, in the case of chrysoprase and aquaprase varieties, the contribution of moganite.

Figure 5. X-ray diffraction of powdered chalcedony samples. From top to bottom: aquaprase (bluish green and colourless fractions), chrysoprase and agate.
The results on a different colour area of the aquaprase samples showed no differences in their mineralogical composition. On the contrary, the different Full Width at Half Maximum (FWHM) of the (101) diffraction peak of quartz suggests a slightly higher crystallinity of quartz in the colourless fraction compared to the bluish green one (Fig. 6).

Figure 6. Comparison between the quartz peak (101) of the bluish green fraction (top) and of the colourless fraction (bottom) of the aquaprase sample AQ_02.
The results obtained through the Rietveld Quantitative Phase Analysis (RQPA) using the MAUD software on a series of chalcedony samples are reported in Table 2. In aquaprase samples (AQ_02 and AQ_03), the high-resolution synchrotron XRD data revealed the presence of minor phases, such as palygorskite, pyrophyllite and phlogopite, and also highlights the presence of three quartz varieties, hereafter labelled as quartz I, II and III, associated with moganite (Fig. 7). Quartz I is a good fit to the main peak at 26.7°2θ, whereas quartz II and quartz III match the two peaks at lower and higher 2θ angles, respectively, giving rise to an asymmetry of the main diffraction peak. Quartz II and III – which are characterised by lower crystal size – represent between 58 wt.% and 68 wt.% of the crystalline phases in bluish green aquaprase samples and differ by the length of the unit cell edges: quartz II has a higher a value and a lower c value (fitting the left-most part of the peak), whereas quartz III has a lower a value and a higher c value (fitting the right-most part of the peak) (Fig. 7). Quartz I has intermediate unit cell parameters with the largest crystal size and represents <10 wt.% of the bluish green aquaprase samples. In the colourless aquaprase material, the weight fractions of quartz II and quartz III decrease, whereas that of quartz I reaches 42 wt.% (Table 2), in agreement with the sharper aspect of the main quartz peak observed by laboratory powder XRD analysis (Fig. 6). Moganite, found in both colourless and bluish green aquaprase material, ranges from 22 wt.% to 30 wt.%. The synchrotron radiation results agree with observations from optical microscopy, confirming the presence of more than one variety of quartz distinguishable by grain size and morphology, and characteristic of the coloured and colourless areas of the aquaprase (Fig. 2).
Table 2. Results obtained from Rietveld refinement of the diffraction patterns of aquaprase, chrysoprase and agate samples, using MAUD software.

* Rexp: R-expected, Rwp: R-weighted patten, Rb: R-profile, GOF: Goodness of Fit; as defined in MAUD.
**Microstrain is a dimensionless parameter, as defined in MAUD, due to the magnitude of dislocations, vacancies, defects and chemical impurities affecting the crystal structure. The peak broadening due to microstrain varies as: βfG = 4ε⸱tanθI (where βfG is the integral breadth for the Gaussian component of the sample broadening and ε is the rms microstrain)
‘–’ = not determined

Figure 7. MAUD software interface: main quartz diffraction peaks (101) and (100) and moganite peak (011) in the aquaprase pattern. Only by using three varieties of quartz (with different degree of crystallinity and unit cell parameters) and moganite, it is possible to obtain the best fit of the aquaprase pattern.
High-resolution synchrotron XRD analysis on the chrysoprase samples confirmed the laboratory XRD results, revealing that the CR_01 sample is composed of quartz and moganite.
High-resolution synchrotron XRD results on agate sample AG_02 showed the highest degree of crystallinity compared to the other chalcedony varieties investigated. The XRD pattern on the same AG_02 was fitted using two quartz phases, having similar cell parameter values: one with higher average crystal size and the other with lower size. The Rietveld full-profile fit, using only one quartz variety, was unable to reach a high-quality fitting. These results agree with the optical observations that revealed the presence of two varieties of quartz with different crystallinity (Fig. 4b).
Micro-Raman spectroscopy
Raman spectra revealed the presence of the two silica polymorphs, α-quartz and moganite, in the samples of the three gem varieties of chalcedony (Fig. 8). Due to the similar crystal structure of these two phases, their Raman spectra show several signal overlaps. They are usually distinguished by the position of the signal related to the main Si–O–Si bending vibration, at 465 cm–1 and 501 cm–1 for α-quartz and moganite, respectively (Kingma and Hemley, Reference Kingma and Hemley1994; Heaney et al., Reference Heaney, McKeown and Post2007). The full Raman spectrum file (from 150 to 950 cm–1) of the chalcedony sample has been deposited and is available as Supplementary material (see below).

Figure 8. Normalised Raman spectra detail of the AQ_01 aquaprase sample, CR_01 chrysoprase sample and AG_01 agate (400-700 cm–1), with the main signals of quartz and moganite.
The normalised spectra (to the quartz most intensive peak) show a higher relative intensity of the main moganite peak in the aquaprase variety than in the chrysoprase and agate varieties. At first instance, this difference could be interpreted as a sign of a higher concentration of moganite in the new chalcedony variety, although changes in the peak intensity at 501 cm–1 may also originate from the different content of Si(OH) groups and, therefore, quantitative phase analysis of moganite by vibrational spectroscopy should be carried out carefully (Schmidt et al., Reference Schmidt, Bellot-Gurlet, Léa and Sciau2013a).
In the Raman spectrum of chrysoprase, the peak observed at 675 cm–1 is ascribable to the willemseite phase which, as mentioned above, is a common inclusion and the cause of the intense apple-green colouration of this chalcedony variety (Majumdar et al., Reference Majumdar, King, John, Kusebauch and Putnis2014). According to Eggleton et al. (Reference Eggleton, Fitz Gerald and Foster2011), despite the importance of willemseite as a colouring agent in chrysoprase, it usually occurs as small and scattered inclusions with an average concentration of ~5 wt.%. This low value may explain the weak relative intensity of its signal in the Raman spectrum.
Electron microprobe analysis
Back-scattered electron images of the aquaprase variety confirm the microstructure observed by optical microscopy on the coloured and colourless areas (Fig. 9a compared to Fig. 2a). Compositional point analyses on different samples of aquaprase, chrysoprase and agate gave a dominant SiO2 composition with low contents of other elements, except for chrysoprase, which contained variable NiO (up to 5 wt.%) in the brighter zones shown in Fig. 9b. The calculated stoichiometric formulas, based on 2 oxygen atoms per formula unit (apfu), show lower silicon contents and the presence of other elements such as Al, Na, K and Mg in the coloured areas with the microcrystalline aspect of aquaprase, and no compositional variations corresponding to the typical banded zones of agates (Fig. 9c), which show the lowest content both of minor and trace elements. Compositions of the different samples are reported in Table 3.

Figure 9. BSE images of (a) AQ_01, (b) CR_01 and (c) AG_01. Scale bar corresponds to 200 μm.
Table 3. Selected compositional formulas, based on the electron microprobe analyses, of different samples (calculated on 2 oxygen apfu).

‘–’ = not detected
Compositional maps of Ni and Mg in CR_01 are shown in Fig. 10, which support the hypothesis of Eggleton et al. (Reference Eggleton, Fitz Gerald and Foster2011) on the content of Ni and Mg in chrysoprase, potentially ascribable to the presence of willemseite, (Ni,Mg)3Si4O10(OH)2), occurring as 30–100 nm-wide zones, largely aligned on polycrystalline quartz grain boundaries.

Figure 10. Element distribution maps of CR_01 chrysoprase sample: (a) BSE image; (b) Ni content; and (c) Mg content. Scale bar corresponds to 100 μm.
Laser ablation inductively coupled plasma mass spectrometry
The trace-element composition investigated by LA-ICP-MS of aquaprase (at bluish green and colourless areas), apple green chrysoprase and light-blue banded agate are reported in Table 4 (trace-element values detected in concentrations ≥ 1 ppm).
Table 4. Average trace-element composition (ppm) as detected by LA-ICP-MS of aquaprase (3 samples), chrysoprase (2 samples) and agate (2 samples) investigated.

bdl: below detection limit
The aquaprase variety is characterised by significant concentrations of Mg and Al, particularly in the bluish green areas (with a maximum of 12,300 ppm and 9460 ppm, respectively). High concentrations of Ca and significant values of Na and K were also revealed. These two latter elements have relatively constant values in the different coloured areas of the samples (with a maximum of 4450 ppm, 1820 ppm and 2750 ppm, respectively). Regarding the chromophore elements, Cr has the highest concentrations (with a maximum of 2700 ppm), followed by Fe (1750 ppm) and Ni (536 ppm), which are significantly higher in the bluish green areas of the samples. High concentrations of Ti (with a maximum of 2660 ppm) were measured in the colourless areas of the samples. Finally, chemical analysis also revealed the presence of U in concentrations as low as a few parts per million (with an average of 1 ppm) and with slightly higher values in the colourless areas of the samples, where it reaches a maximum of 5 ppm.
Analyses performed on the visible brown and opaque inclusions in the aquaprase samples revealed high concentrations of Ca, Ti and Fe (with maximum values of 17,100 ppm, 7700 ppm and 2890 ppm, respectively).
A positive correlation was observed among the trends of the main elements (Fig. 11). It is particularly evident between Al and Mg and between Al and Cr. This positive linear correlation is proven by the R 2 value of the linear function describing the trends, (R 2 = 0.983 and R 2 = 0.907 respectively) (Fig. 11a). Regarding the relationship among the trends of the chromophores, the positive correlation is evident for Cr and Ni (R 2 = 0.923) while not between Cr and Fe (R 2 = 0.612) (Fig. 11b). The chemical characterisation at the nanoscale of the aquaprase samples, performed by TEM confirmed the results obtained by LA-ICP-MS investigation. The main trace elements, Al, Mg, Na, K, are revealed simultaneously and almost ubiquitously. As for chromium, the main chromophore element, EDS analysis revealed its presence concurrently with the other mentioned trace elements and Fe and Ni, even if it is found locally in isolated points of analysis, rather than diffusely.

Figure 11. Correlation among main elements revealed in the aquaprase variety (> 1 wt. ppm): (a) Al vs Mg and Al vs Cr; (b) Cr vs Fe and Cr vs Ni.
The chrysoprase variety shows prominent Ni concentrations (average 8450 ppm, with a maximum of 17,500 ppm) and significant concentrations of Mg, Ca and Na were also revealed.
The agate variety shows an overall pure and homogeneous chemical composition, with low concentrations of Ca (109–405 ppm), Na (25–306 ppm) and the only chromophore element Fe (8–54 ppm).
Discussion
In this research, we conducted a comprehensive characterisation of three commonly utilised chalcedony varieties in gemmology: aquaprase, agate and chrysoprase. Specifically, we focused on a detailed examination of the mineralogical, chemical, and microstructural attributes of aquaprase, which represents a novel chalcedony variety distinguished by its colour inhomogeneity. In aquaprase, the complex mineralogical assemblage characterised by three varieties of stable (α-quartz) and one metastable (moganite) silica phases and their morphologies (i.e. fibrous, granular, crypto-, micro- and macrocrystalline) is the result of formation processes and the following recrystallisation phenomena of silica, which form metastable phases, with high solubility and low structural order, turned into macrocrystalline and stable phases with low solubility and high structural order (Gliozzo, Reference Gliozzo2019; Moxon and Palyanova, Reference Moxon and Palyanova2020). Compositional variations in aquaprase exhibit correlations with the structural ones and affect the colouration of this variety of chalcedony.
The high concentration of Al found ubiquitously in aquaprase samples could be related to the substitution of Si by Al in the crystal structure of quartz. Aluminium is the most frequent trace element in quartz, occurring at levels of up to a few thousand ppm, due to its common presence in the Earth's crust and the similar ionic radii of Si4+ and Al3+ (Götze, Reference Götze2009). Na+ and K+ can be found as extra-framework populations in the structure of quartz, offsetting the charge of trivalent substituent ions (such as Al3+), but they are also commonly hosted by characteristic mineral micro-inclusions. Given the high concentration values of Al and Mg and their strong positive correlation, it is probable that their contribution is also caused by the presence of mineral inclusions (e.g. minor phases observed throughout the X-ray diffraction analysis, such as palygorskite). The same happens with the high calcium contents that suggest the presence of inclusions. Chemical analysis of the trace elements showed that the cause of the bluish green colouration of aquaprase is the chromophore element Cr, which is consistently present in significant amounts in the coloured areas of all samples (reaching a maximum of 2703 ppm). Chromium could be found in the form of ions Cr3+ in a proper extra-framework site of the crystal structure of quartz, but due to the Cr ion size and its high concentration in the samples, it seems more reasonable that this element is characteristic of nano inclusions (Hyrsl, Reference Hyrsl1999). In particular, the strong positive correlation between Cr and Ni suggests that these inclusions could be Ni–Cr bearing minerals (e.g. spinel).
Regarding the Fe concentration, its presence is related to the numerous dark, opaque inclusions, probably in the form of iron oxides.
Titanium is one of the elements for which the substitution Ti4+ ⇄ Si4+ has been demonstrated (Götze, Reference Götze2009). The ionic radius of Ti4+ is relatively large, which leads to its preferential incorporation into the marginal parts of crystals (Götze and Plötze, Reference Götze and Plötze1997). Nevertheless, the significant concentration of this element could be due to the presence of inclusions, such as Ti-oxide (e.g. rutile) or Fe–Ti-oxide (e.g. ilmenite).
Uranium is found frequently in chalcedony and opal as the uranyl ion bonded to H2O molecules, as noted by Modreski (Reference Modreski1987) and Götze et al. (Reference Götze, Gaft and Möckel2015). Its presence is associated primarily with the transportation of chemical elements (such as Al, Ca, Fe, K, Na and B) during late volcanic and post-volcanic alteration processes, consequently accumulating during the process of chalcedony formation. The presence of uranium causes a green fluorescence effect visible at concentrations of U even below 1 ppm (I. Adamo, pers. comm.).
The chrysoprase variety exhibits a more homogeneous chemical and mineralogical composition and microstructural setting; the intense apple-green colouration is due to the presence of nickel phyllosilicate inclusions. The high concentration of Ni revealed is consistent with the occurrence of Ni-bearing layered silicate minerals (Eggleton et al., Reference Eggleton, Fitz Gerald and Foster2011), confirming the presence of willemseite, highlighted by micro-Raman spectroscopy, and dispersed irregularly in the silica aggregate.
Finally, the banded appearance, typical of Turkish agate, is not related to trace/minor chromophore elements (iron in particular), but rather to the different grain size and morphology of quartz crystals, as also suggested by Lorenzi et al. (Reference Lorenzi, Zullino, Gagliardi, Prosperi, Paleari and Adamo2022).
In conclusion, this study demonstrates that the distinct colouration observed in the three different varieties of chalcedony cannot be attributed exclusively to a single cause, such as the presence of chromophores. Instead, it is probably the result of a combination of several features, such as chromophores, inclusion or microstructure. Only through a multidisciplinary approach can these factors be brought to light and thoroughly understood. In particular, by integrating mineralogical, chemical, microstructural analyses, a comprehensive understanding of the intricate processes and elements influencing the colours exhibited by aquaprase, agate and chrysoprase is highlighted. This approach is essential to unravel the complexities behind the visual appeal of these gemstones and to advance our knowledge in the field of gemmology.
Acknowledgements
We acknowledge the European Synchrotron Radiation Facility (ESRF) for the provision of synchrotron radiation facilities, and we thank the staff for assistance and support in using beamline ID22. The authors also thank prof. Rosangela Bocchio for her suggestions. Funding for this research was provided by: Italian Ministry of Education (MIUR) (PRIN2017 - Mineral reactivity, a key to understand large-scale processes: award No. 2017 L83S77) and “Dipartimenti di Eccellenza 2023–2027 – “Le Georisorse per la transizione ecologica e lo sviluppo territoriale”.
Supplementary material
The supplementary material for this article can be found at https://doi.org/10.1180/mgm.2023.92.
Competing interests
The authors declare none.


 Open access