
Functional Framework for Multivariant E-Commerce User Interfaces

Faculty of Management, Wroclaw University of Science and Technology, 50-370 Wroclaw, Poland
J. Theor. Appl. Electron. Commer. Res. 2024, 19(1), 412-430; https://doi.org/10.3390/jtaer19010022
Submission received: 16 January 2024
/
Revised: 13 February 2024
/
Accepted: 13 February 2024
/
Published: 16 February 2024
Abstract
:Modern e-businesses heavily rely on advanced data analytics for product recommendations. However, there are still untapped opportunities to enhance user interfaces. Currently, online stores offer a single-page version to all customers, overlooking individual characteristics. This paper aims to identify the essential components and present a framework for enabling multiple e-commerce user interfaces. It also seeks to address challenges associated with personalized e-commerce user interfaces. The methodology includes detailing the framework for serving diverse e-commerce user interfaces and presenting pilot implementation results. Key components, particularly the role of algorithms in personalizing the user experience, are outlined. The results demonstrate promising outcomes for the implementation of the pilot solution, which caters to various e-commerce user interfaces. User characteristics support multivariant websites, with algorithms facilitating continuous learning. Newly proposed metrics effectively measure changes in user behavior resulting from different interface deployments. This paper underscores the central role of personalized e-commerce user interfaces in optimizing online store efficiency. The framework, supported by machine learning algorithms, showcases the feasibility and benefits of different page versions. The identified components, challenges, and proposed metrics contribute to a comprehensive solution and set the stage for further development of personalized e-commerce interfaces.
1. Introduction
Adaptive user interfaces (AUIs) are defined as user interfaces that can change according to user activities [1]. They are designed to adapt to the needs of individual users or groups of users based on their preferences, behavior, and context [2]. These interfaces provide an optimal user experience by adapting interface elements, including layout, content, and functionality, to align with users’ needs and goals. In today’s digital world, where users interact with a wide range of devices and platforms, each with different capabilities and limitations, AUIs play a crucial role in ensuring a sophisticated and personalized user experience (UX) [3]. This approach fosters consistency and personalization across devices, thereby elevating user engagement, satisfaction, and productivity. However, it is essential to acknowledge certain limitations, particularly in situations that involve repetitive or familiar user experiences [4]. This problem can also occur with new e-commerce customers who are unfamiliar with the site’s structure, navigation, or products [5]. In such cases, the creation of a dedicated interface variant for this specific user group can encourage prolonged site engagement and facilitate continued shopping.
Web-based systems, including e-commerce solutions, can benefit from personalized user interfaces that automatically adapt their presentation, content, and structure based on user characteristics, needs, or preferences [6]. AUIs offer numerous advantages over nonpersonalized systems. They enhance usability and effectiveness by adjusting to the user’s expertise level, providing relevant guidance and feedback. Additionally, AUIs reduce cognitive load, minimizing user fatigue and the likelihood of errors. The provision of pertinent, personalized information further contributes to an improved UX, ultimately boosting user satisfaction and motivation [4]. However, the design and implementation of such a solution can be a complex task requiring the application of interdisciplinary knowledge [7].
While there are various approaches to creating adaptive user interfaces, one of the most effective appears to be the use of artificial intelligence (AI)-based clustering to divide clients into groups and provide those groups with a dedicated interface [8]. AI clustering is a technique that groups similar data points (e.g., e-commerce customers) based on certain characteristics. In the context of e-commerce user interfaces, clustering can consider actions, events, purchases, and other relevant factors [9]. By implementing AI clustering, companies can tailor different versions of the user interface for each cluster, ensuring that every customer enjoys an optimized browsing and shopping experience.
Today, e-shops commonly use various mechanisms for product recommendations that rely on advanced data analysis, including AI [10], but there is also considerable potential in AI-assisted user interface personalization.
To implement the AUI concept using machine learning (ML) mechanisms, it is crucial to establish an architectural and functional framework. This framework should efficiently collect customer behavior data, process it while considering the business context, and translate resulting recommendations into the final user interface design. Despite the prevalence of studies on various approaches to generating recommendations in e-commerce [11,12], it is challenging to find comprehensive research on personalizing user interface design. Existing studies, such as those on product recommendation systems, primarily focus on personalized content like lists of recommended products rather than addressing the website layout (e.g., the location of components on the website).
The research was driven by the identified business problem of failing to meet the needs of different groups of e-commerce customers. Online shops have to make many compromises when designing the user interface, which can have a negative impact on the satisfaction of those customer groups whose needs have been overlooked. The solution may be to design multiple user interface variants, but such implementations are not popular, so there is a lack of research on their rationality and practicality. This is the research gap addressed in this paper.
The main contributions of this article include (1) the proposal of a framework containing components for the implementation of a comprehensive solution serving a multivariant UI in an online shop, (2) the introduction of a partial conversion rate () indicator to allow flexible analysis of changes in customer behavior after the deployment of UI variants, and (3) the experimental verification of the impact of a set of modifications to the UI variant served to a selected group of customers.
The research presented in this paper encompasses both theoretical and practical dimensions, serving as an extension of prior work on adaptive user interfaces for information systems. It aligns with the broader trend towards data-driven personalization, particularly in e-commerce. While existing product recommendation systems have partially addressed the research problem of personalized user interfaces in e-commerce, this paper delves into the relatively unexplored realm of layout adaptation. On the practical side, the paper shows the possibilities of using the proposed framework, presents tangible business benefits, and also identifies the limitations of implementation in e-shops.
2. Literature Review
2.1. Personalization of the User Interface
The historical context of UI personalization is briefly discussed, noting that attempts to provide dedicated user interfaces predate the dominance of artificial intelligence in recommendation services [13]. Previous efforts were often linked to the service-oriented architecture (SOA) paradigm [14]. Today, various approaches are commonly used for personalization in adaptive web shop interfaces, including AI-based methods such as collaborative filtering (CF) [15], CF based on deep learning [16], and its modification that uses the relationships between items rather than users (item-based CF—IBCF) as the basis for inference [17], case-based reasoning (CBR) [18], the RFMT (recency, frequency, monetary, time) model [19], data mining [20], and clustering [21]. UI personalization is applicable across diverse IT systems, whether within organizations (e.g., enterprise resource planning—ERP [22]), supporting interorganizational collaboration (e.g., workflow [23]), or dedicated to customers (e.g., e-commerce [24]).
The practical implementation of the AUI concept faces a fundamental challenge concerning the collection of data used for making inferences and recommending interface options to users. This challenge involves the necessity for capabilities to capture customer data, algorithms to identify similarities and differences in user behavior, and strategies or processes to use the extracted information to achieve specific business objectives [25].
Recommendations based on customer characteristics and behavior can rely on either explicit or implicit data collection methods. In the case of explicit data collection, customer characteristics, including demographic factors, social factors, and location, are directly obtained. In theory, collecting this type of data is not a problem for web-based e-commerce systems [26]. However, challenges arise when considering the quality of such datasets. Some customers may be unwilling to provide demographic data, prefer to browse anonymously, or even deliberately provide false information. Moreover, demographic information is subject to change over time, introducing uncertainties that are challenging to assess accurately [27]. On the other hand, implicit data collection involves tracking user activity without direct interaction with the customer. This approach is generally more reliable, as it does not depend on customer willingness to provide information. However, it faces increasing limitations due to legal restrictions, such as the GDPR [28] or privacy policies, and evolving e-commerce development trends that restrict the use of third-party cookies [29].
In the realm of e-commerce, user segmentation, borrowed from classic marketing techniques, is a common approach that involves dividing the customer population into groups with similar characteristics relevant to the objectives of the process [30]. The effectiveness of segmentation techniques can vary depending on the specific e-commerce business, its objectives, and the available data. Generally, segmentation can be described as an unsupervised learning process that utilizes different grouping approaches to create sets of objects (customers) based on target functions derived from selected measures of similarity or differentiation [31]. Given the dynamic nature of customer behavior, needs, and perceptions in e-commerce, segmentation techniques should be flexible, adaptable to large input datasets [32], and capable of handling rough sets [33].
While traditional customer segmentation methods have been used for decades, artificial intelligence, particularly machine learning, is increasingly playing a crucial role in this domain. Clustering algorithms are one example of such segmentation approaches [34].
2.2. Clustering of Users
Clustering, especially using the K-means algorithm, is a prevalent research topic in customer segmentation applications in e-commerce. Gomes and Meisen’s analysis of academic articles published between 2000 and 2022 on segmentation for customer targeting in e-commerce indicates that K-means is the most frequently cited clustering method, holding a 39% share [25]. This approach is known for its efficiency, although its computational complexity is influenced by factors such as dataset size, the number of clusters, and the initialization of cluster centroids. The combination of K-means with recency, frequency, monetary (RFM) analysis has been used for generating product recommendations [35]. Additionally, K-means has been applied to predict customer churn in B2C scenarios [36]. The pure K-means algorithm is often used for the segmentation of e-commerce users to create groups with different characteristics [37]. Similar goals have been explored using the particle swarm optimization algorithm [38]. Such a goal coincides with the potential use of clustering to create groups of customers to be served with a specific UI. Undoubtedly, K-means is an algorithm with many advantages, but it should be noted that within the framework of the aforementioned study, modifications of this approach, such as K-medoids (partitioning around medoids—PAM [39]) and K-medians, were also understood under the term K-means. It is worth noting that despite their similarities, these K-… approaches can lead to significantly different results when applied in practice [40].
To a lesser extent, there are studies on using other clustering approaches in e-commerce. Hierarchical clustering (of which agglomerative clustering is a subset) in e-commerce applications is discussed [41]. It is worth noting that the standard algorithm for hierarchical agglomerative clustering (HAC) has a time complexity of and requires memory, making it slow even for medium-sized datasets. This is a major limitation from the point of view of clustering on detailed e-commerce customer behavior data, as such learning datasets can be very large [42]. In turn, fuzzy C-means clustering, which is a version of K-means where each data point has a fuzzy degree of belonging to each cluster, can be modified to improve the clustering analysis effect of e-commerce user behavior [43].
A comparison of the performance of the K-means and DBSCAN (density-based spatial clustering of applications with noise) algorithms in e-commerce applications showed slightly better results with the second method [44].
2.3. Summary
The information gained from analyzing customer behavior can be used in various ways [45]. In the case of e-commerce, the most popular solutions are those that lead to the generation of product recommendations [46], including hybrid tools [47]. These approaches have been in practice for years and are justified by customer choices [48]. This does not mean, however, that there is no scope for further refinement of this approach, using various forms of optimization of the final recommendations [49].
Research on adaptive e-commerce interfaces demonstrates the potential of these interfaces to improve user experience, engagement, and satisfaction [50]. In addition, customer segmentation in e-commerce using AI-based methods can be an important aid in generating homogeneous user groups [51]. However, it is noteworthy that among the publications analyzed in the collective analysis of academic articles on customer segmentation in e-commerce published between 2000 and 2022 [25], there is not a single one that refers to applications of this approach to personalized user interface design. This means that the topic discussed in this publication has not yet been explored in depth and, in this context, represents a research gap worth filling.
The purpose of the literature review was to explore the research landscape surrounding the development and optimization of user interfaces in the e-commerce domain. By analyzing existing research, it identifies key trends and approaches in the design of multivariant interfaces, highlighting their functional aspects. The cited papers emphasize the importance of these interfaces in improving user engagement, personalization, and overall user experience in the context of online shopping platforms. Through a synthesis of various research papers, the existing knowledge base has been reviewed, shedding light on the critical elements and challenges of implementing an effective functional framework for multivariant e-commerce user interfaces.
3. Methods
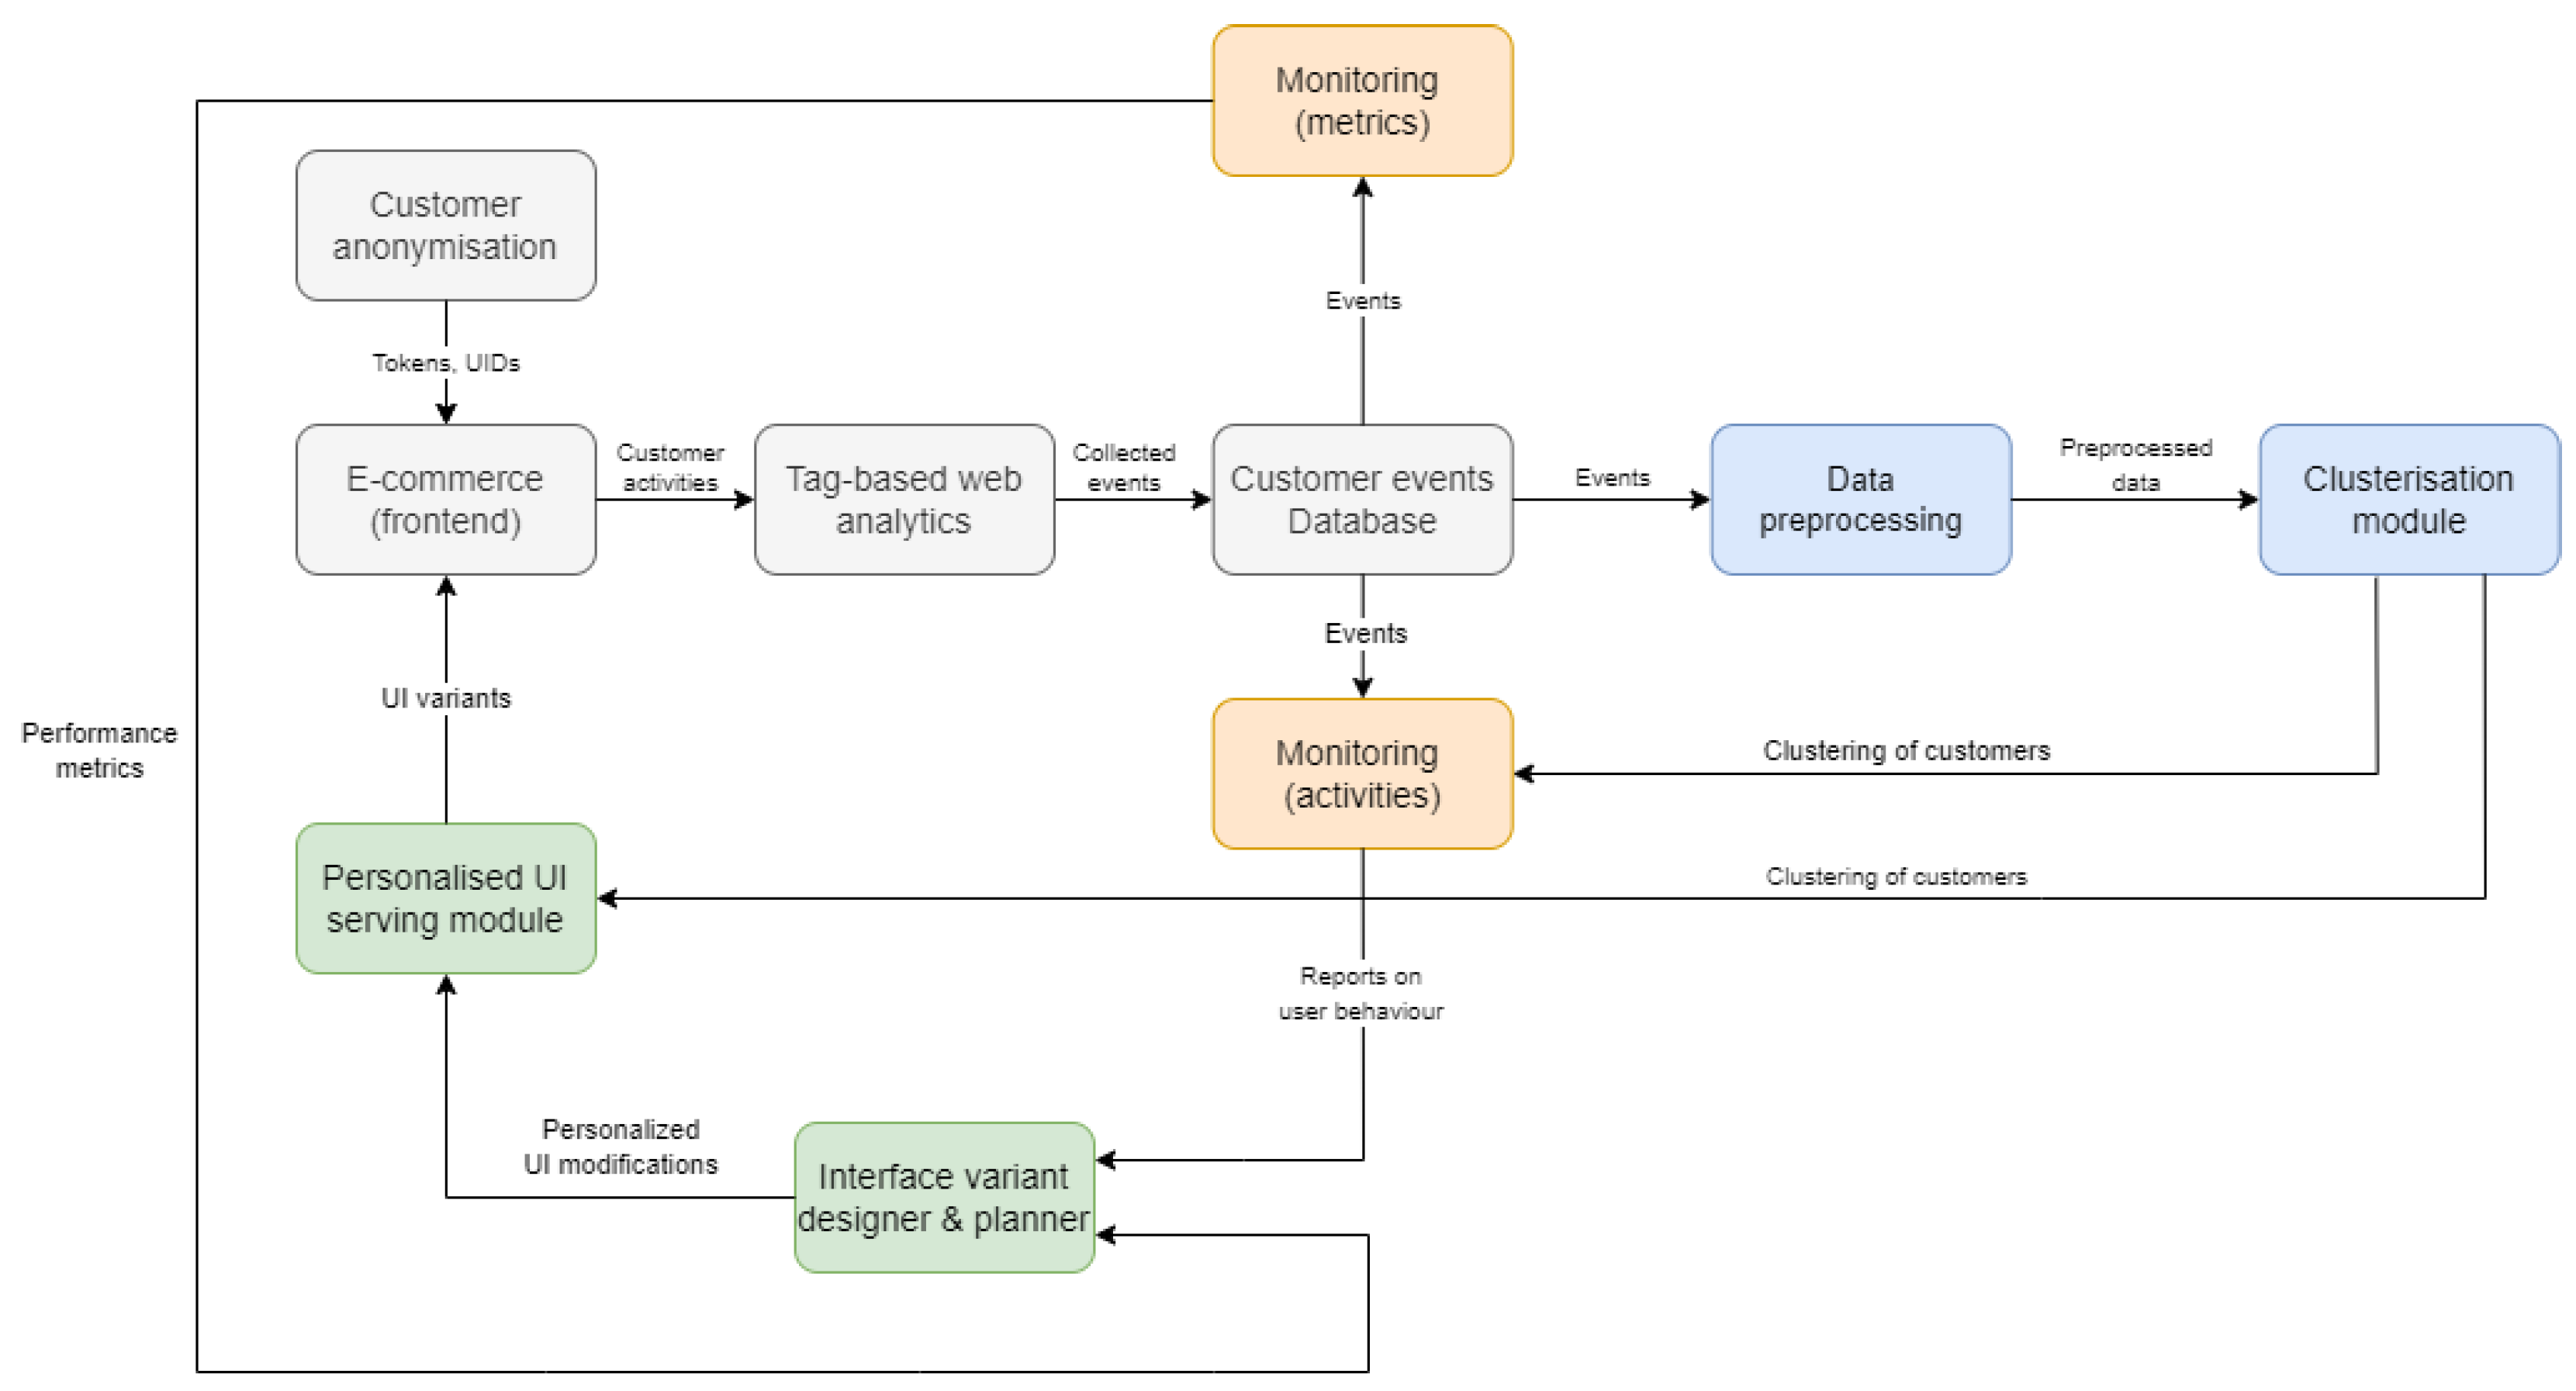
The framework described in this paper has been used by Fast White Cat S.A., Wroclaw, Poland (Digitree Group), an official Adobe partner founded in 2012 and an experienced global e-commerce company specifically focused on Magento 2 software development. They employed the framework to develop the platform designed to serve multivariant user interfaces. The pilot implementation was supported by OTCF S.A., a Polish company established in 1995 that specializes in the design, production, and sale of sportswear and accessories for amateurs and professionals. stands as an example of the practical implementation of the AUI concept. The aim of the framework is to provide dedicated e-commerce user interfaces based on user groups defined by clustering using AI methods, monitor the results, and optimize the solution. It includes several core system modules and key integration interfaces (Figure 1) that expand on the original concept [24].
It covers four core areas: collecting data on e-commerce customer behavior (grey modules), analyzing the data (blue modules), designing and operating dedicated interfaces (green modules), and monitoring and optimizing the results in a feedback loop (orange modules). The elements comprising the framework are detailed in the following subsections of the paper.
3.1. Data Collection
The first component, responsible for collecting data on customer behavior and decisions, is structured similarly to e-commerce recommendation systems. However, the difference lies in the scope of the collected data. While the information on products viewed, added to the basket, and purchased is typically sufficient for product recommendations, serving a dedicated user interface requires gathering data about the entire customer journey. This entails analyzing a broader range of customer actions, significantly impacting the amount of underlying data collected.
3.1.1. Customer Anonymization
Unlimited collection of customer data in e-commerce is not feasible in today’s landscape. Modern users are increasingly aware of their privacy rights, and evolving legislation and market trends impose additional restrictions on marketing consent, behavioral tracking through third-party cookies, and the use of personal or sensitive data. Therefore, the collection of data on how customers use online shops must be approached with careful consideration. On the one hand, ensuring that users can provide appropriate marketing consent is crucial, and on the other hand, the collected data must be secured and anonymized. From a technical standpoint, this primarily involves attempting to uniquely identify the customer without violating their privacy rights. A significant challenge arises from the fact that customers may use different devices, rendering tokenization based on device data (deviceToken) impractical in practice.
Other options are not without their drawbacks either. The simplest approach to identification is undoubtedly the use of random unique identifiers, such as the commonly used UUID (Universally Unique Identifier) documented as part of ISO/IEC 11578:1996 [52] and updated in the subsequent documents. Such an identifier can be generated when a customer first enters an online store, stored in cookies, and then used to associate observed behavior with the customer. On subsequent visits, the cookie record can be updated to combine multiple customer visits into a single customer behavior profile. However, this approach does not solve two problems: the possible use of multiple devices by the user and the possibility that a single device (on which cookies are stored) can be used by different clients.
In theory, it would be possible to identify a user from data such as an e-mail address, but this raises issues of a legal nature (e-mail may be treated as personal data and therefore subject to appropriate protection), of a procedural nature (an e-mail address is most often provided at the end of the e-commerce purchase process, so only then could it be used to identify the user), and of an organizational nature (customers may have different e-mail addresses simultaneously). Legal issues can be addressed by encrypting the email address so that it cannot be decrypted. The problem of late provision of an email address can be solved by using a hybrid solution—a random identifier is used until the customer’s address is known, and once the email address is known and encrypted, it is added retrospectively to the customer’s records. The issue of multiple email addresses, on the other hand, is essentially intractable and must be treated as a risk—a source of potential bad recommendations.
Preparing for the collection of user behavior data is therefore not a trivial matter. Simply deciding how to anonymize customers can be challenging, and it may not be possible to solve all potential problems at once. In practice, it is worth trying to find a compromise while accepting the risks of the chosen approach.
3.1.2. E-Commerce Platform
The collection of customer behavior data and the subsequent application of a multi-variant user interface must be considered in the context of mechanisms for visualizing and delivering it to the end consumer. In the case of online shops, this means integration with the e-commerce platform on which the shop is based. The need to implement modifications related to tracking customer behavior and serving them with a dedicated UI practically excludes the possibility of implementing the described concept in solutions using the software as a service (SaaS) model, unless such functionality is provided globally by the platform owner. In the case of other e-commerce service delivery models, the limitations may be less technical and more business considerations. Personalizing the design of the user interface will undoubtedly require a financial outlay, and one of the costs will be the cost of customizing the front end of the online shop.
3.1.3. Tag-Based Web Analytics
Tag-based web analytics is a method of tracking and analyzing user behavior on a website by implementing snippets of code, or tags, on the website’s pages. These tags are typically JavaScript code that is managed in tag management system (TMS) software applications such as Google Tag Manager, Tealium iQ Tag Management, Adobe Experience Platform Launch, Qubit, and Signal Customer Intelligence Platform. Web analytics systems, of which Google Analytics (GA) is the most widely used, then analyze the data collected. However, in the context of collecting information about the detailed behavior and decisions of e-commerce customers, it is not without its drawbacks. The most important of these are the collection of data in the cloud, which can be seen as a threat to customer privacy, and the lack of flexibility in accessing the information stored in Google’s databases.
3.1.4. Customer Events Database
The database is the backbone of user behavior recommendation systems, storing events, actions, and other critical information that drives personalized recommendations. The choice of database technology and design should be based on the specific requirements and scale of the recommendation system, although it may be forced by the chosen web analytics technology. Solutions with limited flexibility in terms of the database systems used (such as the above-mentioned Google Analytics) have little scope for customization. It is therefore worth considering applications that are less popular but offer much more flexibility in terms of data collection and storage. An example of such a solution is Matomo, which allows data to be collected in a database that is directly accessible and located in a location chosen by the customer data processor.
The primary source of data collected is customer behavior and decisions extracted from the tag-based web analytics module, but other systems cannot be excluded, as they may contain information that is critical to a complete view of e-commerce processes. An example is the order fulfillment process. While the customer’s actions of selecting a product, adding it to the basket, or placing an order can be tracked using information from the online shop, the facts of picking and receiving a shipment require integration with enterprise resource planning (ERP) or a warehouse management system (WMS) to confirm the final fulfillment of the order. In this case, without recording information on how the purchase process was completed, it is not possible to reliably analyze e-commerce performance indicators, which can also be used to assess the quality of changes to the dedicated interface variant.
3.2. Data Analysis
Data analysis in recommendation systems is an ongoing process. The insights gained from data analysis help to optimize the performance of the recommendation system, increase user engagement, and drive business goals such as increased sales or user satisfaction. It covers two main areas—the preparation of raw data for analysis and the processing of the data.
3.2.1. Preprocessing
Preprocessing is a set of steps and techniques applied to raw data before it is used to train a machine learning model. Data preprocessing is a critical part of the machine learning process, as the quality of the input data can significantly affect the performance and reliability of the model. The main purpose of data preprocessing is to make the data suitable for machine learning algorithms, improve model performance, and ensure that the data are clean and well-structured.
Preprocessing for e-commerce customer behavior analysis can encompass various steps, including data cleaning (e.g., handling missing values, outlier detection and handling), data transformation (e.g., feature scaling, categorical data coding, and feature engineering), and data reduction. Data reduction is particularly important due to the potential size of the datasets to be processed, with dimensionality reduction being of particular note in this context.
Subsequently, the main activities predefined for each e-store should be organized so that the solution can be adapted to the specific characteristics of a particular e-business. The resulting matrix undergoes a PCA (principal component analysis) transformation to reduce data dimensions and extract information. This involves constructing a linear space base in which successive dimensions best explain the variance in the data. The algorithm successively maximizes the variance according to the first coordinate, the second, and so on. The resulting data are easier to analyze further, and the time required to generate clusters is reduced.
3.2.2. Clusterization
The clustering module is a key component of the framework, tasked with analyzing the information collected on the behavior of e-commerce customers and dividing them into groups characterized by similar shop usage. However, the choice of clustering algorithms should not be arbitrary. In addition to typical metrics describing the quality of clustering, such as Calinski–Harabasz (CH) score, Davies–Bouldin (DB) score, or silhouette coefficient, the business context should also be taken into account.
The most important requirement from the perspective of the business use of clustering results to serve dedicated UI variants is undoubtedly the distribution of users across the clusters. Firstly, the number of clusters themselves must be limited due to the cost of designing UI variants, and secondly, the number of users in each cluster should not differ extremely. Of course, achieving an equal number of clients in the generated clusters may not be feasible, but the aim should be to keep the differences in size as small as possible.
Considering the business specifics, the DBSCAN [53] approach can be practically excluded from the list of potential clustering algorithms. The lack of a predefined number of clusters in this method, which is an advantage in many applications, is a disqualifying disadvantage when it comes to clustering e-commerce customers for UI personalization. When attempting to use this approach, it can be expected that the result will be the generation of many hundreds of clusters of individual customers. Clearly, it makes no sense to design UI modifications for such fragmented groups of users.
K-means clustering, widely used in e-commerce solutions, is undoubtedly worthy of strong consideration. In addition, BIRCH [54] and agglomerative clustering [55] may be promising approaches. Based on the previous research [8], it can be concluded that the agglomerative clustering method give better results from the point of view of the distribution of the clusters, but this may be impractical for the analysis of large datasets due to its computational complexity. During the experiments, the K-means model provided results that were not much worse than agglomerative clustering. Due to the lower computational requirements of the K-means method [56], it was finally recommended as an alternative clustering method in the implemented solutions, especially for large e-commerce businesses.
The implemented clustering methods can be parameterized to suit the specific requirements of a particular e-store. The administrator of the implemented solution should be able to decide which clustering method to use, how many clusters to generate, what the clustering criteria should be, the number of iterations, and so on.
3.3. Management of a Dedicated Interface
Managing a dedicated interface in a personalized UI recommendation system is a process that requires a deep understanding of user behavior and preferences, as well as a commitment to delivering a user experience that meets individual needs. It is a continuous process. The design improvement cycle of the dedicated UI variants includes activities from two components.
3.3.1. Interface Variant Designer and Planner
Designing a multivariant UI requires careful planning and execution to create a seamless and personalized shopping experience for users. On the one hand, it must be technically possible to serve multiple user interface variants within a single webshop, and on the other hand, the variants must be tailored to meet the needs of specific groups (clusters) of customers.
Defining significantly different interface variants can confuse users; thus, the focus in practice should be on implementing a series of smaller changes that address identified differences in customer behavior between clusters. These micromodifications should be designed to be easily applied to multiple UI variants through parameterization, without additional development. With this approach, a systematic collection of micromodifications can be developed, thereby increasing the available combinations of UI variants. This effect can be achieved by dividing the shop’s page views into areas where micromodifications are made. Within each page type (e.g., homepage, listing, product card, and checkout), multiple areas can be defined and personalized. Areas can be defined separately within each page in a many-to-one relationship, providing a highly flexible and scalable mechanism for delivering a dedicated interface. An area can be assigned several options, which can also be set dynamically, depending on the decisions of the UX experts or the AI-based mechanism, allowing for limitless personalization of the interface with more detailed user clusters.
The second issue concerns the selection of modifications for a particular group of users. In its simplest form, this can result from expert analysis, from which recommendations for implementation are derived. Based on knowledge of the characteristics of the generated cluster and the typical behavior and decisions of customers from each cluster, the specialist selects a set of modifications, creating a dedicated variant of the user interface. This solution is relatively straightforward but requires a great deal of knowledge about the potential impact of the change on the users of the online shop. Another option is to automate the selection of modifications for subsequent customer clusters. In this case, a modification is selected from the available set and implemented. The impact of the tested modification on customer behavior is checked over time, and a decision is made to keep or reject the modification based on the results. Such an evaluation process can be performed iteratively for each successive potential modification, resulting in the self-adaptation of the UI variant.
Regardless of the chosen modification selection for customer clusters, it is crucial to note that the number of modifications tested simultaneously is not insignificant. In theory, individual modifications should be tested and studied independently. However, this approach has a significant drawback—feedback, especially when using indicators based on orders placed in the e-shop, is delayed and time-consuming. If there are numerous potential changes, testing them one by one can take so long that external factors may distort the results. This problem is discussed in more detail in the following sections.
3.3.2. Personalized UI Serving Module
The way in which the dedicated interface is served is a direct result of the technical capabilities offered by the e-commerce platform in use. If progressive web application (PWA) technology is used, the front-end application can display the correct interface variant to the user based on settings in the back-end, sent to the front-end as JSON (JavaScript Object Notation). In this case, when a customer enters the webshop, but before the first page is displayed, the multivariant UI management system is queried for a set of changes to the basic UI variant for that customer. Subsequent web pages are then served based on the feedback, considering the personalized changes to their appearance.
3.4. Monitoring and Optimizing
Analysis of user behavior across clusters is necessary to identify potential interface changes that can be delivered to specific customer groups and to verify the impact of changes on e-commerce key performance indicators (KPIs).
3.4.1. User Behavior Similarities
The primary purpose of user behavior analysis is to identify patterns that can be used to design variants of dedicated interfaces. The analysis is based on the study of actions and action sequences (e.g., predecessor—action—successor) and the frequency of their occurrence. On this basis, it is possible to identify operations that are specific to different customer clusters of the online shop and those that are not. This information enables the targeting of micromodifications that should be implemented and verified, while also indicating those micromodifications that are not worth verifying because a specific group of customers does not use certain parts of the user interface.
The second aspect of this analysis involves verifying the dominant values of key attributes of user behavior, provided after clustering. This process can result in reports describing the distribution of selected characteristics across clusters. Examples of such characteristics include the number of actions, the number of different events, orders placed (considering their value, the number of items ordered, delivery costs, etc.), frequency of search engine usage, shopping basket abandonment, selected product characteristics (e.g., color, size), and others. The analysis can include mean and variance for continuous characteristics or dominant values for discrete characteristics.
3.4.2. Performance Measurement
The primary purpose of using multivariant user interfaces in e-commerce is to translate personalization, influencing a better fit between the design of the e-store and the needs and requirements of different customer groups, into concrete and measurable business benefits. Among the most popular performance measures in e-commerce are the conversion rate (CR) and average order value (AOV) [57].
In general, a conversion rate measures the percentage of users who have completed a desired action and can be calculated as follows:
where NoC is the number of conversions, and NoV is the number of visitors.
AOV measures the average amount a customer spends in a single transaction in an online store according to the formula:
where: is the revenue from the ith order, and n is the number of orders.
In their basic form, both metrics, CR and AOV, can be considered macroefficiency indicators as they relate to the outcome of a customer’s e-commerce activity, usually the placement of an order. However, when analyzing the impact of individual micromodifications, it is difficult to expect that a small change will have a noticeable effect on these macroindicators. Therefore, in addition to CR and AOV, which are useful for assessing the impact of a set of modifications or the dedicated interface variant as a whole, it is necessary to consider indicators that can assess the importance of micromodifications.
A potential solution is to apply the CR metric to conversions defined as the execution of specific single actions in an online shop (e.g., selecting a specific product attribute, clicking on a banner, expanding a tab, etc.). This approach allows the verification of small changes but does not account for potential dependencies and side effects. For instance, when assessing the impact of a change on a specific action, it is not possible to verify the impact of the same change on other actions that the customer might take on a particular page of the online store. An example would be increasing the size of a banner ad. By using the CR metric and considering a click on the banner as a conversion, it is possible to assess how this metric has changed (potentially increased). However, it is not possible to determine how the increased size of the banner has affected (potentially negatively) the selection of other products presented below, which are not visible to the customer in the new version.
To reconcile the ability to verify small changes to the user interface and assess the wider impact of implementing the change, an additional indicator is proposed. This indicator should dimension complex user behavior, considering key customer activities linked to the analyzed UI changes. For this pilot solution, based on the framework, a partial conversion rate was introduced to quantify selected elements of the customer journey in the webshop. Assuming that the system’s usage can be represented by a directed graph, with nodes representing different states and edges indicating the subjective value of the transition between states (transition value—TV), the value of a customer’s visit (customer visit value—CVV) to the webshop can be calculated as the sum of the values of all actions taken by the customer:
where is the customer visit value for the cth customer, and is the transition value of ith activity and cth customer.
For change impact analysis targeting a group (cluster) of customers, the PCR’s value can be described by the formula:
where n is the number of sessions related to customers from the cluster g; s is the number of activities within the session n; is the calculated PCR metric value for the cluster g; and is the score of an activity j during a session i.
The PCR proves to be a flexible solution, allowing the verification scope of UI changes to be tailored to business-critical customer behavior. It extends beyond individual actions, providing the ability to consider a variety of activities and weigh them according to business needs. This approach retains the advantages of microconversion analysis, enabling the testing of small changes to the user interface. At the same time, it is not limited to assessing the impact of single customer actions and allows a broader perspective on the problem.
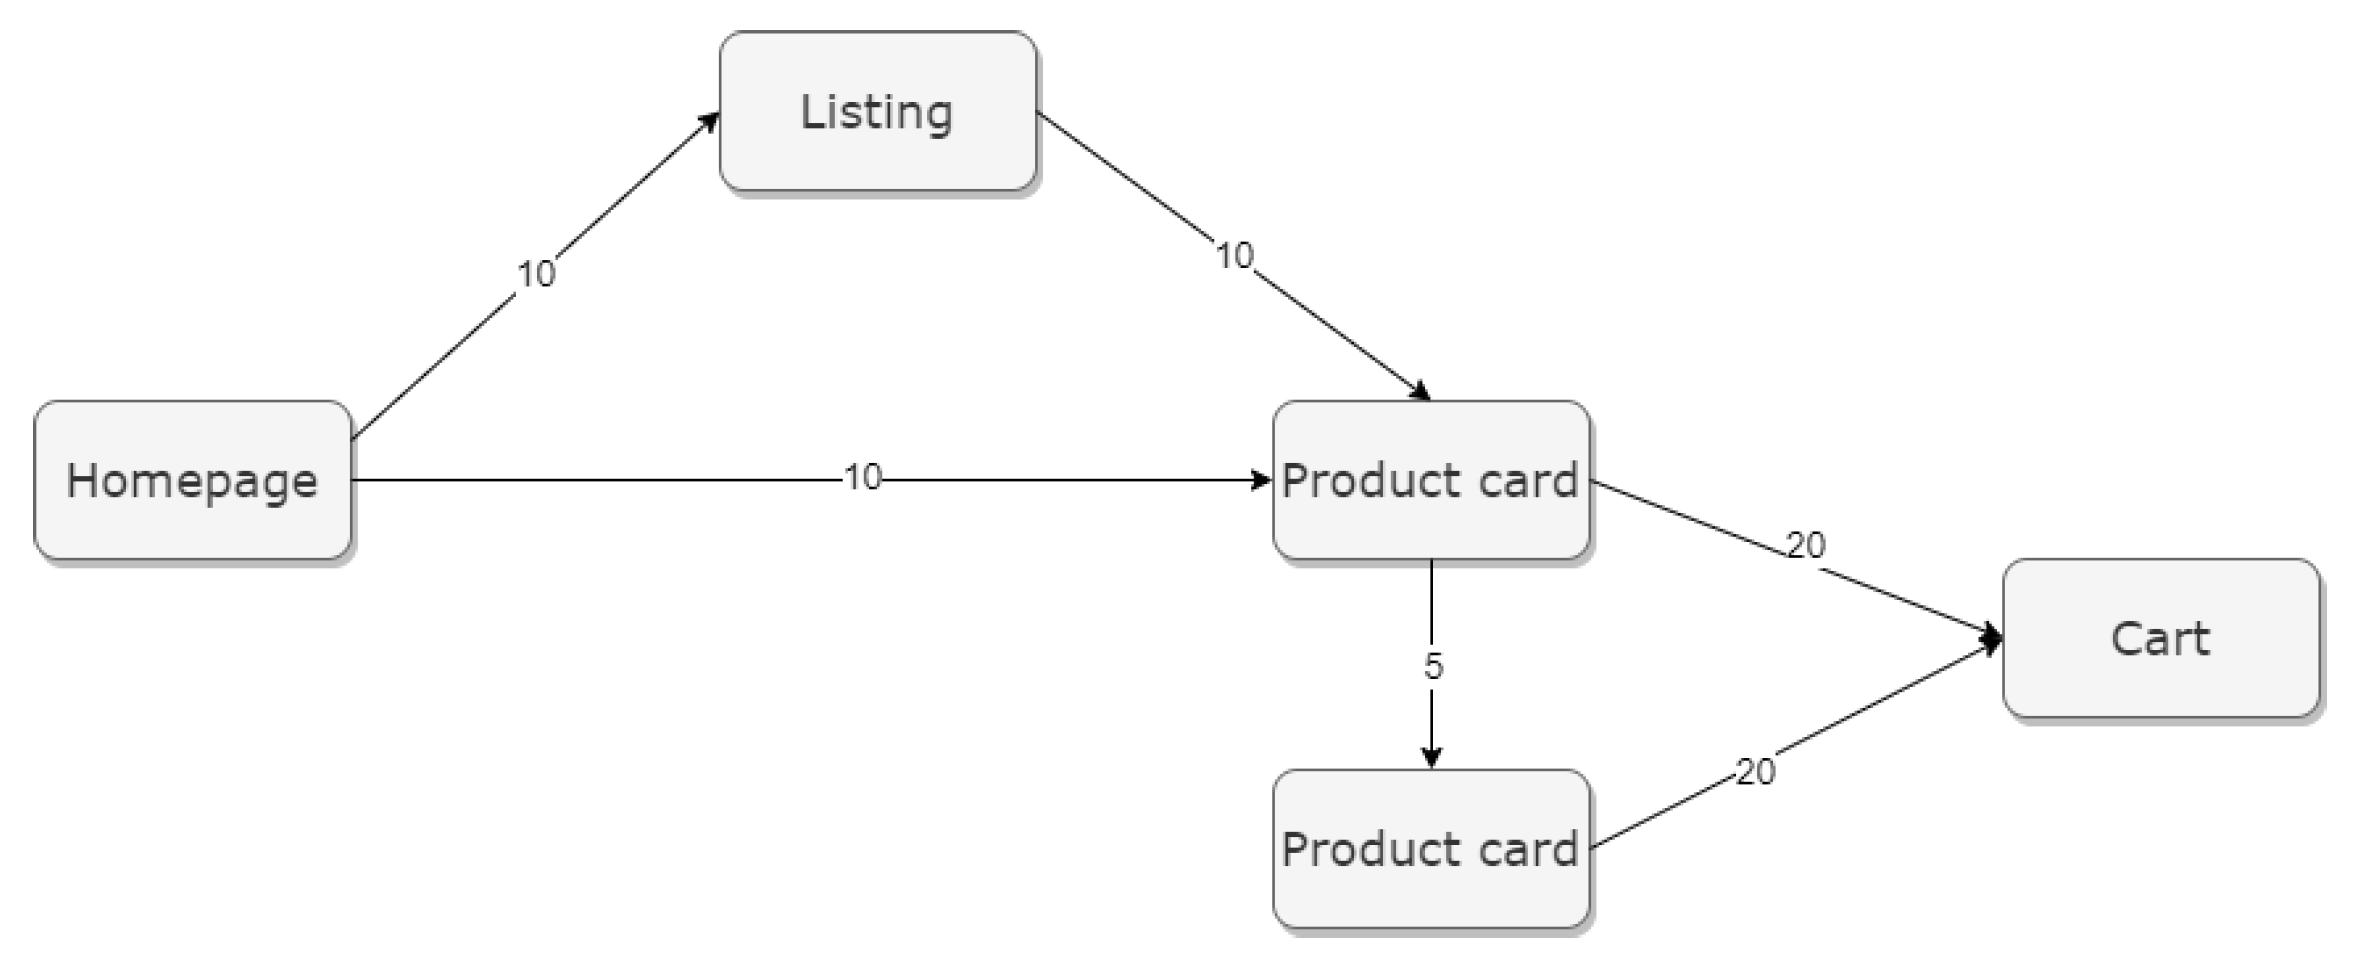
Furthermore, the PCR can be used for more complex analyses. If the aim of UI changes is to influence the paths taken by users in the online shop, selecting specific activities for study (Figure 2) allows an assessment of whether the implemented changes bring the actual customer journey closer to the expected journey envisioned by the business. The calculated score is influenced solely by the customer activities included in the expected journey, enabling an evaluation of the extent to which the desired effect has been achieved by examining values before and after the implemented change.
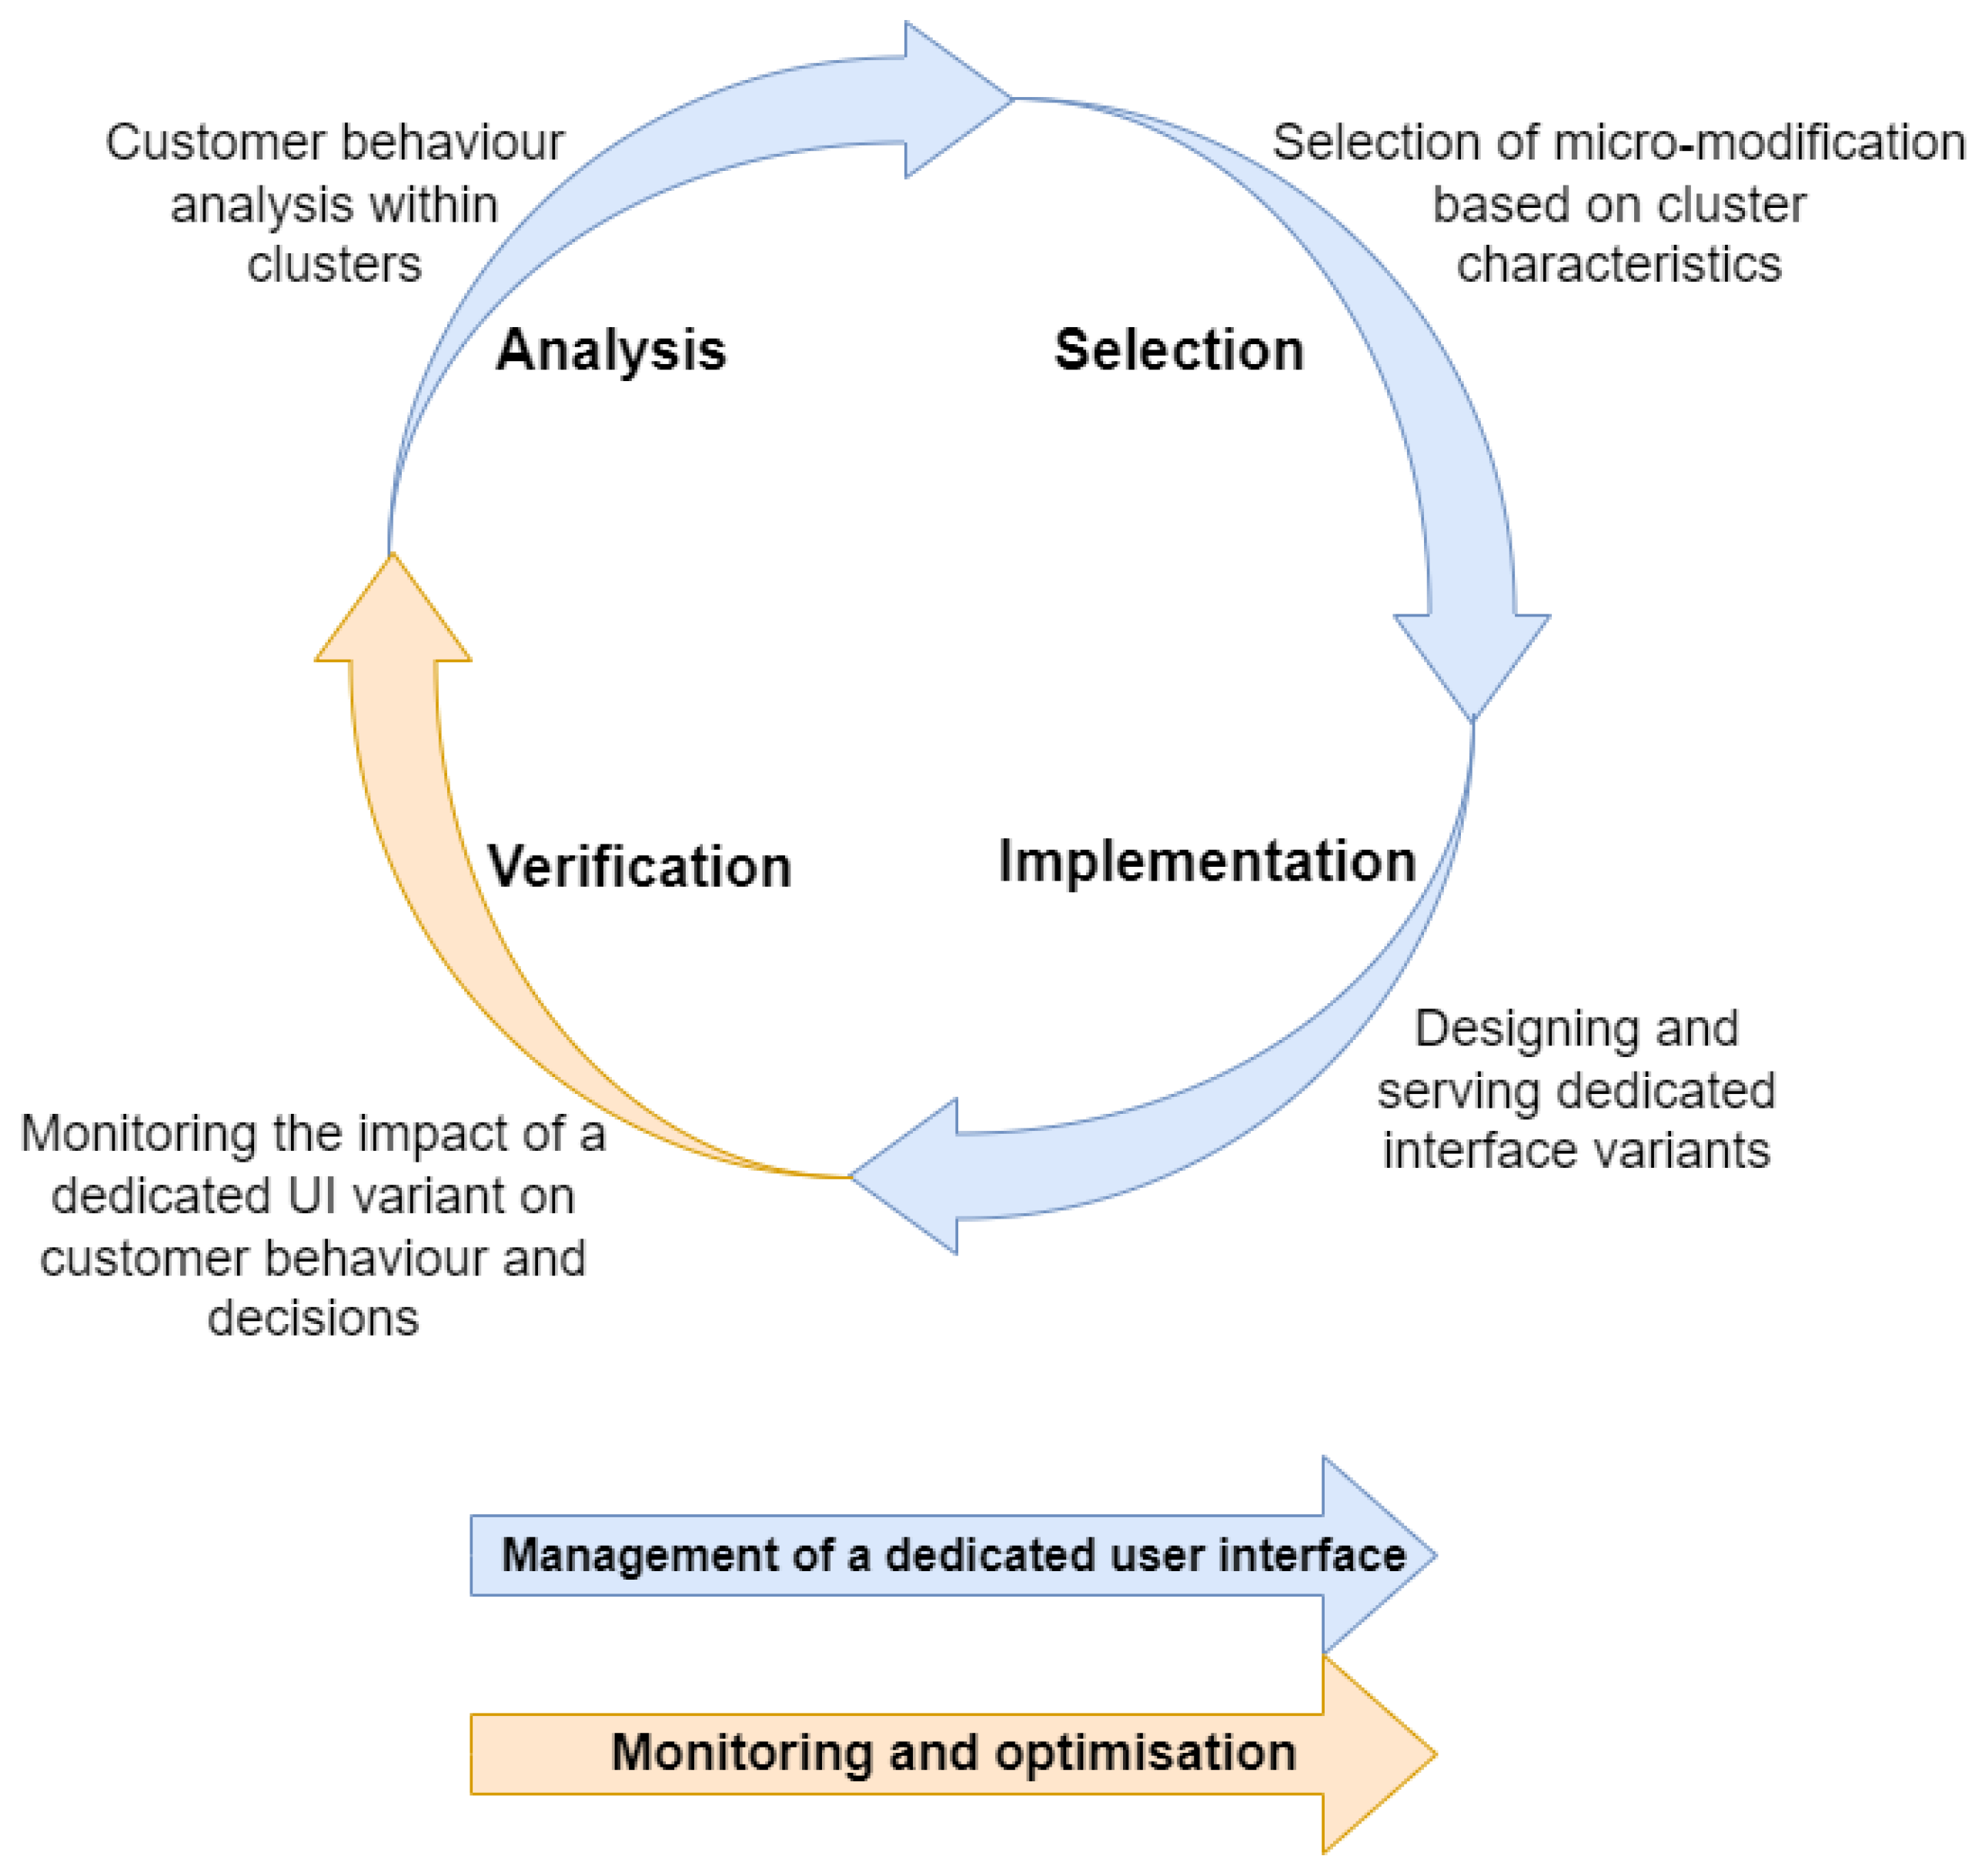
The overall workflow of the described framework is shown in Figure 3.
This comprehensive framework encompasses all stages, from data collection to monitoring and continuous improvement. It is crucial to highlight that the improvement of UI variants is an ongoing process driven by customer feedback, allowing for adaptation to the dynamic conditions of the online store.
3.5. Objectives of the Study
The theoretical framework presented as a solution to provide dedicated user interfaces for e-commerce customers required practical validation and verification. To achieve this, the platform was implemented, enabling the delivery of dedicated interface variants to online shop customers using the Adobe Magento platform.
The general purpose of the research was to analyze the presented concept and explore its potential business applications. Recognizing that the implementation of new solutions should be economically justified, the subsequent task involved designing, implementing, and verifying the impact of a dedicated user interface variant on a selected group of customers based on the performed clustering. The specific objective was to statistically validate the significance of the impact of the user interface modifications on the identified customer behavior, recorded in the form of the expected purchase path.
Formally, the aim of the study can be written as testing : against alternative hypothesis : , where: represent the average of the CVV values for customers from the selected cluster who have been served a dedicated UI, and represents the average of CVV values for customers from the same cluster who were served the standard UI.
If hypothesis is rejected in favor of hypothesis , it can be concluded that the dedicated interface variant influences customer behavior within the analyzed cluster and that this influence is positive, thus bringing customers closer to the expected purchase path.
The research to validate the hypothesis is grounded in data collected from a real online sportswear shop operating in one of the Baltic states. The real-time collection of user behavior data encompasses all website activities and transitions between websites (clickstream). These data include customer actions and contextual information such as the time of activity, duration of site visits, device used, and so on. It undergoes double preprocessing—first at the data collection stage by the web analytics system and then at the clustering preparation stage.
4. Results
The pilot implementation of covered all components outlined in the framework, resolving technological issues. Anonymized customer UUIDs stored in cookies on the user’s browser side were used. GTM and Matomo were utilized to collect information about actions in the webshop. Various customer activities were recorded, such as visiting the site, selecting a product (viewing the product card), selecting product attributes (such as color or size), accessing additional information in a pop-up window, adding a product to the shopping cart, using the search engine, and others. The collected data were stored in the Matomo database, then preprocessed and stored in a dedicated database. The second round of preprocessing prepared the data for clustering.
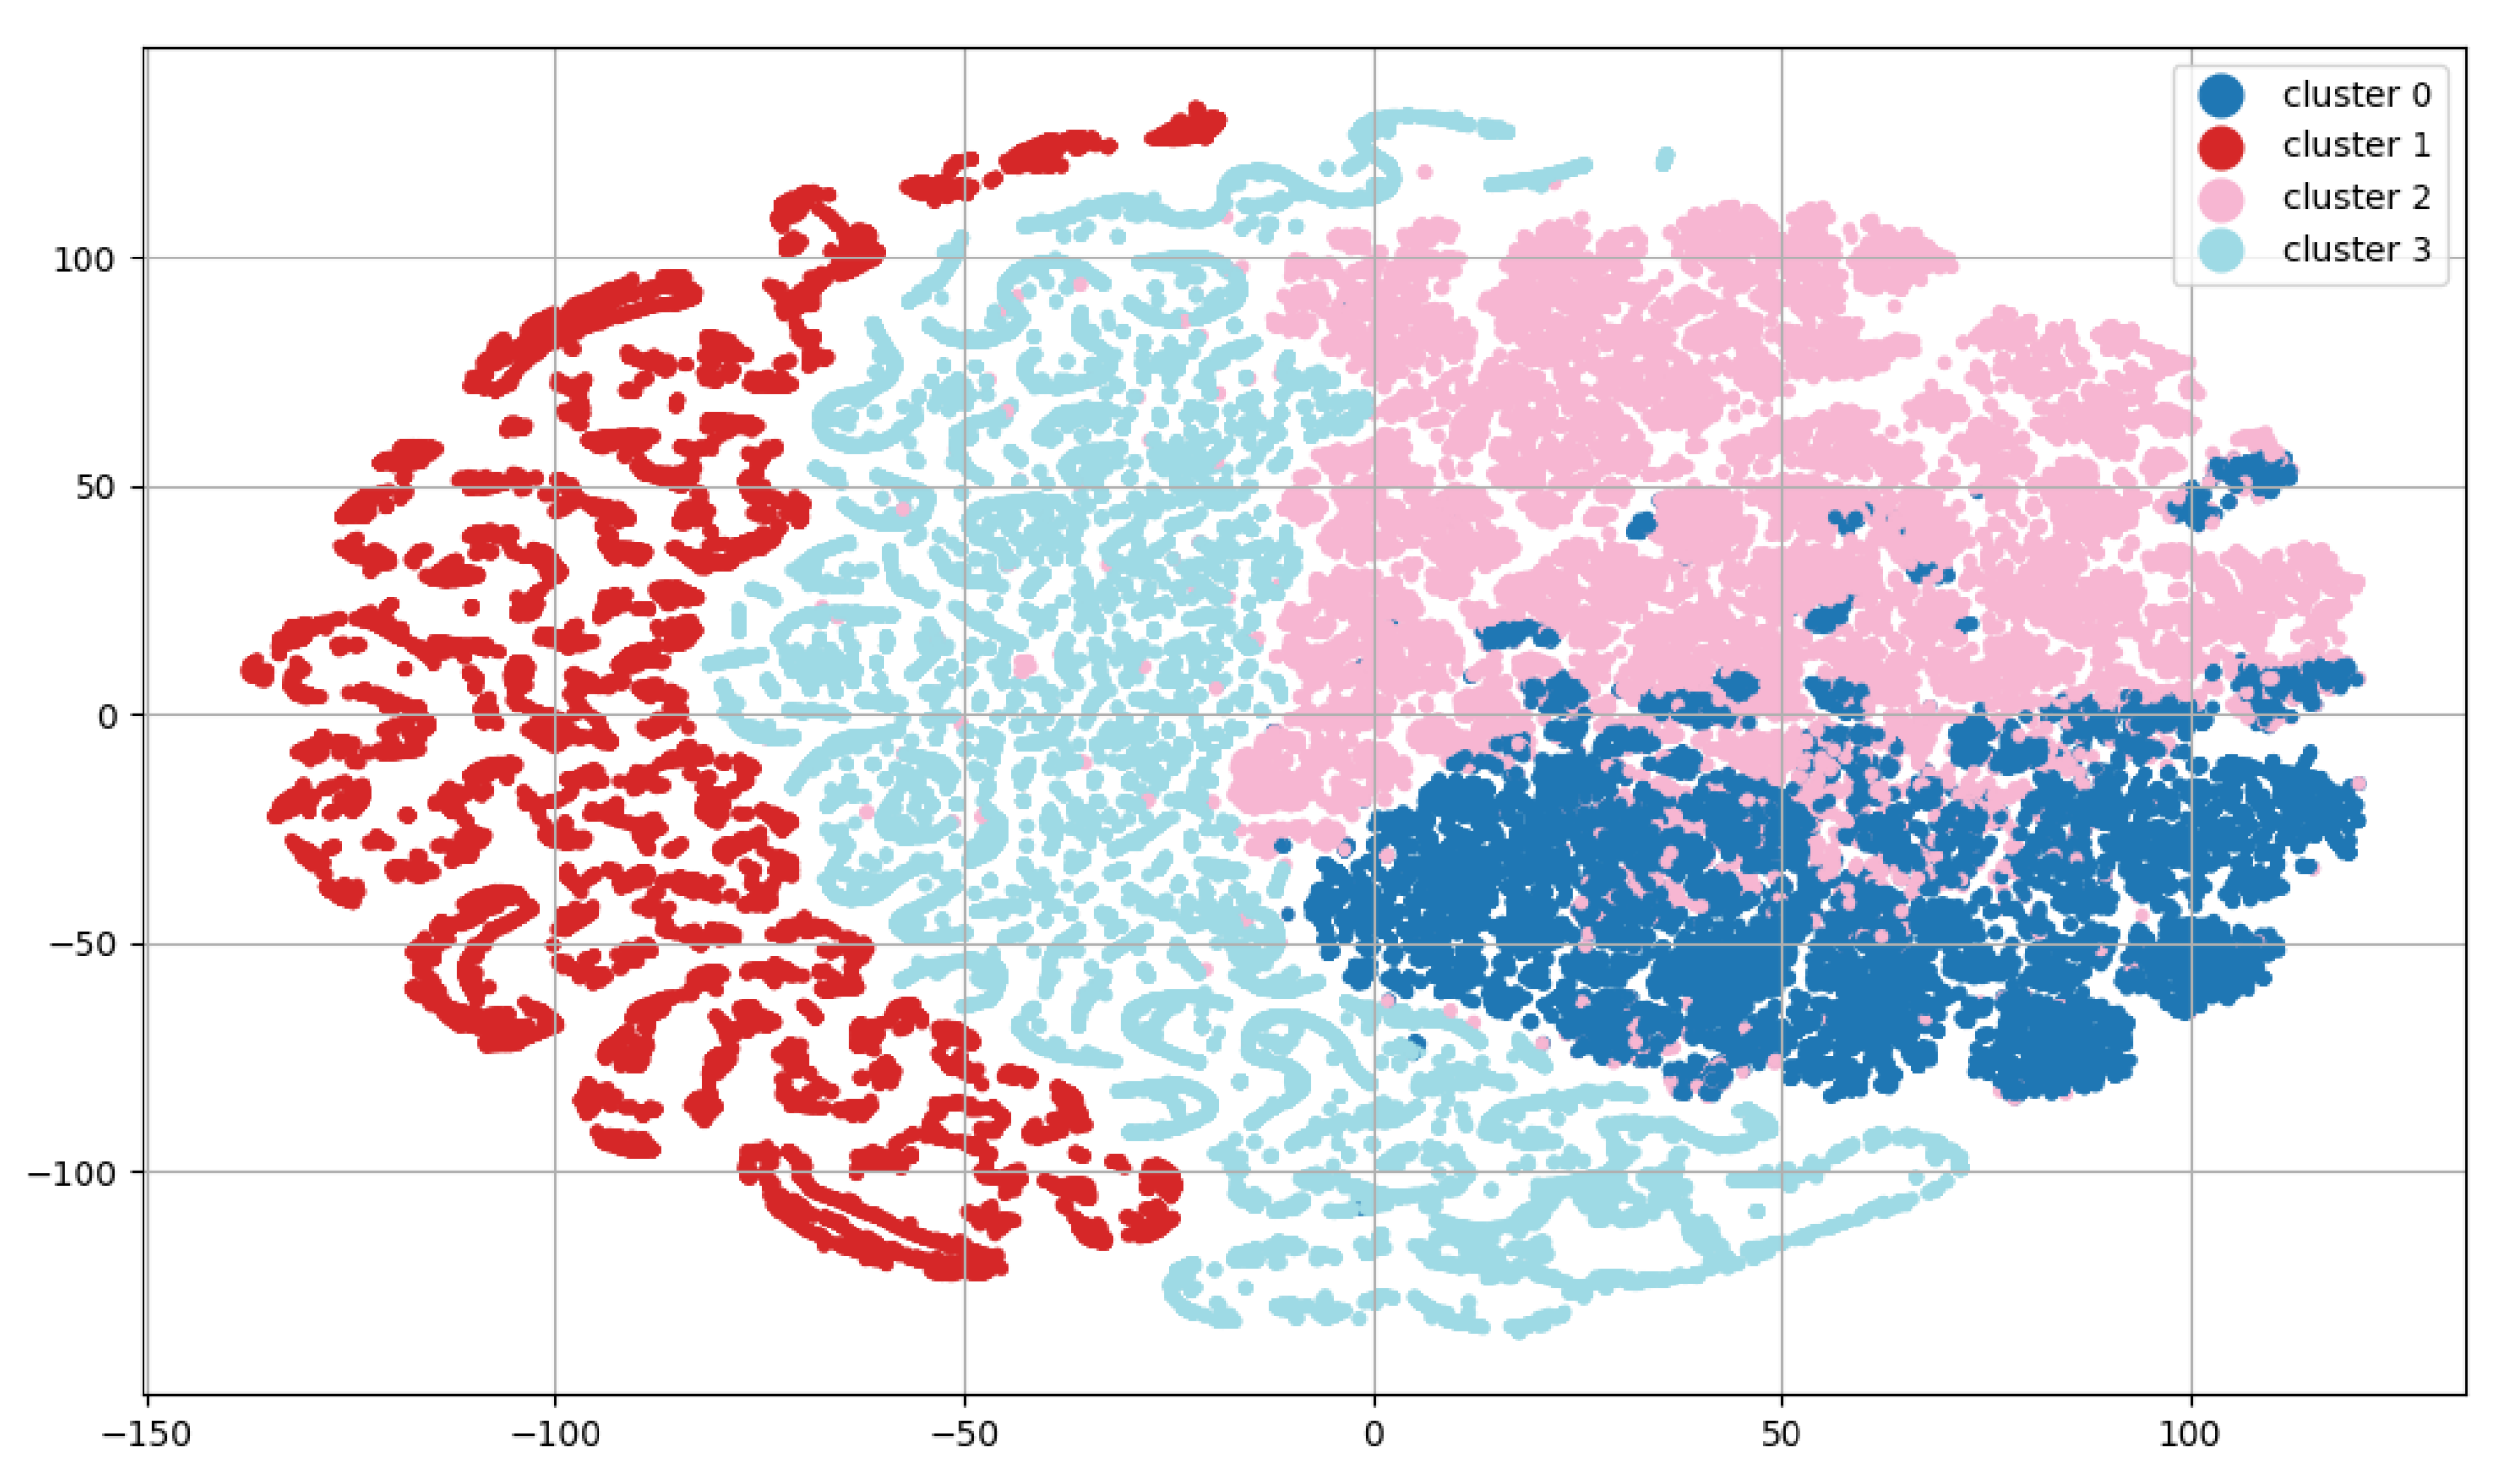
The study incorporated 441,342 e-commerce user sessions, constituting the dataset for clustering. K-means was chosen as the clustering method due to its limited computational requirements. The assumption was made to generate four customer clusters (Table 1), with one cluster selected for further analysis. The chosen number of clusters (k) made it possible to create clusters containing at least 20% of the population of the shop. On the other hand, for k > 4, the size of the smallest cluster was significantly smaller (e.g., for , it was only 10.5186% of the population). With a sufficiently large group of users, it was possible to obtain statistically significant results within the assumed time of the study.
The cluster chosen for analysis comprised customers with the highest observed activity, increasing the likelihood of their return to the online store during the research period. This selected cluster encompassed 19,395 clients, representing 20.6862% of the total user population in the cluster, and was evenly split. One segment of clients from the cluster was presented with a dedicated variant during the study, while the other group experienced a standard user interface variant.
The behavior of users in the selected cluster was analyzed by a UX expert, resulting in 12 proposed micromodifications to design a dedicated user interface variant. These modifications spanned the home page, the listing, and the product card. To meet the objectives of the study, it was decided to implement all modifications simultaneously, allowing for a holistic evaluation of the UX expert’s recommendations. An alternative approach could have involved analyzing the modifications individually and deciding whether to accept or reject them based on the differences in customer behavior between the research group and the comparison group.
The following client actions were selected for the calculation of CVV and PCR values:
- switching from the homepage to the product listing—10 points;
- switching from the homepage to the product page—10 points;
- switching from the listing to the product page—10 points;
- switching from the product page to another product page—5 points;
- adding the product to the basket—20 points.
The calculation of CVV and PCR values involved selecting specific client actions. CVV values were counted separately for each session within both client groups from the cluster, while PCR was determined in daily cycles.
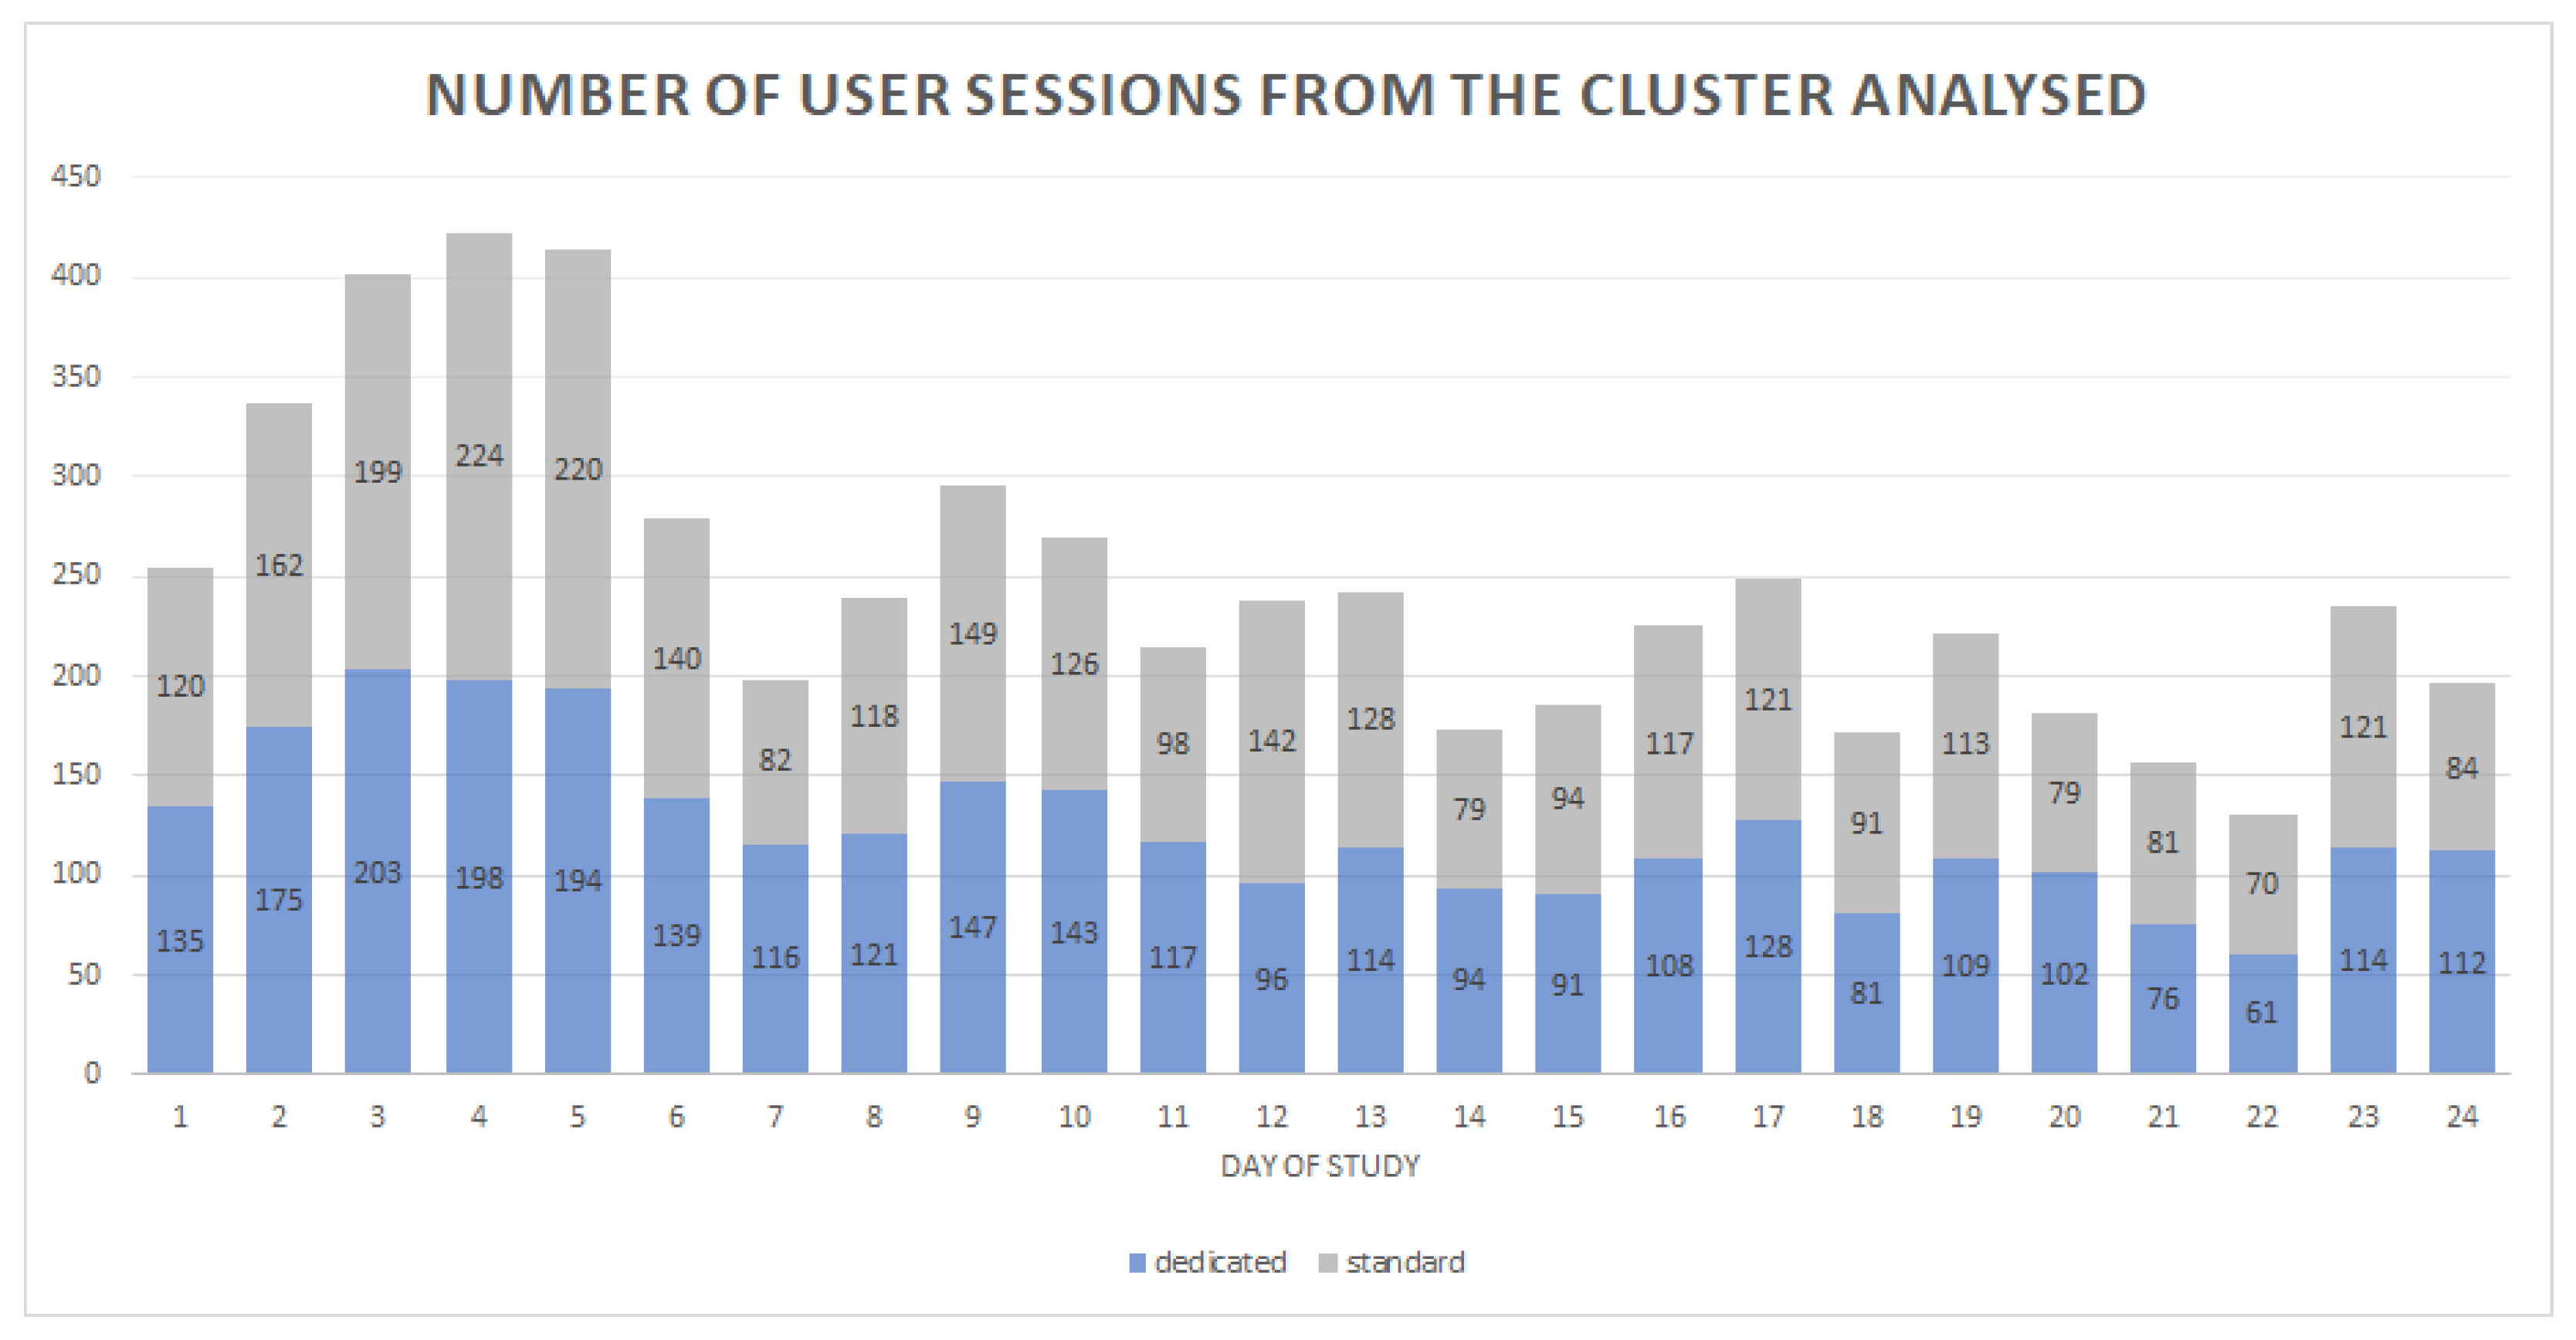
The study lasted 24 days, during which 2974 customer sessions were served with the dedicated UI variant, and 2958 customer sessions were served with the standard UI.
A two-sample t-test for unequal variance was used to test hypothesis at a significance level of .
PCR values were counted for each day of the study separately. The number of user sessions for the two groups of customers surveyed varied from day to day (Figure 5).
This is a natural situation for online shops, as traffic is the result of many factors, both dependent (e.g., current promotions, advertising campaigns, etc.) and independent (e.g., season, day of the week, etc.) of the shop owners.
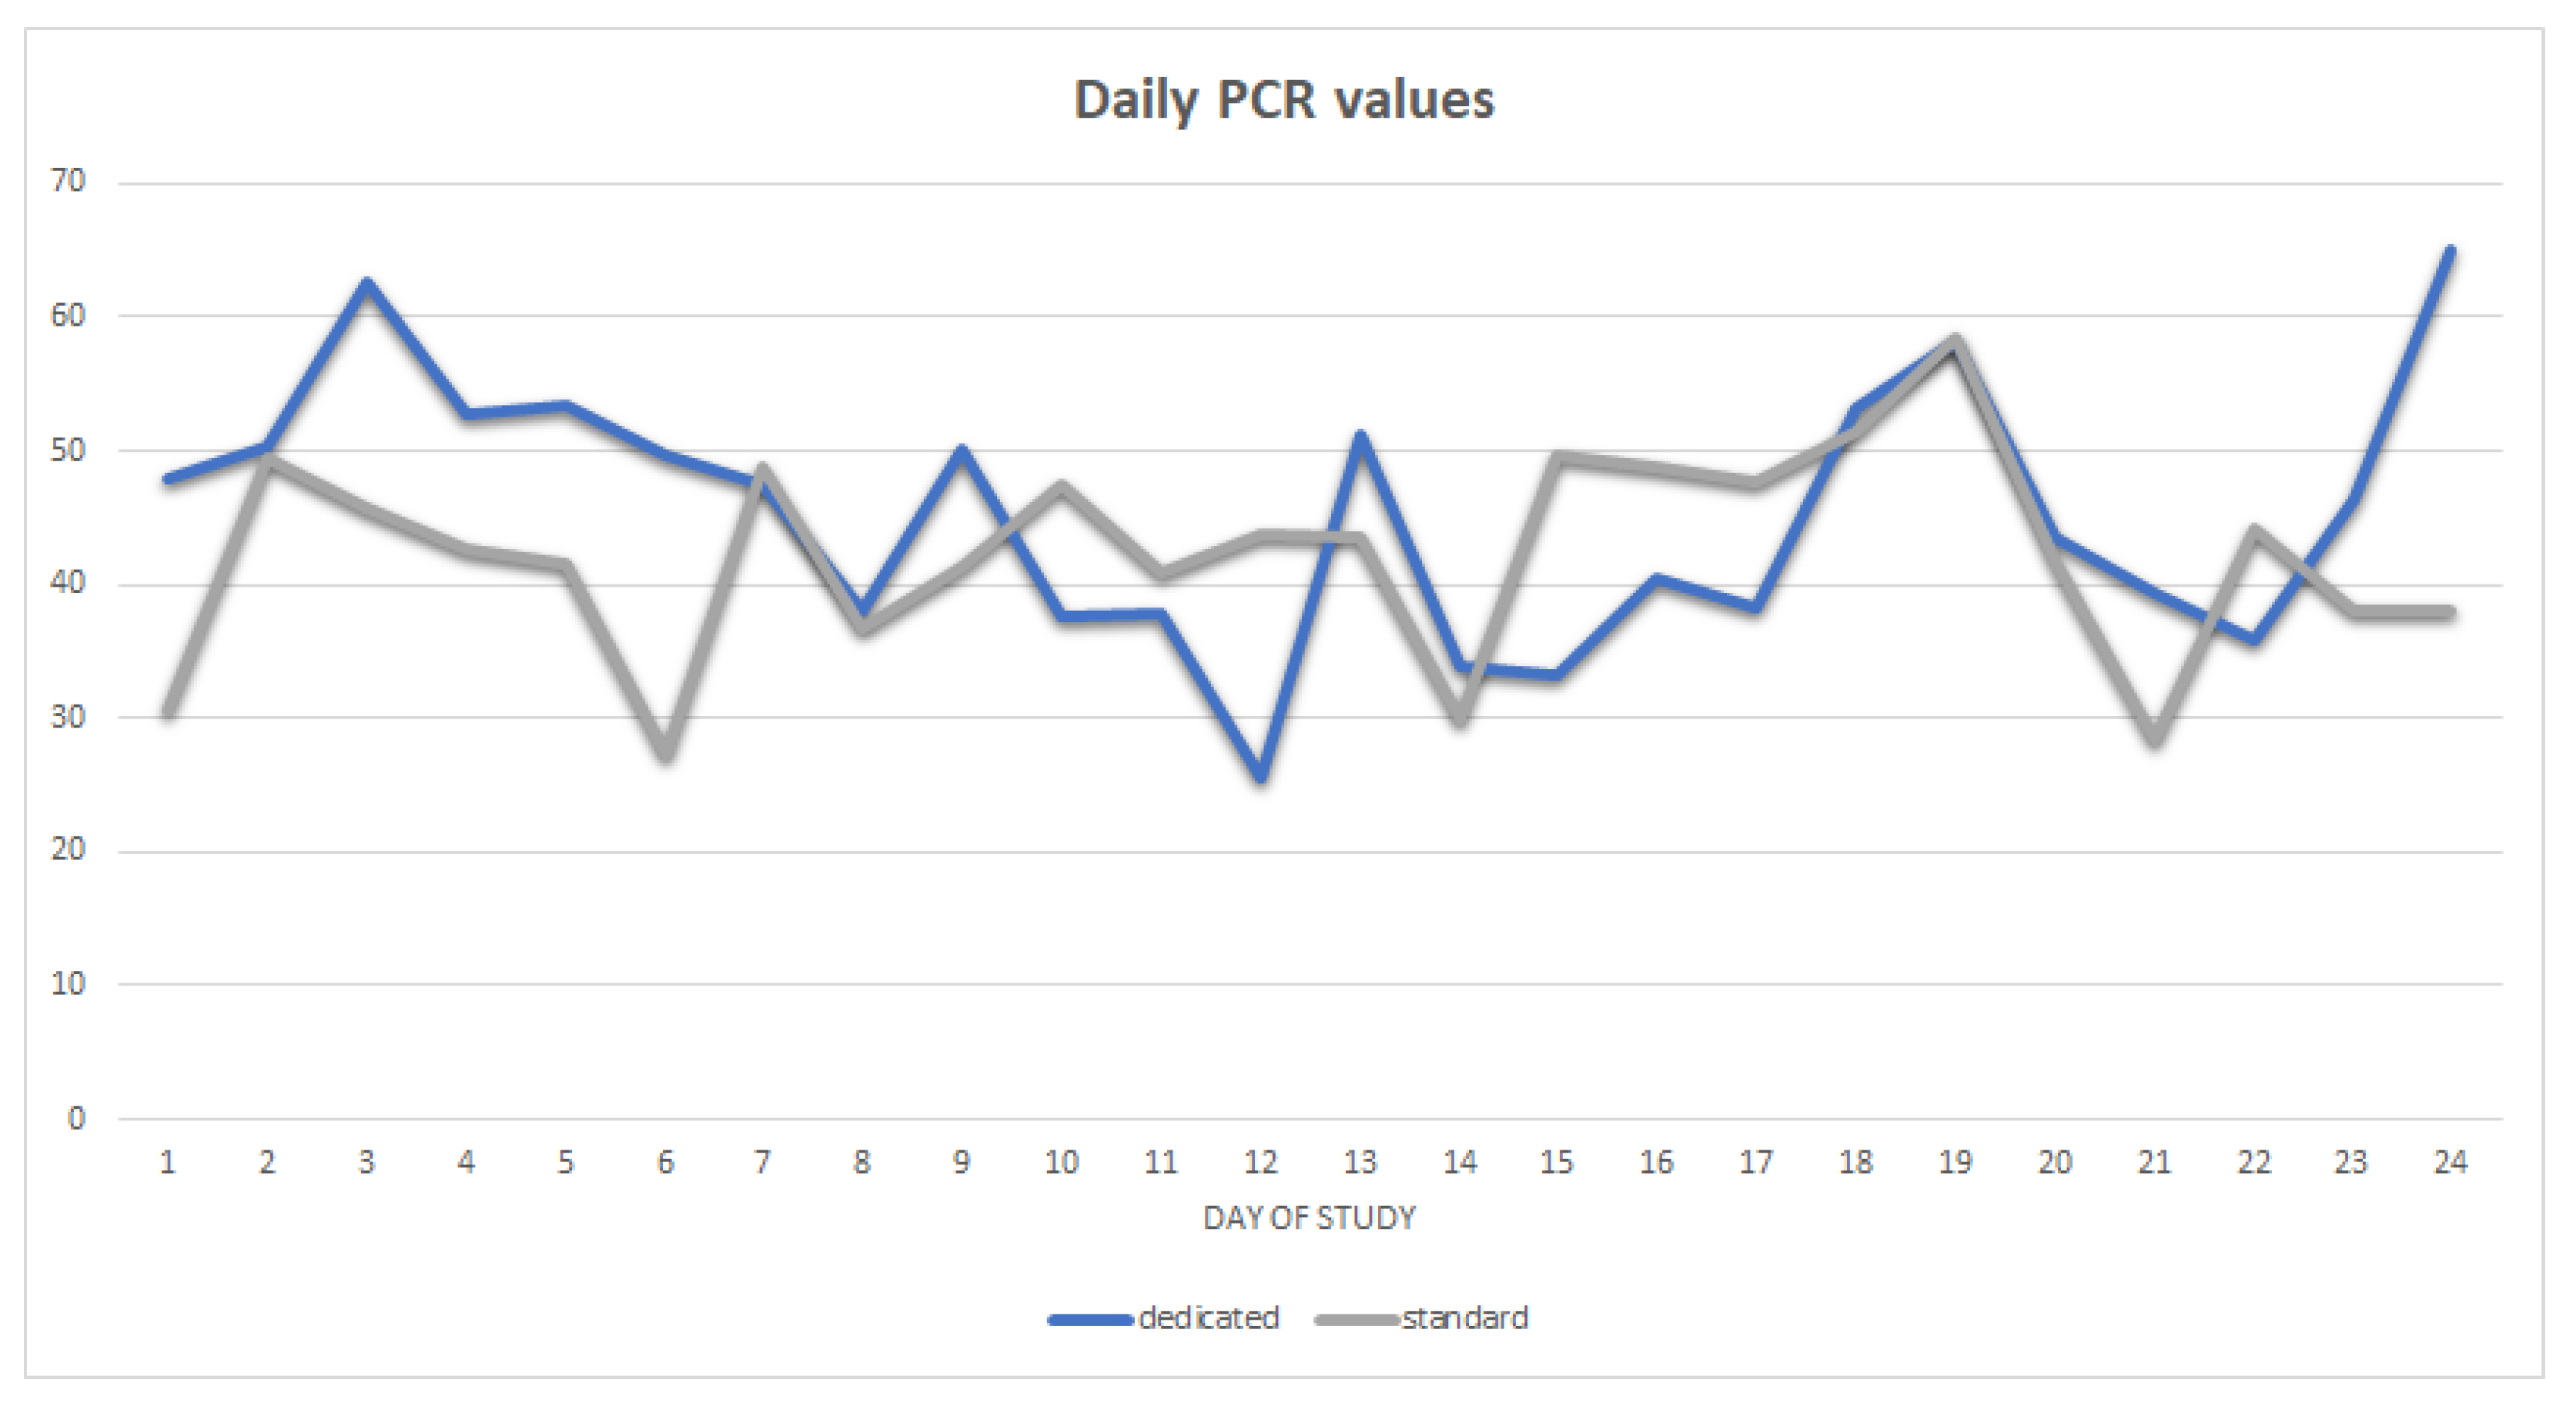
The changes in daily PCR for the two groups of customers surveyed are shown in Figure 6. Blue represents the average daily PCR values for the dedicated UI variant, while grey indicates the corresponding PCR values for the standard UI variant.
The analysis of PCR values does not decisively indicate whether a dedicated interface improves the alignment of customer behavior with the expected purchase path. The next step should therefore be a statistical analysis of the results obtained so that the hypothesis can be confirmed or rejected.
The dataset sizes for CVV values in both the comparison group and the study group were close to 3000 each. Given the dataset size, and relying on the central limit theorem, it is reasonable to assume the normality condition of the distributions, forming the basis for applying the two-sample t-test for unequal variance.
Based on the results obtained (Table 2), at a significance level of , there are grounds for rejecting hypothesis of equality of mean CVV scores for the comparison group (receiving the standard interface variant) and the research group (receiving the dedicated interface variant).
Simultaneously, there are reasons to accept hypothesis , indicating that CVV values were higher in the study group. This suggests that the dedicated variant of the user interface successfully influenced customer behavior, making them more likely to follow the expected purchase path.
5. Discussion
The conducted study validated the basic concept of the framework, allowing the comprehensive provision of dedicated UIs based on e-commerce customer behavior. All components of the solution were implemented and validated, achieving one of the objectives of the study.
Verification of the dedicated UI variant’s impact on customer behavior relied on the analysis of PCR values and the associated CVV indicator. These indicators, proposed for the research, enable an analysis beyond simple microconversion verification while not confining the research to customers who placed orders, as in macroconversion analysis.
The PCR index averages user session scores over a selected period (e.g., 1 day, 1 week, 1 month, the entire research period), providing a rough assessment of the impact of an interface variant (i.e., whether, on average, customers receiving an interface variant are more likely to follow the expected path in the webshop). However, the results of PCR calculations for daily periods presented here show that the interpretation of the results is not necessarily obvious. Analyzing the graph showing the change in PCR values from one day to the next during the study period, it is difficult to draw clear conclusions. At most, calculating PCR values for the entire study period reveals a 10.25% higher PCR for the dedicated variant compared to the standard interface; however, is this difference large enough to be considered significant?
The formal testing of variable distributions describing customer behavior using the CVV index provides a methodical approach to analyzing the impact of UI changes. In this study, the research hypothesis associated with CVV was tested using a two-sample t-test. The results supported rejecting the hypothesis of equal mean CVV values for the two UI variants, indicating that the interface design change influences e-commerce customer behavior. This approach allows the impact of a specific interface to be formally verified and limits the arbitrariness of the interpretation of the results so that it can form the basis for decisions to accept/reject the user interface modification under investigation in a possible UI auto-adaptation mechanism.
While direct comparisons with other results are challenging due to the absence of analogous studies using different frameworks, the benefits of implementing a multivariant solution, as measured by the PCR indicator, can be compared with studies focusing on macroconversion indicators such as CR and AOV [24]. In both cases, tangible benefits of the dedicated UI variant mechanism are evident, ensuring consistent and promising conclusions regardless of the adopted measures. It is worth adding that further studies will include the analysis of more UI variants served to different customer segments. Such an extension of the described experiment will allow in-depth verification of the impact of changes on e-commerce performance indicators.
6. Conclusions
The aim of implementing a solution providing dedicated interfaces for specific customer groups is to enhance satisfaction with the e-commerce experience and improve business efficiency. The pilot version of the platform was implemented to test the assumptions of the framework designed to achieve this goal.
The results obtained validated the presented concept and provided a provisional assessment of the effectiveness of serving dedicated e-commerce user interfaces, paving the way for the solution’s implementation in future online shops.
The research also included an analysis of UI modifications’ impact on the behavior of the selected customer cluster. The modifications were tailored to the characteristics of this group, and their implementation facilitated the verification of the relationship between the served UI variant and customer behavior. The PCR and CVV metrics defined for the framework discussed were used to assess the impact. These metrics make it possible to monitor the changes made to the UI more easily and comprehensively, without having to rely on macroconversion measures, which, although crucial in e-commerce, require a long time to verify the results in a statistically significant way.
However, the limitations of the approach presented must be taken into account, particularly with the amount of data required for the mechanism to work effectively. The amount of adequate information about user behavior must be large enough for the machine learning techniques used to produce reliable results. This can be a significant barrier for small online shops. For the same reason, another limitation may arise from the cost associated with running the mechanism, related to the need for server resources to store and process the data. The decision to implement a multivariant UI should, therefore, be based on a detailed cost–benefit analysis, including both the potential benefits and the costs.
In summary, the presented framework enables the provision of different UI variants in e-commerce, utilizing machine learning methods to analyze customer behavior, identify usage patterns, analyze shopping habits, and ultimately group them. This is a new approach to the use of artificial intelligence in e-commerce, as it is not limited to user interface elements such as product recommendations but allows for full personalization of the online store design.
This study contributes both theoretically and practically. The theoretical aspects expand on previous research on adaptive user interfaces for information systems within the broader trend of data-driven personalization. On the practical side, the paper highlights the potential of the proposed framework, demonstrating tangible business benefits while acknowledging the limitations of its implementation in e-commerce environments.
Future research avenues could involve evaluating the platform’s performance in other online shops to confirm the influence of UI modifications on customer behavior in diverse business realities. Expanding the mechanisms for data collection and processing, including alternative clustering methods and machine learning algorithms, could enhance the platform’s capabilities. Another direction could explore using multivariant user interfaces to address the needs of users with special requirements. For example, different UI variants offer the possibility of designing a version for people with disabilities, a version that reduces the carbon footprint of an online shop, or versions with different content styles. This is a direction that can give organizations financial and marketing advantages in a dynamic e-commerce market. At the same time, the challenges associated with the practical implementation of the framework described should be analyzed in more detail. Clearly, it is not a solution for every e-shop, as it requires the collection and processing of large amounts of data, and it may not be economically viable for small businesses due to the cost of using machine learning techniques. Determining the conditions under which a multivariant UI approach is cost-effective may also be a subject for future research.
Funding
The project “Self-adaptation of the online store interface for the customer requirements and behavior” was co-funded by the National Centre for Research and Development under Sub-Action 1.1.1 of the Operational Programme Intelligent Development 2014–2020.
Data Availability Statement
The data that were used in the study have been made available in a public repository https://dataverse.harvard.edu/dataset.xhtml?persistentId=doi:10.7910/DVN/ROBI8V, accessed on 1 February 2024.
Conflicts of Interest
The authors declare no conflict of interest.
References
- Browne, D. Adaptive User Interfaces; Academic Press: Cambridge, MA, USA, 2016. [Google Scholar]
- Miraz, M.H.; Maaruf, A.; Excell, P.S. Adaptive user interfaces and universal usability through plasticity of user interface design. Comput. Sci. Rev. 2021, 40, 100363. [Google Scholar] [CrossRef]
- Khan, S.B.; Chandna, S. Chapter 1—Introduction to human-computer interaction using artificial intelligence. In Innovations in Artificial Intelligence and Human-Computer Interaction in the Digital Era; Elsevier: Amsterdam, The Netherlands, 2023; pp. 1–6. [Google Scholar]
- Lavie, T.; Meyer, J. Benefits and costs of adaptive user interfaces. Int. J. Hum. Comput. Stud. 2010, 68, 508–524. [Google Scholar] [CrossRef]
- Cakar, T.E.; Rızvanoglu, K.; Ozturk, O.; Çelik, D.Z. Chapter 94—The Use of Neurometric and Biometric Research Methods in Understanding the User Experience of First-Time Buyers in E-Commerce. In Neuroergonomics; Oxford University Press: Oxford, UK, 2018; pp. 319–320. [Google Scholar]
- Kobsa, A. Personalized hypermedia and international privacy. Commun. ACM 2002, 45, 64–67. [Google Scholar] [CrossRef]
- Montaner, M.; López, B.; de la Rosa, J.L. A Taxonomy of Recommender Agents on the Internet. Artif. Intell. Rev. 2003, 19, 285–330. [Google Scholar] [CrossRef]
- Wasilewski, A. Clusterization methods for multi-variant e-commerce interfaces. In Proceedings of the 18th Conference on Computer Science and Intelligence Systems, Warsaw, Poland, 17–20 September 2023; pp. 309–313. [Google Scholar]
- Mathivanan, N.M.N.; Ghani, N.A.M.; Janor, R.M. Analysis of k-means clustering algorithm: A case study using large scale e-commerce products. In Proceedings of the 2019 IEEE Conference on Big Data and Analytics (ICBDA), Suzhou, China, 15–18 March 2019; pp. 1–4. [Google Scholar]
- Guo, S.; Zhai, R. E-Commerce Precision Marketing and Consumer Behavior Models Based on IoT Clustering Algorithm. J. Cases Inf. Technol. 2022, 24, 1–21. [Google Scholar] [CrossRef]
- Abdul Hussien, F.T.; Rahma, A.M.S.; Abdul Wahab, H.B. Recommendation Systems For E-commerce Systems An Overview. J. Phys. Conf. Ser. 2021, 1897, 12–24. [Google Scholar] [CrossRef]
- Alamdari, P.; Navimipour, N.; Hosseinzadeh, M.; Safaei, A.; Darwesh, A. A Systematic Study on the Recommender Systems in the E-Commerce. IEEE Access 2020, 8, 115694–115716. [Google Scholar] [CrossRef]
- Baraglia, R.; Silvestri, F. Dynamic personalization of Web sites without user intervention. Commun. ACM 2007, 50, 63–67. [Google Scholar] [CrossRef]
- Kopel, M.; Sobecki, J.; Wasilewski, A. Automatic Web-Based User Interface Delivery for SOA-Based Systems. In Computational Collective Intelligence. Technologies and Applications: 5th International Conference, ICCCI 2013, Craiova, Romania, 11–13 September 2013; Proceedings 5; Springer: Berlin/Heidelberg, Germany, 2013; pp. 110–119. [Google Scholar]
- Yu, Z. Precision Marketing Optimization Model of e-Commerce Platform Based on Collaborative Filtering Algorithm. Wirel. Commun. Mob. Comput. 2022, 3, 2906955. [Google Scholar] [CrossRef]
- Laksana, M.O.; Maulani, I.E.; Munawaroh, S. Development of E-Commerce Website Recommender System Using Collaborative Filtering and Deep Learning Techniques. J. Res. Community Serv. 2023, 4, 636–641. [Google Scholar] [CrossRef]
- Ahn, T.; Ryu, S.; Han, I. The Impact of Web Quality and Playfulness on User Acceptance of Online Retailing. Inf. Manag. 2007, 44, 263–275. [Google Scholar] [CrossRef]
- Aktas, M.S.; Pierce, M.; Fox, G.C.; Leake, D. A web based conversational case-based recommender system for ontology aided metadata discovery. In Proceedings of the 5th IEEE/ACM International Workshop on Grid Computing, Pittsburgh, PA, USA, 8 November 2004; pp. 69–75. [Google Scholar]
- Ullah, A.; Mohmand, M.I.; Hussain, H. Customer Analysis Using Machine Learning-Based Classification Algorithms for Effective Segmentation Using Recency, Frequency, Monetary, and Time. Sensors 2023, 23, 3180. [Google Scholar] [CrossRef]
- Chu, X.; Lv, D.; Zhao, D. Personalized E-commerce Website Construction Based on Data Mining. J. Phys. Conf. Ser. 2019, 1345, 362–376. [Google Scholar] [CrossRef]
- Zhao, Y.; He, Y.; Wutao, Z. Personalized Clustering Method of Cross-Border e-CommerceTopics Based on ART Algorithm. Math. Probl. Eng. 2022, 2, 8190544. [Google Scholar]
- Smereka, M.; Kolaczek, G.; Sobecki, J.; Wasilewski, A. Adaptive user interface for workflow-ERP system. Procedia Comput. Sci. 2023, 225, 2381–2391. [Google Scholar] [CrossRef]
- Sobecki, J.; Wasilewski, A.; Kolaczek, G. Self-adaptation of workflow business software to the user’s requirements and behavior. In Proceedings of the Knowledge-Based and Intelligent Information & Engineering Systems, KES 2020, Online, 16–18 September 2020; pp. 1211–1220. [Google Scholar]
- Wasilewski, A.; Pawelek-Lubera, E. Architecture of the platform for self-adaptation of e-commerce interfaces. Sci. Pap. Silesian Univ. Technol. Organ. Manag. Ser. 2023, 179, 663–679. [Google Scholar]
- Gomes, M.A.; Meisen, T. A review on customer segmentation methods for personalized customer targeting in e-commerce use cases. Inf. Syst. E-Bus. Manag. 2023, 2, 527–570. [Google Scholar] [CrossRef]
- Kohavi, R.; Mason, L.; Parekh, R.; Zheng, Z. Lessons and challenges from mining retail e-commerce data. Mach. Learn. 2004, 57, 83–113. [Google Scholar] [CrossRef]
- Chen, X.; Fang, Y.; Yang, M.; Nie, F.; Zhao, Z.; Huang, J.Z. Purtreeclust: A clustering algorithm for customer segmentation from massive customer transaction data. IEEE Trans. Knowl. Data Eng. 2018, 30, 559–572. [Google Scholar] [CrossRef]
- European Parliament and of the Council, Regulation (EU) 2016/679 of the European Parliament and of the Council of 27 April 2016 on the Protection of Natural Persons with Regard to the Processing of Personal Data and on the Free Movement of Such Data, and Repealing Directive 95/46/EC. 2016. Available online: https://eur-lex.europa.eu/eli/reg/2016/679/oj (accessed on 1 February 2024).
- Business Standard, Google Now Delays Blocking 3rd-party Cookies in Chrome to Late 2024. Available online: https://www.business-standard.com/article/technology/google-now-delays-blocking-3rd-party-cookies-in-chrome-to-late-2024-122072800244_1.html (accessed on 15 October 2023).
- Cooil, B.; Aksoy, L.; Keiningham, T.; Chu, X.; Lv, D.; Zhao, D. Approaches to Customer Segmentation. J. Relatsh. Mark. 2007, 6, 9–39. [Google Scholar] [CrossRef]
- Hong, T.; Kim, E. Segmenting customers in online stores based on factors that affect the customer’s intention to purchase. Expert Syst. Appl. 2012, 39, 2127–2131. [Google Scholar] [CrossRef]
- Ding, L.; Han, B.; Wang, S.; Li, X.; Song, B. User-centered recommendation using US-ELM based on dynamic graph model in ecommerce. Int. J. Mach. Learn. Cybern. 2019, 10, 693–703. [Google Scholar] [CrossRef]
- Dhandayudam, P.; Krishnamurthi, I. Customer Behavior Analysis Using Rough Set Approach. J. Theor. Appl. Electron. Commer. Res. 2013, 8, 21–22. [Google Scholar] [CrossRef]
- Singh, H.; Kaur, P. An Effective Clustering-Based Web Page Recommendation Framework for E-Commerce Websites. SN Comput. Sci. 2021, 2, 339. [Google Scholar] [CrossRef]
- Yıldız, E.; Güngör Şen, C.; Işık, E.E. A Hyper-Personalized Product Recommendation System Focused on Customer Segmentation: An Application in the Fashion Retail Industry. J. Theor. Appl. Electron. Commer. Res. 2023, 18, 571–596. [Google Scholar] [CrossRef]
- Xiahou, X.; Harada, Y. B2C E-Commerce Customer Churn Prediction Based on K-Means and SVM. J. Theor. Appl. Electron. Commer. Res. 2022, 17, 458–475. [Google Scholar] [CrossRef]
- Chatterjee, R.P.; Deb, K.; Banerjee, S.; Das, A.; Bag, R. Web Mining Using K-Means Clustering and Latest Substring Association Rule for E-Commerce. J. Mech. Contin. Math. Sci.s 2019, 14, 28–44. [Google Scholar]
- Li, Y.; Qi, J.; Chu, X.; Mu, W. Customer Segmentation Using K-Means Clustering and the Hybrid Particle Swarm Optimization Algorithm. Comput. J. 2022, 66, 941–962. [Google Scholar] [CrossRef]
- Wu, Z.; Jin, L.; Zhao, J.; Jing, L.; Chen, L. Research on Segmenting E-Commerce Customer through an Improved K-Medoids Clustering Algorithm. Comput. Intell. Neurosci. 2022, 2022, 9930613. [Google Scholar] [CrossRef]
- Moshkovitz, M.; Dasgupta, S.; Rashtchian, C.; Frost, N. Explainable k-means and k-medians clustering. In Proceedings of the International Conference on Machine Learning 2020, Online, 13–18 July 2020; pp. 7055–7065. [Google Scholar]
- Triandini, E.; Hermawati, F.A.; Suniantara, I.K.P. Hierarchical Clustering for Functionalities E-Commerce Adoption. J. Ilmiah KURSOR 2020, 10, 111–118. [Google Scholar] [CrossRef]
- Wasilewski, A.; Przyborowski, M. Clustering Methods for Adaptive e-Commerce User Interfaces. In International Joint Conference on Rough Sets; Campagner, A., Urs Lenz, O., Xia, S., Ślęzak, D., Wąs, J., Yao, J., Eds.; Springer Nature: Cham, Switzerland, 2023; Volume 14481, pp. 511–525. [Google Scholar]
- Wang, L.; Jing, Y. Collocating Recommendation Method for E-Commerce Based on Fuzzy C-Means Clustering Algorithm. J. Math. 2022, 2022, 7414419. [Google Scholar] [CrossRef]
- Andriyani, F.; Puspitarani, Y. Performance Comparison of K-Means and DBScan Algorithms for Text Clustering Product Reviews. SinkrOn 2022, 7, 944–949. [Google Scholar] [CrossRef]
- Tsekouras, D.; Dellaert, B.G.C.; Donkers, B.; Häubl, G. Hierarchical Clustering for Functionalities E-Commerce Adoption. J. Acad. Mark. Sci. 2020, 48, 186–202. [Google Scholar] [CrossRef]
- Choudhary, V.; Zhang, Z. Product Recommendation and Consumer Search. J. Manag. Inf. Syst. 2023, 40, 752–777. [Google Scholar] [CrossRef]
- Rebelo, M.A.; Coelho, D.; Fernandes, F.; Pereira, I. A New Cascade-hybrid Recommender System approach tailored for the Retail Market. Int. J. Comput. Inf. Syst. Ind. Manag. Appl. 2022, 14, 213–225. [Google Scholar]
- Adomavicius, G.; Bockstedt, J.C.; Curley, S.P.; Zhang, J. Effects of online recommendations on consumers’ willingness to pay. Inf. Syst. Res. 2018, 29, 84–102. [Google Scholar] [CrossRef]
- Basu, S. Personalized product recommendations and firm performance. Electron. Commer. Res. Appl. 2020, 48, 101074. [Google Scholar] [CrossRef]
- Gunawan, R.; Anthony, G.; Vendly; Anggreainy, M.S. The Effect of Design User Interface (UI) E-Commerce on User Experience (UX). In Proceedings of the 2021 6th International Conference on New Media Studies (CONMEDIA), Tangerang, Indonesia, 12–13 October 2021; pp. 95–98. [Google Scholar]
- Wu, R.S.; Chou, P.H. Customer segmentation of multiple category data in e-commerce using a soft-clustering approach. Electron. Commer. Res. Appl. 2011, 10, 331–341. [Google Scholar] [CrossRef]
- ISO/IEC 11578:1996; Information Technology. Open Systems Interconnection. Remote Procedure Call (RPC). International Organization for Standardization: Geneva, Switzerland, 2001.
- Ester, M.; Kriegel, H.-P.; Sander, J.; Xu, X. A density-based algorithm for discovering clusters in large spatial databases with noise. In Proceedings of the Second International Conference on Knowledge Discovery and Data Mining, Portland, OR, USA, 2–4 August 1996; pp. 226–231. [Google Scholar]
- Zhang, T.; Ramakrishnan, R.; Livny, M. BIRCH: An efficient data clustering method for very large databases. ACM SIGMOD Rec. 1996, 25, 103–114. [Google Scholar] [CrossRef]
- Ah-Pine, J. An Efficient and Effective Generic Agglomerative Hierarchical Clustering Approach. J. Mach. Learn. Res. 2018, 19, 1615–1658. [Google Scholar]
- Patel, E.; Kushwaha, D.S. Clustering Cloud Workloads: K-Means vs Gaussian Mixture Model. Procedia Comput. Sci. 2020, 171, 158–167. [Google Scholar] [CrossRef]
- Sabanoglu, T. Metrics Used by U.S. Retailers to Measure Personalization Initiative Success. 2019. Available online: https://www.statista.com/statistics/1115435/metrics-used-by-us-retailers-to-measure-personalization-initiative-success/ (accessed on 15 October 2023).
- van der Maaten, L.; Hinton, G. Visualizing Data using t-SNE. J. Mach. Learn. Res. 2008, 9, 2579–2605. [Google Scholar]
Figure 1.
Functional framework for multi-variant e-commerce user interfaces.

Figure 2.
Expected customer journey with customer action scores.

Figure 3.
Interface variant enhancement process.

Figure 4.
Clusters visualization (t-SNE method).

Figure 5.
Number of user sessions.

Figure 6.
Number of user sessions.


Table 1.
Features of the generated clusters.
| Cluster 0 | Cluster 1 | Cluster 2 | Cluster 3 | |
|---|---|---|---|---|
| size (users) | 19395 | 18998 | 27277 | 28088 |
| size (percentage) | 20.6862% | 20.2628% | 29.0930% | 29.9580% |
| actions (average) | 125.5319 | 14.1690 | 53.9518 | 17.5373 |
| events (average) | 37.5710 | 4.1705 | 16.7635 | 3.2924 |
| revenue (average) | 13.1089 | 0.3927 | 5.5892 | 0.0722 |
Table 2.
A two-sample t-test—results for .
| Standard UI | Dedicated UI | |
|---|---|---|
| Mean | 42.5609 | 46.9233 |
| Variance | 5487.2088 | 8543.2050 |
| Observations | 2958 | 2974 |
| df | 5674 | |
| t Stat | −2.0064 | |
| P(T ≤ t) one-tail | 0.02243 | |
| t Critical one-tail | 1.6451 | |
| critical region |
Disclaimer/Publisher’s Note: The statements, opinions and data contained in all publications are solely those of the individual author(s) and contributor(s) and not of MDPI and/or the editor(s). MDPI and/or the editor(s) disclaim responsibility for any injury to people or property resulting from any ideas, methods, instructions or products referred to in the content. |
© 2024 by the author. Licensee MDPI, Basel, Switzerland. This article is an open access article distributed under the terms and conditions of the Creative Commons Attribution (CC BY) license (https://creativecommons.org/licenses/by/4.0/).
Share and Cite
MDPI and ACS Style
Wasilewski, A. Functional Framework for Multivariant E-Commerce User Interfaces. J. Theor. Appl. Electron. Commer. Res. 2024, 19, 412-430. https://doi.org/10.3390/jtaer19010022
AMA Style
Wasilewski A. Functional Framework for Multivariant E-Commerce User Interfaces. Journal of Theoretical and Applied Electronic Commerce Research. 2024; 19(1):412-430. https://doi.org/10.3390/jtaer19010022
Chicago/Turabian StyleWasilewski, Adam. 2024. "Functional Framework for Multivariant E-Commerce User Interfaces" Journal of Theoretical and Applied Electronic Commerce Research 19, no. 1: 412-430. https://doi.org/10.3390/jtaer19010022