
How Does the Exchange Rate and Its Volatility Influence FDI to Canada? A Disaggregated Analysis

Department of Economics, Faculty of Arts, University of New Brunswick, Fredericton, NB E3B 5A3, Canada
*
Author to whom correspondence should be addressed.
J. Risk Financial Manag. 2024, 17(2), 88; https://doi.org/10.3390/jrfm17020088
Submission received: 28 December 2023
/
Revised: 30 January 2024
/
Accepted: 4 February 2024
/
Published: 18 February 2024
(This article belongs to the Section Financial Markets)
Abstract
:This study investigates the relationship between the real effective exchange rate (REER) and its volatility with the net inflow of foreign direct investment (FDI) to Canada, placing a novel emphasis on sector-level analysis. The study utilizes time series data from 2007 to 2022 and employs the autoregressive distributed lag (ARDL) approach to assess short-run and long-run relationships between the said variables. The findings reveal significant impacts of changes in REER, its volatility, and GDP on net FDI in the short run, with lasting effects of REER and its volatility, lagged GDP, and trade openness on FDI in the long run. At the sectoral level, FDI inflows in energy and mining, manufacturing, finance, and insurance exhibit significant sensitivity to changes in REER. Simultaneously, the volatility of REER has a significant impact on FDI inflows in manufacturing industries and the finance and insurance sector in the short run. In the long run, REER exerts a significant influence on the net FDI inflows in energy and mining, as well as manufacturing industries. The asymmetry in findings suggests a need for sector-specific attention to retaining and attracting FDI to Canada.
1. Introduction
Foreign direct investment (FDI) is widely recognized as a significant driver of economic growth and development (Cushman 1985; Fauzel et al. 2015; Vincent et al. 2017). Compared to other types of capital inflows, FDI is more favourable for sustained growth (Walsh and Yu 2010). Based on the endogenous growth theory, one could argue that foreign investment surpasses domestic investment in terms of productivity, owing to its ability to introduce not only capital but also advanced technology and expertise to the recipient nation (Abdullah and Chowdhury 2020). We focus on two specific pathways through which FDI impacts economic growth. Primarily, FDI engenders growth by fostering trade linkages between foreign subsidiaries, local and regional suppliers, and parent enterprises, thereby capitalizing on a streamlined international division of labour (Blattner 2006). Secondly, FDI facilitates the infusion of foreign technology and managerial proficiency, consequently enabling their dissemination across various sectors within the host country.
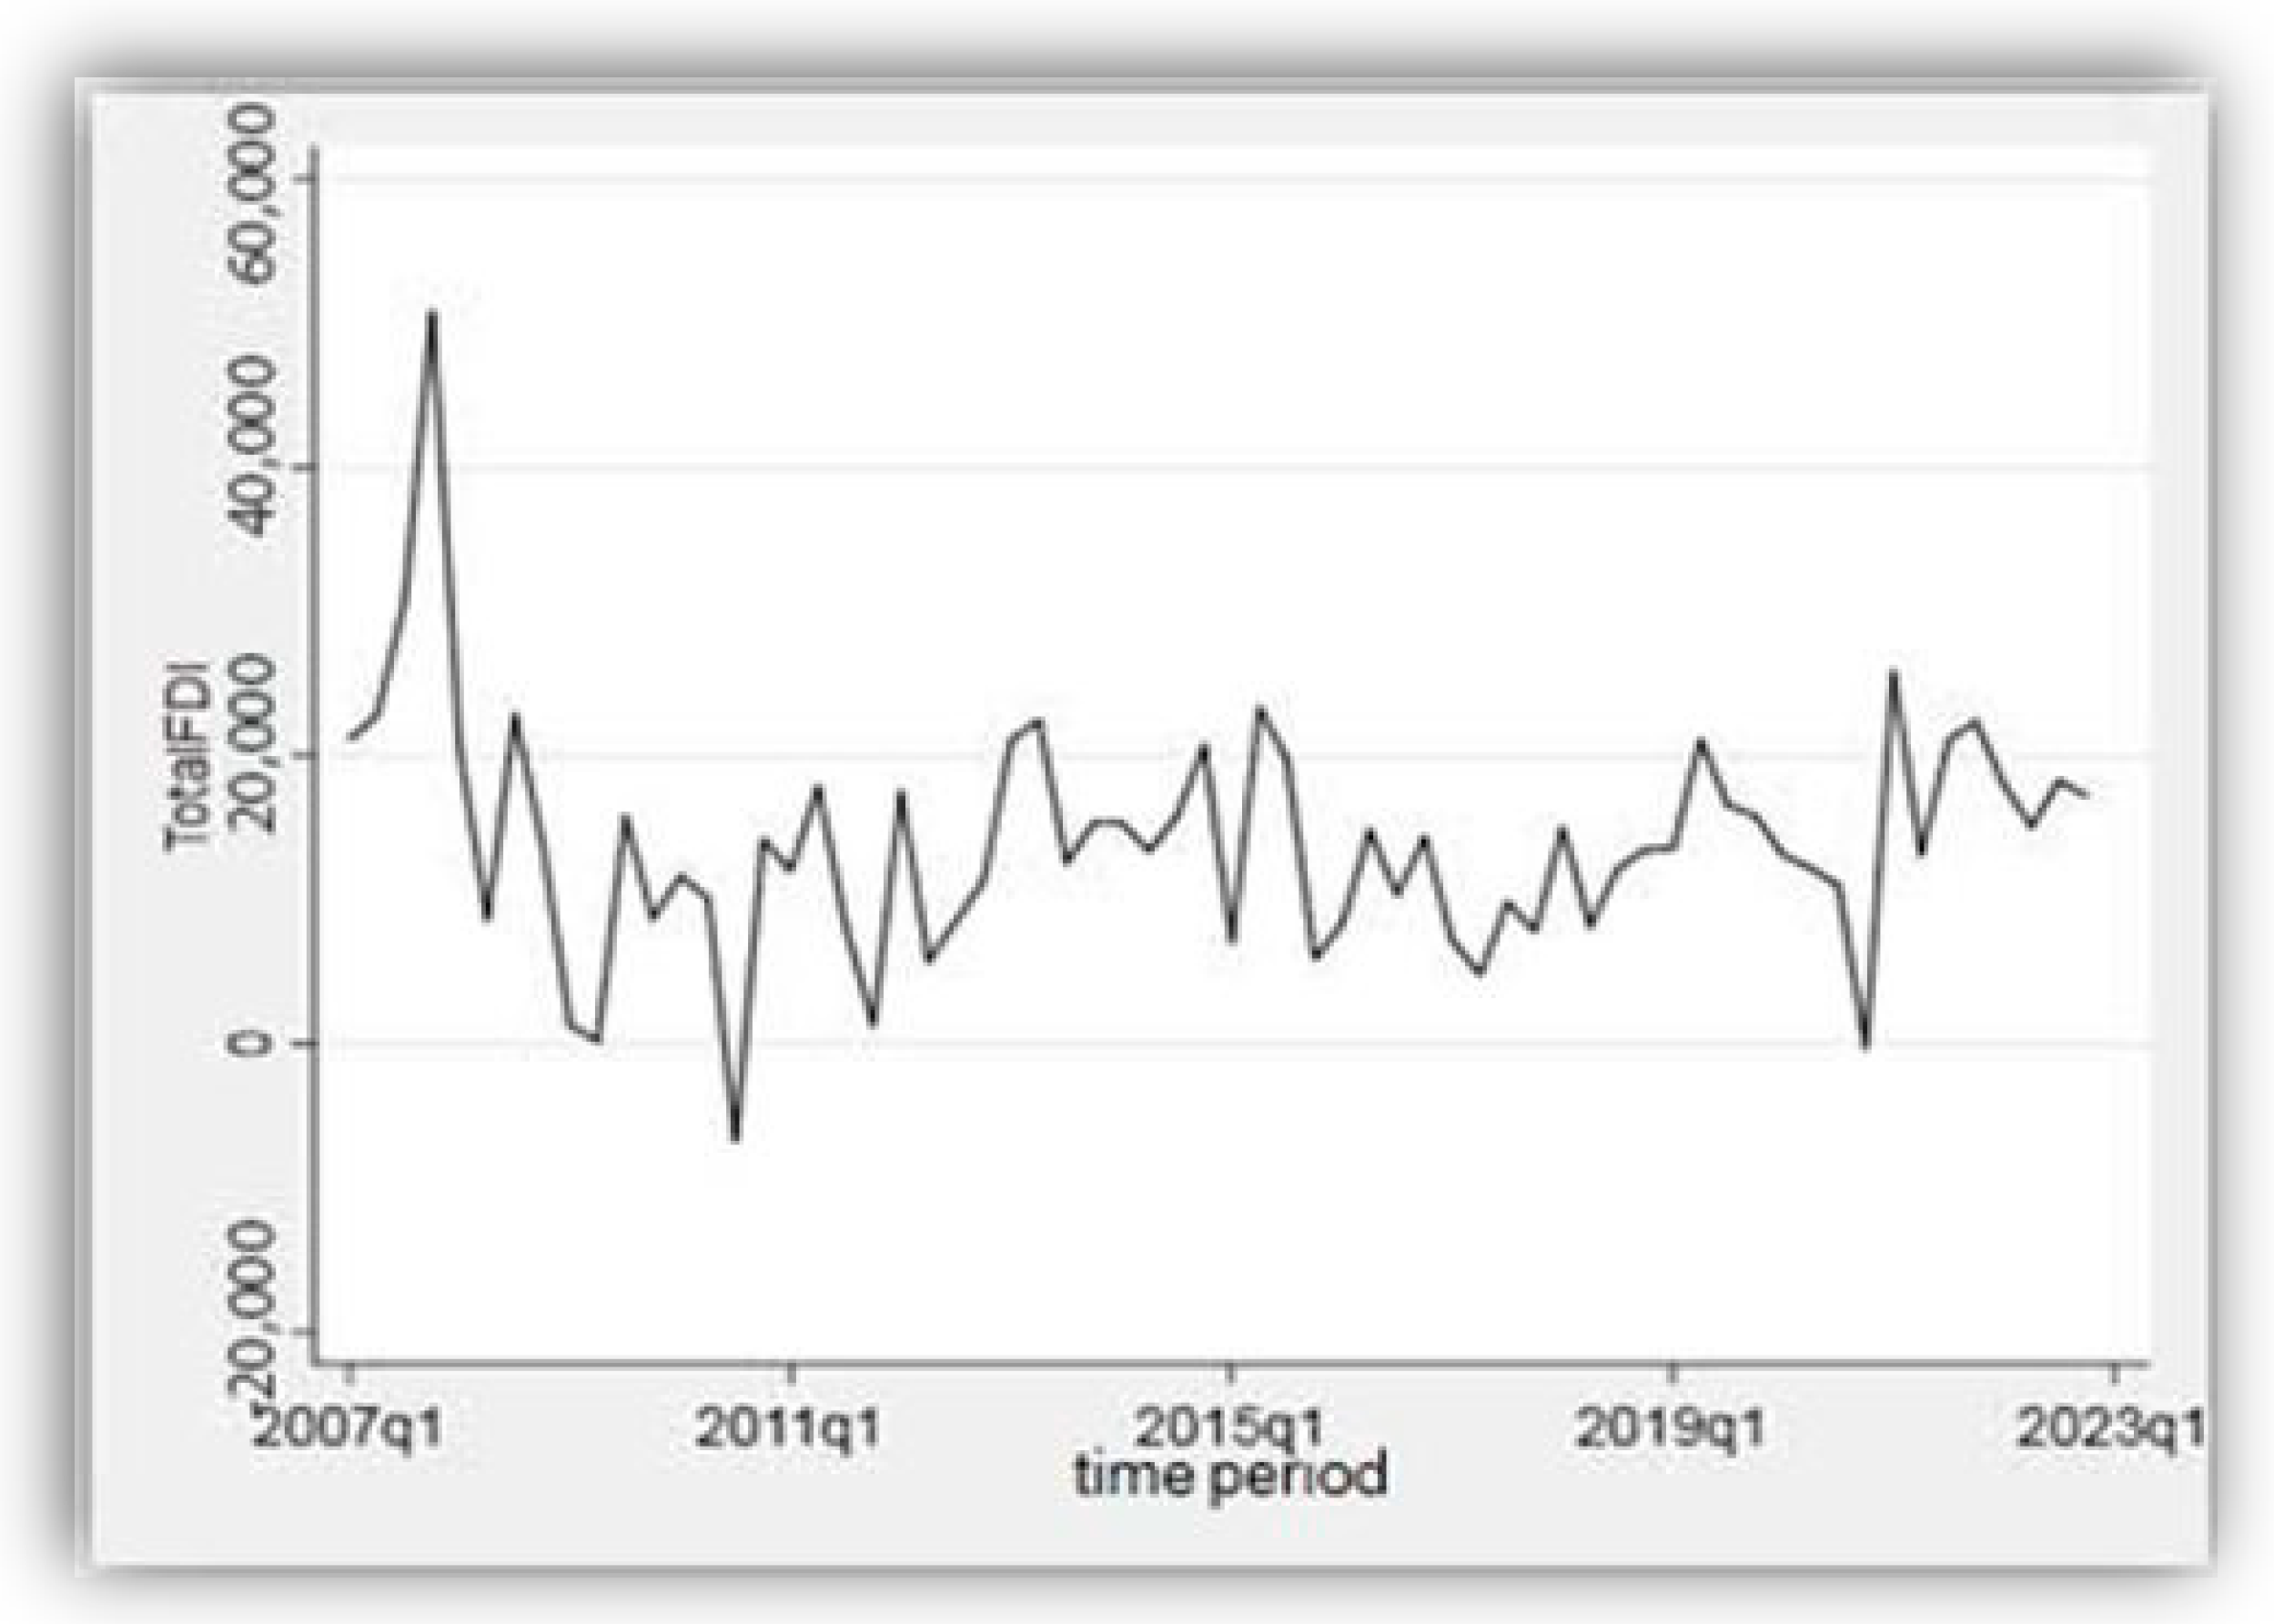
Due to the positive impact of FDI on the economy, policymakers in Canada have set their sights on attracting greater inflows of FDI to stimulate the economy. However, total FDI trends in Canada have exhibited significant fluctuations over the past two decades, lacking a consistent and gradual trajectory, as depicted in Figure 1.
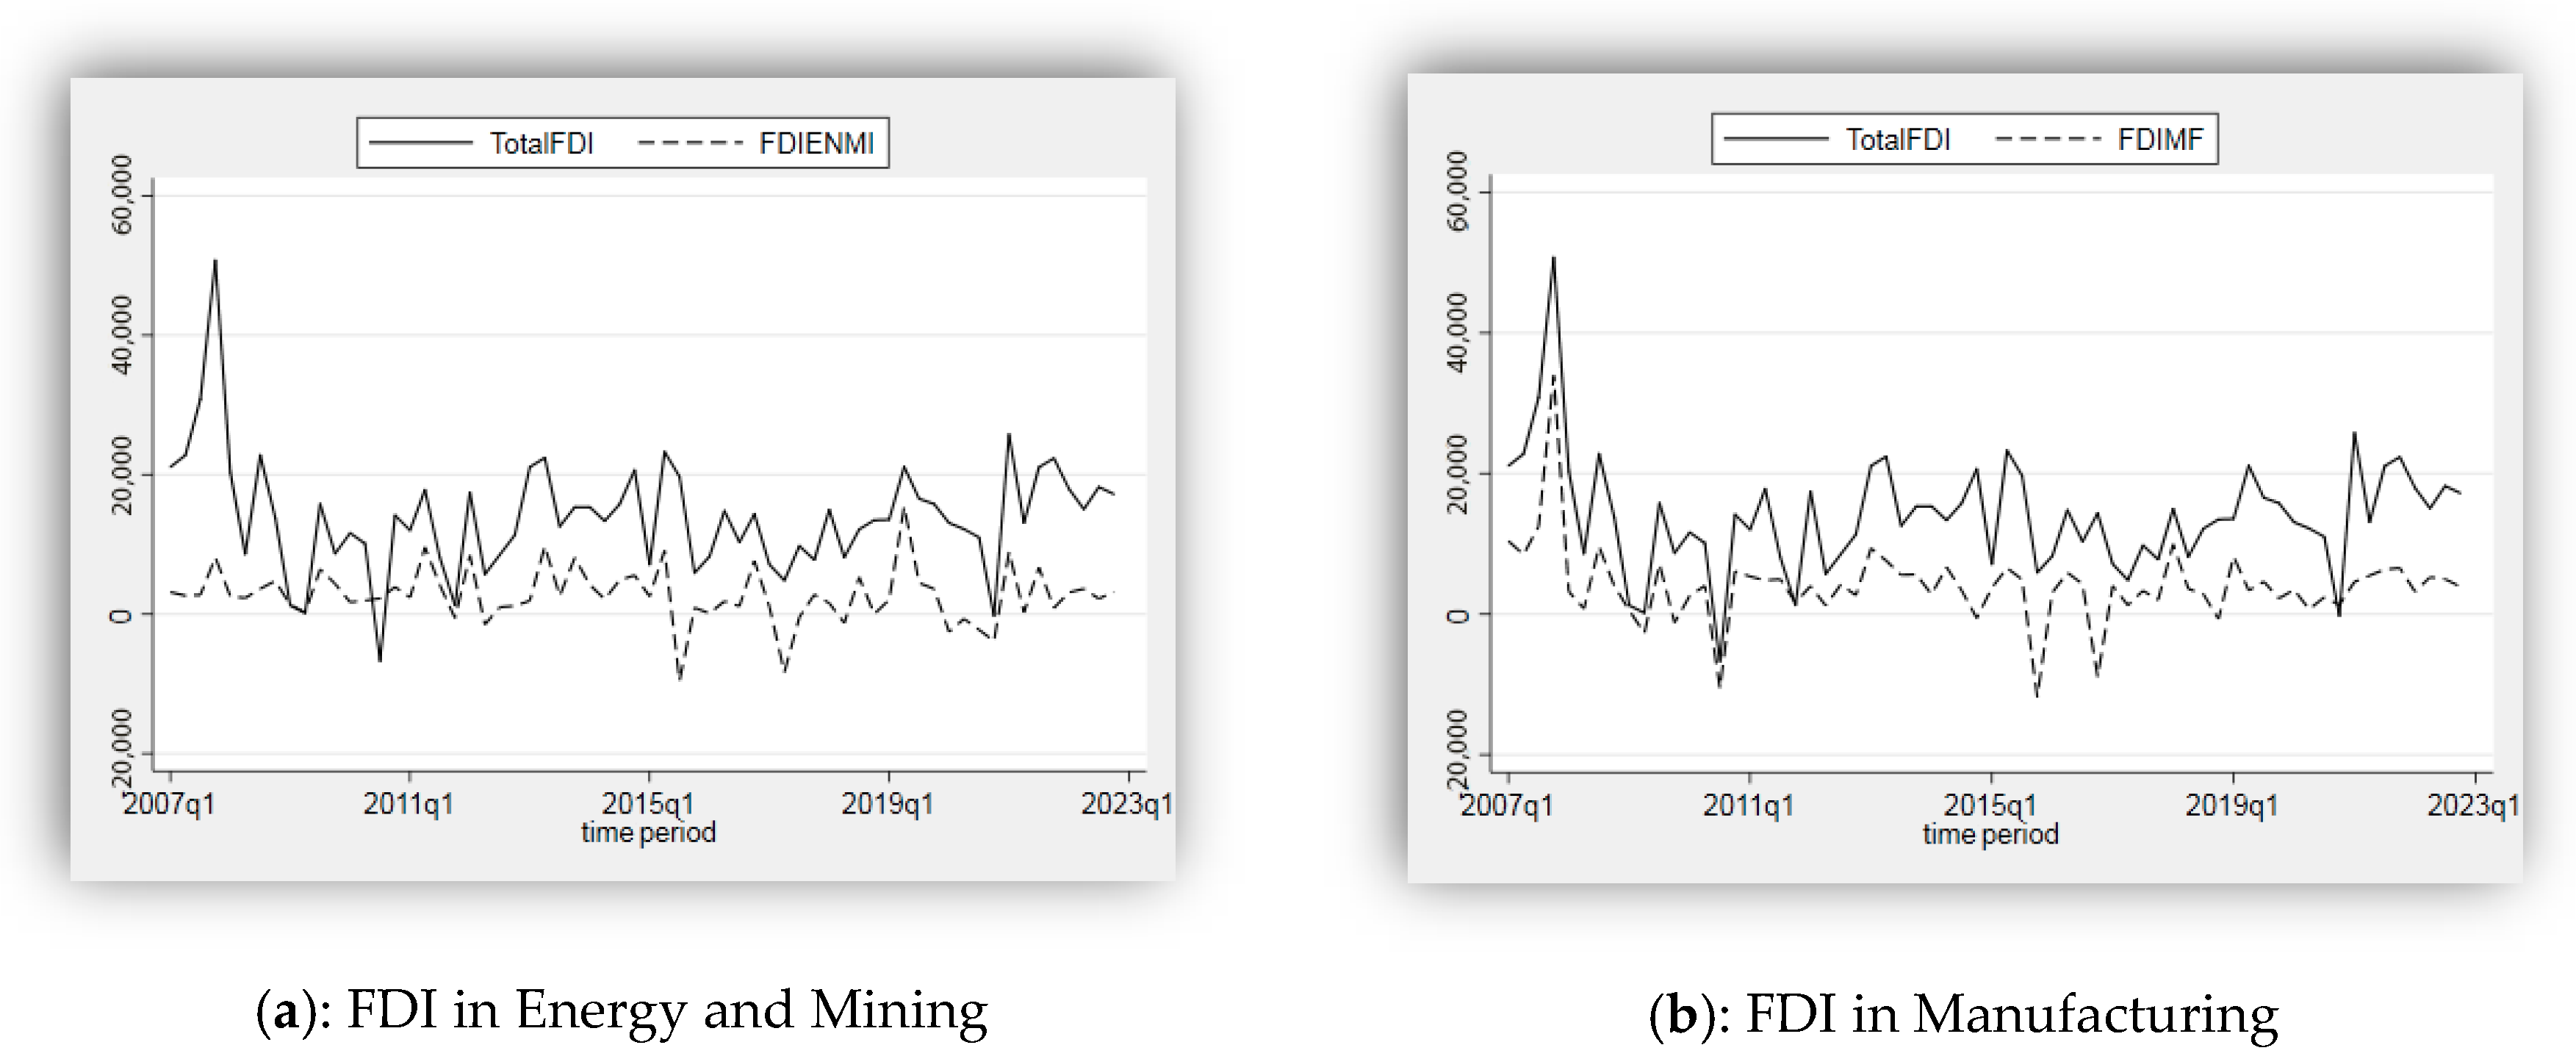
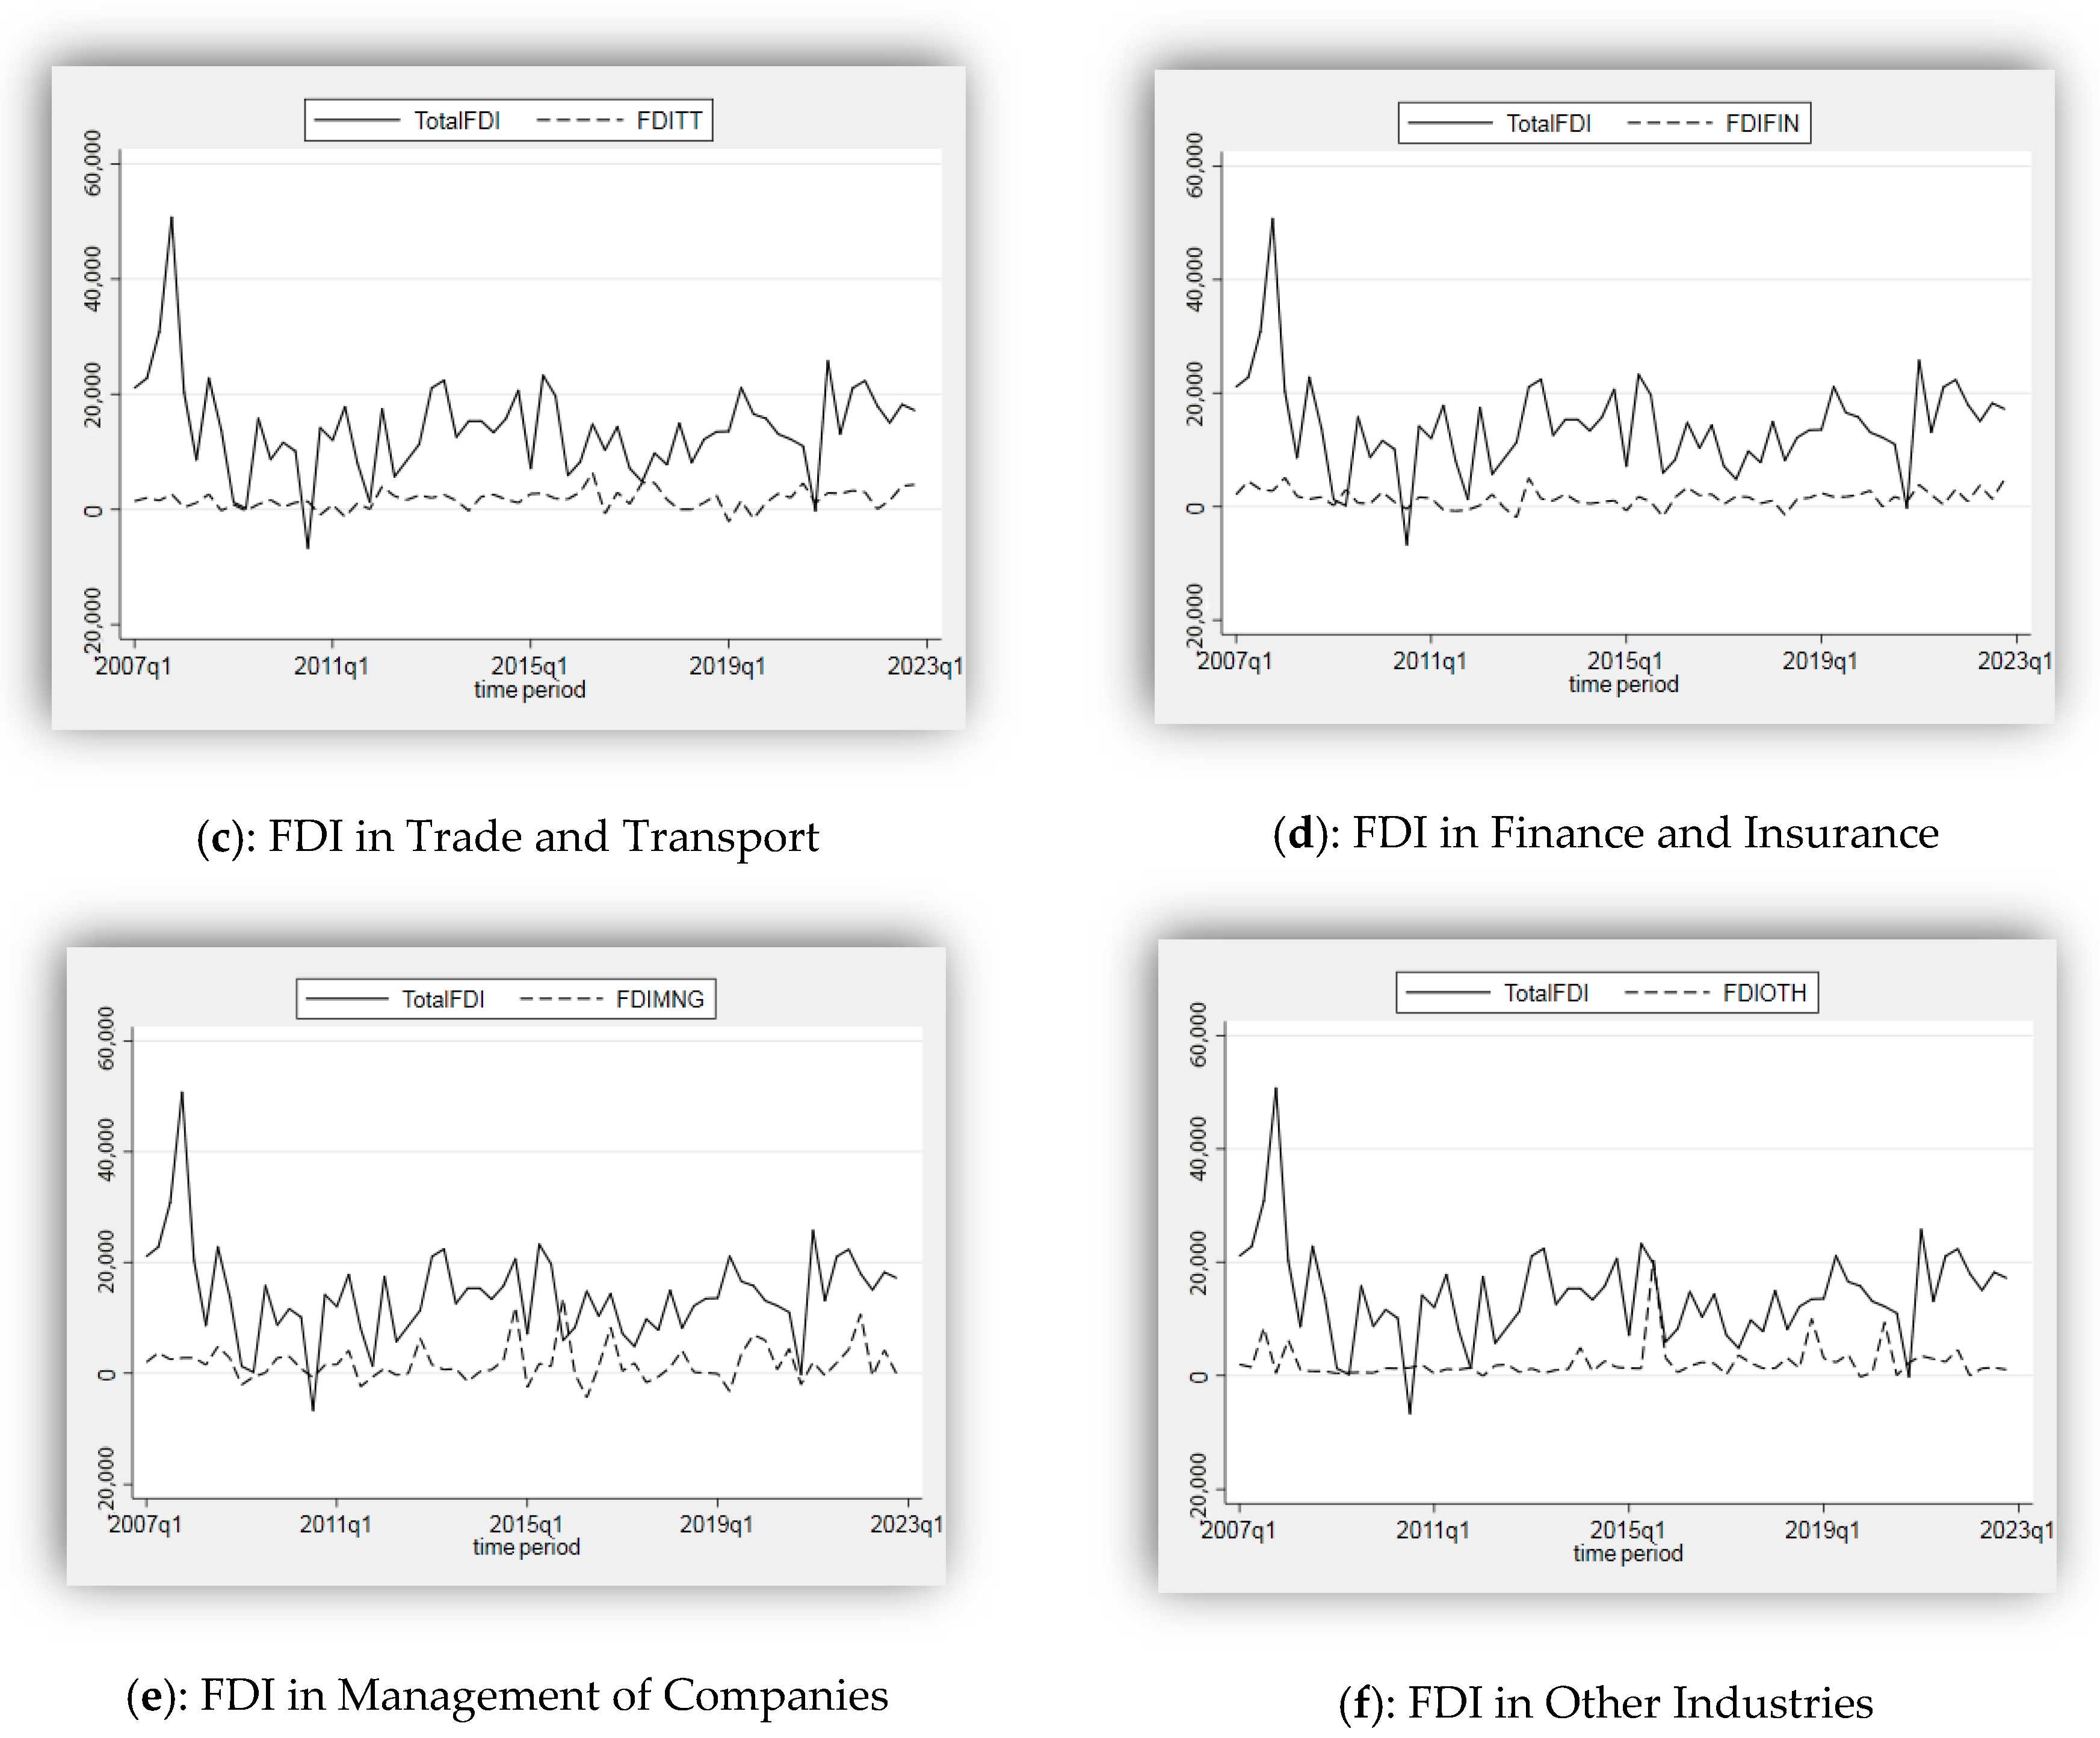
The following figures (Figure 2a–f) also present graphical representations of the trends in net FDIs in various industries or sectors during the same period. These graphs illustrate the dynamics of net FDI inflows in various sectors and compare them with the overall trend of net FDI inflow.
The trends of FDI in the manufacturing industries (FDIMF) and FDI in energy and mining (FDIENMI) demonstrate better similarity with the overall trend of FDI over most of the observed period, with a higher count of common periods of ups and downs. In contrast, other sectors or industries display fewer resemblances to the overall trend of total FDI during the analyzed period.
Figure 2.
(a–f) FDI in sectors or industries. Data source: (Statistics Canada, Table 36-10-0026-01 2023).
Figure 2.
(a–f) FDI in sectors or industries. Data source: (Statistics Canada, Table 36-10-0026-01 2023).


Table 1 also presents the amounts and percentages of each sector’s contribution to the net FDI inflows to Canada in 2022, measured in million Canadian dollars.
The table illustrates substantial fluctuations in the share of each sector within the overall net FDI. Initially, during the first quarter, net FDI in the management of companies and enterprises sector accounted for more than half of the total net FDI. Manufacturing industries and energy and mining followed closely, constituting approximately 17% each. However, in the final quarter, the finance and insurance sector emerged as the leading contributor, representing almost 28% of the total net FDI. Overall, the manufacturing industries sector exhibited significant contributions, while the management of companies and enterprises sector, initially holding the largest share, experienced a subsequent decline.
Although it is widely acknowledged that net FDI inflows have a substantial impact on the economic growth of host countries, the determinants of FDI inflows are still open to question. As a result of the transition to the floating exchange rate system after the collapse of the Bretton Woods System, the volatility of exchange rates has become a major concern for countries. Exchange rate volatility refers to all movements and changes that are effective for the depreciation/valuation of a currency (Martins 2015). In the interim, the fluctuations in exchange rates possess the potential to impact the anticipated advantages of FDI, thereby amplifying uncertainty for prospective investors. This rationale is substantiated by the fact that exchange rate volatility exerts influence on the projected returns of FDI, which are perceived as capital transfers.
Consequently, both the degree of volatility and the level of the exchange rate may influence the level of investment (Chowdhury and Wheeler 2008; Asmah and Andoh 2013). Stated differently, exchange rate volatility can either stimulate or deter FDI. Pertaining to this matter, the existing literature suggests a negative relationship between investment and the appreciation of the domestic currency, as well as measures of exchange rate volatility, although firm- and industry-specific attributes also emerge as crucial determining factors (Kyereboah-Coleman and Agyire-Tettey 2008).
While research has been conducted on the association between FDI and exchange rates, as well as the volatility of exchange rates in diverse countries and regions, it has been revealed that the strength of this relationship varies across different contexts. Moreover, the duration of the relationship, whether short-term or long-term, remains a subject of exploration, specifically across different economic sectors. To contribute to this research gap, this study aims to examine the existence of a long-run or short-run relationship between exchange rates and FDI in Canada. More importantly, an additional and novel dimension will be explored by investigating this relationship at the industry or sector level, providing a more nuanced understanding of how exchange rate dynamics impact FDI inflows within specific industries with regard to the North American Industry Classification System (NAICS).
While analyzing the net FDI inflows provides a broad view of foreign investment in Canada, sectoral analysis is indispensable for understanding the differential impact of the real effective exchange rate and its volatility on FDI across industries. It is challenging to isolate the individual performance of each sector of the economy unless they are studied independently (Moraghen et al. 2020). The reason is that different sectors in an economy have distinct characteristics, market structures, and exposure to exchange rate fluctuations. They may vary in their reliance on imported inputs, reliance on exports, and sensitivity to changes in currency values. Furthermore, each industry has its own set of factors driving FDI inflows. As a result, the impact of exchange rate movements on FDI can differ significantly across sectors. Through these endeavours, this research seeks to shed light on the intricacies of the FDI-exchange rate nexus in Canada between 2007 and 2022, thus advancing the existing body of knowledge in this field.
As such, we examine two guiding questions: (1) To what extent does the real effective exchange rate and its volatility bear significance in relation to the net FDI inflows in Canada? (2) How significant are the real effective exchange rate and its volatility concerning the net FDI inflows in various industries in Canada?
In order to investigate the interplay between variables and determine the significance of their associations in both the short run and long run, this study adopts a rigorous time series analysis. It encompasses a number of estimations considering not only overall FDI but also FDI within specific industries. The analysis incorporates stationarity tests to identify the presence of stable patterns, followed by the autoregressive distributed lag models based on the outcomes of the stationarity tests. Our findings on the determinants of the net FDI at aggregate and sectoral levels help identify which industries are more susceptible to fluctuations in exchange rates and which industries may be relatively insulated from these changes. This understanding is crucial for policymakers and investors to target and support sectors that contribute more significantly to economic growth and stability.
2. Literature Review
2.1. Theoretical Literature
The association between FDI and exchange rates can manifest in two distinct ways. One line of scholarly inquiry proposes that movements in exchange rates exert an influence on FDI. Froot and Stein (1991) present a model of FDI that explicitly outlines the relationship between the real exchange rate and FDI. The model posits that an increase in wealth stimulates investment demand, and since foreign firms possess wealth in their home currency, a depreciation of the domestic currency enhances their relative wealth position, thereby reducing their relative cost of capital. Consequently, they can engage in more competitive bidding for domestic assets. Blonigen (1997), on the other hand, developed a theory of firm-specific FDI, asserting that exchange rate movements can impact acquisition-based FDI. Acquisitions involve firm-specific assets capable of generating returns in currencies other than the one used for their purchase. A depreciation of the domestic currency enhances the reservation bid of the foreign firm while leaving the bid of the local firm unaffected. Consequently, the foreign firm becomes more likely to acquire the asset.
Recent advancements in the literature on FDI have delved into several key factors, including the underlying motives driving FDI and the complex interplay between the exchange rate and FDI. Lin et al. (2006) contend that the extent of profit exposure to exchange rate volatility hinges upon the motive behind FDI. Specifically, market-seeking FDI may heighten the susceptibility of profit to exchange risks, while export-substitution FDI could exert an inverse effect on profit. Conversely, Russ (2007) introduces the notion of exchange rate endogeneity into a comprehensive general equilibrium model, revealing that a multinational enterprise (MNE) response to exchange volatility is contingent upon the sources of internal shocks. According to this model, an expansionary monetary policy, accomplished through the depreciation of the host country’s currency, bolsters sales for MNEs. Conversely, an appreciation of the host country’s currency facilitates more favourable exchange rates for profit conversion but diminishes domestic market sales for MNEs.
According to Husek and Pankova (2008), the depreciation of the currency of the host country will attract FDI inflows for two reasons. First, the depreciation of the currency declines the production costs (labour and other productive inputs) in the home country, thus making the home country attractive to foreign investors. Second, the depreciation of the currency of the host country lowers the value of assets in the host country in other currencies, including the currency of the home country. As a result, the cost of FDI in foreign currency is decreasing, and the host country is becoming attractive for FDI (Asmah and Andoh 2013).
On the other hand, other strands of the literature suggest that FDI can also have an effect on exchange rate volatility. FDI can improve productivity in the traded goods sector and consequently decline real exchange rate volatility by balancing the relative prices of non-traded goods. FDI inflows cause an appreciation of the real exchange rate by increasing the capital stock in the host country. Furthermore, FDI increases existing capital stock and leads to technology to spread. Technology spillovers lead to increased production and lower prices of non-tradable goods. Therefore, FDI results in the depreciation of the real exchange rate. Nonetheless, the rise in the production of non-traded goods enlarges the disposable income, and as a result, the exchange rate appreciates (Biswas and Dasgupta 2012).
2.2. Empirical Literature
The literature suggests that exchange rates generate positive, negative, and ambiguous impacts on FDI (Kiliçarslan 2018). Aliber (1970) stands as a pioneer in exploring the impact of exchange rate fluctuations on FDI flows. His premise rested on the notion that countries with depreciated currencies aiming to enhance their purchasing power might seek to attract FDI. Another seminal study by Froot and Stein (1991) laid the foundation for examining the correlation between the real exchange rate and inward FDI in the United States. Their analysis, based on quarterly data from 1973 to 1988, revealed a significant negative relationship between FDI in various industries and the value of the U.S. dollar.
Blonigen (1997) examined the exchange rate-FDI nexus in a panel dataset of Japanese acquisitions within specific industries in the USA from 1975 to 1992. The study reported that real depreciation of the U.S. dollar against the Japanese yen resulted in significant increases in acquisition FDI in industries with firm-specific assets only. In a different context, Chen et al. (2006) indicate that exchange rate levels and volatility have a notable impact on Taiwanese firms’ outward FDI in China. Moreover, exchange rate volatility exerts a negative effect on FDI activity, particularly in industries facing substantial sunk investment costs. The study also reveals that the depreciation of the host country’s currency discourages FDI activity for cost-oriented firms.
Shifting focus to Nigeria, Osinubi and Amaghionyeodiwe (2009) investigate the implications of exchange rate volatility on FDI from 1970 to 2004 through an error correction model (ECM) and report an insignificant positive relationship between the exchange rate and inward FDI, while exchange rate volatility had a positive impact on FDI. Examining the Iranian context, Sharifi-Renani and Mirfatah (2012) evaluate the effect of exchange rate volatility on inward FDI from 1980Q2 to 2006Q3 by Johansen cointegration and report a positive relationship between FDI and exchange rate depreciation, while a negative relationship is observed with exchange rate volatility.
Looking at the ASEAN economies, Lily et al. (2014) observe that real appreciation of the Singapore dollar, Malaysian ringgit, and Philippine peso has a positive impact on FDI inflows. Kyereboah-Coleman and Agyire-Tettey (2008) use data from sub-Saharan Africa, with a specific focus on Ghana from 1970 to 2002. The findings reveal a significant negative relationship between real exchange rate volatility and FDI inflows, indicating that higher volatility tends to deter FDI into a country. This study concludes that the depreciation of the Ghanaian CEDI attracted FDI inflows, while exchange rate volatility discouraged such inflows, aligning with the researchers’ initial expectations. Hanusch et al. (2018) also report the discouraging impact of an increase in exchange rate volatility reducing FDI inflows in a panel of 80 developing and developed countries using data from 1990 to 2015. Warren et al. (2023) employed a gravity model on a dataset comprising 40 countries from 2001 to 2019. They affirmed that while the depreciation positively affects FDI, the exchange rate volatility negatively influences bilateral FDI flows. However, Warren et al. (2023) also reported challenges in estimating the gravity equation.
Goldberg and Kolstad (1995) analyze how exchange rate variations, but not volatility, affect investment by manufacturers in Japan, the U.S., Canada, and the U.K. from 1978 to 1991. They find that industries in both the U.S. and Japan are affected by exchange rate variations when they have low markups. Their results also suggest that high export shares may cause a depreciation to increase investment, while high import shares may cause a depreciation to decrease investment. Manufacturing industries in the U.K. and Canada did not appear responsive to exchange rate variations.
More recent research has also incorporated the effects of both exchange rate variations and volatility on manufacturing industries in Canada, and the results suggest a complicated relationship (Harchaoui et al. 2005). Using data from 1981 to 1997, their results suggest that an exchange rate depreciation increases investment in periods of low volatility and decreases investment during periods of high volatility. Furthermore, it appears that investment in non-information technology machinery and equipment (non-IT investment) is the most responsive to exchange rate variations and drives the results for total investment. Their work suggests the presence of an asymmetric relationship in FDI flows influenced by important industry characteristics such as export orientation and markup levels. McCloud et al. (2023) report that the interaction between exchange rate and FDI could be influenced by government stability. Nguyen et al. (2024) claim that all capital flows should not be treated alike. Based on the composition of capital flows, the relationship between exchange rate and FDI flows could vary.
Chowdhury and Wheeler (2008), employing the vector autoregressive framework, suggest that in Canada, Japan, and the United States, innovations in exchange rate uncertainty account for substantial proportions of the forecast error variance in FDI over longer time horizons. The impulse response functions indicate that if shocks to exchange rate volatility do indeed influence FDI, their impact is positive and occurs with a time lag.
The literature suggests that the relationship between FDI and exchange rates substantially varies across countries. Moreover, the relationship could significantly vary across industries. Consequently, this study seeks to address this research gap by specifically examining the impact of real exchange rate volatility on FDI within the Canadian context. The study aims to explore the presence of a long-run or short-run relationship between exchange rates and FDI in Canada at the disaggregated level, e.g., industry. Therefore, it provides a more refined understanding of how exchange rate dynamics influence the inflow of FDI within specific industries. Through this focused analysis, the study endeavours to contribute valuable insights to the existing body of knowledge.
3. Methods
Data Sources and Econometric Models
Given the absence of definitive insights from foreign direct investment theories regarding the determinants of FDI, our model is designed to examine the relationship between the real effective exchange rate, its volatility, and the FDI. Based on the existing literature, we collected data on several relevant variables. The data pertaining to GDP, trade openness, total FDI, and FDI in all industries were obtained from Statistics Canada. Additionally, the data regarding the real effective exchange rate were acquired from the Bank of Canada.
Drawing inspiration from the works of Sharifi-Renani and Mirfatah (2012), de Castro et al. (2013), and Kyereboah-Coleman and Agyire-Tettey (2008), our model is formulated as follows:
where FDI is the net flow of foreign direct investment in period t, which is the dependent variable. We replace FDI in our secondary estimations with FDI in different industries: FDIENMI (FDI in energy and mining), FDIMF (FDI in manufacturing), FDITT (FDI in trade and transportation), FDIFIN (FDI in finance and insurance), FDIMNG (FDI in management of companies and enterprises), FDIOTH (FDI in other industries).
FDIt = β0 + β1LNREERt + β2LNVOLt + β3LNGDPt + β4LNOPENt + ϵt
LNGDP represents the natural logarithm of Canada’s gross domestic product (GDP) at time t as one of the control variables, measured in millions of Canadian dollars (at market price). This logarithmic index is considered the most suitable measure for capturing the magnitude and scale of the country’s economy. A larger GDP implies a potentially more favourable environment for foreign investments. The LNOPEN variable reflects the level of trade openness as another control variable, which signifies the extent of economic integration between the national economy and the global economy. This index quantifies the total volume of trade (sum of imports and exports) relative to GDP, indicating the degree to which the host economy embraces the inflow and outflow of goods and services. In general, it is evident that a higher degree of openness, facilitating the entry and exit of goods and services, tends to enhance the incentives for FDI. However, the relationship between openness and FDI may not be clear-cut. While a direct relationship could be expected when considering FDI in the tradable sector, as mentioned earlier, the dynamics could differ in the non-tradable sector. In the latter case, openness could diminish profits from activities in the non-tradable sector.
The main independent variables are LNREER and LNVOL, which present the natural logarithm of the real effective exchange rate and the natural logarithm of the volatility of the real effective exchange rate, respectively. The real effective exchange rate is anticipated to positively influence foreign investment, as it is closely associated with efficiency-seeking strategies that aim to reduce costs and long-term asset acquisitions. To examine the exchange rate volatility, we adopt a moving average standard deviation following Sharifi-Renani and Mirfatah (2012) and Serenis and Tsounis (2012) as follows:
- xi represents the value of the real effective exchange rate at each period;
- t denotes the window mean value of the effective exchange rate;
- t represents the total number of periods (t = 64);
- k denotes the length of the moving average window (k = 4).
To enable the analysis at a quarterly level, the retrieved monthly data for the REER are converted using the averaging method.
To facilitate interpretation, all variables, with the exception of FDIt, have been logarithmically transformed. The decision to log-transform is aimed at enhancing the understanding and analysis of their relationships. However, FDIt cannot undergo logarithmic transformation due to the presence of negative observations within the net inflows of foreign direct investment2.
The presence of non-stationarity in time series data can lead to spurious regression, rendering the obtained results misleading. To address this concern, we employ both the augmented Dickey–Fuller (ADF) and Phillips–Perron unit root tests. In the presence of the variables of integrated order 0 (I(0)) and integrated order 1 (I(1)) variables, it is reasonable to consider the autoregressive distributed lag (ARDL) bound testing approach proposed by Pesaran et al. (2001) as a theoretically sound method for examining a robust long-run relationship between the real exchange rate and FDI. After conducting the relevant F-bounds test and t-tests, we report the presence of cointegration. Once the co-integrating relationship is established, the error correction model (ECM) is utilized, with the choice of the ECM framework being supported by empirical evidence. The ECM effectively incorporates the short-run dynamics with the long-run equilibrium, preserving important long-run information and mitigating issues associated with spurious relationships arising from non-stationary time series data (Shrestha and Bhatta 2018). The ARDL ECM model for assessing the relationship between the dependent variables and explanatory variables is as follows:
- ECTt−1 is the lagged error correction term;
- λ is the ECT coefficient, which denotes the parameter reflecting the rate of correction for adjustments;
- p is the lag order for the dependent variable;
- q is the lag order for the independent variables.
To begin with, the analysis explores the results for total net FDI as the dependent variable. The objective is to investigate the extent to which the independent variables are associated with total net FDI within the framework of the ARDL ECM model. Afterwards, this examination provides insights into the relationship between the chosen independent variables and their impact on FDI in different industries or sectors in Canada.
It should be noted that the ARDL model is more suitable for the small and finite sample data period (Pesaran et al. 2001). As noted by Pesaran et al. (1999), “appropriate modification of the orders of the ARDL model is sufficient to simultaneously correct the residual serial correlation and the problem of endogenous regressors”. Therefore, given that it is free of residual correlation, the ARDL method can handle the eventual phenomenon of endogeneity among variables.
For robustness, an alternative model in this research explores the impact of structural breaks or shocks on net FDI inflows in Canada, focusing on two significant events: the global financial crisis (GFC) in 2008 and the COVID-19 pandemic in 2020. According to the Government of Canada’s (2022) report about the state of trade with a special focus on FDI, foreign direct investment in Canada experienced a notable 49% drop in 2020, which was comparatively less severe than the 60% decline witnessed during the GFC from 2008 to 2009. Notably, research conducted by Moran et al. (2022) suggests that the unpredictable COVID-19 shock primarily impacted the Canadian economy in the second quarter of 2020. Additionally, the Bank of Canada’s (2008) annual report highlights that the GFC led to a sharp drop in the value of the Canadian dollar in the fourth quarter of 2008. To account for these major events, dummy variables representing 2020q2 and 2008q4 have been included in the alternative model for analysis3. This model aims to examine how these structural breaks or shocks influenced FDI patterns in Canada and shed light on the dynamics surrounding these pivotal economic moments. The alternative model is as follows:
FDIt = β0 + β1LNREERt + β2LNVOLt + β3LNGDPt + β4LNOPENt + β5Dum2008q4 + β6Dum2020q2 + ϵt
It should be noted that other variables, such as interest rate, quality of infrastructures, political stability, financial stability, human capital, corporate tax rate, market size, and labour cost, have been considered in prior research (Korsah et al. 2022; Babubudjnauth and Seetanah 2020; Asiamah et al. 2019; Adhikary 2017; Alam and Ali Shah 2013; Daly and Tosompark 2010). However, for this study, we have deliberately focused on a specific set of variables to maintain a clear scope of analysis. Including additional variables could result in a more complex and extensive analysis, which may distract from our core objective of examining the relationship between the real effective exchange rate, its volatility, and net FDI in Canada.
Furthermore, the incorporation of extra variables might require access to reliable long-term data. Unfortunately, data availability on a quarterly basis and potential measurement errors pose limitations for certain variables. By keeping the model relatively focused, we aim to enhance the interpretability of our findings. Overloading the model with too many variables could obscure the relationships between variables and make it challenging to draw meaningful conclusions regarding the impact of the chosen variables on FDI in Canada. We also conducted relevant checks of statistical properties, e.g., serial correlation, normality, and stability of our models.
4. Empirical Results and Discussion
4.1. Unit Root Tests
The results of the ADF tests are presented in Table 2. We also conduct the Philips–Perron test, which provides very similar outcomes4.
It is important to note that both non-stationary variables, LNOPEN, LNREER, and LNVOL, exhibit stationary properties following the application of first differencing (I(1)).
4.2. F-Bound and t-Test
In order to mitigate potential misspecification issues and address the problem of serial correlation in the error terms during the regression analysis, the Pesaran/Shin/Smith ARDL bounds tests are conducted using one lag for both the dependent and independent variables based on AIC criteria. Following that, the F-statistic and t-statistic are calculated to assess the conditional autoregressive distributed lag (ARDL) model. The corresponding results are presented in Table 3.
Our findings signify the presence of both short-term fluctuations and long-run relationships, aligning with the underlying assumptions of the ECM.
As shown in the table above, the calculated F-statistic for the net FDI in the ARDL model is 7.994, which exceeds the critical values at all significance levels for the upper bound I(1). Therefore, the null hypothesis of No Cointegration is rejected, indicating the presence of a long-term relationship among the variables. This implies that the variables move together in the long run.
The results of the F-bounds test for other equations also indicate that cointegration is supported in all examined models based on the comparison of calculated F-statistics and the critical values at all significance levels for the upper bound I(1). This means that the variables within each equation share a stable long-term relationship, and changes in one variable are associated with changes in the others in a meaningful way over time. We also found a similar presence of cointegration based on our findings from the t-tests.
4.3. Results of Aggregate FDI
The short-run results of the aforementioned model for total net FDI (aggregate FDI) are presented in Table 4:
In the short run, changes in GDP and REER have statistically significant positive effects on net FDI in Canada at 5% and 1% levels, respectively. Furthermore, the volatility of REER has a positive impact on total net FDI at a 10% significance level. However, changes in trade openness do not show a significant impact.
As predicted before, the relationship between FDI and GDP is significant and positive in the short run. The positive relationship between FDI and GDP can be attributed to the larger market size, profit opportunities, economic stability, access to resources, and conductive business environment in countries with higher GDP levels. Foreign investors seek to capitalize on growth potential and profit prospects in these economies. This result is consistent with the findings of the prior studies, for instance, de Castro et al. (2013), Sharifi-Renani and Mirfatah (2012), Babubudjnauth and Seetanah (2020), and Kyereboah-Coleman and Agyire-Tettey (2008).
Furthermore, the coefficient of ∆LNREERt is 127,713.6, which implies that a one percent increase in the real effective exchange rate in the current period (depreciation) is associated with an increase of approximately 127,713.6 units in net FDI in the short run. The coefficient is statistically significant at the 1% level (p-value = 0.002), indicating that changes in the real effective exchange rate have a significant impact on the dependent variable in the short run. This finding aligns with Froot and Stein (1991), Vincent et al. (2017), and Babubudjnauth and Seetanah (2020). This can be explained in three supporting reasons. First, it lowers the cost of production and labour in the host country when measured in foreign currency terms, enhancing cost-effectiveness for foreign investors. Additionally, the reduced cost of acquiring assets, including real estate and machinery, presents attractive opportunities for foreign companies to invest in physical infrastructure at a relatively lower expense. Moreover, the depreciated currency renders the host country’s exports more competitively priced in global markets, thereby amplifying export opportunities and appealing to foreign investors seeking to capitalize on international trade prospects. These combined advantages make a country with a depreciated currency an appealing destination for FDI, promoting increased investment inflows and potentially bolstering economic growth.
Meanwhile, the coefficient of ∆LNVOLt is approximately 3880.54. It suggests that a one percent increase in volatility of REER in the current period is associated with an increase of approximately 3880.54 units in FDI in the short run. As we discussed earlier in the theoretical background, volatility in the REER introduces uncertainty and exchange rate risk for foreign investors. However, some investors may be willing to tolerate higher levels of volatility if it presents opportunities for higher returns. A positive and significant relationship between REER volatility and FDI can indicate that certain investors are attracted to the potential gains that can arise from capitalizing on fluctuations in exchange rates. This result is in line with the findings of Darby et al. (1999) and Sung and Lapan (2000), who also discovered a positive relationship. Moreover, the statistically significant adjustment term λ at the 1% level (−0.7958685) shows that the dependent variable adjusts by approximately 79% toward its long-run equilibrium for each unit of deviation from the equilibrium in the previous quarter. The long-run result of the aforementioned model for total net FDI is presented in Table 5.
The long-run results indicate that lagged GDP, lagged trade openness variable, and lagged real effective exchange rate are all positively and significantly associated with total net FDI in the long run. This implies that changes in these variables have a lasting impact on total net FDI, supporting the presence of long-run relationships in the model.
Trade openness has a positive significant impact on FDI in the long run. This is in line with the results of previous research, for instance, de Castro et al. (2013), Sharifi-Renani and Mirfatah (2012), and Saleem et al. (2021). Trade openness allows countries to access larger and more diverse markets. Foreign companies investing in a trade-open economy can gain easier access to a wider consumer base, enabling them to sell their products and services to a more extensive customer pool. Companies often seek locations for FDI that are part of global supply chains. Trade-open economies tend to have well-established supply chain networks, making them attractive to foreign investors who can utilize these networks to facilitate their own production and distribution processes.
Moreover, the coefficient of LNVOLt−1 is 4875.854, which suggests that a 1% increase in the lagged logarithm of volatility is associated with an increase of approximately 6658.596 units in total FDI in the long run. The significant and positive coefficient for the lagged volatility may indicate that foreign investors view past exchange rate fluctuations as manageable risks. The historical volatility may signal that Canada’s economy has demonstrated resilience and the ability to cope with currency fluctuations, which can enhance investor confidence and encourage long-term FDI commitments. This result complies with the findings of Chowdhury and Wheeler’s (2008) research, which revealed a positive relationship between shocks to exchange rate volatility and FDI in Canada. In the meantime, the coefficient of LNREERt−1 is 65,256.19, which implies that a 1% increase in the lagged logarithm of REER (depreciation) is associated with an increase of approximately 65,256.19 units in total net FDI in the long run. These findings are consistent with Sharifi-Renani and Mirfatah (2012), Babubudjnauth and Seetanah (2020), and de Castro et al. (2013) across different countries and regions.
Regarding diagnostic tests, the Durbin–Watson d-statistic and Breusch–Godfrey LM tests are applied to the residuals of the model to find out whether its residuals are serially correlated. In this particular instance, the calculated d-statistic is 2.150871, suggesting the absence of positive autocorrelation in the residuals. Likewise, the p-value of 0.1316 obtained from the Breusch–Godfrey LM test (chi2 = 2.274) indicates that there is no evidence of serial correlation in the residuals. The chi-square statistic for White’s test is 44.84 (p-value: 0.1231), which confirms that the error terms are homoscedastic. The normality test of residual provides a Jarque–Bera value of 2.745 with a probability value of 0.2535, which means that residuals are normally distributed.
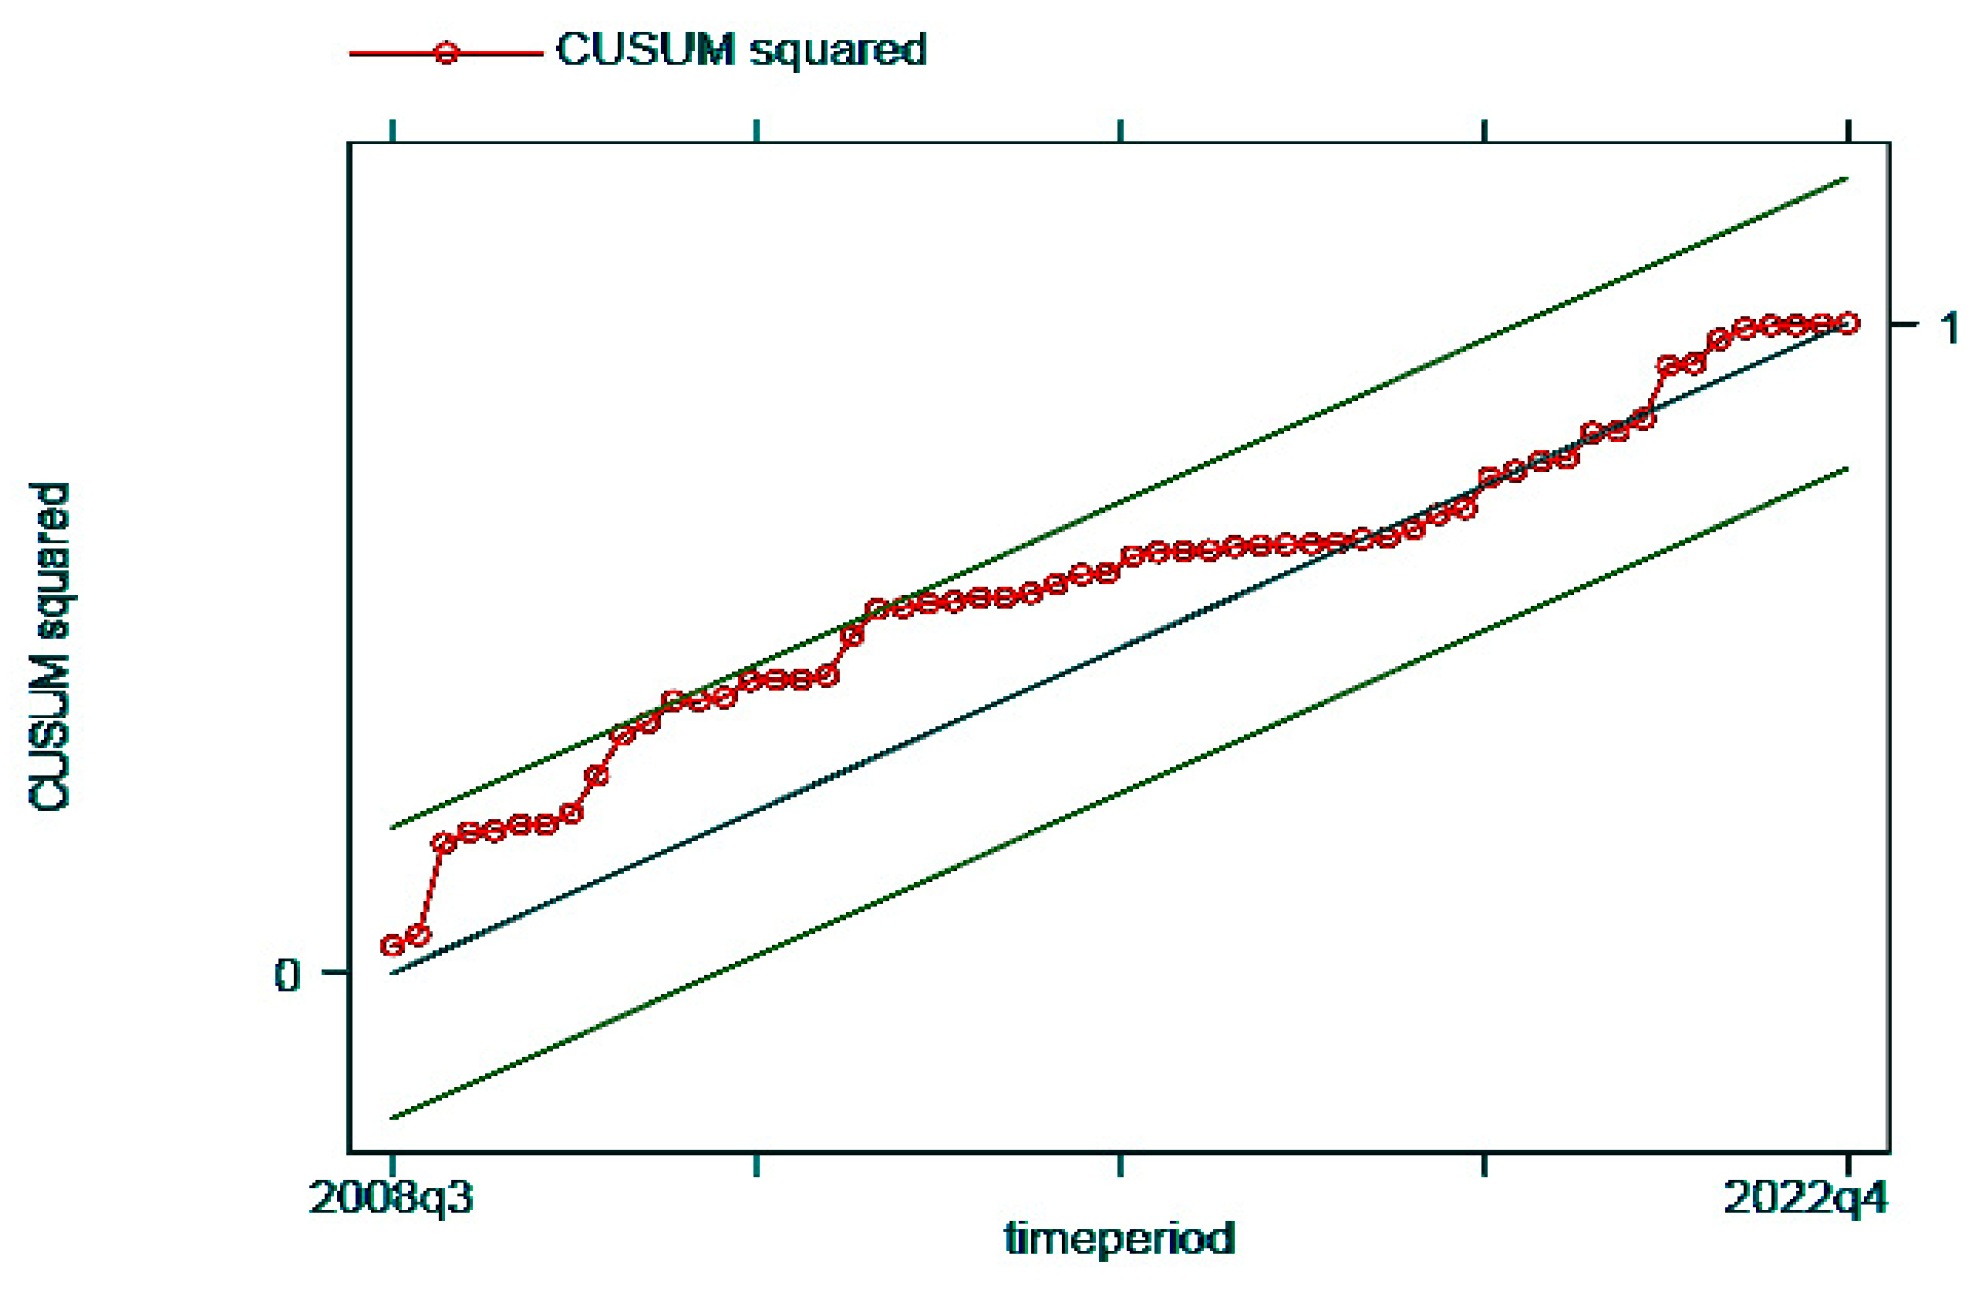
Additionally, the CUSUM test, as illustrated in Figure 3, is used to examine the stability of a regression model over time. Plotting the CUSUM statistic and its upper and lower bounds helps identify any structural changes or instability in the model.
As the CUSUM statistic falls between the upper and lower bounds, it suggests that there is no evidence of significant structural change or instability in the model. This indicates that the coefficients and relationships in the regression model remain stable over the analyzed time period.
4.4. Disaggregated Analysis: Results for FDI in Sectors
The short-run results of the same model for FDI in different industries are presented in the Table 6:
According to Table 6, the significance of the error correction term (ECT) in adjusting the short-run dynamics and restoring the long-run equilibrium is noteworthy across all industries or sectors, as it is statistically significant at the 1% level. This highlights the crucial role of the ECT in ensuring the adjustment of short-term fluctuations and maintaining the long-term balance in all industries or sectors.
Changes in the real effective exchange rate have a significant impact on FDI in the short run within the energy and mining sector (FDIENMI). The coefficient of ∆LNREERt is 26,247.58, which implies that a one percent increase in the real effective exchange rate is associated with an increase of approximately 23,937.12 units in FDI in the energy and mining industry in the short run. The coefficient is statistically significant at the 5% level.
In the manufacturing industries (FDIMF), changes in trade openness and REER and volatility of REER have a positive impact on FDI in this sector, and they are significant at 10%, 1%, and 5%, respectively. The coefficient of ∆LNREERt is 74,235.58, which implies that a one percent increase in the real effective exchange rate is associated with an increase of approximately 83,641.73 units in FDI in the manufacturing industries in the short run. Furthermore, the coefficient of ∆LNVOLt is 5552.736, which suggests that a one percent increase in volatility is associated with an increase of approximately 5552 units in FDI in the manufacturing industries in the short run. Manufacturing industries are typically export-oriented, and exchange rate volatility can impact export earnings. A positive relationship between REER volatility and FDI may indicate that foreign investors are attracted to Canada, where exchange rate fluctuations create opportunities for export-oriented businesses to benefit from potential currency gains and increased competitiveness in foreign markets. This result is in alignment with the research performed by Cushman (1988) that demonstrated that when there is exchange rate variability, manufacturing goods directly in the target market becomes an attractive alternative to exporting. This is particularly true if the domestically produced goods are not intended for re-export. Therefore, Cushman’s study also revealed a positive relationship between exchange rate volatility and inward FDI.
In the finance and insurance sector (FDIFIN), changes in the real effective exchange rate and volatility of REER exhibit positive significant impacts on FDI in the short run. The coefficient of ∆LNREERt indicates that a one percent increase in the real effective exchange rate is associated with an expected increase of approximately 14,094.35 units in FDI in this sector. Moreover, the coefficient of ∆LNVOLt suggests that a one percent increase in the volatility of REER is associated with an expected increase of approximately 1459.764 units in FDI in these industries. There is no significant relationship between independent variables and FDI in the short run within the trade and transportation sector (FDITT) and management of companies and enterprises sector (FDIMNG) and other industries (FDIOTH) at a 5% significance level. On the other hand, in other industries (FDIOTH), only changes in GDP and trade openness exhibit significant impacts at a 10% significance level.
These results prove the fact that different sectors in the economy have unique characteristics, distinctive risk profiles, and specific sensitivities to various economic variables. The trade and transportation sector and management of companies and enterprises sector are less affected by changes in exchange rates and their volatility compared to other industries. Factors such as the nature of their business activities and reliance on domestic markets can influence the significance of the relationship between REER, volatility, and FDI.
In the long run, as depicted in Table 7, the majority of explanatory variables do not exhibit statistically significant impacts on foreign direct investments across various industries6. However, there are a few exceptions. Specifically, changes in the real effective exchange rate (REER) have a positive and significant influence on FDI in the energy and mining sector, as well as in the manufacturing industries at a 5% level. Additionally, trade openness demonstrates a positive and significant impact on FDI in the manufacturing sector as well as on FDI in other industries. The neutral results of trade openness in trade and transport, finance and insurance, and management of companies and enterprises may indicate that the positive impact of openness is outweighed by the negative impact on the non-tradable sectors. The significant and positive short-run and long-run relationship between the REER and FDI in the energy and mining sector can be justified by the impact of exchange rate fluctuations on commodity prices. As these sectors heavily rely on commodities priced in foreign currencies, a depreciated domestic currency (increased REER) makes these resources relatively cheaper for foreign investors, making investments more attractive.
Additionally, given the substantial capital requirements in energy and mining projects, a favourable exchange rate environment can enhance cost competitiveness for foreign investors, reducing overall investment expenses. Furthermore, the positive relationship suggests that REER fluctuations influence the appeal of export-oriented FDI in these sectors, as a weaker domestic currency boosts export earnings for foreign investors, providing further incentives for FDI. This result is in line with the theories mentioned in Section 2 with regard to the relationship between exchange rate and FDI inflow. The following tables present the results of diagnostic tests conducted for residual analysis in the FDI models in industries.
Table 8 presents the results of diagnostic tests for residual analysis in different industry sectors. The Durbin–Watson d-statistic indicates no evidence of serial correlation in the residuals. Similarly, the Breusch–Godfrey LM test shows no significant serial correlation based on the chi-square values and associated p-values. Overall, the results indicate the absence of serial correlation in the residuals across all industry sectors examined.
Table 9 presents the results of diagnostic tests for homoscedasticity and normality of residuals in different industry sectors. White’s test for homoscedasticity indicates that the residuals have equal variance across all observed levels in all industries except for FDIMF. The Jarque–Bera test for normality reveals that the residuals are not normally distributed in the energy and mining, manufacturing industries, management of companies and enterprises, and other industries sectors. Nevertheless, they are normally distributed in the trade and transport and finance and insurance sectors.
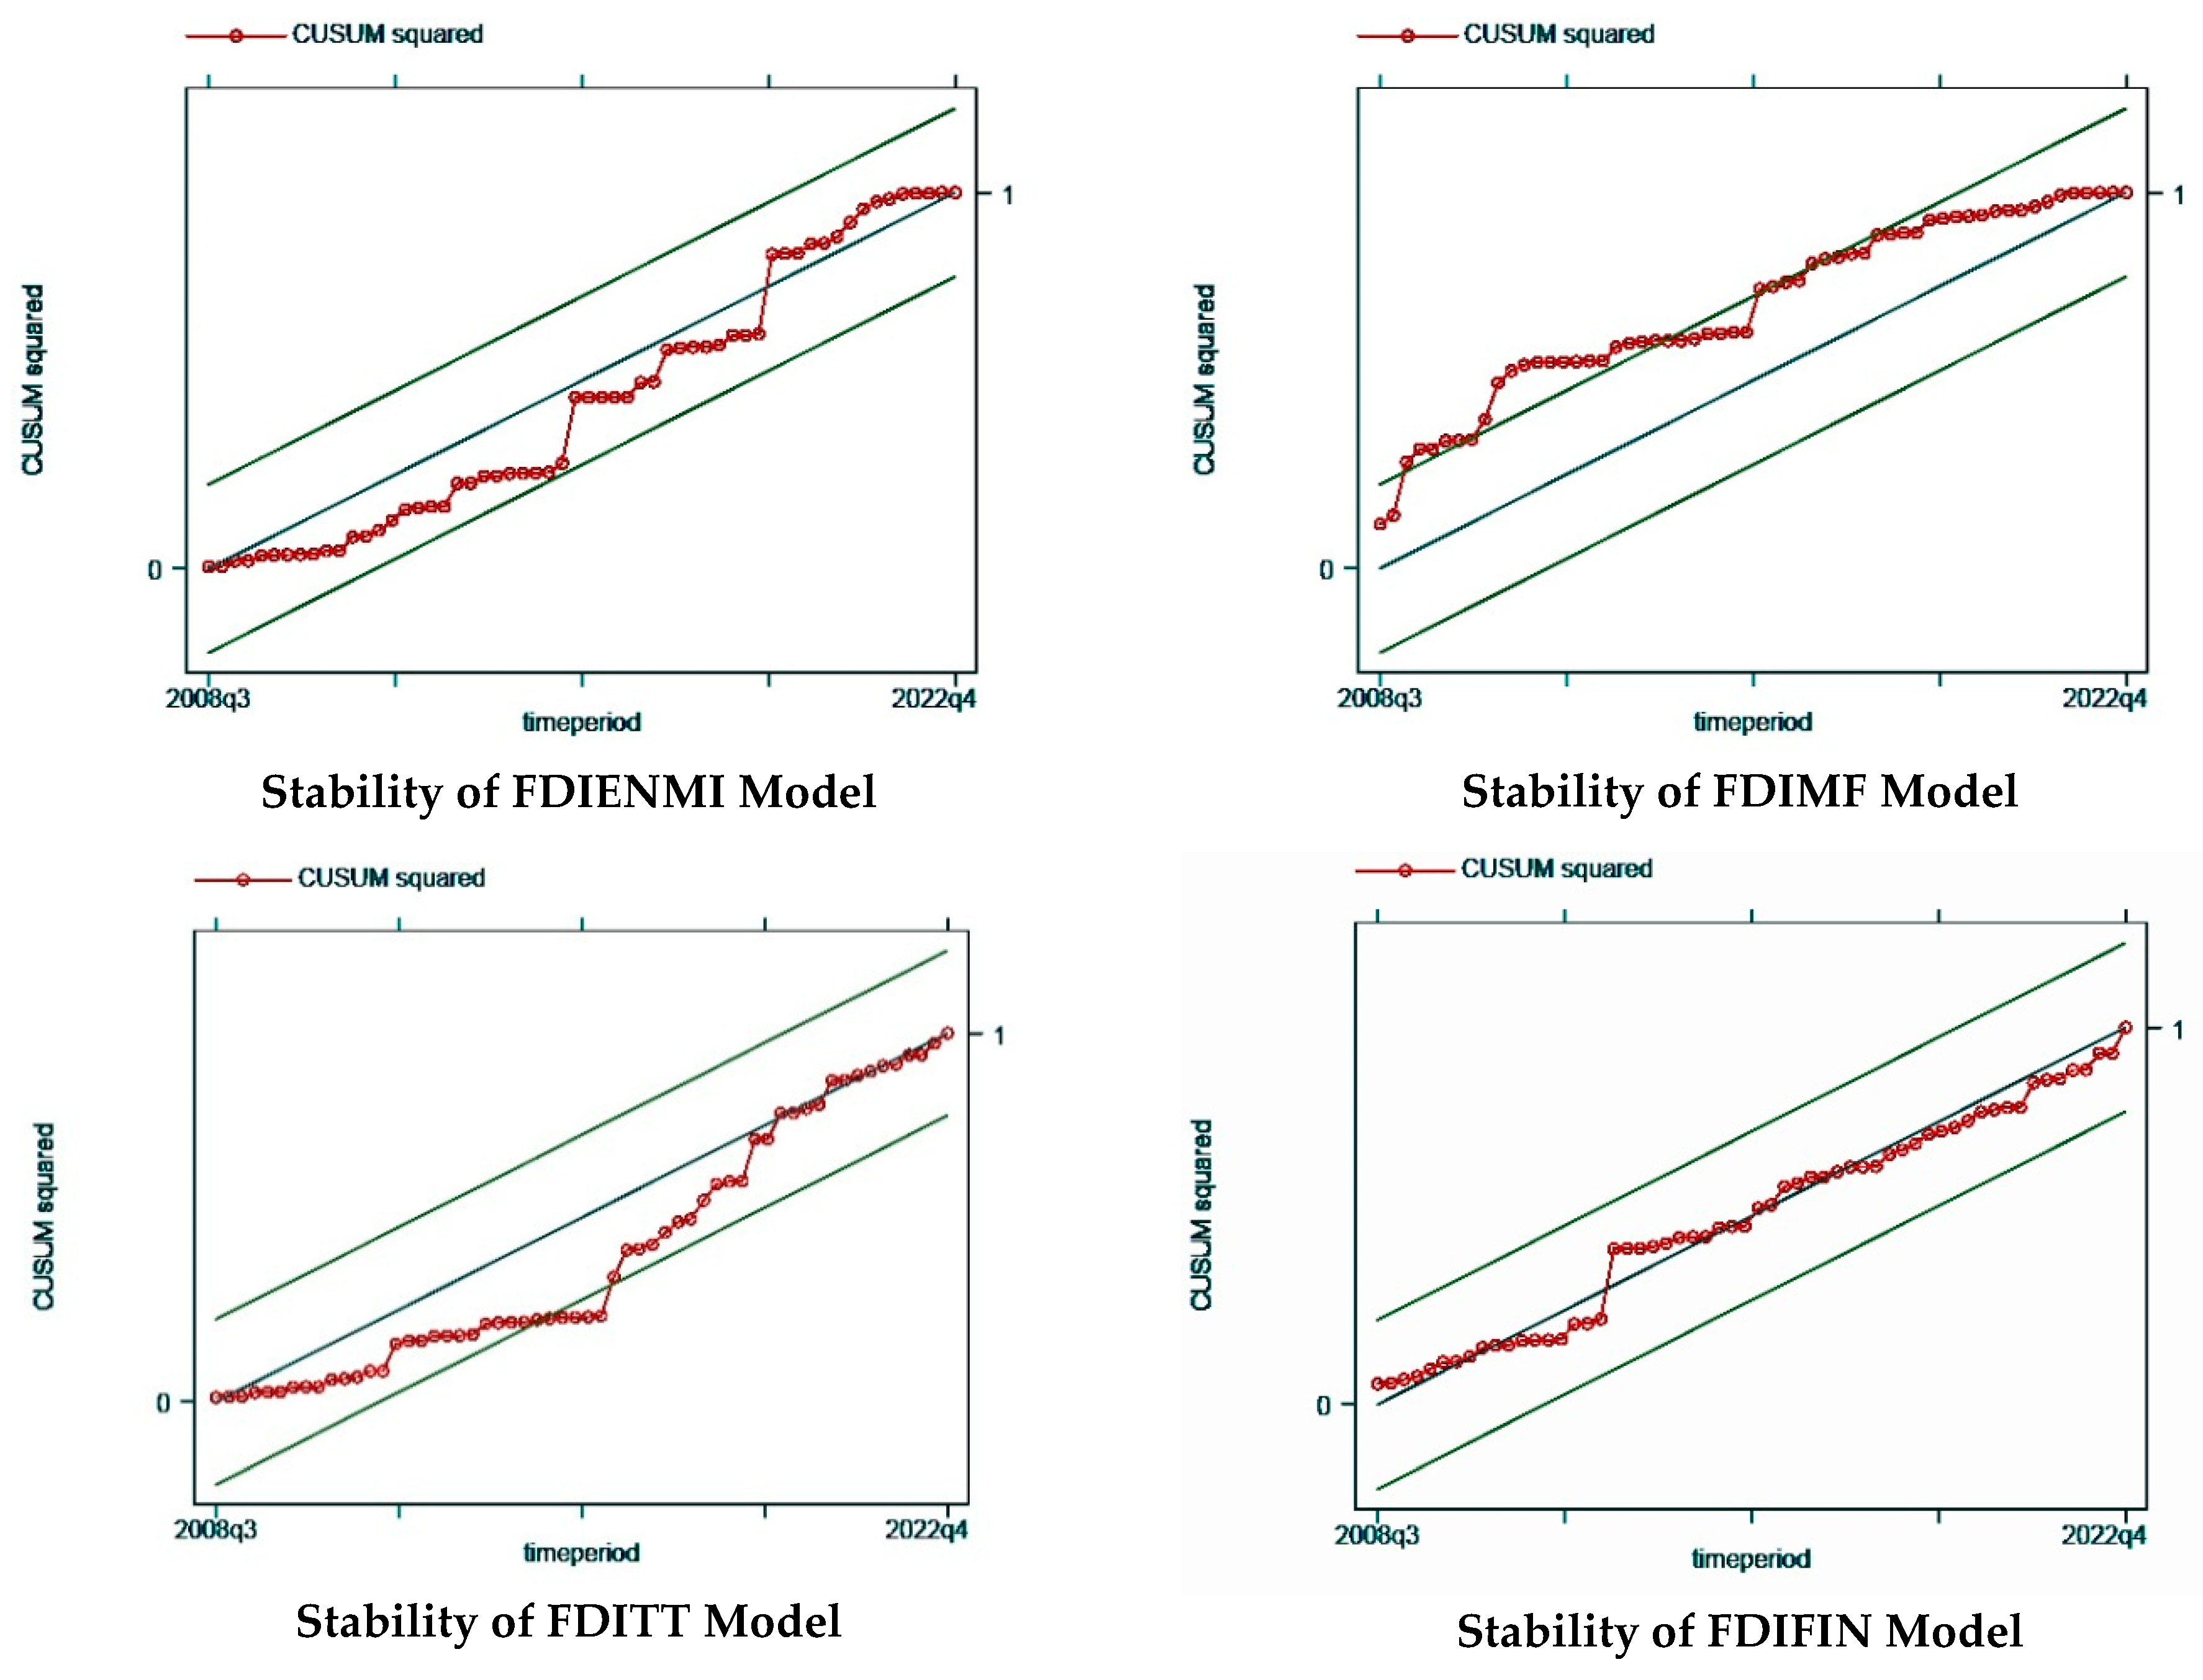
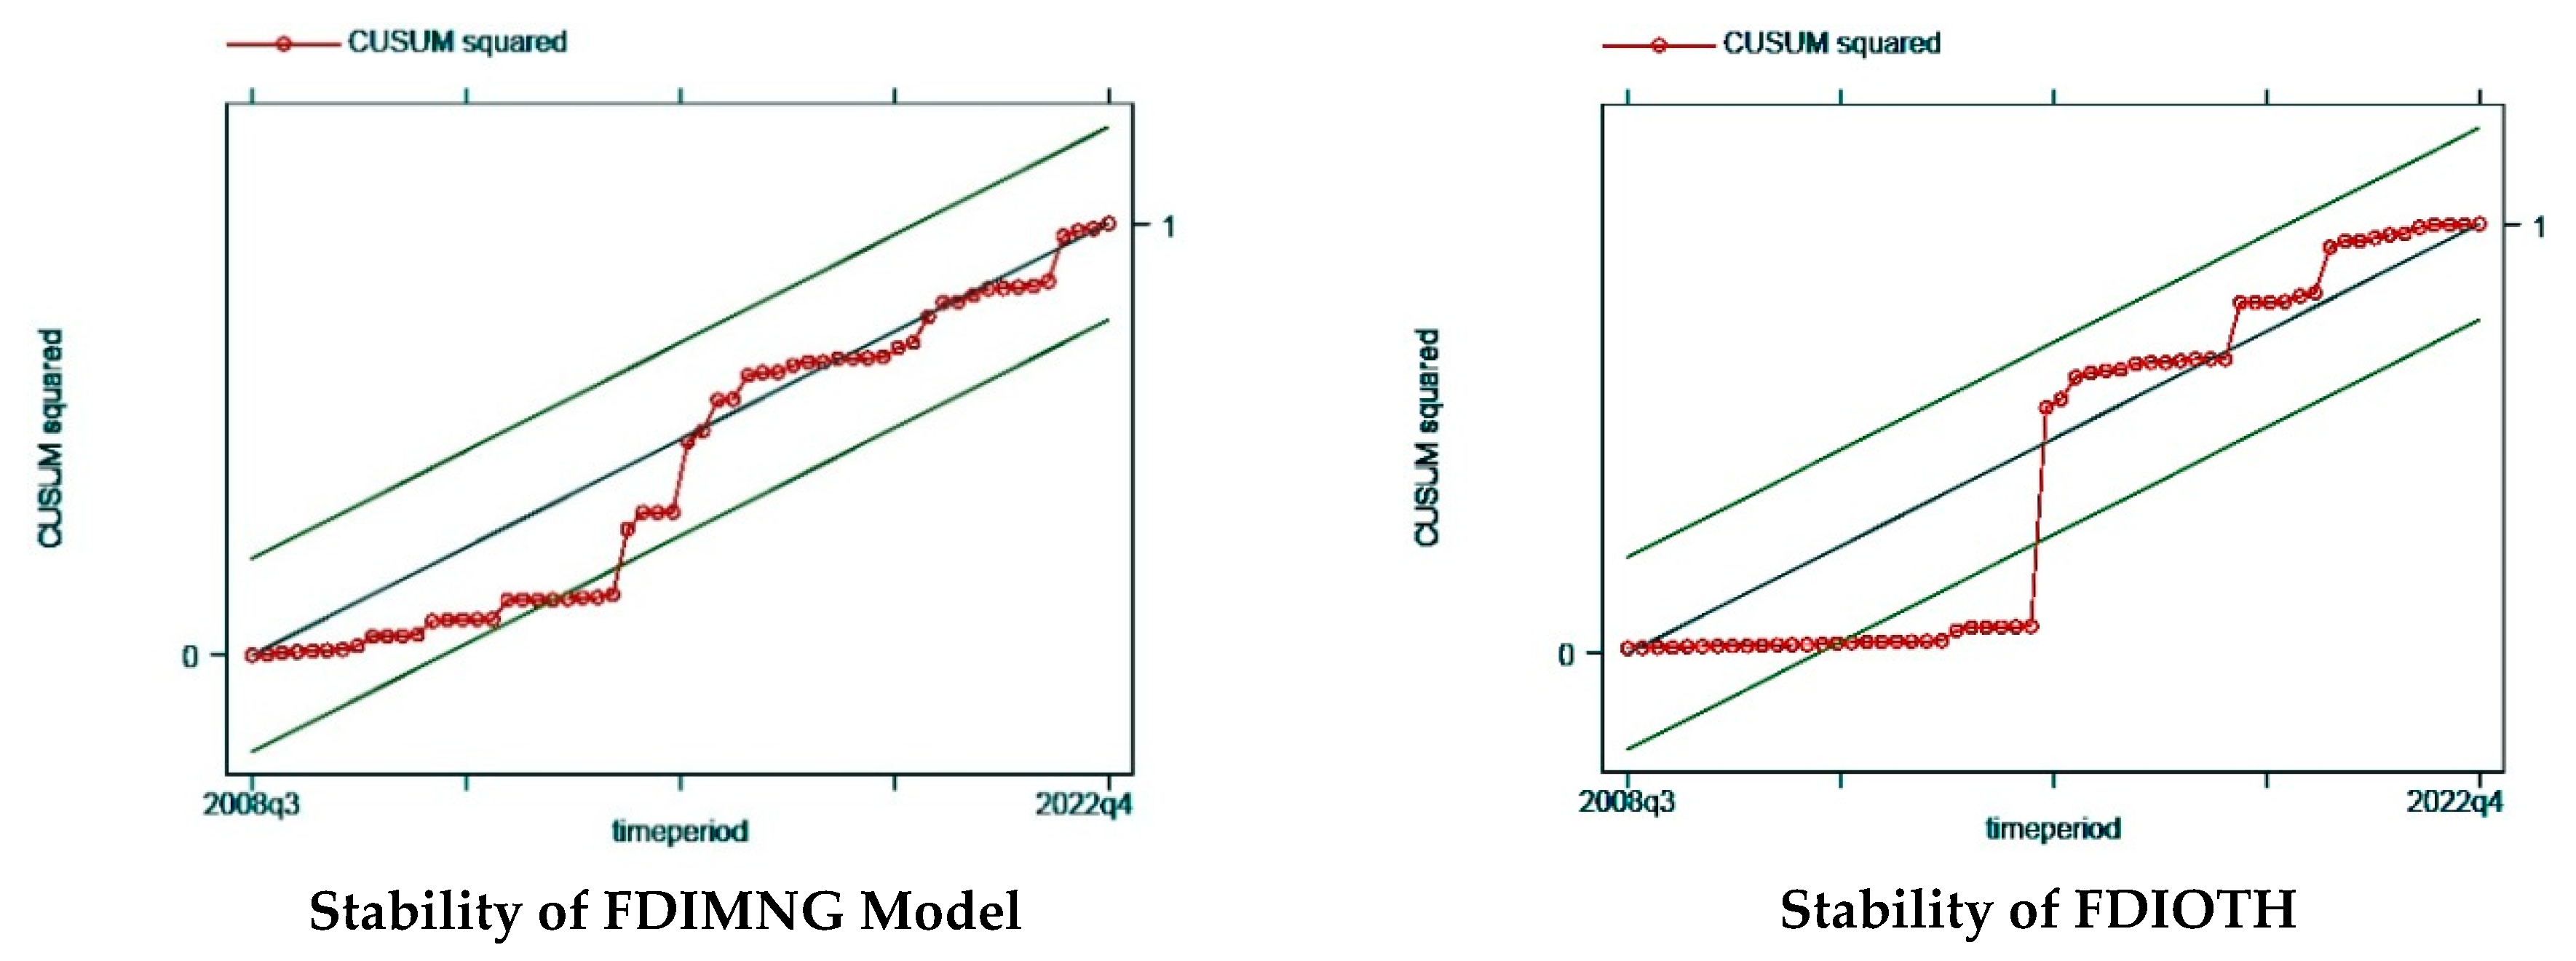
The following figures (Figure 4) illustrate the results of CUSUM tests conducted for all models of foreign direct investment in various industry sectors.
The figures presented above provide evidence of the stability of all the models based on the CUSUM tests. The plots demonstrate that the models consistently fluctuate within the upper and lower bounds, indicating a stable relationship between the variables over time. In instances where the plots temporarily exceed the bounds, they eventually revert back within the acceptable range, further affirming the stability of the models. These findings suggest that the estimated models adequately capture the underlying dynamics of FDI in different industry sectors. However, as a robustness check, while applying the Ramsey RESET test, most of the models indicate the presence of stability aligning CUSUM and CUSUM SQUARE, but the total FDI and manufacturing industries indicate potential instability7.
4.5. Results of the Alternative Model: Including Break Points
This section investigates the impact of two significant events, the GFC in 2008 and the COVID-19 pandemic in 2020, on FDI inflows in Canada. The inclusion of dummy variables representing 2020q2 and 2008q4 aims to analyze how these structural breaks influenced FDI patterns and provide insights into the dynamics surrounding these pivotal economic moments.
As mentioned earlier, in spite of some similarities, the trends and shocks observed in FDI within sectors or industries do not appear to precisely align with the overall trend of FDI. Specifically, the largest shocks of each trend are not in compliance with the aggregated FDI. Consequently, the inclusion of the same dummy variables for these specific periods in the analysis of sectoral FDI may not be logically justified. Instead, our focus remains on examining the impact of including dummy variables solely on total FDI in our model8.
A comparison of the results in Table 10 with Table 4 proves that the coefficient for the change in the real effective exchange rate (∆LNREERt) remains significant (at the 1% level) and positive in both cases. However, the coefficient for the volatility of the real effective exchange rate (∆LNVOLt) is significant at the 5% level when dummies are included (p-value = 0.031), which was statistically significant at the 10% level when they are excluded in Table 4 (p-value = 0.086). Furthermore, the coefficient for the trade openness (∆LNOPENt) was negative and statistically insignificant when dummy variables were excluded (p-value = 0.933), while it was positive and significant at the 5% level when they were included (p-value = 0.015). This suggests that the presence of dummies may attenuate the impact of trade openness on short-term FDI.
The coefficients for the dummy variables themselves (dum2008q4 and dum2020q2) are significant at the 10% and 5% levels, respectively, indicating their influence on short-term FDI. The long-run results of the aforementioned model for total FDI are presented in the Table 11:
A comparison of this result with the outcome of the model shown in Table 5 suggests that the coefficient for the lagged change in GDP (LNGDPt−1) has a higher level of significance when dummy variables are included (1% level) compared to when they are excluded (5% level). The coefficient for the change in the trade openness and volatility of REER remains significant (at a 5% level) and positive in both cases. However, the coefficient for the lagged change in the real effective exchange rate (LNREERt−1) has a higher level of significance (1%) when dummies are involved, compared to a 5% level of significance when dummies are not incorporated. Overall, the inclusion of dummy variables in the model appears to have some influence on the estimated coefficients for both short-run and long-run analyses for net total FDI inflows in Canada.
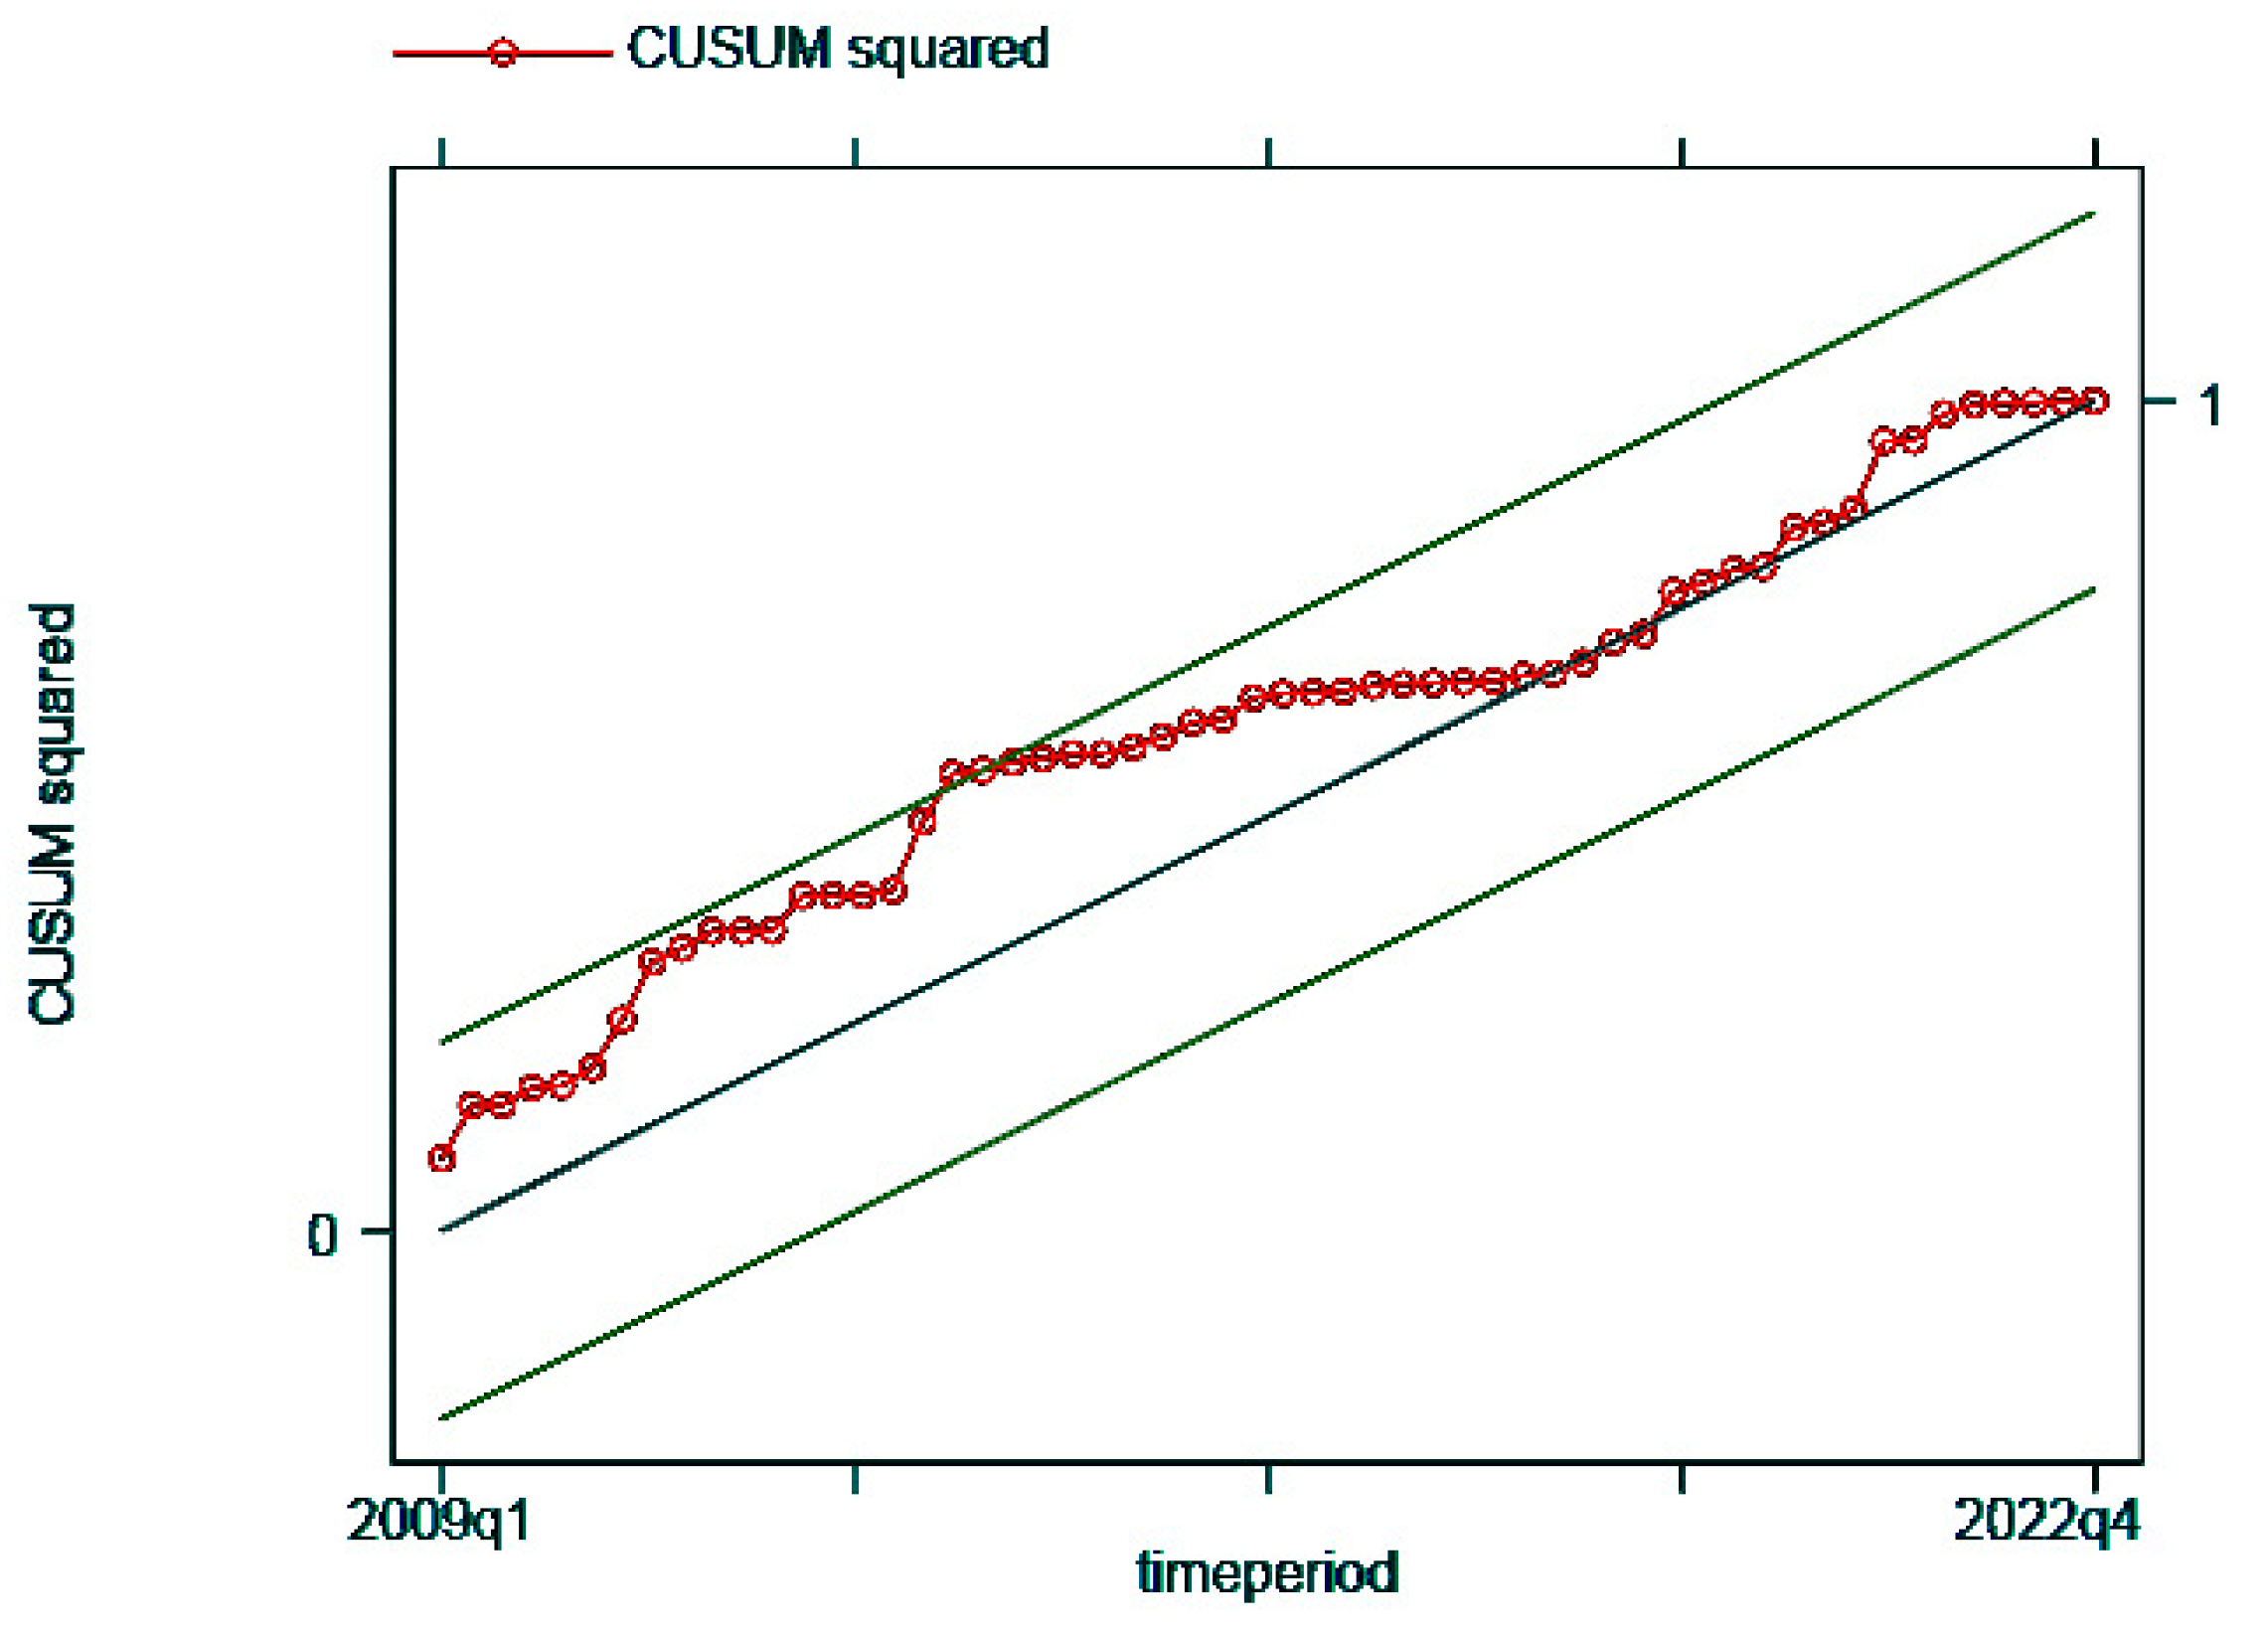
The CUSUM statistic, as shown in Figure 5, falls between the upper and lower bounds, which indicates that the coefficients and relationships in the regression model remain stable over the analyzed period.
For disaggregated models9, our findings suggest that incorporating these specific dummy variables does not substantially improve the model’s explanatory power or provide meaningful insights into the FDI dynamics within individual sectors, which is attributed to the presence of diverse trends, shocks, and structural breaks in the data. These factors create unique dynamics within each sector, leading to variations in the impact of specific explanatory variables. Consequently, the inclusion of dummies for certain periods may not capture the full complexity of sector-specific FDI patterns, and their presence may even mask the influence of other important variables.
5. Conclusions and Policy Recommendations
This report attempted to investigate the relationship between the real effective exchange rate and its volatility with FDI in Canada. We also examined these relationships at the sector level, which is one of the main contributions of this study. The theoretical background suggested that depreciation in the REER can signal an increase in productivity and efficiency in the host country, making it more attractive for foreign investors seeking to benefit from cost savings and improved productivity. However, the empirical background showed varied results.
To determine the presence of a long-run relationship, the study employed the ARDL (autoregressive distributed lag) approach, which is suitable for analyzing data with a mix of integrated order 0 (I(0)) and integrated order 1 (I(1)) variables. The F-bounds and t-tests indicate the presence of cointegration. Based on the results of the ARDL model, the study found significant short-run and long-run relationships between the variables and FDI. In the short run, changes in GDP, REER, and volatility of REER have statistically significant positive effects on FDI. However, changes in trade openness did not show a significant impact. In the long run, lagged GDP, lagged trade openness, lagged REER, and lagged volatility of REER were positively and significantly associated with FDI, indicating the lasting impacts of these variables on FDI.
Based on the sector-level analysis of FDI in Canada, the findings indicate that the error correction term (ECT) also plays a crucial role in adjusting short-term fluctuations and restoring long-term equilibrium across all industries. In the energy and mining sector, a one percent increase in REER is associated with a substantial short-term increase in FDI. Similarly, in the manufacturing industries, REER, trade openness, and the volatility of REER have positive and significant effects on FDI. REER and its volatility can also influence FDI inflows into the finance and insurance sector in the short run. In the long run, REER and trade openness show positive and significant impacts on the energy and mining sector and the manufacturing industries.
It can be concluded that effects that are significant at the aggregate level may be diluted when specific sectors with distinct characteristics are analyzed separately. The lack of impact of REER volatility on FDI in sectors in both the short run and long run could be attributed to various economic and sector-specific factors. In the short run, some sectors, like energy and mining or trade and transport, might be less influenced by short-term fluctuations in exchange rates due to their inherent stability or the presence of long-term contracts that mitigate immediate impacts. In other words, these sectors could be less sensitive to exchange rate volatility if investors have a high degree of confidence in the sector’s performance and outlook. Furthermore, the dynamics of sectors can differ significantly. For instance, FDI in energy and mining might be driven more by global commodity prices or geopolitical factors than by short-term currency movements. On the other hand, long-term FDI decisions involve a multitude of considerations and other variables beyond exchange rate volatility, such as market size, infrastructure, labour availability, and regulatory environment. Certain sectors might involve significant sunk costs, where firms have invested heavily and are less likely to alter their strategies due to exchange rate fluctuations.
As for the policy recommendations, we emphasize the importance of avoiding the overvaluation (too high of an appreciation) of the domestic exchange rate. Maintaining an economic environment that is attractive to FDI necessitates preventing the domestic exchange rate from being overvalued. Additionally, considering the export-oriented and import-dependent nature of the domestic economy, an overvalued exchange rate (rate that does not align with the macroeconomic scenario) can hinder export growth while increasing imports. Therefore, the government and the Bank of Canada should pursue fiscal and monetary policies that promote exchange rate stability and avoid excessive currency appreciation. This may include measures to manage inflation and money supply, tax policy, and public investment while ensuring transparency and communication about exchange rate policies. The study also highlights the importance of considering sector-level dynamics when analyzing the relationship between FDI, REER, and its volatility. Policymakers should tailor their policies to specific sectors.
To attract and sustain FDI in the manufacturing sector, policymakers should adopt a balanced exchange rate policy that prevents overvaluation of the domestic currency. This can be achieved through monitoring exchange rate movements and implementing targeted policies to mitigate excessive appreciation. Additionally, efforts to promote export-oriented manufacturing industries should be intensified through trade agreements and incentives that enhance competitiveness in global markets.
Policymakers should prioritize maintaining exchange rate stability in the finance and insurance sector to promote investor confidence and long-term commitments. This can be achieved through proactive exchange rate management and clear communication of the central bank’s monetary policy intentions. Additionally, financial market reforms and regulatory enhancements should be pursued to create a robust and resilient financial sector that attracts foreign investment.
Given the sensitivity of the energy and mining sector to commodity prices and currency movements, policymakers should focus on managing REER volatility and fostering a stable investment climate. Measures to stabilize commodity prices through strategic reserves and hedging mechanisms can reduce the sector’s vulnerability to currency fluctuations and attract long-term investments. These policy recommendations should be viewed as dynamic and subject to periodic evaluation. Policymakers should continuously monitor the effectiveness of implemented measures, assess changing market conditions, and adapt policies accordingly. Regular reviews and evaluations can ensure that policies remain aligned with the evolving needs and demands of the global investment landscape.
As per the limitations, the study’s data for FDI and FDI in sectors are available only from 2007, which might limit the analysis’s ability to capture long-term trends. Extending the data period to include a longer timeframe may yield different results and provide a more comprehensive understanding of FDI patterns. The study only considers GDP, trade openness, real effective exchange rate (REER), and REER volatility as independent variables. However, other variables, such as interest rate, quality of infrastructures, political stability, financial stability, human capital, corporate tax rate, market size, and labour cost, could also influence FDI. Future research could explore the impact of these additional variables to gain a more comprehensive understanding of the factors affecting FDI inflows.
The categorization of FDI in sectors into energy and mining, trade and transport, finance and insurance, manufacturing, management of enterprises and companies, and other industries might oversimplify the sector-specific dynamics. A more detailed and refined classification of industries could provide deeper insights into sector-specific FDI patterns. For instance, evaluating industries like real estate, healthcare and social assistance, agriculture–forestry–fishing, information technology, wholesale trade, and retail trade separately may also uncover unique relationships between FDI and independent variables within each sector.
The findings presented in this study are predicated upon a meticulous analysis of the provided dataset. It is important to recognize that these results remain contingent upon the prevailing limitations, and any alterations or modifications to the aforementioned constraints could potentially yield disparate outcomes. Furthermore, this report underscores the pivotal role of FDI as an economic catalyst, exerting a positive influence on developmental progression and economic expansion. Nevertheless, it is imperative to acknowledge the nuanced perspective surrounding the impact of FDI, a viewpoint that is inherently influenced by its characteristics and diverse forms. The multifaceted nature of FDI warrants a comprehensive examination that encompasses distinct economic and political standpoints.
Author Contributions
Conceptualization, H.L. and M.C.; methodology, H.L. and M.C.; software, H.L.; validation, H.L.; formal analysis, H.L.; investigation, H.L.; resources, H.L. and M.C.; data curation, H.L.; writing—original draft preparation, H.L.; writing—review and editing, M.C.; visualization, H.L.; supervision, M.C.; project administration, M.C. All authors have read and agreed to the published version of the manuscript.
Funding
This research received no external funding.
Data Availability Statement
Data and codes are available upon request.
Acknowledgments
The authors appreciate constructive feedback received from Mehmet Dalkir at the University of New Brunswick.
Conflicts of Interest
The authors declare no conflicts of interest.
| 1 | Our total FDI inflows to Canada are the sum of net FDI inflows in all sectors. The net FDI inflow for each sector is the difference between an increase in investment and a decrease in investment in that particular industry. |
| 2 | To overcome the issue of negative values and apply a logarithmic transformation, we attempted a moving average method to smooth the quarterly series; however, this approach did not work due to persistent negative values at the sector level, even after employing the moving average. Additionally, exploring the option of using the ratio of FDI inflows to outflows, as commonly practised in net import studies, also revealed similar challenges. In several cases, the data provided by Statistics Canada on FDI inflows and outflows exhibit negative values; therefore, the ratio remains negative. |
| 3 | To simply the effect of shocks, we also tested a single dummy combining Dum2008q4 and Dum2020q2 and expanded each shock for three quarters. |
| 4 | The results for the Phillip–Perron tests and first-differenced variables are available upon request. |
| 5 | The results of the t-statistics are in the same line with F-statistics. We only report F-statistic. t-statistics are available upon request. |
| 6 | In pursuit of enhancing the robustness of our analytical framework specifically for the effect of the volatility of REER, we embarked on a comprehensive examination as derived from a shifting window, from a four-quarter window to a five-quarter window. Our meticulous investigation revealed that this transition yielded no substantive changes at the sectoral level. Notably, the relationship between the volatility of REER and total FDI demonstrated a regrettably diminished explanatory potency, notably eroding the previously observed long-term statistical significance of this association. Intriguingly, this transition also engendered an unexpected attenuation in the previously established interdependence between LNGDP and total FDI. Furthermore, this transition instigated the emergence of autocorrelation and heteroscedasticity in residuals. |
| 7 | The test results for the Ramsey RESET are available upon request. |
| 8 | As part of the robustness check, using a single dummy variable based on shocks in 2008 (up to three quarters) and 2020 (up to three quarters) did not yield any significant differences in the estimated model outcome. |
| 9 | Results are available upon request. |
References
- Abdullah, Mohammed, and Murshed Chowdhury. 2020. Foreign direct investment and total factor productivity: Any nexus? Margin: The Journal of Applied Economic Research 14: 164–90. [Google Scholar] [CrossRef]
- Adhikary, Bishnu Kumar. 2017. Factors influencing foreign direct investment in South Asian economies: A comparative analysis. South Asian Journal of Business Studies 6: 8–37. [Google Scholar] [CrossRef]
- Alam, Abdullah, and Zulfiqur Ali Shah. 2013. Determinants of foreign direct investment in OECD member countries. Journal of Economic Studies 40: 515–27. [Google Scholar] [CrossRef]
- Aliber. 1970. A Theory of Direct Foreign Investment. Edited by Charles P. Kindleberger. The International Corporation, Assymposium Combrite. Cambridge: MIT Press. [Google Scholar]
- Asiamah, Michael, Daniel Ofori, and Jacob Afful. 2019. Analysis of the determinants of foreign direct investment in Ghana. Journal of Asian Business and Economic Studies 26: 56–75. [Google Scholar] [CrossRef]
- Asmah, Emmaneul Ekow, and Francis Kwaw Andoh. 2013. Exchange rate volatility and foreign direct investment in Sub Saharan Africa. Journal for the Advancement of Developing Economies 2: 1–14. [Google Scholar] [CrossRef]
- Babubudjnauth, Ashok, and Boopendra Seetanah. 2020. An empirical investigation of the relationship between the real exchange rate and net FDI inflows in Mauritius. African Journal of Economic and Management Studies 11: 63–74. [Google Scholar] [CrossRef]
- Bank of Canada Annual Report. 2008. Available online: https://www.bankofcanada.ca/2009/01/annual-report-2008 (accessed on 4 April 2023).
- Biswas, Sreelata, and Byasdeb Dasgupta. 2012. Real exchange rate response to inward foreign direct investment in liberalized India. International Journal of Economics and Management 6: 321–34. [Google Scholar]
- Blattner, Tobias S. 2006. What Drives Foreign Direct Investment in Southeast Asia? A Dynamic Panel Approach. Frankfurt: European Central Bank. [Google Scholar]
- Blonigen, Bruce A. 1997. Firms-specific assets and the link between exchange rates and foreign direct investment. American Economic Review 87: 447–65. [Google Scholar]
- Chen, Kun-Ming, Hsiu-Hua Rau, and Chia-Ching Lin. 2006. The impact of exchange rate movements on foreign direct investment: Market-oriented versus cost-oriented. The Developing Economies 44: 269–87. [Google Scholar] [CrossRef]
- Chowdhury, Abdur R., and Mark Wheeler. 2008. Does real exchange rate volatility affect foreign direct investment? Evidence from four developed countries. The International Trade Journal 22: 218–45. [Google Scholar] [CrossRef]
- Cushman, David O. 1985. Real exchange rate risk, expectations and the level of direct investment. Review of Economics and Statistics 67: 297–308. [Google Scholar] [CrossRef]
- Cushman, David O. 1988. Exchange rate uncertainty and foreign direct investment in the United States. Weltwirtschaftliches Archiv 124: 322–36. [Google Scholar] [CrossRef]
- Daly, Kevin, and Chanikarn Teresa Tosompark. 2010. The determinants of foreign direct investment in Thailand. In The Impact of the Global Financial Crisis on Emerging Financial Markets. Bingley: Emerald Group Publishing Limited, pp. 709–18. [Google Scholar] [CrossRef]
- Darby, Julia, Andrew Hughes Hallett, Jonathan Ireland, and Laura Piscitelli. 1999. The impact of exchange rate uncertainty on the level of investment. The Economic Journal 109: 55–67. [Google Scholar] [CrossRef]
- de Castro, Priscila Gomes, Elaine Aparecida Fernandes, and Antonio Carvalho Campos. 2013. The determinants of foreign direct investment in Brazil and Mexico: An empirical analysis. Procedia Economics and Finance 5: 231–40. [Google Scholar] [CrossRef]
- Fauzel, Sheereen, Boopen Seetanah, and Raja Vinesh Sannassee. 2015. Foreign direct investment and welfare nexus in Subsaharan Africa. The Journal of Developing Areas 49: 271–83. [Google Scholar] [CrossRef]
- Froot, Kenneth A., and Jeremy C. Stein. 1991. Exchange rates and foreign direct investment: An imperfect capital markets approach. The Quarterly Journal of Economics 106: 1191–217. [Google Scholar] [CrossRef]
- Goldberg, Linda S., and Charles D. Kolstad. 1995. Foreign direct investment, exchange rate variability and demand uncertainty. International Economic Review 36: 855–73. [Google Scholar] [CrossRef]
- Government of Canada. 2022. Global Affairs Report. State of Trade 2021—A Closer Look at Foreign Direct Investment (FDI). Available online: https://www.international.gc.ca/ (accessed on 4 May 2023).
- Hanusch, Marek, Ha Nguyen, and Yashvir Algu. 2018. Exchange Rate Volatility and FDI Inflows: Evidence from Cross-Country Panel Data. MIT Global Practice Discussion Paper. No. 2. Washington, DC: World Bank. Available online: http://hdl.handle.net/10986/29911 (accessed on 24 January 2024).
- Harchaoui, Tarek, Faouzi Tarkhani, and Terence Yuen. 2005. The Effects of the Exchange Rate on Investment: Evidence from Canadian Manufacturing Industries (Working Paper 2005-22). Available online: https://www.bankofcanada.ca/wp-content/uploads/2010/02/wp05-22.pdf (accessed on 25 January 2024).
- Husek, Roman, and Vaclava Pankova. 2008. Exchange rate changes effects on foreign direct investment. Prague Economic Papers 2: 118–26. [Google Scholar] [CrossRef]
- Kiliçarslan, Zerrin. 2018. The relationship between exchange rate volatility and foreign direct investment in Turkey: Toda and Yamamoto causality analysis. International Journal of Economics and Financial Issues 8: 61–67. [Google Scholar]
- Korsah, Emmanuel, Richmell Baaba Amanamah, and Prince Gyimah. 2022. Drivers of foreign direct investment: New evidence from west African regions. Journal of Business and Socio-Economic Development. ahead-of-print. [Google Scholar] [CrossRef]
- Kyereboah-Coleman, Anthony, and Kwame F. Agyire-Tettey. 2008. Effect of exchange rate volatility on foreign direct investment in Sub Saharan Africa: The case of Ghana. Journal of Risk Finance 9: 52–70. [Google Scholar] [CrossRef]
- Lily, Jaratin, Mori Kogid, Dullah Mulok, Lim Thien Sang, and Rozilee Asid. 2014. Exchange rate movement and foreign direct investment in Asian economies. Economics Research International 2014: 320949. [Google Scholar] [CrossRef]
- Lin, Chia-Ching, Kun-Ming Chen, and Hsiu-Hua Rau. 2006. Exchange Rate Volatility and the Timing of Direct Investment: Market Seeking versus Export-Substitution. Taipei: Department of Trade, National Chengchi University, pp. 1–36. [Google Scholar]
- Martins, Jose Fillipe de Sousa. 2015. Impact of Real Exchange Rate Volatility on Foreign Direct Investment Inflows on Brazil, [Em linha]. Lisboa: ISCTE-IUL, Dissertação de Mestrado. [Consult. Dia Mês Ano] Disponívelem. Available online: https://repositorio.iscte-iul.pt/handle/10071/11412 (accessed on 3 May 2023).
- McCloud, Nadine, Michael S. Delgado, and Man Jin. 2023. Foreign capital inflows, exchange rates, and government stability. Empirical Economics. [Google Scholar] [CrossRef]
- Moraghen, Warren, Boopen Seetanah, and Noor Ul Haq Sookia. 2020. The impact of exchange rate and exchange rate volatility on Mauritius foreign direct investment: A sector-wise analysis. International Journal of Finance & Economics 28: 208–24. [Google Scholar] [CrossRef]
- Moran, Kevin, Dalibor Stevanovic, and Adam Kader Toure. 2022. Microeconomic uncertainty and the COVID-19 pandemic: Measure and impacts on the Canadian economy. Canadian Journal of Economics 55: 379–405. [Google Scholar] [CrossRef]
- Nguyen, Thong Trung, Muhammad Ali Nasir, and Xuan Vinh Vo. 2024. Exchange rate dynamics of emerging and developing economies: Not all capital flows are alike. International Journal of Finance & Economics 29: 1115–24. [Google Scholar] [CrossRef]
- Osinubi, Tokunbo S., and Lloyd A. Amaghionyeodiwe. 2009. Foreign direct investment and exchange rate volatility in Nigeria. International Journal of Applied Economics and Quantitative Studies 6: 83–116. [Google Scholar]
- Pesaran, M. Hashem, Yongcheol Shin, and Ron P. Smith. 1999. Pooled mean group estimation of dynamic heterogeneous panels. Journal of the American Statistical Association 94: 621–34. [Google Scholar] [CrossRef]
- Pesaran, M. Hashem, Yongcheol Shin, and Ron P. Smith. 2001. Bounds testing approaches to the analysis of level relationships. Journal of Applied Economics 16: 289–326. [Google Scholar] [CrossRef]
- Russ, Katheryn Niles. 2007. The endogeneity of the exchange rate as a determinant of FDI: A model entry and multinational firms. Journal of International Economics 71: 344–72. [Google Scholar] [CrossRef]
- Saleem, Hummera, Malik Shahzad Shabbir, Bilal Khan, Shahab Aziz, Maizaitulaidawati Md Husin, and Bilal Ahmed Abbasi. 2021. Estimating the key determinants of foreign direct investment flows in Pakistan: New insights into the co-integration relationship. South Asian Journal of Business Studies 10: 91–108. [Google Scholar] [CrossRef]
- Serenis, Dimitrios, and Nicholas Tsounis. 2012. A new approach for measuring volatility of the exchange rate. Procedia Economics and Finance 1: 374–82. [Google Scholar] [CrossRef]
- Sharifi-Renani, Hosein, and Maryam Mirfatah. 2012. The impact of exchange rate volatility on foreign direct investment in Iran. Procedia Economics Finance 1: 365–73. [Google Scholar] [CrossRef]
- Shrestha, Min B., and Guna R. Bhatta. 2018. Selecting appropriate methodological framework for time series data analysis. The Journal of Finance and Data Science 4: 71–89. [Google Scholar] [CrossRef]
- Statistics Canada, Table 36-10-0026-01. 2023. Balance of International Payments, Flows of Canadian Direct Investment Abroad and Foreign Direct Investment in Canada, by North American Industry Classification System (NAICS), Quarterly (×1,000,000). Available online: https://www150.statcan.gc.ca/t1/tbl1/en/tv.action?pid=3610002601 (accessed on 25 January 2024).
- Sung, Hongmo, and Harvey E. Lapan. 2000. Strategic Foreign Direct Investment and Exchange-Rate Uncertainty. International Economic Review 41: 411–23. [Google Scholar] [CrossRef]
- Vincent, Agunuwa Ekokotu, Inaya Lucky Salubi, and Proso Tomothy. 2017. Evaluating the effect of exchange rate on foreign direct investment (FDI) in Nigeria. Journal of Academic Research in Economics 9: 34–48. [Google Scholar]
- Walsh, James P., and Jiangyan Yu. 2010. Determinants of Foreign Direct Investment: A Sectoral and Institutional Approach. IMF Working Paper No. WP/10/187. Tokyo: International Monetary Fund, Asia Pacific Department. [Google Scholar]
- Warren, Moraghen, B. Seetanah, and N. Sookia. 2023. An investigation of exchange rate, exchange rate volatility and FDI nexus in a gravity model approach. International Review of Applied Economics 37: 482–502. [Google Scholar] [CrossRef]
Figure 1.
Total net FDI inflows to Canada (in million CAD)1, Q1 2007–Q4 2022. Data source: (Statistics Canada, Table 36-10-0026-01 2023).
Figure 1.
Total net FDI inflows to Canada (in million CAD)1, Q1 2007–Q4 2022. Data source: (Statistics Canada, Table 36-10-0026-01 2023).

Figure 3.
Stability of Total Net FDI Model.

Figure 4.
Stability of Models for FDI in industries.


Figure 5.
Stability of net FDI in alternative model.


Table 1.
Quarterly distribution of FDI across industries/sectors in Canada (2022) in million CAD.
| Period | Total Net FDI | Energy and Mining (FDIENMI) | Manufacturing Industries (FDIMF) | Trade and Transport (FDITT) | Finance and Insurance (FDIFIN) | Management of Companies and Enterprises (FDIMNG) | Other Industries (FDIOTH) |
|---|---|---|---|---|---|---|---|
| 2022Q1 | 17,978 | 3118 (17.35%) | 3223 (17.93%) | 77 (0.42%) | 908 (5.06%) | 10,673 (59.36%) | −22 (−0.12%) |
| 2022Q2 | 15,063 | 3650 (24.23%) | 5259 (34.91%) | 1563 (10.37%) | 3784 (25.12%) | −477 (−3.16%) | 1285 (8.53%) |
| 2022Q3 | 18,243 | 2232 (12.23%) | 5001 (27.41%) | 4083 (22.38%) | 1344 (7.37%) | 4179 (22.91%) | 1404 (7.70%) |
| 2022Q4 | 17,221 | 3188 (18.51%) | 3915 (22.73%) | 4311 (25.03%) | 4804 (27.90%) | −45 (−0.26%) | 1047 (6.07%) |
Source: (Statistics Canada, Table 36-10-0026-01 2023).
Table 2.
ADF unit root test result.
| Variables | Test Statistic | p-Value | Stationary Status |
|---|---|---|---|
| FDITOTAL | −4.278 ** | 0.0034 | Stationary in level |
| FDIENMI | −5.479 ** | 0.0000 | Stationary in level |
| FDIMF | −5.238 ** | 0.0001 | Stationary in level |
| FDITT | −4.412 ** | 0.0021 | Stationary in level |
| FDIFIN | −4.659 ** | 0.0008 | Stationary in level |
| FDIMNG | −6.530 ** | 0.0000 | Stationary in level |
| FDIOTH | −5.683 ** | 0.0000 | Stationary in level |
| LNGDP | −3.521 * | 0.0372 | Stationary in level |
| LNOPEN | −2.688 | 0.2411 | Non-stationary in level |
| LNREER | −2.431 | 0.3633 | Non-stationary in level |
| LNVOL | −2.855 | 0.1774 | Non-stationary in level |
| Critical values | α = 0.01, −4.124 | α = 0.05, −3.488 | α = 0.1, −3.173 |
**, * significant at 1 percent and 5 percent levels, respectively.
Table 3.
F-bounds test for cointegration5.
Table 3.
F-bounds test for cointegration5.
| Significance Level | [I(0)] L(10%) | [I(1)] L(10%) | [I(0)] L(5%) | [I(1)] L(5%) | [I(0)] L(2.5% | [I(1)]) L(2.5%) | [I(0)] L(1%) | [I(1)] L(1%) |
|---|---|---|---|---|---|---|---|---|
| Critical Values | 2.45 | 3.52 | 2.86 | 4.01 | 3.25 | 4.49 | 3.74 | 5.06 |
| Equation | ARDL totalfdi lngdp lnopen lnreer lnvol, lags(1 0 1 1 0) ec btest | |||||||
| F-Statistic | 7.994 | Result | Cointegration | |||||
| Equation | ARDL fdienmi lngdp lnopen lnreer lnvol, lags(1 0 0 0 0) ec btest | |||||||
| F-Statistic | 15.474 | Result | Cointegration | |||||
| Equation | ARDL fdimf lngdp lnopen lnreer lnvol, lags(1 0 0 1 1) ec btest | |||||||
| F-Statistic | 12.922 | Result | Cointegration | |||||
| Equation | ARDL fditt lngdp lnopen lnreer lnvol, lags(1 0 0 1 0) ec btest | |||||||
| F-Statistic | 10.148 | Result | Cointegration | |||||
| Equation | ARDL fdifin lngdp lnopen lnreer lnvol, lags(1 0 0 1 1) ec btest | |||||||
| F-Statistic | 10.780 | Result | Cointegration | |||||
| Equation | ARDL fdimng lngdp lnopen lnreer lnvol, lags(1 0 0 0 1) ec btest | |||||||
| F-Statistic | 14.224 | Result | Cointegration | |||||
| Equation | ARDL fdioth lngdp lnopen lnreer lnvol, lags(1 1 0 0 1) ec btest | |||||||
| F-Statistic | 14.923 | Result | Cointegration | |||||
Table 4.
EC and short-run dynamics in ARDL model for net FDI inflows.
| Variable | Coefficient | STD Error | T-Statistics | p-Value |
|---|---|---|---|---|
| ECT (−1) | −0.7958685 | 0.1283949 | −6.20 *** | 0.000 |
| ∆LNGDPt | 55,686.17 | 26,944 | 2.07 ** | 0.043 |
| ∆LNOPENt | −4058.413 | 48,260.94 | −0.08 | 0.933 |
| ∆LNREERt | 127,713.6 | 38,599.68 | 3.31 *** | 0.002 |
| ∆LNVOLt | 3880.538 | 2216.76 | 1.75 * | 0.086 |
| Constant | −1,012,511 | 473,346.8 | −2.14 ** | 0.037 |
| R2 | 0.5061 | Adjusted R2 | 0.4433 | |
Note: ***, **, * significant at 1%, 5%, and 10% levels, respectively.
Table 5.
Estimated long-run coefficient using ARDL model for total net FDI.
| Variable | Coefficient | STD Error | T-Statistics | p-Value |
|---|---|---|---|---|
| LNGDPt−1 | 69,969.07 | 33,166.74 | 2.11 ** | 0.039 |
| LNOPENt−1 | 87,694.13 | 37,910.07 | 2.31 ** | 0.024 |
| LNREERt−1 | 65,256.19 | 24,877.63 | 2.62 ** | 0.011 |
| LNVOLt−1 | 4875.854 | 2673.373 | 1.82 * | 0.074 |
Note: **, * significant at 5% and 10%.
Table 6.
EC and short-run dynamics in ARDL model for FDI in industries.
| Industry/Sector | Variable | Coefficient | STD Error | T-Statistics | p-Value |
|---|---|---|---|---|---|
| Energy and Mining (FDIENMI) | ECT (−1) | −1.121983 | 0.128131 | −8.76 *** | 0.000 |
| ∆LNGDPt | 20,290.28 | 13,950.67 | 1.45 | 0.151 | |
| ∆LNOPENt | −5445.683 | 15,652.36 | −0.35 | 0.729 | |
| ∆LNREERt | 26,247.58 | 10,300.41 | 2.55 ** | 0.014 | |
| ∆LNVOLt | 728.6559 | 1147.577 | 0.63 | 0.528 | |
| Constant | −418,765.3 | 243,999.8 | −1.72 * | 0.092 | |
| Overall Fit Measures | R2 | 0.5758 | Adjusted R2 | 0.5386 | |
| Manufacturing Industries (FDIMF) | ECT (−1) | −0.9861048 | 0.1241345 | −7.94 *** | 0.000 |
| ∆LNGDPt | 14,048.73 | 18,372.53 | 0.76 | 0.448 | |
| ∆LNOPENt | 40,466.99 | 20,709.41 | 1.95 * | 0.056 | |
| ∆LNREERt | 74,235.58 | 25,149.04 | 2.95 *** | 0.005 | |
| ∆LNVOLt | 5552.736 | 2499.272.688 | 2.22 ** | 0.030 | |
| Constant | −327,461.1 | 321,617.7 | −1.02 | 0.313 | |
| Overall Fit Measures | R2 | 0.5889 | Adjusted R2 | 0.5366 | |
| Trade and Transport (FDITT) | ECT (−1) | −0.9573658 | 0.1360218 | −7.04 *** | 0.000 |
| ∆LNGDPt | 5408.358 | 5773.209 | 0.94 | 0.353 | |
| ∆LNOPENt | 4385.413 | 6427.042 | 0.68 | 0.498 | |
| ∆LNREERt | 10,026.85 | 7832.668 | 1.28 | 0.206 | |
| ∆LNVOLt | 355.7322 | 479.5271 | 0.74 | 0.461 | |
| Constant | −71,558.11 | 100375.6 | −0.71 | 0.479 | |
| Overall Fit Measures | R2 | 0.4847 | Adjusted R2 | 0.4295 | |
| Finance and Insurance (FDIFIN) | ECT (−1) | −1.013493 | 0.1396756 | −7.26 *** | 0.000 |
| ∆LNGDPt | 5078.019 | 5458.375 | 0.93 | 0.356 | |
| ∆LNOPENt | 4360.178 | 6079.007 | 0.72 | 0.476 | |
| ∆LNREERt | 14,094.35 | 7527.826 | 1.87 * | 0.066 | |
| ∆LNVOLt | 1459.764 | 771.5681 | 1.89 * | 0.064 | |
| Constant | −80,405.18 | 95,216.37 | −0.84 | 0.402 | |
| Overall Fit Measures | R2 | 0.4981 | Adjusted R2 | 0.4342 | |
| Management of Companies and Enterprises (FDIMNG) | ECT (−1) | −1.070065 | 0.1310698 | −8.16 *** | 0.000 |
| ∆LNGDPt | 14,834.43 | 11,997.36 | 1.24 | 0.221 | |
| ∆LNOPENt | 10,718.42 | 13,390.37 | 0.80 | 0.427 | |
| ∆LNREERt | 4551.116 | 8690.936 | 0.52 | 0.603 | |
| ∆LNVOLt | −1018.394 | 1632.55 | −0.62 | 0.535 | |
| Constant | −230,676.6 | 209,110.9.5 | −1.10 | 0.275 | |
| Overall Fit Measures | R2 | 0.5595 | Adjusted R2 | 0.5123 | |
| Other Industries (FDIOTH) | ECT (−1) | −1.134691 | 0.1320199 | −8.59 *** | 0.000 |
| ∆LNGDPt | −39,251.69 | 21,029.02 | −1.87 | 0.067 | |
| ∆LNOPENt | 24,425.95 | 12,235.82 | 2.00 * | 0.051 | |
| ∆LNREERt | −12,124.32 | 8183.108 | −1.48 | 0.144 | |
| ∆LNVOLt | 2045.576 | 1444.99 | 1.42 | 0.163 | |
| Constant | 187,245.5 | 195,445.2 | 0.96 | 0.342 | |
| Overall Fit Measures | R2 | 0.6157 | Adjusted R2 | 0.5668 | |
Note: ***, **, * significant at 1%, 5%, and 10% levels, respectively.
Table 7.
Estimated long-run coefficients using ARDL for FDI in sectors.
| Industry | Variable | Coefficient | STD Error | T-Statistics | p-Value |
|---|---|---|---|---|---|
| Energy and Mining (FDIENMI) | LNGDPt−1 | 18,084.31 | 12,371.58 | 1.46 | 0.149 |
| LNOPENt−1 | 4853.625 | 13,967.01 | −0.35 | 0.729 | |
| LNREERt−1 | 23,393.93 | 9008.224 | 2.60 ** | 0.012 | |
| LNVOLt−1 | 649.436 | 1020.102 | 0.64 | 0.527 | |
| Manufacturing Industries (FDIMF) | LNGDPt−1 | 14,246.69 | 18,571.79 | 0.77 | 0.446 |
| LNOPENt−1 | 41,037.21 | 20,857.86 | 1.97 * | 0.054 | |
| LNREERt−1 | 31,202.02 | 13,531.79 | 2.31 ** | 0.025 | |
| LNVOLt−1 | 577.2225 | 1571.322 | 0.37 | 0.715 | |
| Trade and Transport (FDITT) | LNGDPt−1 | 5649.208 | 5922.851 | 0.95 | 0.344 |
| LNOPENt−1 | 4580.708 | 6696.589 | 0.68 | 0.497 | |
| LNREERt−1 | −710.5176 | 4362.839 | −0.16 | 0.871 | |
| LNVOLt−1 | 371.5739 | 490.9721 | 0.76 | 0.452 | |
| Finance and Insurance (FDIFIN) | LNGDPt−1 | 5010.415 | 5357.417 | 0.94 | 0.354 |
| LNOPENt−1 | 4302.13 | 5993.253 | 0.72 | 0.476 | |
| LNREERt−1 | 2112.857 | 3901.402 | 0.54 | 0.590 | |
| LNVOLt−1 | 353.1931 | 453.4005 | 0.78 | 0.439 | |
| Management of Companies and Enterprises (FDIMNG) | LNGDPt−1 | 13,863.11 | 11,447.45 | 1.21 | 0.231 |
| LNOPENt−1 | 10,016.6 | 12,485.86 | 0.80 | 0.426 | |
| LNREERt−1 | 4253.121 | 8213.515 | 0.52 | 0.607 | |
| LNVOLt−1 | 1520.994 | 969.5335 | 1.57 | 0.122 | |
| Other Industries (FDIOTH) | LNGDPt−1 | −7024.7 | 9848.779 | −0.71 | 0.479 |
| LNOPENt−1 | 21,526.52 | 10,527.39 | 2.04 ** | 0.046 | |
| LNREERt−1 | −10,685.13 | 7093.479 | −1.51 | 0.138 | |
| LNVOLt−1 | 56.44542 | 817.9582 | 0.07 | 0.945 |
Note: ***, **, * significant at 1%, 5%, and 10% levels, respectively.
Table 8.
Serial correlation tests for FDI in sectors.
| Equation | Durbin–Watson d-Statistic | Breusch–Godfrey LM Test | Result |
|---|---|---|---|
| Energy and Mining (FDIENMI) | 2.006071 | Chi2 = 0.014 p-value = 0.9044 | No serial correlation |
| Manufacturing Industries (FDIMF) | 2.114834 | Chi2 = 1.563 p-value = 0.2112 | No serial correlation |
| Trade and Transport (FDITT) | 1.913474 | Chi2 = 0.967 p-value = 0.3254 | No serial correlation |
| Finance and Insurance (FDIFIN) | 1.927294 | Chi2 = 0.144 p-value = 0.7047 | No serial correlation |
| Management of Companies and Enterprises (FDIMNG) | 2.043401 | Chi2 = 0.752 p-value = 0.3858 | No serial correlation |
| Other Industries (FDIOTH) | 1.987832 | Chi2 = 0.003 p-value = 0.9535 | No serial correlation |
Table 9.
Homoscedasticity and normal distribution tests for FDI in sectors.
| Equation | White’s Test for Homoscedasticity | Result | Jarque–Bera Normality Test | Result |
|---|---|---|---|---|
| Energy and Mining (FDIENMI) | Chi2 (20) = 21.65 p-value = 0.3601 | Homoscedastic | Chi2 = 16.5 p-value = 0.00026 | Not Normally Distributed |
| Manufacturing Industries (FDIMF) | Chi2 (35) = 50.18 p-value = 0.046 | Heteroscedastic | Chi2 = 113.1 p-value = 2.7 × 10⁻²⁵ | Not Normally Distributed |
| Trade and Transport (FDITT) | Chi2 (27) = 27.34 p-value = 0.4454 | Homoscedastic | Chi2 = 1.787 p-value = 0.4092 | Normally Distributed |
| Finance and Insurance (FDIFIN) | Chi2 (35) = 35.68 p-value = 0.4361 | Homoscedastic | Chi2 = 2.416 p-value = 0.2988 | Normally Distributed |
| Management of Companies and Enterprises (FDIMNG) | Chi2 (27) = 28.85 p-value = 0.3681 | Homoscedastic | Chi2 = 19.34 p-value = 6.3 × 10⁻⁵ | Not Normally Distributed |
| Other Industries (FDIOTH) | Chi2 (35) = 39.32 p-value = 0.2826 | Homoscedastic | Chi2 = 676 p-value = 2 × 10−147 | Not Normally Distributed |
Table 10.
EC and short-run dynamics in ARDL alternative model for net FDI (aggregate).
| Variable | Coefficient | STD Error | T-Statistics | p-Value |
|---|---|---|---|---|
| ECT (−1) | −0.8197537 | 0.1254389 | −6.54 *** | 0.000 |
| ∆LNGDP t | 74,449.34 | 28,101.16 | 2.65 ** | 0.011 |
| ∆LNOPENt | 76,998.87 | 30,570.11 | 2.52 ** | 0.015 |
| ∆LNREERt | 156,240 | 41,417.96 | 3.77 *** | 0.000 |
| ∆LNVOLt | 5173.725 | 2334.7 | 2.22 ** | 0.031 |
| dum2008q4t | 15,627.67 | 8592.137 | 1.82 * | 0.074 |
| dum2020q2t | 17,380.83 | 8559.968 | 2.03 ** | 0.047 |
| Constant | −1,341,135 | 493,876.3 | −2.72 *** | 0.009 |
| R2 | 0.5399 | Adjusted R2 | 0.4717 | |
Note: ***, **, * significant at 1%, 5%, and 10% levels, respectively.
Table 11.
EC and long-run dynamics in ARDL alternative model for net FDI (aggregate).
| Variable | Coefficient | STD Error | T-Statistics | p-Value |
|---|---|---|---|---|
| LNGDPt−1 | 90,819.16 | 33,526.86 | 2.71 *** | 0.009 |
| LNOPENt−1 | 93,929.27 | 35,825.29 | 2.62 ** | 0.011 |
| LNREERt−1 | 78,548.72 | 24,867.09 | 3.16 *** | 0.003 |
| LNVOLt−1 | 6311.317 | 2707.447 | 2.33 ** | 0.024 |
| dum2008q4t−1 | 19,063.86 | 10,635.04 | 1.79 * | 0.079 |
| dum2020q2t−1 | 21,202.51 | 10,243.03 | 2.07 ** | 0.043 |
Note: ***, **, * significant at 1%, 5%, and 10%, respectively.
Disclaimer/Publisher’s Note: The statements, opinions and data contained in all publications are solely those of the individual author(s) and contributor(s) and not of MDPI and/or the editor(s). MDPI and/or the editor(s) disclaim responsibility for any injury to people or property resulting from any ideas, methods, instructions or products referred to in the content. |
© 2024 by the authors. Licensee MDPI, Basel, Switzerland. This article is an open access article distributed under the terms and conditions of the Creative Commons Attribution (CC BY) license (https://creativecommons.org/licenses/by/4.0/).
Share and Cite
MDPI and ACS Style
Lajevardi, H.; Chowdhury, M. How Does the Exchange Rate and Its Volatility Influence FDI to Canada? A Disaggregated Analysis. J. Risk Financial Manag. 2024, 17, 88. https://doi.org/10.3390/jrfm17020088
AMA Style
Lajevardi H, Chowdhury M. How Does the Exchange Rate and Its Volatility Influence FDI to Canada? A Disaggregated Analysis. Journal of Risk and Financial Management. 2024; 17(2):88. https://doi.org/10.3390/jrfm17020088
Chicago/Turabian StyleLajevardi, Hooman, and Murshed Chowdhury. 2024. "How Does the Exchange Rate and Its Volatility Influence FDI to Canada? A Disaggregated Analysis" Journal of Risk and Financial Management 17, no. 2: 88. https://doi.org/10.3390/jrfm17020088