
Testing of Portfolio Optimization by Timor-Leste Portfolio Investment Strategy on the Stock Market


1
Faculty of Economics and Management, National University of Timor Lorosa’e (UNTL), Avenida Cidade de Lisboa, Díli 10000, Timor-Leste
2
GOVCOPP—Research Unit on Governance, Competitiveness and Public Policies, Department of Economics, Management, Industrial Engineering and Tourism (DEGEIT), University of Aveiro, Campus Universitário de Santiago, 3810-193 Aveiro, Portugal
3
GOVCOPP Unit Research, Aveiro Institute of Accounting and Administration, University of Aveiro (ISCA-UA), Campus Universitário de Santiago, 3810-902 Aveiro, Portugal
*
Author to whom correspondence should be addressed.
J. Risk Financial Manag. 2024, 17(2), 78; https://doi.org/10.3390/jrfm17020078
Submission received: 19 December 2023
/
Revised: 13 February 2024
/
Accepted: 13 February 2024
/
Published: 18 February 2024
(This article belongs to the Section Mathematics and Finance)
Abstract
:An efficient and effective portfolio provides maximum return potential with minimum risk by choosing an optimal balance among assets. Therefore, the objective of this study is to analyze the performance of optimized portfolios in minimizing risk and achieving maximum returns in the dynamics of Timor-Leste’s equity portfolio in the international capital market for the period from January 2006 to December 2019. The empirical findings of this study indicate that the correlation matrix showed that JPM has a very strong positive correlation with one of the twenty assets, namely BAC (0.80). Moreover, the optimal portfolio of the twenty stocks exceeding 10% consists of four consecutive stocks, namely DGE.L (10.69%), NSRGY (10.37%), JPM (10.04%), and T (10.03%). In addition, the minimum portfolio consists of two stocks with a minimum variance of more than 10%, namely SAP.DE (11.20%) and DGE.L (10.39%). The evaluation of the optimal portfolio using Markowitz parameters also showed that the highest expected return and the lowest risk were 1.22% and 3.12%, respectively.
1. Introduction
Portfolio construction is a systematic investment management process that begins with the careful selection of optimal assets and the determination of their allocation to achieve a balance between potential returns and risks. Therefore, portfolio construction depends on the investment strategy, risk tolerance, and use of liabilities (Ta et al. 2020). Markowitz, credited with pioneering modern finance theory, established a framework for selecting portfolio allocations under uncertainty (Markowitz 1952). This framework describes a portfolio in terms of returns, allowing investors to efficiently avoid risk according to expected returns and the variance of portfolio returns (Mukherji and Jeong 2021; van Staden et al. 2021). Therefore, investors build portfolios intending to increase returns, with the expectation of minimal risk when optimizing the portfolio (Chalkis et al. 2021). Moreover, the key problem of the optimal portfolio is the inversion of the covariance matrix, so the relationship between the assets in the portfolio and the correlation of returns contribute to the portfolio risk (Olmo 2021). Thus, the average portfolio variance model is considered a representative of portfolio variance with minimum risk and maximum portfolio return (Thavaneswaran et al. 2021).
Following Markowitz’s research and recent studies by Chaweewanchon and Chaysiri (2022) and Mba et al. (2022), the model mean-variance (MV) optimizes portfolios based on expected returns and risk, highlighting two important aspects, namely (i) improving performance by selecting good assets and (ii) weaknesses in asset class allocation and the inability to account for skewness and kurtosis and a lack of risk diversification. Therefore, global asset allocation strategies based on sectors across multiple countries perform better than those based only on countries because sector portfolios offer greater diversification benefits than country portfolios (Umutlu and Bengitöz 2020). Moreover, a portfolio strategy based on risk minimization is also strong in transaction costs (Výrost et al. 2019). Similarly, Bessler et al. (2021) showed the optimal asset allocation strategy when Sharpe, omega, and alpha ratios are higher compared to country-based allocations.
The investment strategy depends on the investor’s objectives, risk tolerance, and investment horizon. In the short term, investors prefer momentum strategies because they can identify market opportunities and make quick profits. In the long term, on the other hand, investors prefer a contrarian strategy, which aims to buy stocks at a lower price and hold them until their value increases (Abukari and Otchere 2020; Day et al. 2022; Mohapatra and Misra 2020). In addition, studies by Kassi et al. (2019) showed that market risk has a significant impact on a company’s financial performance. In portfolio investing, a diversified portfolio strategy must also be considered to reduce the risk of both systematic and unsystematic risk. Naqvi et al. (2022) and Sahabuddin et al. (2022) therefore argued that diversifying investments across different assets is the optimal approach to mitigate portfolio risk and maximize returns. Understanding risk tolerance concerning financial objectives thus enables an effective and sustainable portfolio strategy for long-term investments. Thus, investors are willing to take risks in pursuit of higher returns with the desire to minimize investment risk (Liu et al. 2022).
Given the increasing interconnectedness of economic and financial markets, asset managers must select an investment universe that offers excellent diversification and performance opportunities. The real side of economies affects changes in equity market correlations at both the country and sector levels. Although the literature provides ample evidence of financial market integration and changes in correlation structures, further research is needed on the impact on asset allocation strategies, portfolio optimization decisions, and investment performance (Bessler et al. 2021). The result showed that the difference in the Sharpe ratio of industry portfolios versus country portfolios is economically relevant in many situations analyzed, but not statistically significant.
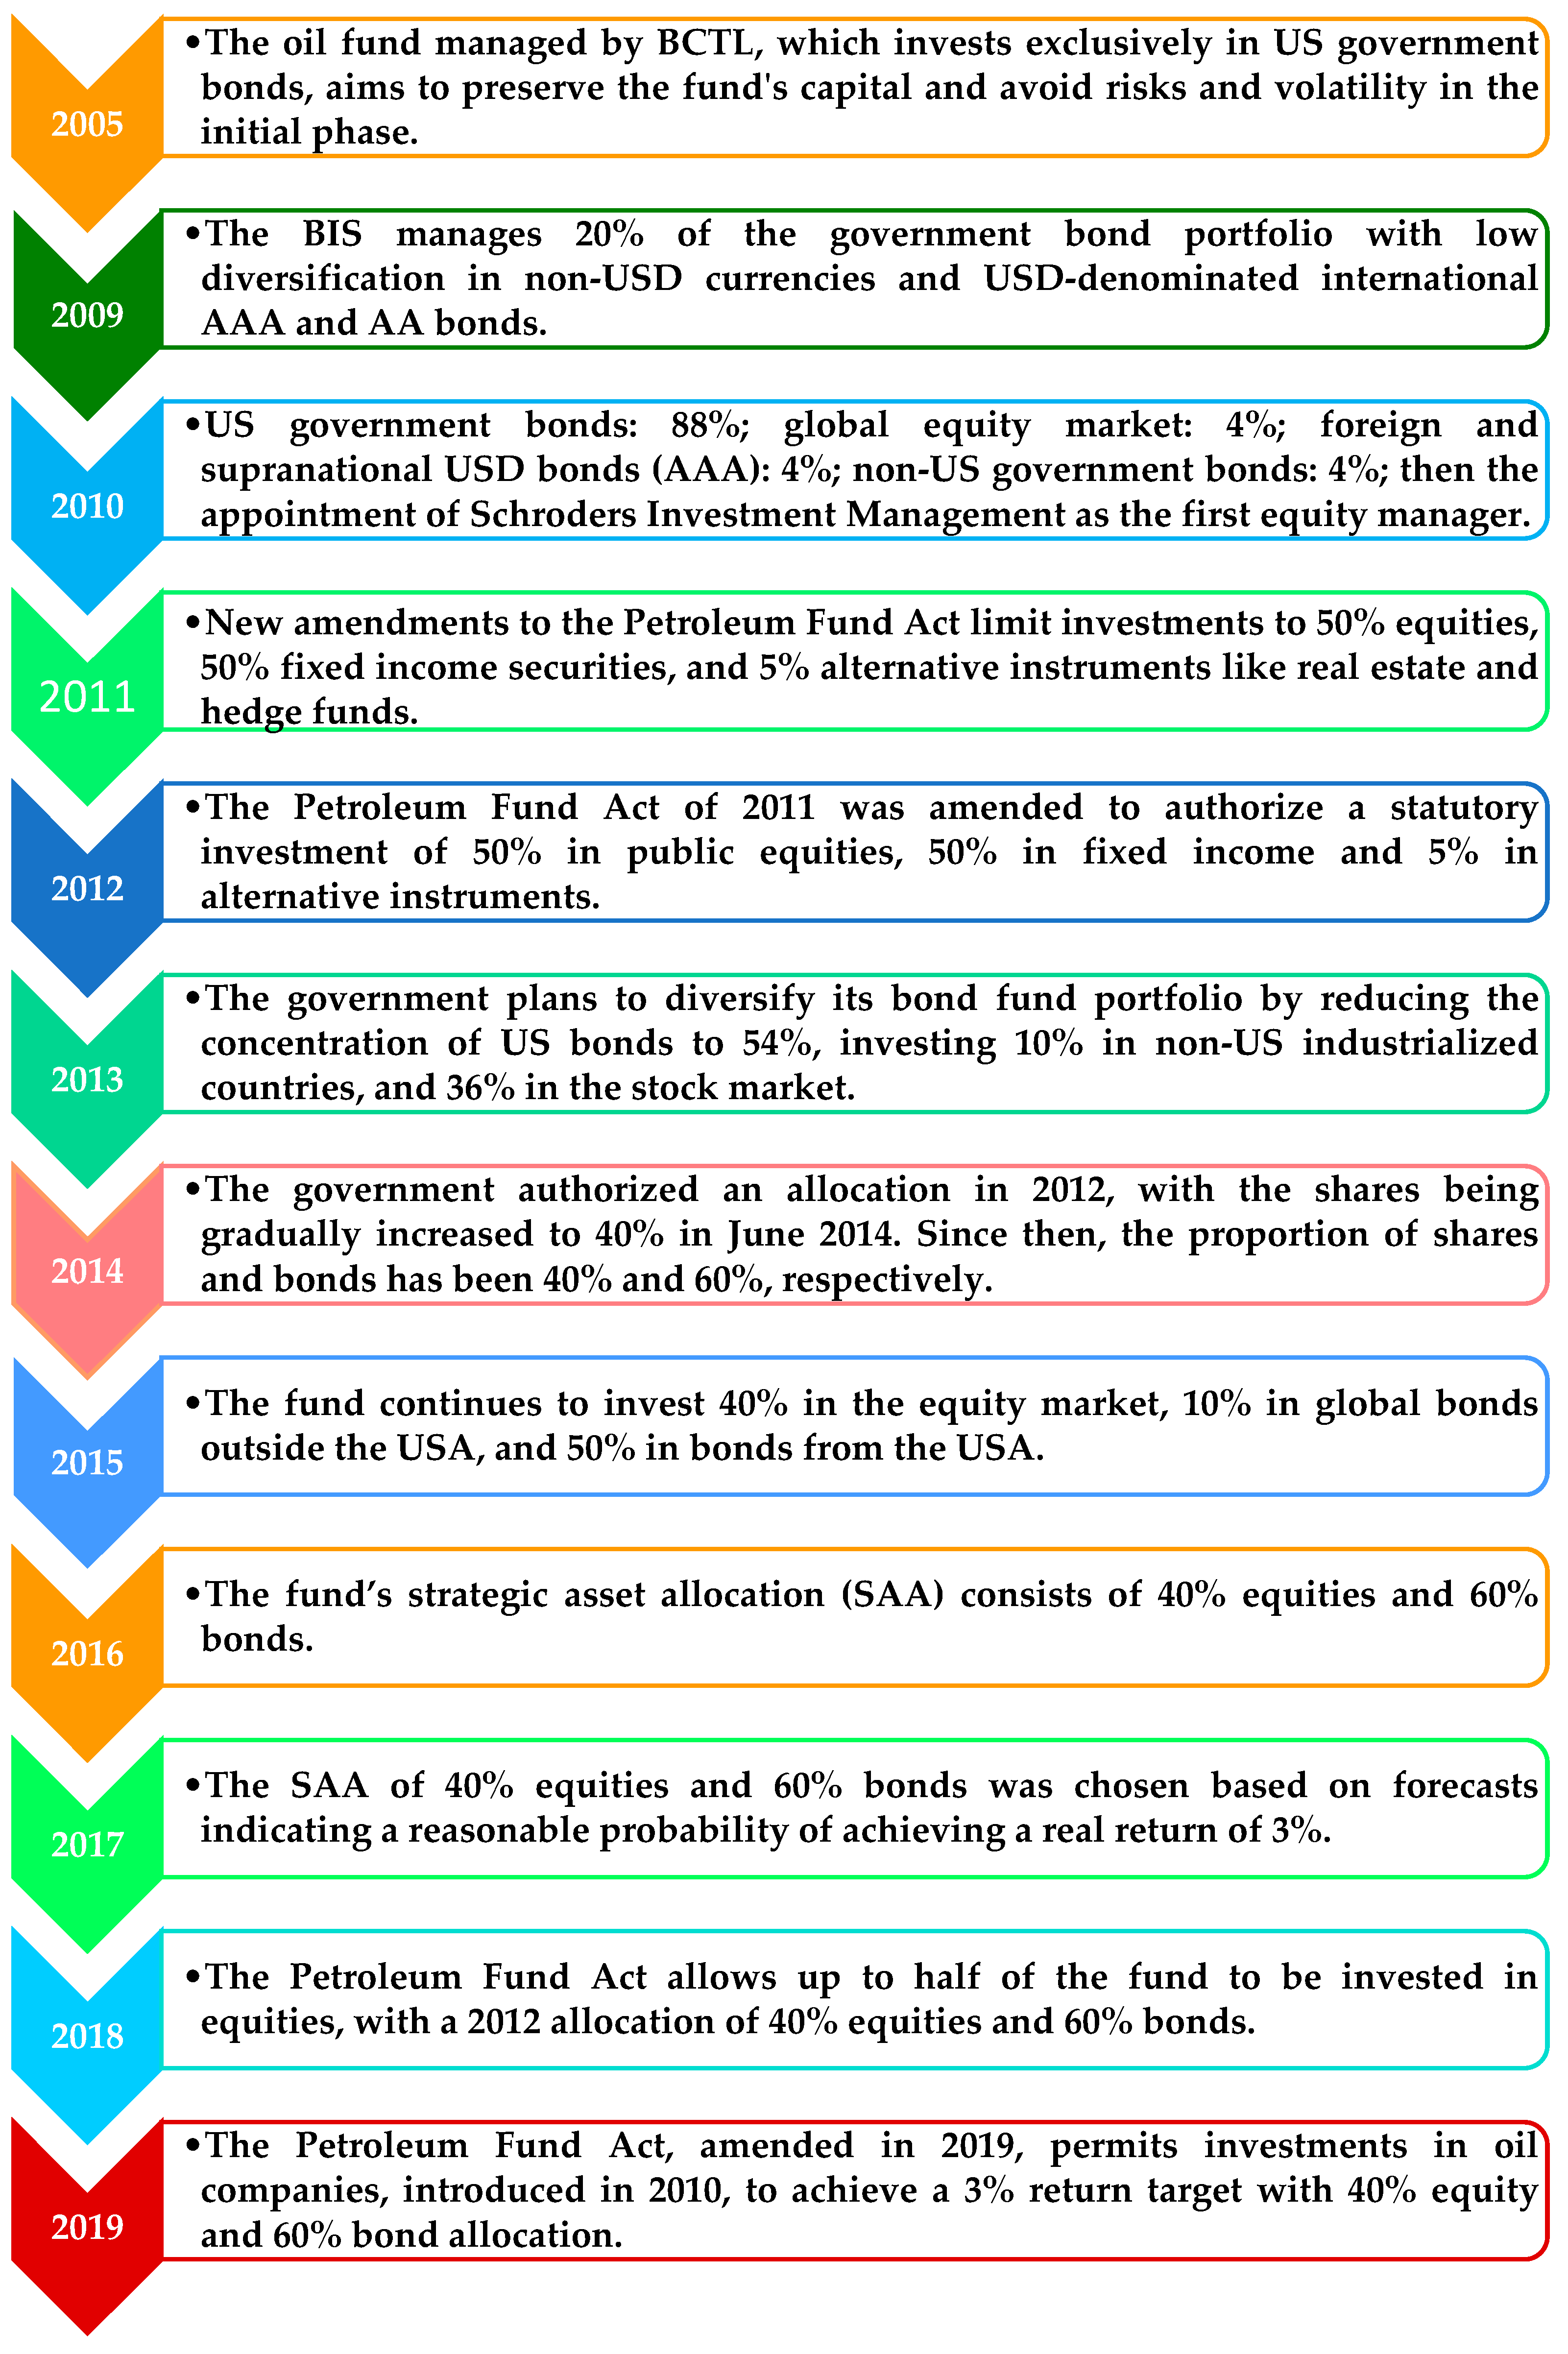
Since 2005, oil investment has occurred with a simple strategy of investing 90% of funds in the US bond market with cash deposits and 10% in other financial markets (Timor-Leste Ministry of Finance 2010). In each investment, the strategy for developing the Petroleum Fund portfolio has changed since its inception in the period 2005–2019, as summarized in Figure 1. In 2009, investment was still made in government bonds, but the portfolio diversification by the Bank for International Settlements (BIS) was 20%. Thereafter, the investment strategy changed significantly from 2010 to 2019, with investments in US bonds dominating at 50%, while 10% was not invested in US bonds. Although equity investments are risky, the government continues to invest 40% in global equities (Timor-Leste Ministry of Finance 2011, 2012, 2013, 2014, 2015, 2016, 2017, 2018, 2019). Accordingly, the investment strategy was only changed for US government bonds to protect the fund’s initial investment by minimizing risk and anticipating volatility. Therefore, the investment strategy was changed in 2010 by investing 4% of the oil funds in the global equity markets (Timor-Leste Ministry of Finance 2010). This investment was made because to reduce risk and volatility in volatile financial markets, it is necessary to determine the optimal weightings and hedging ratios to minimize risk and increase maximum returns (Wen et al. 2021). In addition, asset prices contain information about the expected cash flows of future investments and the associated risks. Therefore, the risk effect is small, so assets with higher risk are associated with lower returns (Milcheva 2022).
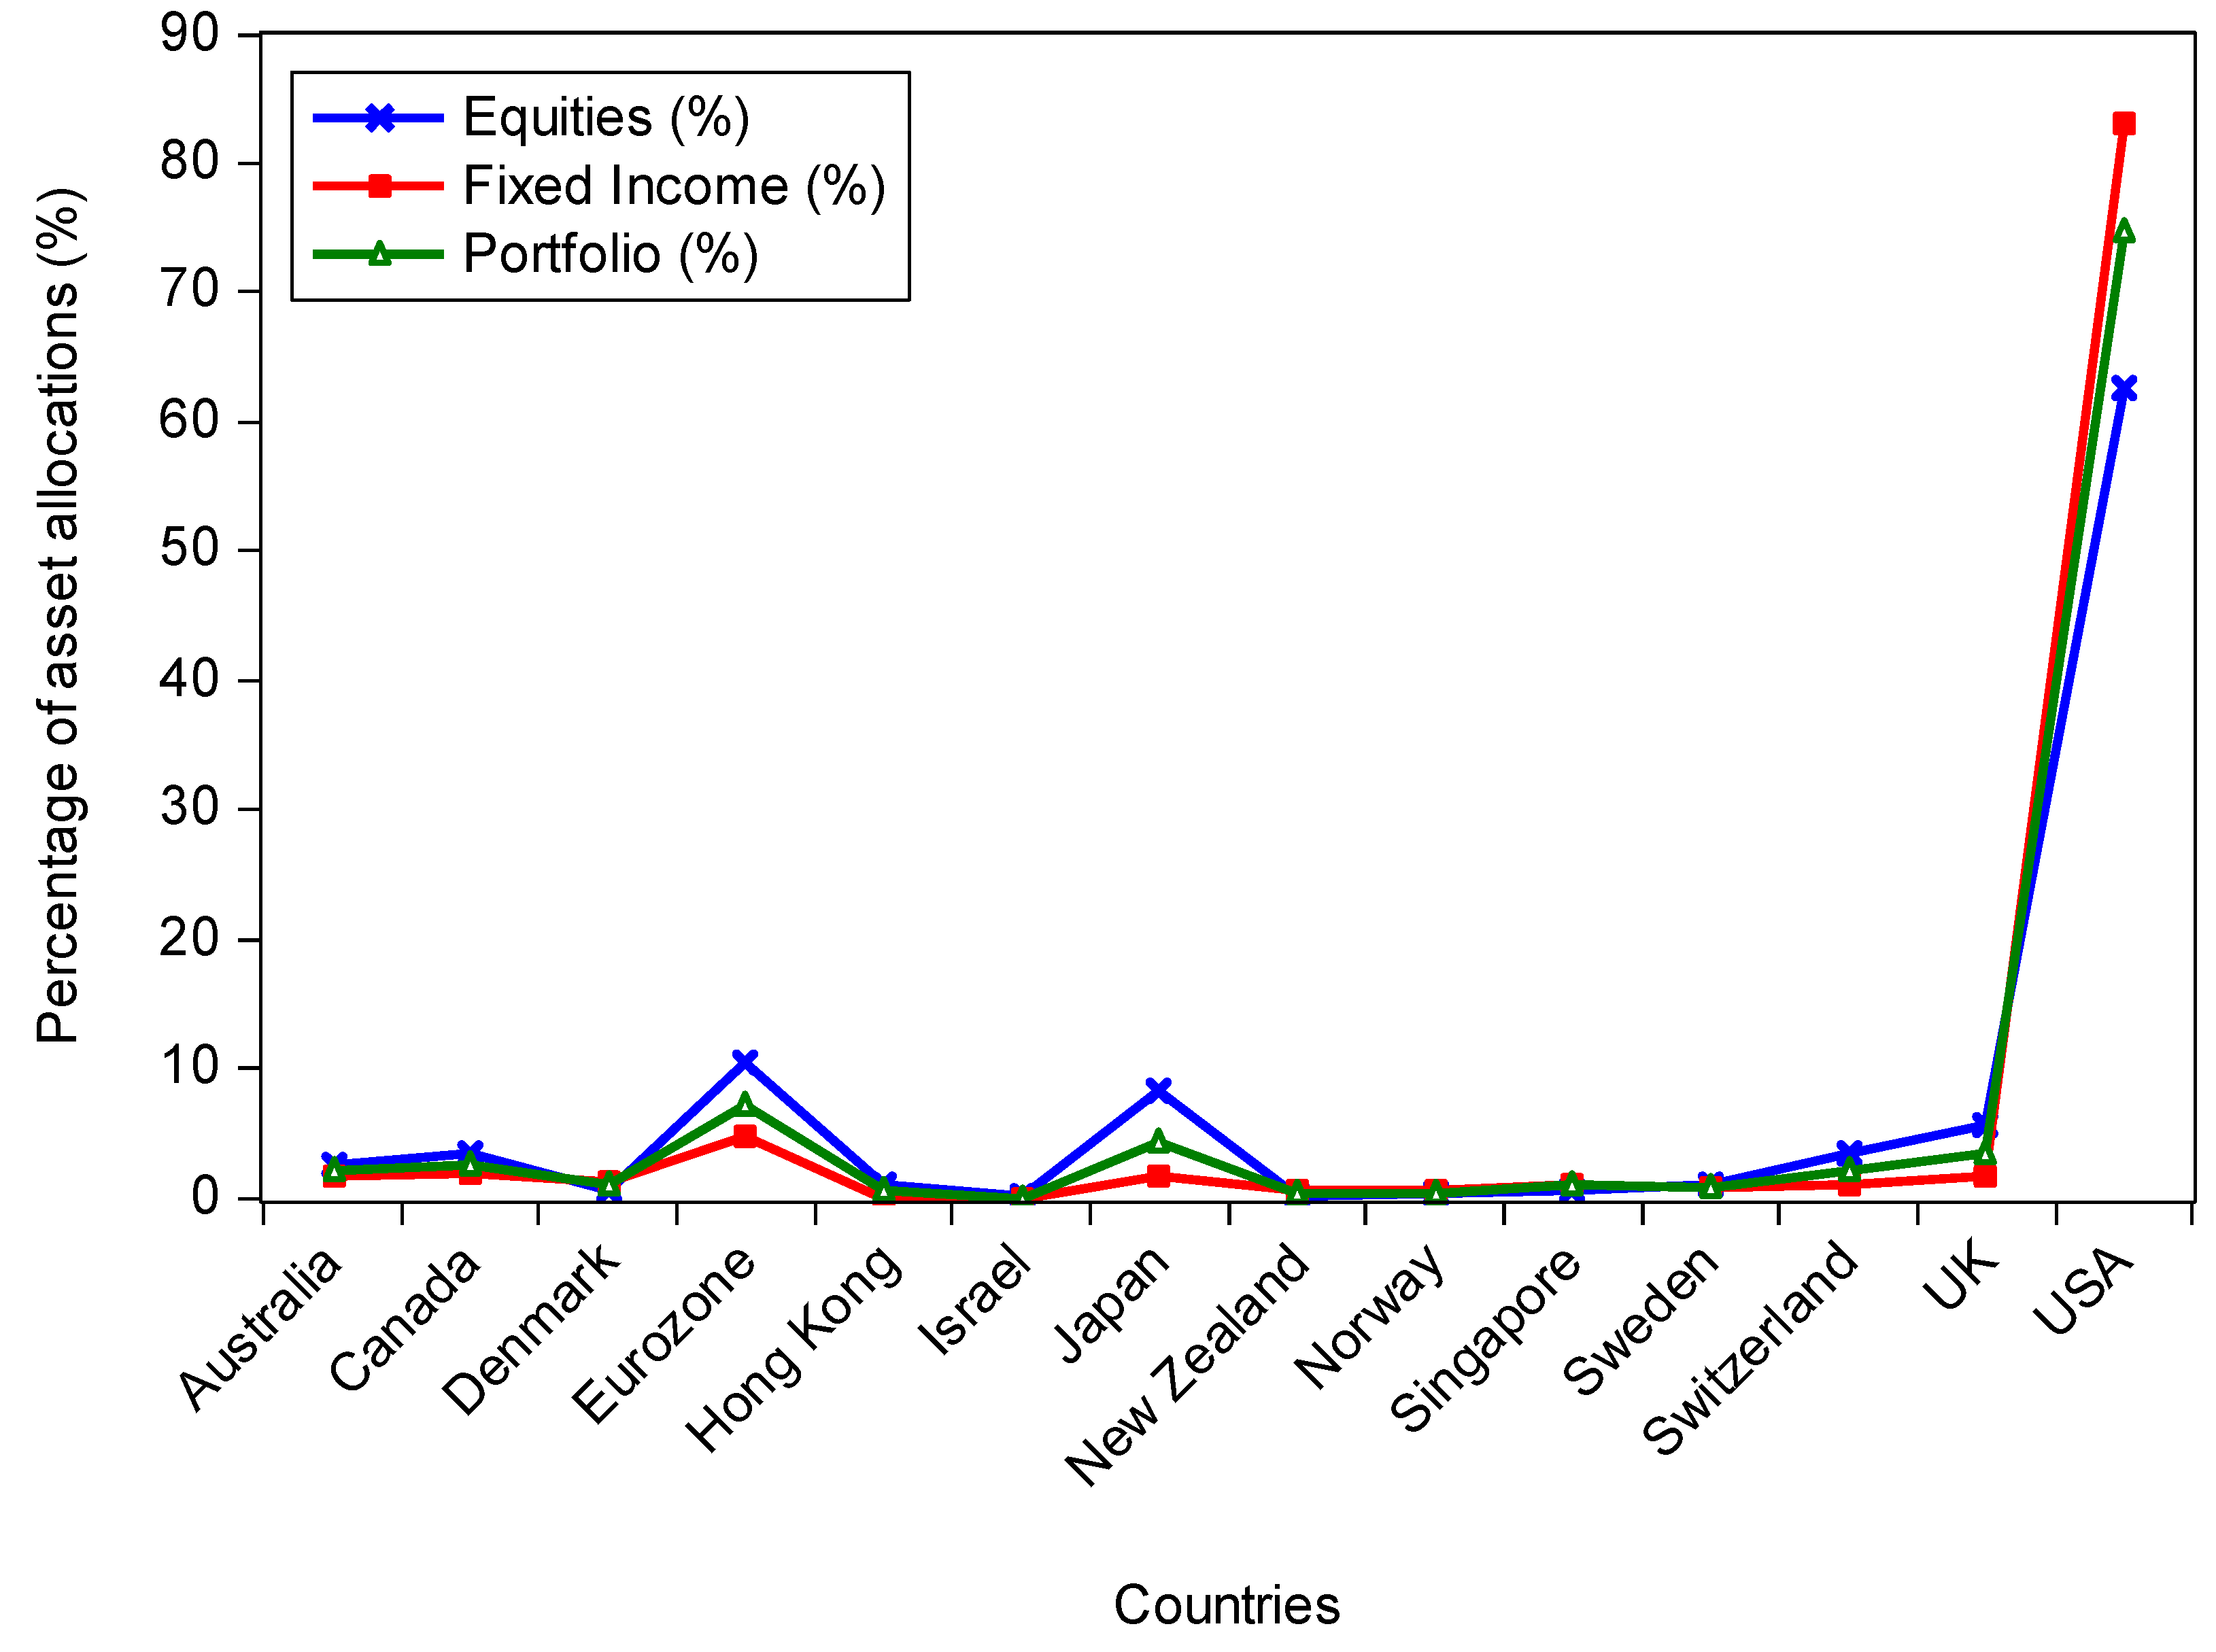
The accumulated funds, which reached USD 11.8 billion in 2012 after the change in investment strategy in 2011, provided investment opportunities for long-term diversification of assets into regional or country-specific investments (Timor-Leste Ministry of Finance 2010). As shown in Figure 2 (Timor-Leste Ministry of Finance 2019), more than 60% of the fund’s equity portfolio is predominantly invested in companies listed in the USA, while Europe, Japan, the United Kingdom, and Canada account for 16%, 8.3%, 5.7%, and 3.4%, respectively. Over 80% of the fund’s fixed income portfolio, which consists of cash, 3- to 5-year US government bonds, and 5- to 10-year US government bonds, is invested in the US. The fund invests over 70% of its cash and private debt in the US, the Eurozone (7.1%), followed by Japan (4.3%), the UK (3.4%) and Canada (2.5%). Most of the portfolio is therefore denominated in US dollars. Investing in petroleum mutual funds, which are invested in stocks and bonds, employs the principle of diversification in asset allocation to maximize financial returns and minimize risk. To comply with the principle of diversification, an allocation strategy of 40% equities and 60% bonds was adopted in 2012, based on the assessment that this allocation is likely to generate a 3% real return (Timor-Leste Ministry of Finance 2018). The 60/40 model is a traditional asset allocation model that focuses mainly on equity exposure and multi-asset strategies. In addition, bond allocation is a way to control risk through fixed asset allocation (Fabozzi et al. 2021).
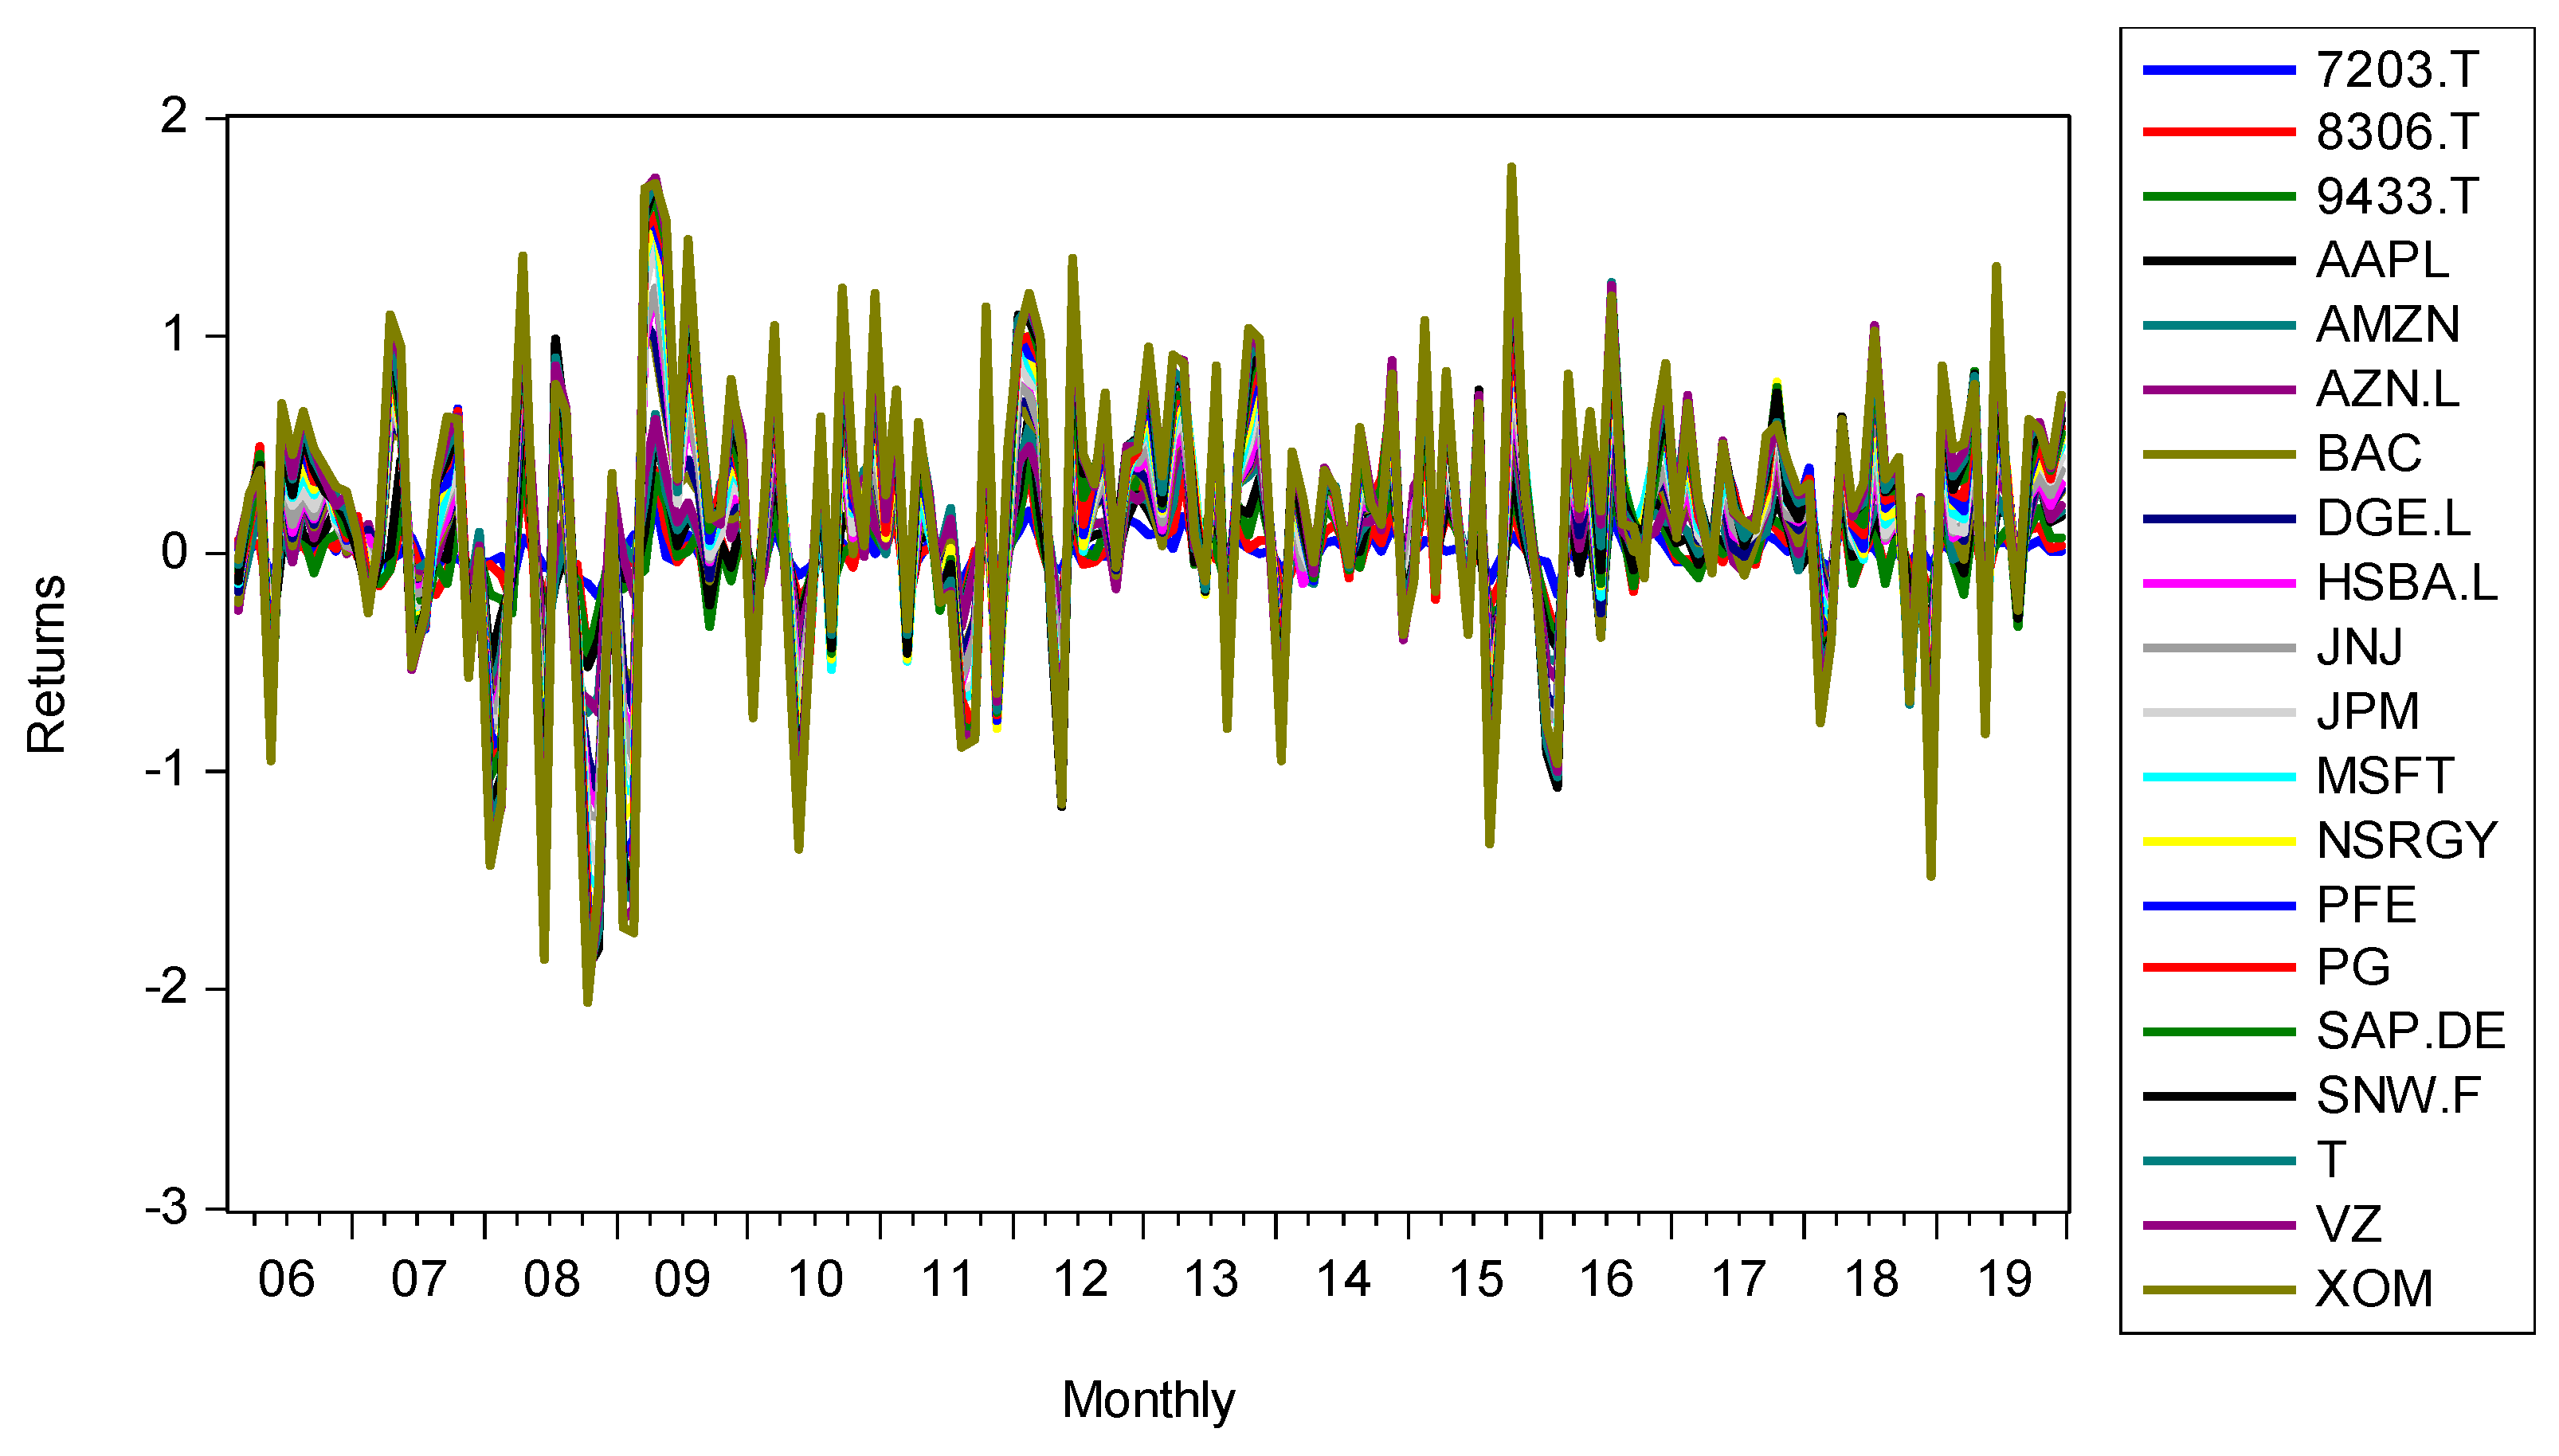
While investing in the equity assets shown in Table 1, Figure 3 shows the monthly returns of the twenty assets selected by Timor-Leste for investment in the capital market from 2006 to 2019. Of the twenty assets, the return fluctuated both positively and negatively in each month from 2006 to 2019. For example, BAC reached the highest return of 0.73 in March 2009, followed by AMZN in April 2007, but the return of BAC decreased to 0.41 in July 2008, followed by 8306.T with 0.34 in April 2008. In addition, the return of BAC decreased by 0.28 in January 2012 and again in November 2016. Furthermore, the return of AAPL decreased by 0.20 in August 2018. In addition to positive fluctuations, BAC also experienced negative fluctuations, which were −0.52 in January 2009 and −0.33 in November. In the same year, namely 2008, AAPL and 8306.T also recorded a return of −0.33 in September and October, respectively. Moreover, AAPL recorded a return decline of −0.32 in January 2008 and AMZN recorded a decline of −0.30 in July 2006.
The main motivation for our empirical research is threefold. First, we trace the evolution of portfolio investment aimed at minimizing risk through diversified asset allocation, by using the MV model as a decision-making approach for portfolio construction and portfolio performance measurement, as proposed by the famous Markowitz (1952) in modern portfolio theory (MPT) as a practical method for portfolio investment. Second, our research examines portfolio optimization using Timor-Leste’s portfolio investment strategies in international stock markets. For example, Timor-Leste has an oil fund that serves as a government budget to finance development and investments on US stock exchanges such as the National Association of Securities Dealers Automated Quotations (NASDAQ), the New York Stock Exchange (NYSE), the London Stock Exchange (LSE), and the Tokyo Stock Exchange. These investments were made because each newly independent country became the main source of funding for the development process. Investment funds play an important role in promoting the development process, especially in the capital market. Capital accumulation through asset sources is important for portfolio investments in the stock market. Therefore, capital market investments have an impact on macroeconomic indicators (Olokoyo et al. 2020). Third, given that Timor-Leste is a new country and is still focusing on infrastructure development to drive economic development, our research focuses on 20 equity investments with the largest total investment value of any other company invested in the Americas, Europe, and Asia.
In the current global economy, investment is a mainstay of economic growth (Rehman et al. 2023). In capital contributions, Timor-Leste needs to invest in international financial markets. Why is this the case? Because Timor-Leste does not have a domestic capital market, and when investors invest, they need to follow a portfolio strategy. Timor-Leste’s portfolio strategy provides investment opportunities that are consistent with the principle of portfolio diversification. This principle aims to maximize financial gains relative to the risk of risk-bearing capacity (Timor-Leste Ministry of Finance 2021). Portfolio diversification is also important for the protection of capital in terms of the long-term financial stability of the investments. These portfolio investments create the potential for capital flows to promote economic development. This is because Timor-Leste, as a developing country, is still investing in the expansion of public infrastructure and human development (Rehman et al. 2023). In addition, the investments and strategies employed provide opportunities for access to international markets with significant benefits in increasing equitable economic development to achieve middle income in support of the common good. This will ensure investment in the future by creating jobs through the diversification of the oil industry (Strategic Development Plan 2011).
This study contributes to the literature in several ways. First, to our knowledge, our study is the first to examine portfolio optimization with Timor-Leste equity investment strategies in global capital markets between January 2006 and December 2019. Second, our empirical results make an important contribution to the existing gaps in the literature on portfolio optimization with investment strategies in various research dimensions (Agarwal and Muppalaneni 2022; Chaweewanchon and Chaysiri 2022; Kumar et al. 2022; Mba et al. 2022). Thirdly, it will provide investors (especially the Timor-Leste government) with an understanding of the efficiency of Timor-Leste’s portfolio investment strategy in the stock markets. The results of this study can be an important reference for other countries making similar equity investments in their investment decisions. The empirical results of this study show, through the correlation matrix, a strong positive correlation between JPM and BAC. The optimal portfolio with twenty stocks above 5% consists of nine stocks, while the minimum portfolio consists of eight stocks with a minimum variance above 5%. The optimal portfolio has the highest expected return and the lowest risk. This article therefore addresses two research questions. The first research question relates to determining the most advantageous distribution of weights for an investment portfolio that maximizes return while minimizing risk. The second question relates to determining the asset allocation methods that provide the highest returns and lowest risks in the stock market portfolios for investors in Timor-Leste.
The remainder of this research is organized as follows. A detailed literature review of previous studies is provided in Section 2. Data and methodology are presented in Section 3. Empirical results are reported in Section 4. Results are discussed in Section 5 and concluding remarks are presented in Section 6.
2. Literature Review
2.1. Mean-Variance Portfolio Optimization
An important component of investment activity is portfolio formation according to the Markowitz model of mean-variance optimization. To prove this investment framework, Mba et al. (2022) used the Behavioral Mean-Variance (BMV) and Copula Behavioral Mean-Variance (CBMV) methods in their latest study to evaluate the effectiveness and adaptability of the methods in different asset classes. The study shows that the BMV and CBMV approaches are differently effective in different markets. Stocks with lower behavioral values tend to perform better than those with higher values. On the foreign exchange market, however, the opposite tendency can be observed for the BMV approach.
The Markowitz portfolio optimization technique is used to evaluate investment risk by considering mean-variance and semi-variance risk measures. This technique underlines the very important role of financial markets in fostering economic growth through investment. For instance, a study by Kumar et al. (2022) aims to construct different portfolios in the asset classes 1/N (naïve portfolio), maximum return portfolio and market, and minimum variance portfolio with and without short-selling constraints. The authors highlight the following findings: (i) the market and minimum variance portfolios are optimal for short-selling restrictions and offer higher returns compared to lower risks; (ii) the best-diversified portfolio is the one that outperforms both the naïve and the maximum portfolio; (iii) the mean-variance risk measure leads to a market portfolio that is unique in terms of expected return despite a lower standard deviation and a higher Sharpe ratio; and (iv) the mean-variance approach leads to higher returns and risks for portfolios with minimum variance and market portfolios without short sales than the semi-variance approach. Therefore, this study suggests conducting further investment studies and constructing a portfolio. In addition, to improve financial performance, it is very important to integrate new risk measurements and conduct an accurate and thorough review of financial reports to facilitate the decision-making process of managers.
The stock market is an economic activity that contributes to economic growth. Investing in equities offers investors the opportunity to diversify their investment decisions through portfolios. Modern portfolio theory, according to Markowitz, aims to maximize profit and take a certain amount of risk into account. However, this theory assumes a normal distribution of profits, which is no longer valid due to distorted financial time series2. In a study by Khan et al. (2020), the authors highlight several important findings for the emerging Asian and Pacific equity markets, including (i) that skewness and kurtosis portfolios are more sustainable and differ significantly from mean-variance optimized portfolios due to the presence of asymmetric and fat-tail risks; and (ii) that the importance of an optimal portfolio lies in the balance between risk and return, which ensures sustainable returns. Thus, this study confirms the asymmetry and excessive kurtosis in stock returns and emphasizes the importance of risk factors in the construction of sustainable and optimal portfolios.
In portfolio management, managers make decisions according to the principles of the portfolio diversification strategy. This strategy decision is made to achieve a balance between return and risk during the investment period. As found in a study by Ta et al. (2020), a portfolio optimization strategy using equal-weighted models, Monte Carlo simulation, and mean-variance optimization can significantly increase returns and Sharpe ratios as well as portfolio construction. The study concluded that the portfolios constructed using the long–short-term memory model (LSTM) outperformed the S&P 500 benchmark index in terms of active return and Sharpe ratio. Furthermore, Rigamonti (2020) came to two important conclusions in his research. First, mean-variance optimization is often compared to optimization methods that incorporate negative risk measures, such as semi-variance. However, semi-variance is more in line with the preferences of rational investors. Second, this study shows that the popularity of variance as a risk measure is justified. This is because variance consistently outperforms the other measures in both simulated and real data scenarios. In summary, the use of mean-variance optimization as a basis for a prudent approach to asset allocation decisions makes sense. It can therefore be argued that the widespread use of variance as a measure of risk is justified.
2.2. Portfolio Optimal Strategy
The inverse of the covariance matrix determines the optimal investment by expecting a large variance and accepting a low asset allocation in a portfolio investment. Therefore, the optimal portfolio strategy must include more than the low central securities and less than the high central securities. Thus, diversification must combine the centrality of assets in the portfolio and the optimal distribution of assets in the portfolio with minimal variance. The results of Olmo (2021) showed that the loss function associated with the minimum-variance portfolio is positively or negatively related to the centrality of the positive and negative eigenvectors under the short sale constraint but cannot be generalized beyond that. Moreover, this relationship does not imply a monotonic relationship between the centrality of assets and their optimal portfolio allocation. These theoretical findings are empirically illustrated by a portfolio allocation with assets from the financial markets of the US and the United Kingdom. Moreover, each investor is always optimistic about reducing risk and increasing returns through a diversified global portfolio. Thus, the proportion of equity investments will increase the Sharpe ratio only for investors in countries with low domestic ratios. An optimal global portfolio will significantly increase the Sharpe ratio for investors in all countries. An even distribution across the five optimal countries will capture most of the potential benefits of international diversification. Investors in countries with lower domestic Sharpe ratios benefit more from international diversification, especially through risk reduction (Mukherji and Jeong 2021).
The price increase affects the purchasing power, which decreases in each period. Thus, inflation affects the uncertainty in predicting portfolio performance, especially the amount of profit to be earned. For this reason, investors need to protect their investments from the volatility or occurrence of inflation. Thus, the investment objective is to achieve maximum profit. However, one of the economic factors that affects capital market activities is inflation. This is because, with the emergence of inflation, the value of a dollar of income in the investment can change. Therefore, the main objective of the asset allocation strategy is to protect against the impact of inflation. For example, the results of a study by Chopra et al. (2021) showed the advantages of the excess return of inflation-linked bonds (ILBs) over nominal bonds under different inflation conditions. In addition, inflation and real interest rates play a role as important sources of risk. Therefore, alternative investments offer strong diversification and hedging benefits for asset–liability investors. There are significant differences between the market portfolio and the liability-driven portfolio in terms of strategic asset allocation as dictated by the model (Bernardo and Campani 2019).
Estimates of the variance of future investments based on historical data are very important for decision makers to calculate the economic performance of different portfolio investments. Therefore, the correlation between the returns of assets in the portfolio is also estimated based on historical performance. Moreover, investors use historical data to predict the conditional variance–covariance matrix of asset returns to determine the main relevance for large portfolios consisting of different types of invested assets (Cheang et al. 2020). In this case, statistical and economic out-of-sample measures are used to evaluate minimum variance preferences and portfolios of different assets that exhibit historical variances in constructing an optimal investment portfolio. Empirically, Cheang et al.’s (2020) results point that a sophisticated portfolio with a combination of stocks, fixed income, alternative securities, and cash deposits outperforms the implied variance measure with a risk premium correction than the variance measure constructed from historical data and the implied variance without correction. These results hold across investment portfolios, volatility, portfolio measures, and rebalancing types.
Historical data are crucial for determining expected investment returns. Therefore, in previous portfolio optimization, the return parameters of the investments, including the expected returns and the covariance matrix, must be estimated. This is because the mean-variance method faces significant challenges in portfolio optimization practice (Kircher and Rösch 2021). For instance, (Kircher and Rösch 2021) found that taking transaction costs into account before analyzing portfolio weights leads to an average increase in the net Sharpe ratio of 40 percent. To ensure the effective use of MV models in optimizing portfolio weights and determining these weights in actual portfolios, it is important to accurately calculate the expected return and correlation matrix (Shadabfar and Cheng 2020).
Transaction costs are a benchmark for predicting investment returns. Murthy and Wald (2023) conclude in their study on trading behavior that investors significantly improve their performance when transaction costs vary for different assets. In addition, the study concludes that better decision rules can increase daily trading profits by 139 basis points and that general trading strategies can be applied to other assets or other possible sources of excess trading profits. Further studies by Pitera and Stettner (2023) deal with the optimization of risk-sensitive portfolios over a long period with proportional transaction costs. Thus, various optimization algorithms and numerical examples are presented to promote the use of advanced numerical methods for portfolio optimization in long-term settings based on transaction costs.
With the right strategy, significant excess profits can be made. Therefore, Lee et al. (2019) revealed two global investment strategies based on stock price indices in their study: (i) a stock market forecasting strategy (predicting the general direction of the stock market) and (ii) a regional allocation strategy (predicting the relative direction of developed markets (DMs)/emerging markets (EMs). In practice, these two strategies are the most used strategies for global equity market portfolios. This study develops a regional allocation strategy using financial network indicators and validates the usefulness of a global equity market strategy. It also makes an important contribution to strategic asset allocation for high-yield bonds. The results showed that the share of high-yield bonds did not exceed 4.1% of the total assets of the global market portfolio during the period 2007–2013. It is noteworthy that the share of high-yield bonds in the simulated portfolio remains relatively low and stable on a risk-adjusted basis, regardless of the investor’s risk profile or the economic phase (Menounos et al. 2019).
The main goal of investment is to optimize profitability with the expectation of maximum return at minimum risk. In this objective, investment strategy still encounters obstacles faced by both investors and researchers who can contribute to investment decisions with better knowledge. For example, the study by Caneo and Kristjanpoller (2021) aims to improve the statistical value of investment strategies by analyzing the profitability of pair trading strategies in Latin American stock markets. The results showed that the profitability strategy of pair trading outperforms the Sharpe ratio of the market by 1.55 points on average. Moreover, it is found that the largest eigenvalue is dominant and the associated eigen portfolio represents the movement with the market, while the number of dominant components is opposite to the market volatility. Moreover, the purpose of pairing strategy in financial instruments is to find out the relationship between stock prices and stock returns that can ensure minimum risk. This was found by Keshavarz Haddad and Talebi (2023) in stock investment in the Toronto Stock Exchange. Their results showed that the highest profitability is obtained when trading with the Copula method. Although the financial markets were in a difficult situation during the days of COVID-19, the performance of the method was not affected by the crisis.
The global financial crisis of 2008 has empirically proven that there is a significant link between financial markets and the real economy. This is true for both developed and developing country financial markets. Thus, financial markets contribute to economic growth and development. A study by Nasir et al. (2021) analyzed the role of the domestic economic environment and regional markets (Thailand, Japan, Hong Kong, and China) in explaining stock market dynamics in Vietnam. Their results suggest that a stable and strong currency and economic growth have a significant and positive impact on stock market performance in Vietnam. Accordingly, inflation shocks have a negative impact, which means that price stability is very important in setting policy for financial stability in Vietnam.
The strategy of factor allocation through exchange-traded funds (ETFs) can be managed actively and passively to achieve superior performance. In measuring portfolio performance characterized by the three main strategies by Bessler et al. (2021), the first strategy consists of analyzing risk and return profiles and Sharpe ratios, the second in comparing alpha based on multifactor regressions, and the third in dividing the entire period into sub-periods and comparing the time variation of sector and factor performance for each period. Their results showed that long-term investments deliver relatively better performance compared to short-term investment periods, especially during cyclical changes in the economy and strategy shifts. Thus, the timing of the factor portfolio dominates the sector portfolio, so the superior sector portfolio should provide better opportunities for investment diversification during the crisis period. In addition, Brière and Szafarz (2021) examined the profitability of multifactor portfolios in the US equity market and reached the following important conclusions: (i) The diversification potential of sectoral assets is higher than that of factor assets. Considering these two aspects, (ii) factor assets outperform sector assets in all respects when short selling is not restricted. This could be because the sector has a low alpha and does not make a significant difference. (iii) Sector assets deliver better or less poor portfolio returns only during recessions and bear markets, times when diversification is most needed.
3. Data and Methodology
3.1. Data
Our research aims to analyze portfolio performance in minimizing risk and achieving maximum returns in the dynamics of portfolio returns by investing in Timor-Leste stocks in international capital markets. We used 14 years of historical data from 2006 to 2019 by selecting 20 stocks of three companies listed on the NASDAQ stock exchange, namely Apple Inc., Microsoft Corp, and Amazon. Com Inc. with a total investment of USD 188,419.523, USD 166,962,186, and USD 95,767,306, respectively. Also, 8 shares of companies listed on the NYSE with a total investment of 5,771,316 shares in Johnson & Johnson, JPMorgan Chase & Co., Exxon Mobil Corporation, AT&T Inc., The Procter & Gamble Company, Bank of America Corporation, Pfizer Inc., and Verizon Communications Inc. with a market capitalization of USD 386,245,711. Moreover, three other companies, AstraZeneca PLC, HSBC Holdings PLC, and Diageo PLC, are listed on the LSE with a total investment value of USD 58,805,520 and 3,861,711 shares. In addition, three companies are listed on the Tokyo Stock Exchange, namely Toyota Motor Corp, Mitsubishi UFJ Financial Group, Inc., and KDDI Corporation, with a total number of 2,253,262 shares and a market capitalization of USD 49,027,940. In addition, two companies including Sanofi invest in the Frankfurt Stock Exchange with a total number of 199,146 shares and a market capitalization of USD 20,029,311, and the company Sap Se invests in the XETRA exchange in Germany with a total number of 151,005 shares and a market capitalization of USD 20,350,546. In addition, 503,695 shares with a market capitalization of USD 54,502,126 are invested in the Swiss Stock Exchange. All these stock price data were taken from Yahoo’s financial data, ensuring the use of monthly data. All calculations were performed using RStudio software. The reason why the authors selected the 20 listed companies was the total investment of the Petroleum Fund in the form of stocks and bonds of 1775 companies at the end of 2019, which had the largest investment value of all other companies and represented the continents of America, Europe, and Asia as presented in Table 1 (Timor-Leste Ministry of Finance 2019). We chose to work with the period 2006–2019, as Timor-Leste has an oil fund that was established in September 2005. The fund invests in equities. Thus, we started in 2006 and continued until 2019. We limited ourselves to 2019 because the data available to the researchers at the time of data collection (September 2022) only went up to 2019.
3.2. Optimization Model
This study uses Markowitz’s mean-variance optimization approach and related techniques to optimize equity portfolios in international capital markets. Even if it is a simplified approach, this is the first study conducted using a simple methodology within the concept of optimizing investment portfolios, using Timor-Leste as an example, and the results properly captured the gaps that need to be accounted for by the government authorities to help Timor-Leste in evolving and developing, both economically and financially. Further studies could be conducted using new methods that were not used in this study. This article uses multi-objective programming techniques to create portfolios that balance return and risk by using weights that represent investors’ risk tolerance and allow for efficient portfolio construction based on their risk preferences. In addition, it allows us to create a frontier portfolio by minimizing the portfolio variance for the expected return, to maximize the expected return for a given level of risk. Therefore, the empirical findings of this study can inform investors (especially the government of Timor-Leste) with an understanding of the efficiency of Timor-Leste’s portfolio investment strategy in the equity markets.
3.2.1. Return
Every investment will yield a profit or loss. In this study, the monthly stock return is the reduction between the current stock price and that of the previous period. The calculation of arithmetic monthly stock return is defined by the following equation (Letho et al. 2022):
where is the arithmetic rate of return for the period for financial asset, is the price of the financial asset for period , and is the price of the ith financial asset for period .
3.2.2. Coefficient Correlation
Correlation analysis determines the strength of the relationship between a set of data sets, which may be a dependent variable and an independent variable or even two independent variables. For this reason, the coefficient value (C) ranges from 1 to +1. Values close to +1 indicate a strong positive correlation, values close to 1 indicate a strong negative correlation, and values close to 0 indicate no relationship. Since Pearson correlation establishes a linear relationship, it is assumed that the linear form between variables can be analyzed (Kumar and Chong 2018). Therefore, in this study, we adopt Sadeghi (2022) for n pairs of sample variables to determine the correlation coefficient defined by the following Equation (2):
where n is the sample size, and represent sample points where is the index, and and are mean values of the total products (i.e., and ) as shown below:
Alternatively, can be represented as follows:
where and are the individual samples’ SDs, i.e.,
3.2.3. Sharpe Ratio
The studies by Aboussalah and Lee (2020) and Wang et al. (2022) state that the Sharpe ratio measures the portfolio’s excess return over the risk-free return per unit of risk taken. Thus, the Sharpe ratio is a result of information that helps investors understand the return on investments given the risks (Mazanec 2021). Therefore, the formula used to calculate the Sharpe ratio is as follows:
where represents the monthly risk-free return, is the expected monthly return of the portfolio, and is the standard deviation calculated as the square root of the monthly variance.
3.2.4. Markowitz Mean-Variance Model
As mentioned earlier, the optimization models can provide stock arrangements with the lowest risk over expected return (or correspondingly highest expected return over risk). The authors use multi-objective programming techniques to create portfolios that balance return and risk by using weights that represent investors’ risk tolerance and allow for efficient portfolio construction based on their risk preferences. Under the current setting, the Markowitz mean-variance model was adopted from Shadabfar and Cheng (2020) as follows:
where represents the portfolio return, denotes the portfolio variance (risk), represents the covariance between the two stocks and , and is regarded as the share invested in stock . As shown in Equation (5), the problem is formulated as a multi-objective optimization. The main objective of this study is to maximize return and minimize risk. Therefore, two objective functions were required to define the problem. Of course, we could have formulated the problem with only one of these two objective functions, i.e., either maximizing return or minimizing risk, which would have simplified the problem but not provided a comprehensive answer.
4. Empirical Results
Table 2 presents the descriptive statistical results of the monthly returns of the Timor-Leste Petroleum Fund’s investments in 20 stock markets listed on NASDAQ, NYSE, London, Germany, and Tokyo during the period 2006:1–2019:12 with a total of 167 observations. Table 2 shows that the highest mean was observed in AMZN and the lowest in 8306.T. The table also indicates that the range of all indicators is between −0.52 (minimum) and 0.73 (maximum). In addition, the skewness value of the time series AAPL, JNJ, SNW.F, JPM, NSRGY, XOM, T, PG, PFE, VZ, SAP.DE, and DGE.L is negative, indicating that both series have long left tails, while the time series MSFT, AZN.L, 7203.T, HSBA.L, AMZN, 8306.T, 9433.T, and BAC have positive skewness, indicating that the MSFT, AZN.L, 7203.T, HSBA.L, AMZN, 8306.T, 9433.T, and BAC time series have long right tails.
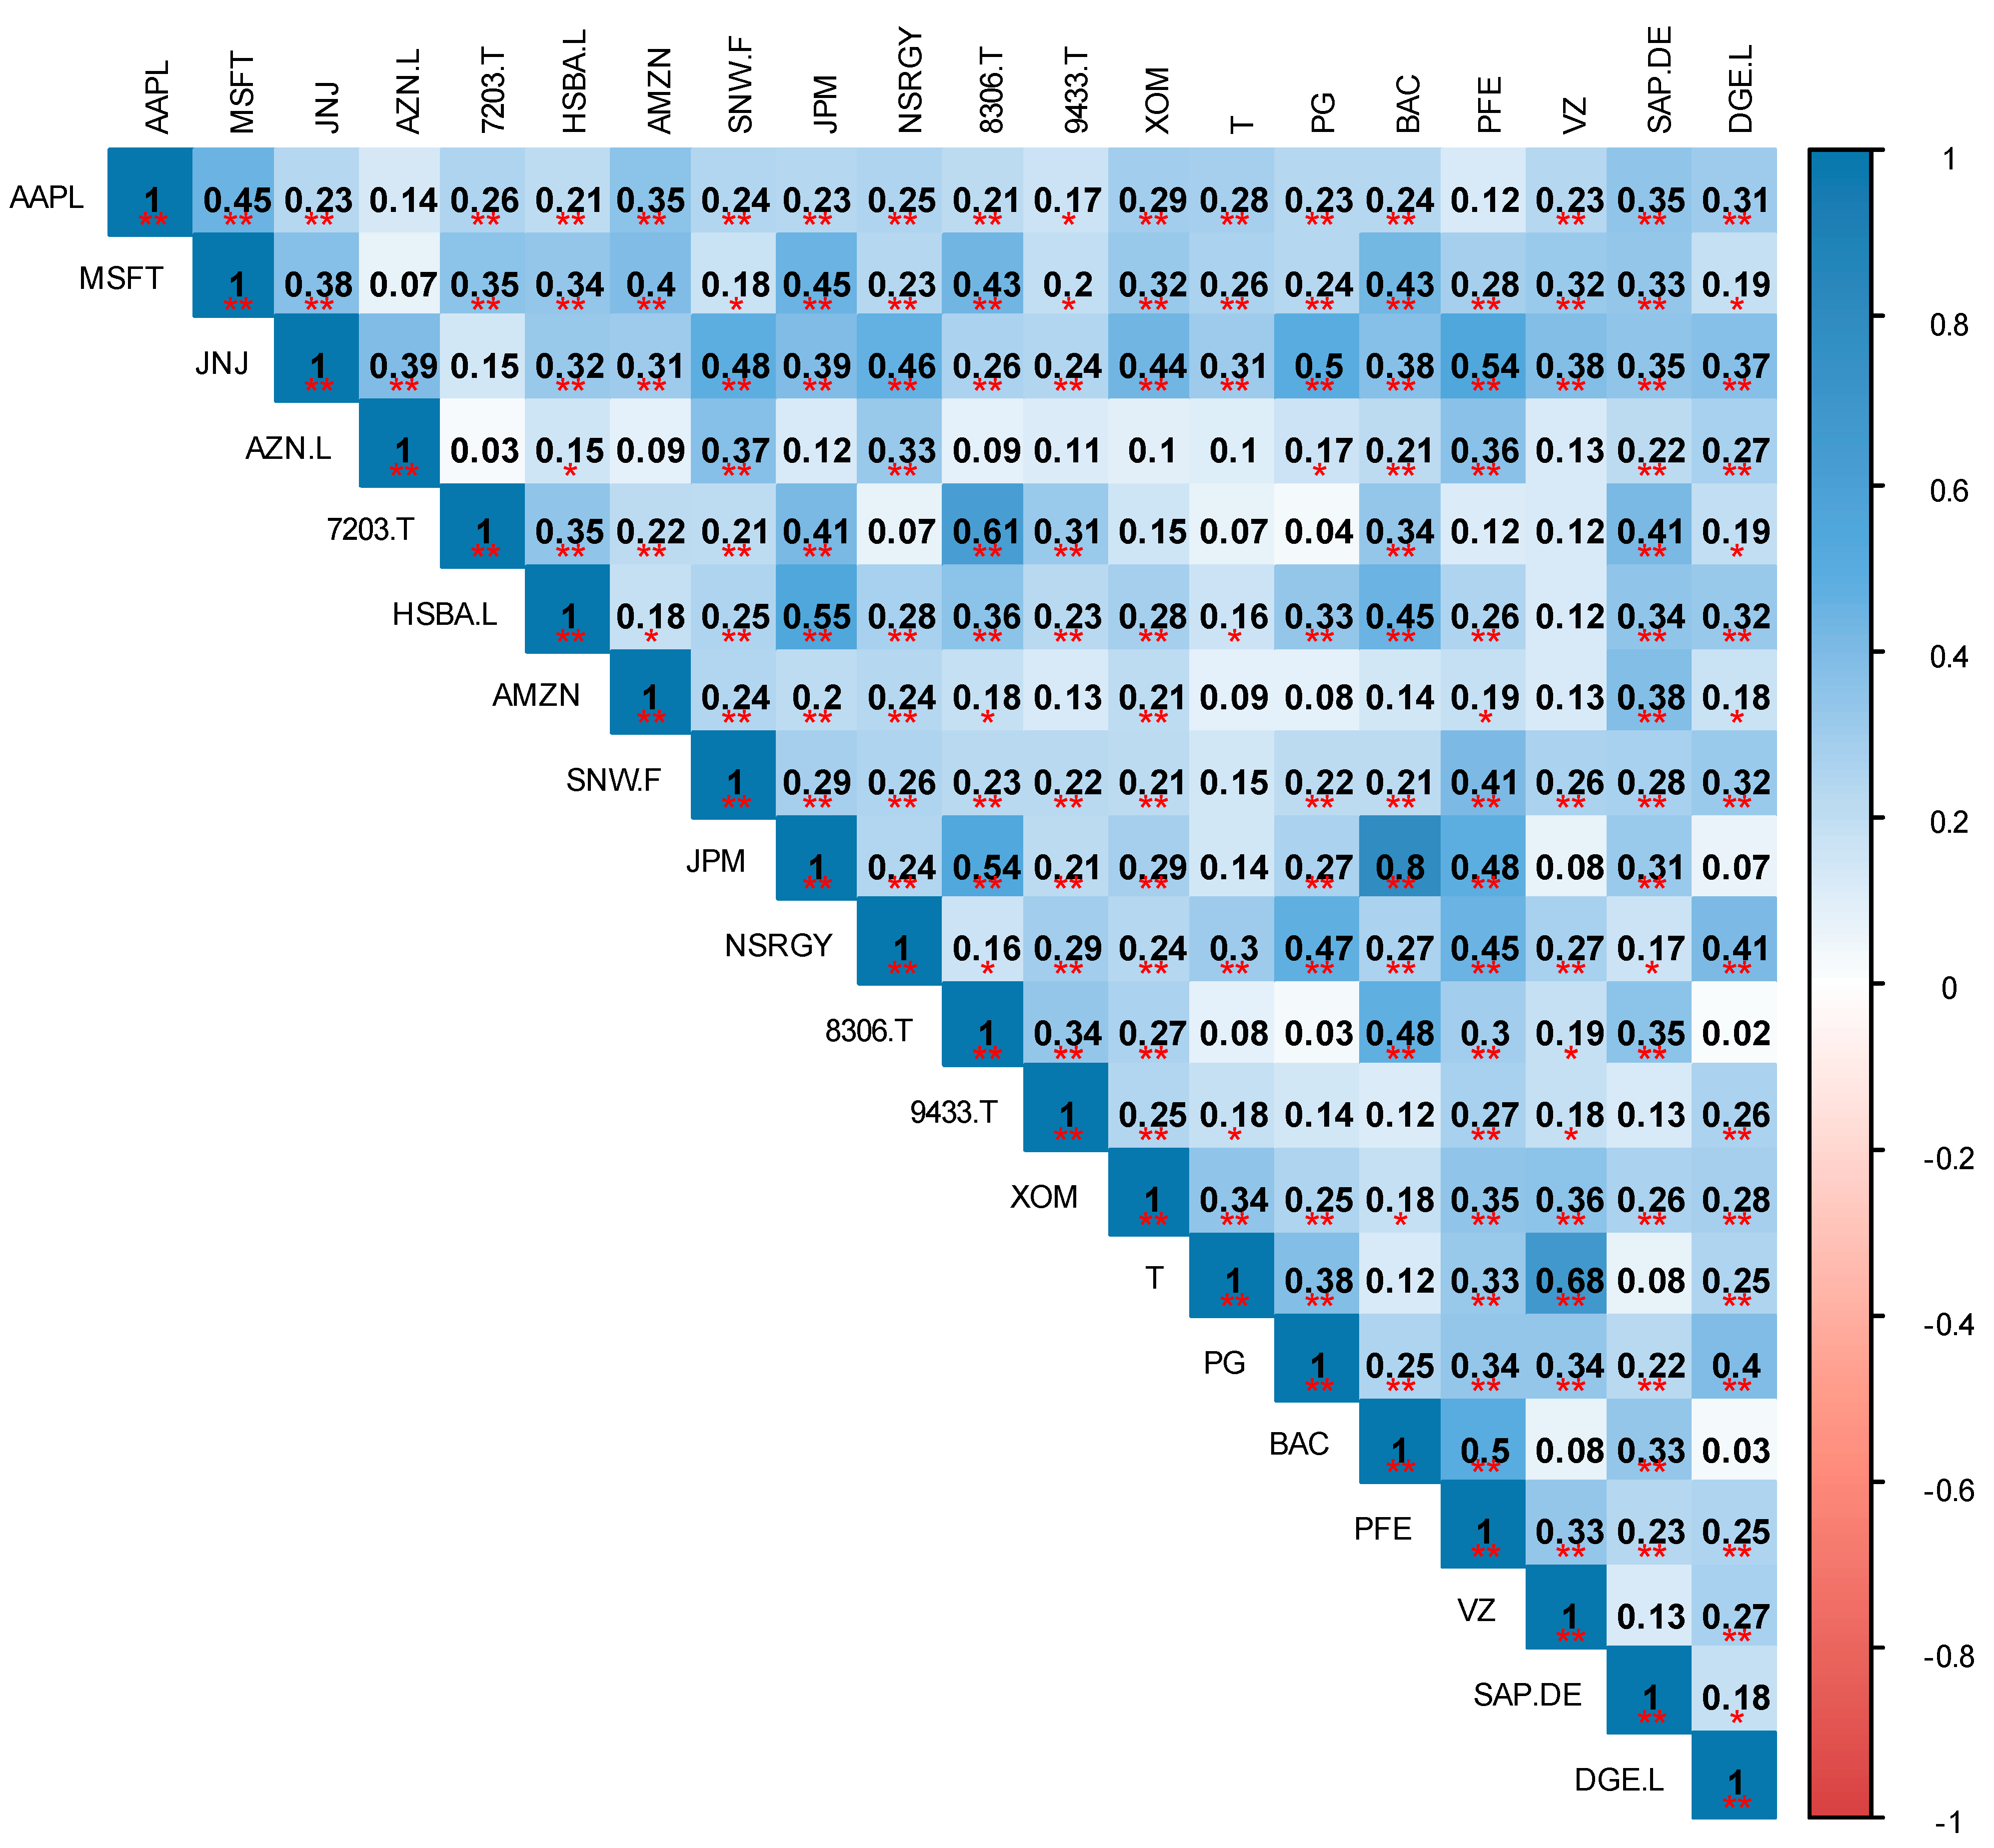
In general, the correlation matrix ranges from −1 to 1. First, Figure 4 shows that JPM has a very strong positive correlation with one of the twenty assets, namely BAC (0.80), while most of the other values have a relatively moderate correlation coefficient of more than 0.3, namely 8306.T (0.54), PFE (0.48), and SAP.DE (0.31). In addition, JPM showed a correlation with HSBA.L (0.55), MSFT (0.45), and 7203.T (0.41). Second, T showed a strong correlation with VZ (0.68), whereas 7203.T showed a relatively strong correlation with 8306.T (0.61). Similarly, JNJ showed a relatively strong correlation with PFE (0.54).
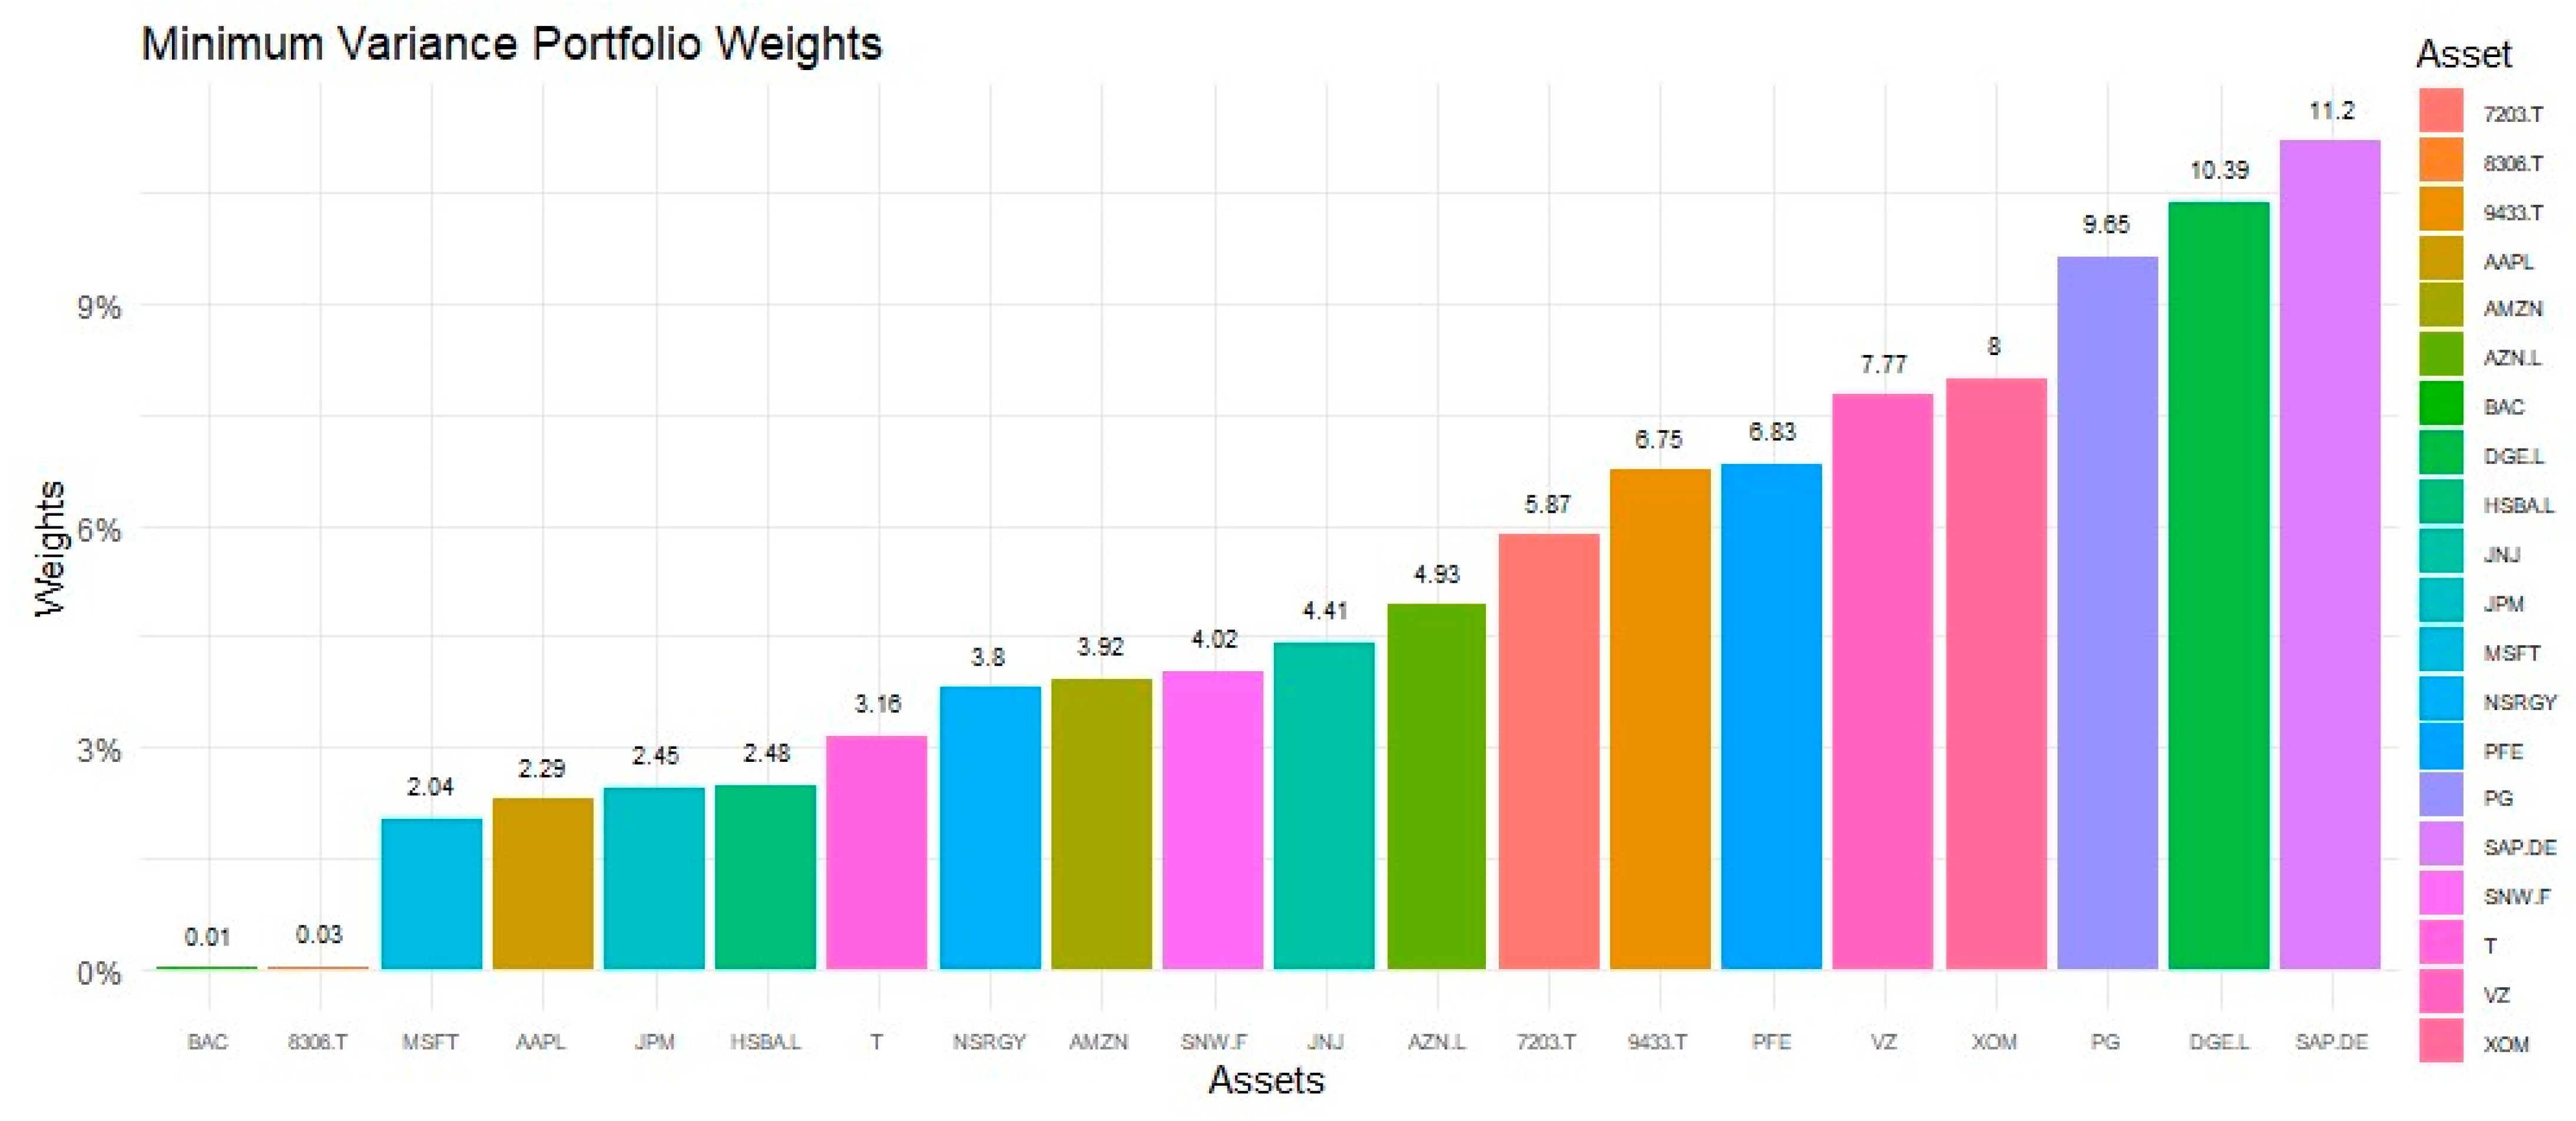
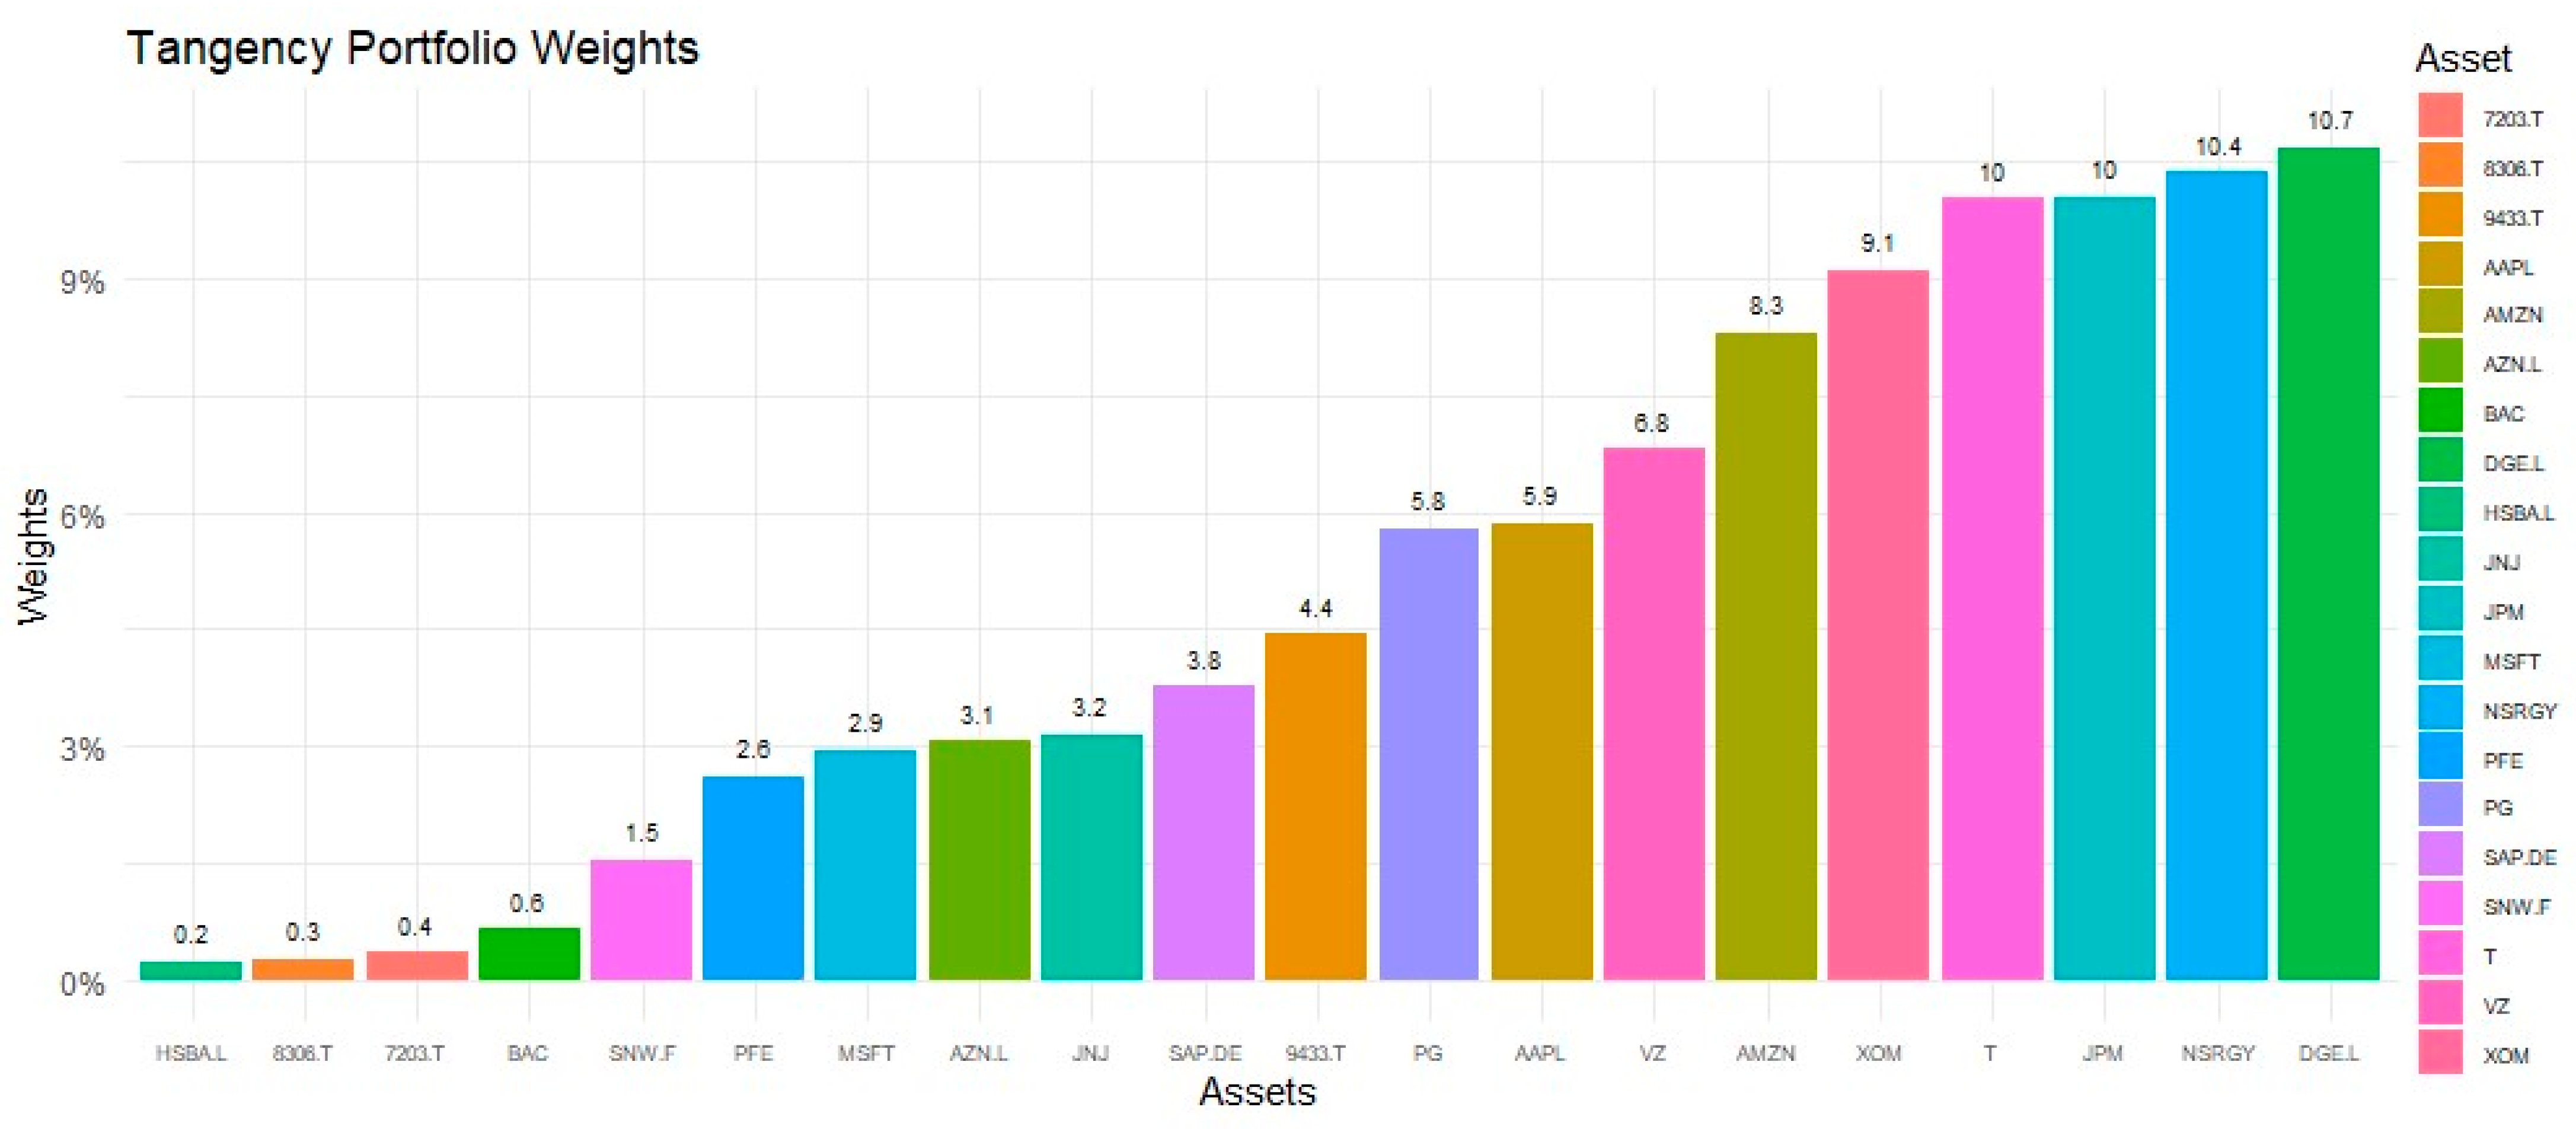
Table 3 shows the empirical performance of the portfolio strategy used in this study for 20 assets invested by Timor-Leste in the capital market, as also shown in Figure 5 and Figure 6, which present the results of the portfolio strategy when investing in 20 assets. First, the naïve portfolio is evenly distributed among the 20 selected investment assets. The results show that the portfolio has an expected return of 104.22%. Second, the optimal portfolio of the twenty assets above 5% consists of nine assets in a row, namely DGE.L (10.69%), NSRGY (10.37%), JPM (10.04%), T (10.03%), XOM (9.11%), AMZN (8.30%), VZ (6.81%), AAPL (5.86%), and PG (5.79%), according to Markowitz (1952). This portfolio is optimal in terms of expected return and risk. Third, the minimum portfolio consists of eight stocks with a minimum variance greater than 5%, namely SAP.DE (11.20%), DGE.L (10.39%), PG (9.65%), XOM (8 0.00%), VZ (7.77%), PFE (6.83%), 9433.T (6.75), and 7203.T (5.87%). In this case, the third portfolio reaches the lowest risk level of only 3.12% with an expected return of 1.008%. This return is not attractive to investors.
Table 3 shows the results for the equally weighted portfolio, the portfolio with the highest Sharpe ratio, and the portfolio with the lowest variance compared to the optimal portfolios shown in Figure 5 and Figure 6. The optimal portfolio in Figure 5 is a minimum variance portfolio consisting of nine stocks, namely DGE.L, NSRGY, JPM, T, XOM, AMZN, VZ, AAPL, and PG. The optimal portfolio in Figure 6 is the tangency portfolio, which is the optimal combination of risk-free assets and risky portfolios. Table 3 therefore contains results for different portfolio strategies, while Figure 5 and Figure 6 contain results for specific optimized portfolios. Figure 5 and Figure 6 show two different approaches to creating optimal portfolios that focus on different factors in the portfolio optimization process. The optimal portfolio in Figure 5 was created using a minimum variance approach, which aims to minimize risk and maximize expected return. Therefore, this portfolio contains assets with low covariance and negative correlations and aims to maximize returns. The optimal portfolio in Figure 6 maximizes the Sharpe ratio, a measure of risk-adjusted returns that allows investors to compare investment opportunities with similar levels of risk. Thus, while the minimum variance approach aims to minimize the risk in the portfolio, the tangency approach aims to maximize the risk-adjusted return.
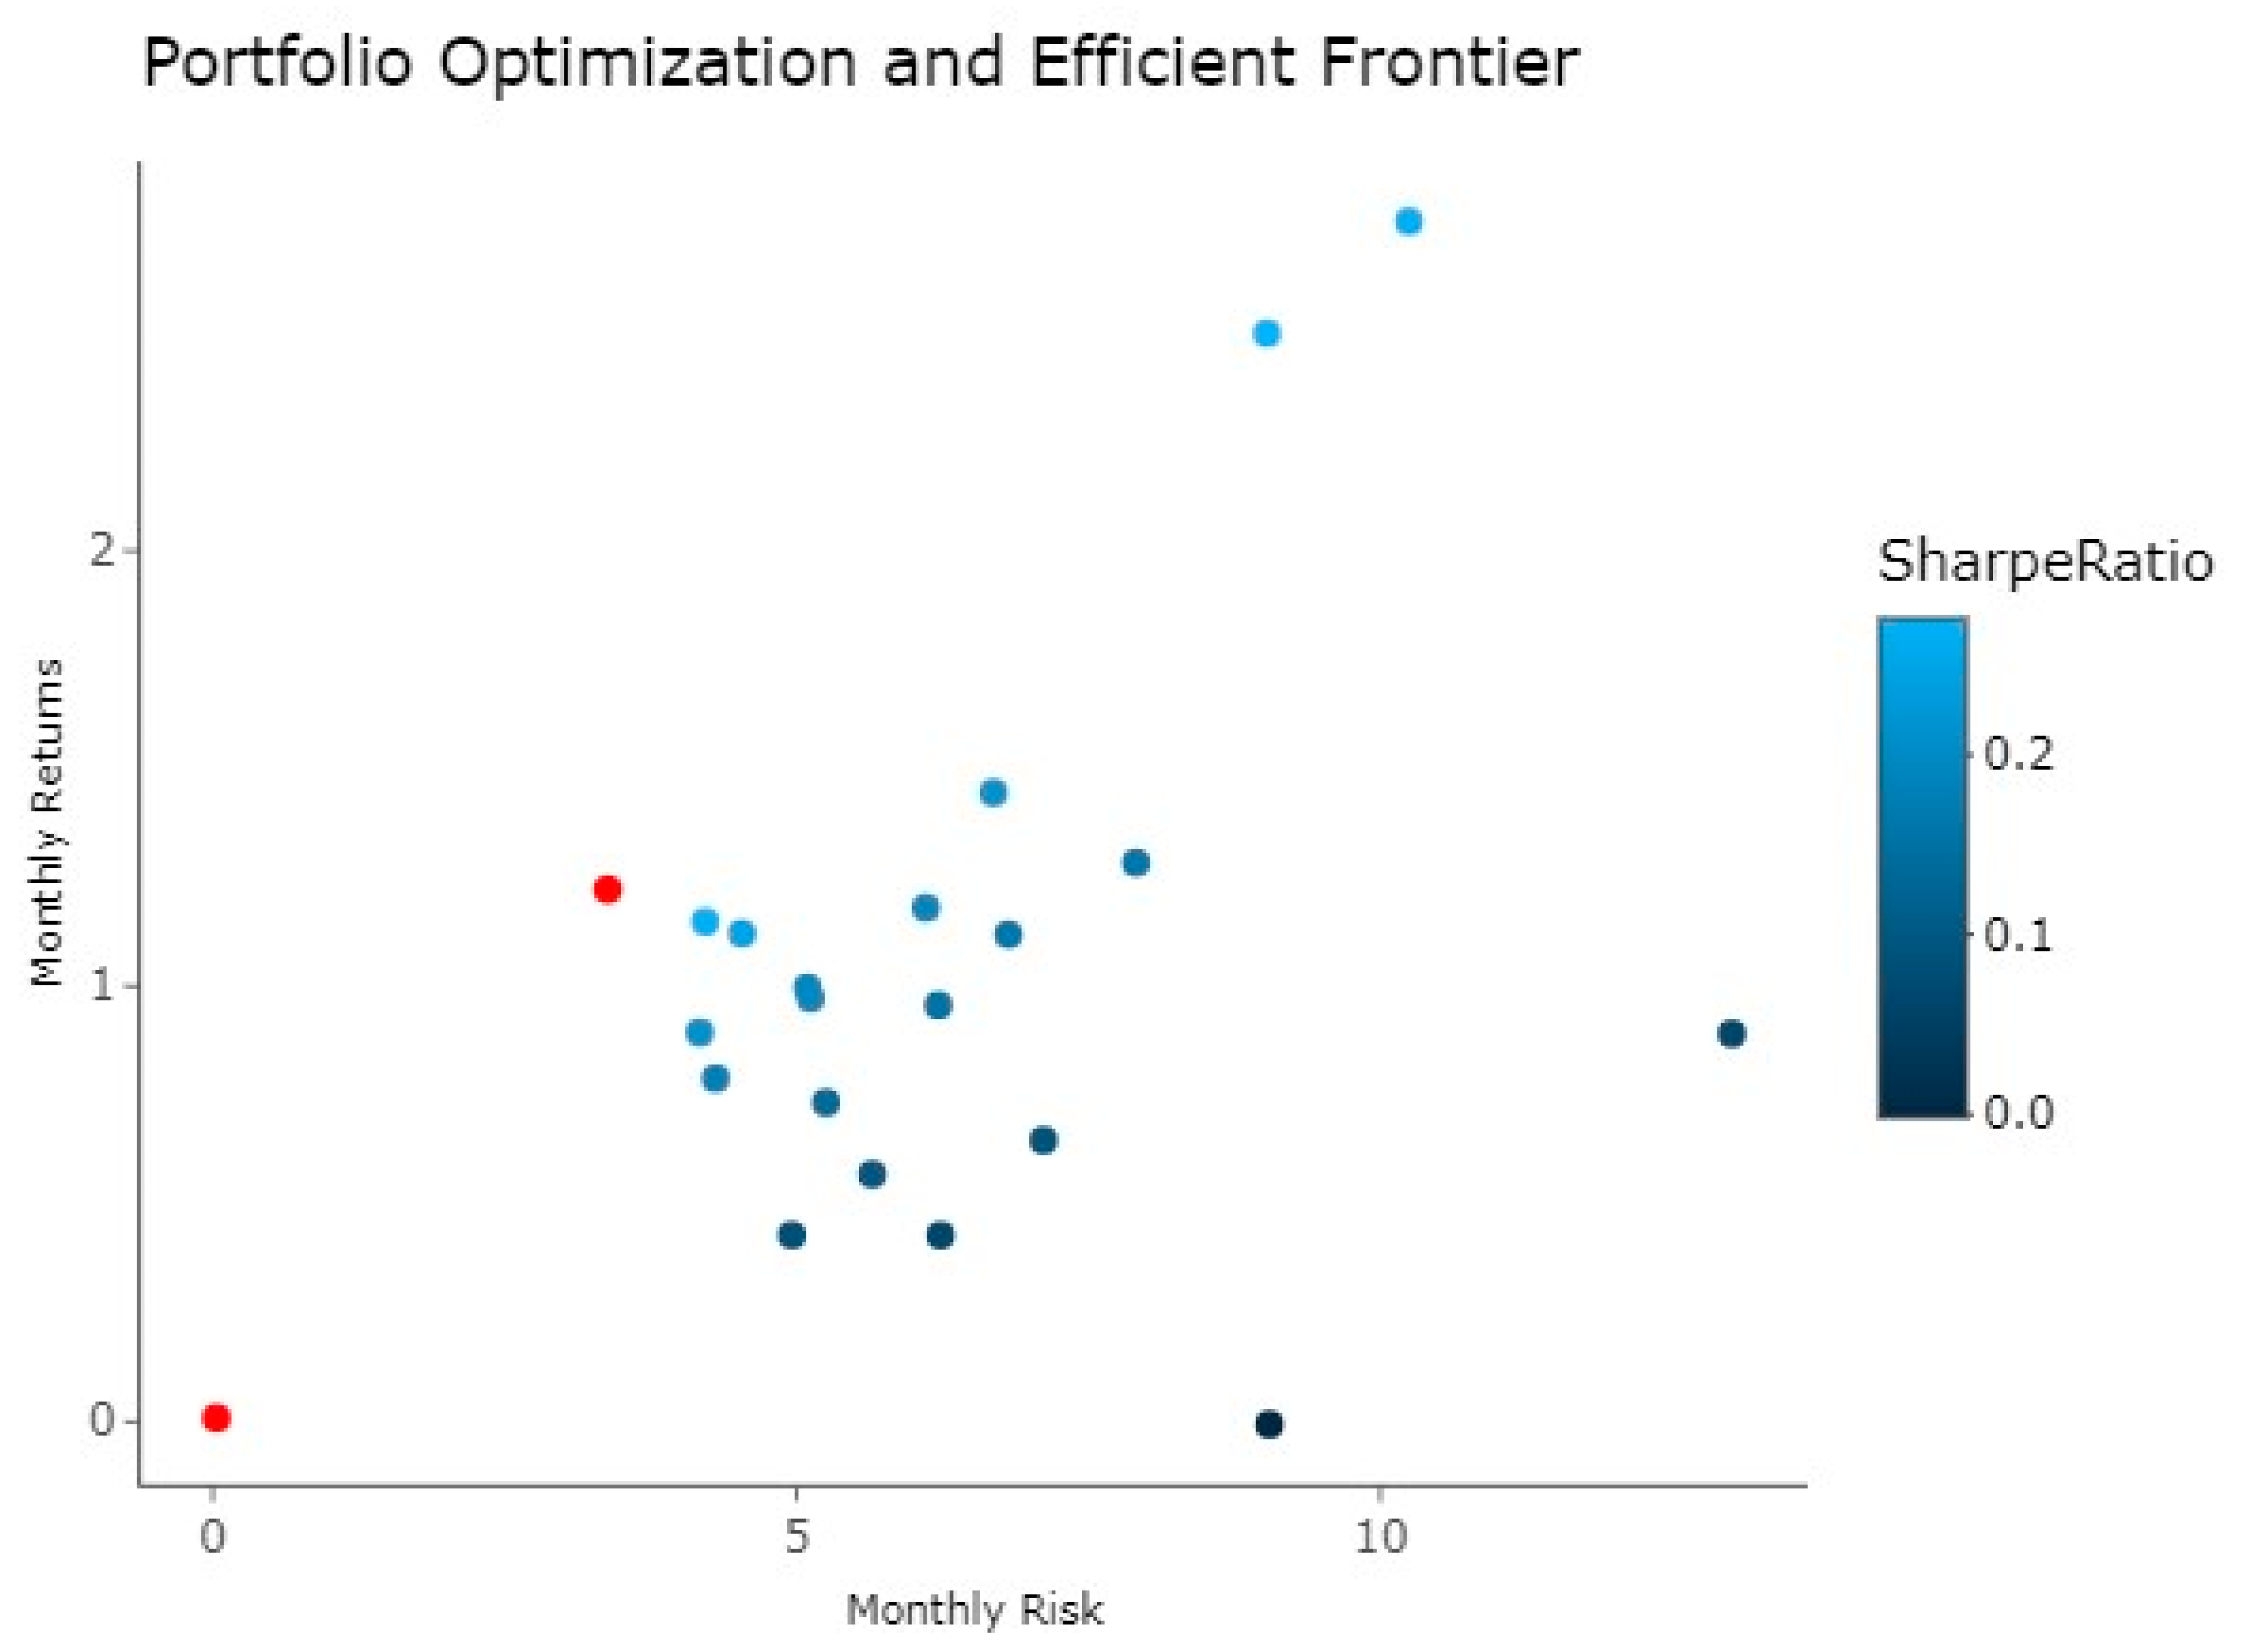
Investors want higher returns with low risk (low standard deviation). Figure 7 shows a random set of 20 portfolio assets with the results of portfolio measurements with expected returns and Sharpe ratios. The random weights are also adjusted until they reach the highest Sharpe ratio value of 0.20. Thus, all portfolio scenarios with efficient portfolios are found as red dots with the highest Sharpe ratio value on the efficient frontier, as shown in Figure 7. Figure 7 also shows that the higher the optimized return, the higher the risk of investing in these 20 assets. In this way, investors can determine the optimal portfolio allocation following the balance between return and risk.
5. Results and Discussion
The goal of investment optimization is to increase returns and reduce risk. However, every investor faces the constraints of market uncertainty, which brings the risk of losses. For this reason, investment management is an important aspect of the expected return on assets (Tao and Gupta 2022). In the study by Lam et al. (2021), twenty-nine assets are used to maximize the portfolio, six of which are identical to our study, and based on the descriptive statistical data, the average returns for the six assets are AAPL (0.0063), JNJ (0.0020), JPM (0.0039), MSFT (0.0057), PG (0.0022), and VZ (0.0011). Therefore, the average returns for these assets differ from our study, i.e., AAPL (0.0250), JNJ (0.0089), JPM (0.0128), MSFT (0.0144), PG (0.0079), and VZ (0.0100). This difference is due to the monthly historical data and the period determined based on the sample. Another study by Mariani and Tweneboah (2022) showed that the negative return on assets of BAC was −0.00003 and JPM received a positive return of 0.00002. Thus, our results showed a positive return of 0.0089 for the assets of BAC and 0.0128 for JPM. Thus, these results showed a significant difference between the two assets.
A study by Khan et al. (2018) using the Karachi Stock Exchange (KSE), LSE, NYSE, and NASDAQ indices intended to propose a regression-based model to predict stock indices by determining the correlation between stock markets using the three largest listed companies—Microsoft, Apple, and Google. Their results on the correlation of values between indices showed that the NASDAQ and LSE indices have a positive correlation value of 0.57, and NY and the LSE have a correlation of 0.522. Interestingly, the New York Stock Exchange and NASDAQ have a very strong positive correlation of 0.829, but in our study, we selected MSFT stocks listed on the NASDAQ and JPM stocks listed on the NYSE, which have only a moderate positive correlation of 0.45. Moreover, in our study, only the assets of JPM and BAC, both listed on the NYSE, have a very strong positive correlation of 0.80. In contrast, the study by Mariani and Tweneboah (2022) has a very weak positive correlation of 0.1958. In a more recent study by Zhang (2022), AMZN and AAPL listed on the NASDAQ have a moderate correlation coefficient of 0.377, while JPM listed on the NYSE and AAPL listed on the NASDAQ have a weak correlation coefficient of 0.244. In contrast, our study showed a moderate correlation coefficient for AMZN and AAPL, which is not far from 0.35, while JPM and AAPL have a weak correlation coefficient of 0.23. Moreover, the results of the study by Han et al. (2022) showed a very strong correlation coefficient for AMZN and AAPL assets of 0.96.
In their optimal portfolio, Lam et al. (2021) showed that PG has the highest rank and weight in portfolio composition with 18.50%, while the lowest optimal portfolio is VZ assets with 0.0759%. However, our research results showed that DGE.L assets have the highest rank and weight in portfolio composition with 10.69%, while the lowest optimal portfolio is VZ assets with 0.23%. In addition, a study by Popescu (2022) found that AAPL is strongly represented in the portfolio with 40% and MSFT with 23%. However, in our study, AAPL reached 5.86% while MSFT accounted for only 2.94%. Similarly, the results of a study by Li et al. (2021) revealed that the weight of the portfolio with the best construction based on Sharpe ratio results for AAPL was 32.09%, while MSFT achieved the weight of the portfolio with the highest construction of 59.42%. In addition, a recent study by Zhang (2022) found that the optimal portfolio of AMZN has a maximum Sharpe ratio of 16.40% and a minimum weighted variance of −2.35%. According to our study, the maximum Sharpe-weighted asset of AMZN is 8.30%, while the minimum weighted variance is 3.92%. For AAPL, the maximum Sharpe-weighted ratio is 30.02% and the minimum weighted variance is −3.85%. However, in our analysis, the maximum Sharpe ratio is only 5.86% and the minimum variance is 2.29%. Nonetheless, the maximum Sharpe weight of the JPM asset is −0.09%, while the minimum weighted variance is −18.47%. In our study, the maximum Sharpe ratio is 10.04% and the minimum variance is 2.45%.
6. Concluding Remarks
The objective of this study is to analyze the portfolio performance in terms of minimizing risk and achieving maximum returns in the dynamics of portfolio returns when investing in Timor-Leste stocks in international capital markets. Based on the previously described results, the correlation matrix shows a robust positive relationship between the stocks of JPMorgan Chase (JPM) and Bank of America (BAC). The ideal portfolio, comprising twenty stocks with a return above 5%, consists of nine stocks. Conversely, the minimum portfolio consists of eight stocks with a variance of more than 5%. The optimal portfolio is characterized by the highest forecast return and the lowest risk. The evaluation of the optimal portfolio using Markowitz parameters also showed that the highest expected return and the lowest risk were 1.22% and 3.12%, respectively. Thus, asset investment is about finding the right balance between achieving maximum return and minimizing risk (Senthilkumar et al. 2022).
The findings of this study have potential implications for global investors, portfolio managers, and governments. First, any investment has the goal of maximizing return and minimizing risk. To this end, it is very important for the government as an investor to analyze historical data in (Yahoo Finance n.d.), Investing, and Bloomberg for each asset to find out how each asset with its respective performance level can easily formulate a maximum investment strategy with minimum risk. Based on the analysis results, the government can select only assets that provide optimal returns and consider assets that are not optimal to change the strategies for future portfolio investment. So do not just select assets that are not optimal and risk asset loss. Second, any investment involves high risk, but to anticipate this risk as an investor or decision maker in portfolio investment, detailed information is required to expect significant returns. Therefore, as an investor or decision maker, one should be aware of global risk factors such as geopolitical risks, uncertainty in international economic policies (EPU), oil prices, economic conditions, stock prices, and market behavior. All these factors have a significant impact on the performance of stocks in the capital market, so selecting and determining the right strategy with the analysis of information in the capital market about market behavior (all factors) to hedge the value of portfolio investments to achieve an increase in returns are the most important investment prospects.
Based on the above research findings, we have come to the following important conclusions that we recommend to the government as an investor:
- Analyze the performance of the stock market using historical data from (Yahoo Finance n.d.), Investing, and Bloomberg to determine the performance of individual assets and easily formulate an investment strategy to diversify the portfolio.
- Investors use historical stock price data to apply positive momentum strategies to buy or sell stocks and vice versa.
- When implementing the value investment strategy, investors must perform fundamental analysis in terms of financial ratios, dividends, and cash flow to determine the true value of the assets.
- In the contrarian investment strategy, investors need to understand market behavior in terms of negative and positive sentiment to identify future investment opportunities.
- The government needs to consider the shock of oil price volatility, which affects the stock market negatively.
- To ensure long-term macroeconomic stability, the government needs to adjust US monetary policy, particularly focusing on non-oil and gas exports, to mitigate inflation risks. It must also diversify the economy’s production potential.
- The government needs to understand investment objectives, risk tolerance, and current and future market conditions.
When investing in portfolio investments, market participants (investors and traders) expect accurate results from the analyses of consultants, academics, and researchers. The results obtained serve as a basis for effective and efficient decisions, as portfolio construction consists of selecting and allocating assets that are expected to maximize returns. For this reason, our study is strongly limited to the use of the mean-variance portfolio model to optimize investment funds and uses only 20 portfolios to determine the investment results. It is therefore expected that other portfolio optimization models, such as variance with skewness, semi-variance, value-at-risk, and minimax, can be used in further studies. Also, the use of novel techniques like machine learning methods or Copula could be advised to be able to build better investment strategies. These models can be used to analyze investment portfolios and predict future investment opportunities. Also, it is not stated whether the optimization was repeated over time or whether a rolling sample method was used since it was impossible within the context. Historical data can lead to biases within the sample and overfitting, and the authors are aware of this, which is why validating portfolio performance against new data is crucial. Common methods include the rolling window method and Monte Carlo simulation.
Author Contributions
F.A. was responsible for conceptualization, data curation, formal analysis, investigation, methodology, and writing—original draft preparation. M.M. was responsible for the investigation, methodology, project administration, resources, software, supervision, validation, visualization, writing—original draft preparation, and writing—review and editing. E.V. was responsible for resources, software, supervision, validation, visualization, writing—original draft preparation, and writing—review and editing. All authors have read and agreed to the published version of the manuscript.
Funding
This research received no external funding.
Data Availability Statement
Data set available at https://finance.yahoo.com/ (accessed on 11 September 2022).
Acknowledgments
This work was supported by the Research Unit on Governance, Competitiveness and Public Policies (UIDB/04058/2020) + (UIDP/04058/2020), funded by national funds through FCT—Fundação para a Ciência e a Tecnologia. The authors acknowledge the valuable comments of both the editor and reviewers.
Conflicts of Interest
The authors declare no conflicts of interest.
Abbreviations
The following abbreviations are used in this manuscript:
| AUD | Australian Dollar |
| BCTL | Banco Central de Timor-Leste |
| BIS | Bank for International Settlements |
| BMV | Behavioral Mean-Variance |
| CBMV | Copula Behavioral Mean-Variance |
| COVID-19 | Coronavirus Pandemic 2019 |
| DM | Developed Markets |
| EM | Emerging Markets |
| EPU | Economic Policy Uncertainty |
| ETF | Exchange-Traded Funds |
| ILB | Inflation-Linked Bonds |
| LSE | London Stock Exchange |
| LSTM | Long–Short-Term Memory Model |
| MPT | Modern Portfolio Theory |
| MV | Mean-Variance |
| NASDAQ | National Association of Securities Dealers Automated Quotations |
| NYSE | New York Stock Exchange |
| US | United States |
| USD | United States Dollar |
Appendix A

Table A1.
Asset allocations by countries.
| Country | Fixed Income (%) | Equities (%) | Portfolio (%) |
|---|---|---|---|
| Australia | 1.7 | 2.5 | 2 |
| Canada | 1.9 | 3.4 | 2.5 |
| Denmark | 1.2 | 0.6 | 0.9 |
| Eurozone | 4.7 | 10.5 | 7.1 |
| Hong Kong | 0 | 1.1 | 0.5 |
| Israel | 0 | 0.1 | 0 |
| Japan | 1.6 | 8.3 | 4.3 |
| New Zealand | 0.6 | 0.1 | 0.4 |
| Norway | 0.5 | 0.3 | 0.4 |
| Singapore | 1.1 | 0.6 | 0.9 |
| Sweden | 0.8 | 0.9 | 0.8 |
| Switzerland | 1 | 3.4 | 2 |
| UK | 1.7 | 5.7 | 3.4 |
| USA | 83.1 | 62.7 | 74.8 |
| 1 | The portfolio (%) shows investments in other assets such as cash and private debt. |
| 2 | The term “distorted financial time series” refers to the hypothesis that stock returns are normally distributed, which may not be the case due to factors such as market crashes and extreme events. Abnormal data can influence investment decisions, which is why Khan et al. (2020) recommend portfolios based on asymmetric and fat-tail risks. |
References
- Aboussalah, Amine M., and Chi Guhn Lee. 2020. Continuous control with stacked deep dynamic recurrent reinforcement learning for portfolio optimization. Expert Systems with Applications 140: 112891. [Google Scholar] [CrossRef]
- Abukari, Kobana, and Isaac Otchere. 2020. Dominance of hybrid contratum strategies over momentum and contrarian strategies: Half a century of evidence. Financial Markets and Portfolio Management 34: 471–505. [Google Scholar] [CrossRef]
- Agarwal, Shiva, and Naresh Babu Muppalaneni. 2022. Portfolio optimization in stocks using mean–variance optimization and the efficient frontier. International Journal of Information Technology (Singapore) 14: 2917–26. [Google Scholar] [CrossRef]
- Bernardo, Márcio R., and Carlos Heitor Campani. 2019. Liability driven investment with alternative assets: Evidence from Brazil. Emerging Markets Review 41: 100653. [Google Scholar] [CrossRef]
- Bessler, Wolfgang, Georgi Taushanov, and Dominik Wolff. 2021. Factor investing and asset allocation strategies: A comparison of factor versus sector optimization. Journal of Asset Management 22: 488–506. [Google Scholar] [CrossRef]
- Brière, Marie, and Ariane Szafarz. 2021. When it rains, it pours: Multifactor asset management in good and bad times. Journal of Financial Research 44: 641–69. [Google Scholar] [CrossRef]
- Caneo, Fernando, and Werner Kristjanpoller. 2021. Improving statistical arbitrage investment strategy: Evidence from Latin American stock markets. International Journal of Finance and Economics 26: 4424–40. [Google Scholar] [CrossRef]
- Chalkis, Apostolos, Emmanouil Christoforou, Ioannis Z. Emiris, and Theodore Dalamagas. 2021. Modeling asset allocations and a new portfolio performance score. Digital Finance 3: 333–71. [Google Scholar] [CrossRef] [PubMed]
- Chaweewanchon, Apichat, and Rujira Chaysiri. 2022. Markowitz mean-variance portfolio optimization with predictive stock selection using machine learning. International Journal of Financial Studies 10: 64. [Google Scholar] [CrossRef]
- Cheang, Chi W., Jose Olmo, Tiejun Ma, Ming Chien Sung, and Frank McGroarty. 2020. Optimal asset allocation using a combination of implied and historical information. International Review of Financial Analysis 67: 101419. [Google Scholar] [CrossRef]
- Chopra, Monika, Chhavi Mehta, and Aman Srivastava. 2021. Inflation-linked bonds as a separate asset class: Evidence from emerging and developed markets. Global Business Review 22: 219–35. [Google Scholar] [CrossRef]
- Day, Min-Yuh, Yensen Ni, Chinning Hsu, and Paoyu Huang. 2022. Do investment strategies matter for trading global clean energy and global energy ETFs? Energies 15: 3328. [Google Scholar] [CrossRef]
- Fabozzi, Francesco A., Joseph Simonian, and Frank J. Fabozzi. 2021. Risk parity: The democratization of risk in asset allocation. The Journal of Portfolio Management 47: 41–50. [Google Scholar] [CrossRef]
- Han, Han, Zhehan Wang, Qixun Dong, and Zugen Liu. 2022. Explore not independence and correlation of random variables and methods to judge them between stocks. Paper presented at the 2022 7th International Conference on Financial Innovation and Economic Development (ICFIED 2022), Harbin, China, January 21–23; pp. 2768–75. [Google Scholar] [CrossRef]
- Kassi, Diby F., Dilesha Nawadali Rathnayake, Pierre Axel Louembe, and Ning Ding. 2019. Market risk and financial performance of non-financial companies listed on the Moroccan stock exchange. Risks 7: 20. [Google Scholar] [CrossRef]
- Keshavarz Haddad, Gholam Reza, and Hassan Talebi. 2023. The profitability of pair trading strategy in stock markets: Evidence from Toronto stock exchange. International Journal of Finance and Economics 28: 193–207. [Google Scholar] [CrossRef]
- Khan, Kanwal I., Syed M. Waqar Azeem Naqvi, Muhammad Mudassar Ghafoor, and Rana Shahid Imdad Akash. 2020. Sustainable portfolio optimization with higher-order moments of risk. Sustainability 12: 2006. [Google Scholar] [CrossRef]
- Khan, Umair, Farhan Aadil, Mustansar Ali Ghazanfar, Salabat Khan, Noura Metawa, Khan Muhammad, Irfan Mehmood, and Yunyoung Nam. 2018. A robust regression-based stock exchange forecasting and determination of correlation between stock markets. Sustainability 10: 3702. [Google Scholar] [CrossRef]
- Kircher, Felix, and Daniel Rösch. 2021. A shrinkage approach for sharpe ratio optimal portfolios with estimation risks. Journal of Banking and Finance 133: 106281. [Google Scholar] [CrossRef]
- Kumar, Ronald R., Peter Josef Stauvermann, and Aristeidis Samitas. 2022. An application of portfolio mean-variance and semi-variance optimization techniques: A case of Fiji. Journal of Risk and Financial Management 15: 190. [Google Scholar] [CrossRef]
- Kumar, Sunil, and Ilyoung Chong. 2018. Correlation analysis to identify the effective data in machine learning: Prediction of depressive disorder and emotion states. International Journal of Environmental Research and Public Health 15: 2907. [Google Scholar] [CrossRef]
- Lam, Weng S., Weng Hoe Lam, and Saiful Hafizah Jaaman. 2021. Portfolio optimization with a mean–absolute deviation–entropy multi-objective model. Entropy 23: 1266. [Google Scholar] [CrossRef]
- Lee, Tae K., Joon Hyung Cho, Deuk Sin Kwon, and So Young Sohn. 2019. Global stock market investment strategies based on financial network indicators using machine learning techniques. Expert Systems with Applications 117: 228–42. [Google Scholar] [CrossRef]
- Letho, Lehlohonolo, Grieve Chelwa, and Abdul Latif Alhassan. 2022. Cryptocurrencies and portfolio diversification in an emerging market. China Finance Review International 12: 20–50. [Google Scholar] [CrossRef]
- Li, Heng, Xiaoxi Zhu, and Xiao Wang. 2021. Quantitative analysis of stock portfolio: Taking six technology companies as example. Paper presented at 2021 International Conference on Computer, Blockchain and Financial Development, CBFD 2021, Nanjing, China, April 23–25; pp. 468–73. [Google Scholar] [CrossRef]
- Liu, Jianxu, Yangnan Cheng, Xiaoqing Li, and Songsak Sriboonchitta. 2022. The role of risk forecast and risk tolerance in portfolio management: A case study of the Chinese financial sector. Axioms 11: 134. [Google Scholar] [CrossRef]
- Mariani, Maria, and Osei Kofi Tweneboah. 2022. Modeling high frequency stock market data by using stochastic models. Stochastic Analysis and Applications 40: 573–88. [Google Scholar] [CrossRef]
- Markowitz, Harry. 1952. Portfolio selection. Jounal of Finance 7: 77–91. [Google Scholar]
- Mazanec, Jaroslav. 2021. Portfolio optimalization on digital currency market. Journal of Risk and Financial Management 14: 160. [Google Scholar] [CrossRef]
- Mba, Jules C., Kofi Agyarko Ababio, and Samuel Kwaku Agyei. 2022. Markowitz mean-variance portfolio selection and optimization under a behavioral spectacle: New empirical evidence. International Journal of Financial Studies 10: 28. [Google Scholar] [CrossRef]
- Menounos, Georgios, Constantinos Alexiou, and Sofoklis Vogiazas. 2019. Investigating the relationship between high-yield bonds and equities and its implications for strategic asset allocation during the great recession. International Journal of Finance and Economics 24: 1193–209. [Google Scholar] [CrossRef]
- Milcheva, Stanimira. 2022. Volatility and the cross-section of real estate equity returns during COVID-19. Journal of Real Estate Finance and Economics 65: 293–320. [Google Scholar] [CrossRef]
- Mohapatra, Sabyasachi, and Arun Kumar Misra. 2020. Momentum returns: A portfolio-based empirical study to establish evidence, factors and profitability in indian stock market. IIMB Management Review 32: 75–84. [Google Scholar] [CrossRef]
- Mukherji, Sandip, and Jin Gil Jeong. 2021. Long-term international diversification of equities. Global Finance Journal 50: 100584. [Google Scholar] [CrossRef]
- Murthy, Shashidhar, and John K. Wald. 2023. Optimal trading with transaction costs and short-term predictability. Quantitative Finance 23: 1115–27. [Google Scholar] [CrossRef]
- Naqvi, Bushra, Syed Kumail Abbas Rizvi, Amir Hasnaoui, and Xuefeng Shao. 2022. Going beyond sustainability: The diversification benefits of green energy financial products. Energy Economics 111: 106111. [Google Scholar] [CrossRef]
- Nasir, Muhammad A., Muhammad Shahbaz, Trinh Thi Mai, and Moade Shubita. 2021. Development of Vietnamese stock market: Influence of domestic macroeconomic environment and regional markets. International Journal of Finance and Economics 26: 1435–58. [Google Scholar] [CrossRef]
- Olmo, Jose. 2021. Optimal portfolio allocation and asset centrality revisited. Quantitative Finance 21: 1475–90. [Google Scholar] [CrossRef]
- Olokoyo, Felicia O., Oyakhilome W. Ibhagui, and Abiola Babajide. 2020. Macroeconomic indicators and capital market performance: Are the links sustainable? Cogent Business and Management 7: 1792258. [Google Scholar] [CrossRef]
- Pitera, Marcin, and Łukasz Stettner. 2023. Discrete-time risk sensitive portfolio optimization with proportional transaction costs. Mathematical Finance 33: 1287–313. [Google Scholar] [CrossRef]
- Popescu, Andrei-Dragoş. 2022. Efficient frontier in portfolios containing stock market and financial digital assets. Revista de Științe Politice. Revue Des Sciences Politiques 73: 229–40. Available online: https://www.researchgate.net/publication/359771032_Efficient_frontier_in_portfolios_containing_stock_market_and_financial_digital_assets (accessed on 19 September 2022).
- Rehman, Abdul, Magdalena Radulescu, Fayyaz Ahmad, Muhammad Kamran Khan, Silvia Elena Iacob, and Laura Mariana Cismas. 2023. Investigating the asymmetrical influence of foreign direct investment, remittances, reserves, and information and communication technology on Pakistan’s economic development. Economic Research-Ekonomska Istrazivanja 36: 2131591. [Google Scholar] [CrossRef]
- Rigamonti, Andrea. 2020. Mean-variance optimization is a good choice, but for other reasons than you might think. Risks 8: 29. [Google Scholar] [CrossRef]
- Sadeghi, Behnam. 2022. Chatterjee correlation coefficient: A robust alternative for classic correlation methods in geochemical studies-(including ‘triplecpy’ python package). Ore Geology Reviews 146: 104954. [Google Scholar] [CrossRef]
- Sahabuddin, Mohammad, Md. Aminul Islam, Mosab I. Tabash, Suhaib Anagreh, Rozina Akter, and Md. Mizanur Rahman. 2022. Co-Movement, portfolio diversification, investors’ behavior and psychology: Evidence from developed and emerging countries’ stock markets. Journal of Risk and Financial Management 15: 319. [Google Scholar] [CrossRef]
- Senthilkumar, Arunachalam, Athira Namboothiri, and Sreelakshmi Rajeev. 2022. Does portfolio optimization favor sector or broad market investments? Journal of Public Affairs 22: e2752. [Google Scholar] [CrossRef]
- Shadabfar, Mahboubeh, and Longsheng Cheng. 2020. Probabilistic approach for optimal portfolio selection using a hybrid monte carlo simulation and markowitz model. Alexandria Engineering Journal 59: 3381–93. [Google Scholar] [CrossRef]
- Strategic Development Plan. 2011. Timor-Leste Strategic Development Plan 2011–2030, Government of Timor-Leste. Available online: https://www.adb.org/sites/default/files/linked-documents/cobp-tim-2014-2016-sd-02.pdf (accessed on 8 January 2021).
- Ta, Van-Dai, Chuan-Ming Liu, and Direselign Addis Tadesse. 2020. Portfolio optimization-based stock prediction using long-short term memory network in quantitative trading. Applied Sciences 10: 437. [Google Scholar] [CrossRef]
- Tao, Zheng, and Gaurav Gupta. 2022. Stock investment strategies and portfolio analysis. Paper presented at Academia-Industry Consortium for Data Science: AICDS, Advances in Intelligent Systems and Computing 1411, Wenzhou, China, December 19–20; pp. 397–406. [Google Scholar] [CrossRef]
- Thavaneswaran, Aerambamoorthy, You Liang, Alex Paseka, Md. Erfanul Hoque, and Ruppa K. Thulasiram. 2021. A novel data driven machine learning algorithm for fuzzy estimates of optimal portfolio weights and risk tolerance coefficient. IEEE International Conference on Fuzzy Systems 2021: 1–6. [Google Scholar] [CrossRef]
- Timor-Leste Ministry of Finance. 2010. Petroleum Fund Annual Report 2010. (August). Available online: https://www.bancocentral.tl/uploads/documentos/documento_1474853526_4283.pdf (accessed on 20 February 2022).
- Timor-Leste Ministry of Finance. 2011. Petroleum Fund Annual Report 2011. (September). Available online: https://www.bancocentral.tl/uploads/documentos/documento_1474853562_7176.pdf (accessed on 20 February 2022).
- Timor-Leste Ministry of Finance. 2012. Petroleum Fund Annual Report 2012. (July). Available online: https://www.bancocentral.tl/uploads/documentos/documento_1474853617_9174.pdf (accessed on 20 February 2022).
- Timor-Leste Ministry of Finance. 2013. Petroleum Fund Annual Report 2013. (July). Available online: https://www.bancocentral.tl/uploads/documentos/documento_1474853655_8570.pdf (accessed on 20 February 2022).
- Timor-Leste Ministry of Finance. 2014. Petroleum Fund Annual Report 2014. (July). Available online: https://www.bancocentral.tl/uploads/documentos/documento_1474853702_6261.pdf (accessed on 20 February 2022).
- Timor-Leste Ministry of Finance. 2015. Petroleum Fund Annual Report 2015. Available online: https://www.bancocentral.tl/uploads/documentos/documento_1474853743_8013.pdf (accessed on 20 February 2022).
- Timor-Leste Ministry of Finance. 2016. Petroleum Fund Annual Report 2016. (July). Available online: https://www.bancocentral.tl/uploads/documentos/documento_1506558376_4574.pdf (accessed on 20 February 2022).
- Timor-Leste Ministry of Finance. 2017. Petroleum Fund Annual Report 2017. (August). Available online: https://www.bancocentral.tl/uploads/documentos/documento_1534826066_1536.pdf (accessed on 20 February 2022).
- Timor-Leste Ministry of Finance. 2018. Petroleum Fund of Timor-Leste. (August). Available online: https://www.bancocentral.tl/uploads/documentos/documento_1566346580_7625.pdf (accessed on 20 February 2022).
- Timor-Leste Ministry of Finance. 2019. Timor-Leste Petroleum Fund—Annual Report 2019. Available online: https://www.bancocentral.tl/uploads/documentos/documento_1600057279_4497.pdf (accessed on 20 February 2022).
- Timor-Leste Ministry of Finance. 2021. Timor-Leste Petroleum Fund—Annual Report 2021. Available online: https://www.bancocentral.tl/uploads/documentos/documento_1686102832_5555.pdf (accessed on 6 November 2023).
- Umutlu, Mehmet, and Pelin Bengitöz. 2020. The cross-section of industry equity returns and global tactical asset allocation across regions and industries. International Review of Financial Analysis 72: 101574. [Google Scholar] [CrossRef]
- van Staden, Pieter M., Duy-Minh Dang, and Peter A. Forsyth. 2021. The surprising robustness of dynamic mean-variance portfolio optimization to model misspecification errors. European Journal of Operational Research 289: 774–92. [Google Scholar] [CrossRef]
- Výrost, Tomas, Štefan Lyócsa, and Eduard Baumöhl. 2019. Network-based asset allocation strategies. North American Journal of Economics and Finance 47: 516–36. [Google Scholar] [CrossRef]
- Wang, Lu, Ferhana Ahmad, Gong-li Luo, Muhammad Umar, and Dervis Kirikkaleli. 2022. Portfolio optimization of financial commodities with energy futures. Annals of Operations Research 313: 401–39. [Google Scholar] [CrossRef] [PubMed]
- Wen, Fenghua, Jiahui Cao, Zhen Liu, and Xiong Wang. 2021. Dynamic volatility spillovers and investment strategies between the chinese stock market and commodity markets. International Review of Financial Analysis 76: 101772. [Google Scholar] [CrossRef]
- Yahoo Finance. n.d. Historical Dataset of 20 Assets Listed on the Stock Market of Developed Countries. Available online: https://finance.yahoo.com/ (accessed on 11 September 2022).
- Zhang, Zi’ang. 2022. Study of portfolio performance under certain restraint comparison: Markowitz model and single index model on S&P 500. Paper presented at 2022 7th International Conference on Social Sciences and Economic Development (ICSSED 2022) 652 (Icssed), Wuhan, China, March 25–27; pp. 1930–38. [Google Scholar] [CrossRef]
Figure 1.
The evolution of the Petroleum Fund’s investment strategy.

Figure 2.
Asset allocations by countries, 2019. Source: authors’ elaboration. Notes: Data range = maximum value minus minimum value for fixed-income securities (%) = 83.1 − 0.5 = 82.6; equities (%) = 62.7 − 0.1 = 62.6; portfolio (%)1 = 74.8 − 0.4 = 74.4. The portfolio (%) shows investments in other assets such as cash and private debt. Further information on the data ranges is in the Appendix A.

Figure 3.
The monthly returns of the twenty stocks selected by Timor-Leste for investment in the capital market from 2006 to 2019. Source: authors’ calculation. Notes: The values on the x-axis are in months; the y-axis represents the final values for each series of returns, which were later used to calculate the optimal portfolio. Thus, all 20 assets as shown in Table 1.

Figure 4.
Correlation matrix. Source: authors’ calculation. *, **: Correlation is significant at the 0.05 (0.01) level (2-tailed).
Figure 4.
Correlation matrix. Source: authors’ calculation. *, **: Correlation is significant at the 0.05 (0.01) level (2-tailed).

Figure 5.
Minimum variance portfolio weights. Source: authors’ elaboration.

Figure 6.
Tangency portfolio weights. Source: authors’ elaboration.

Figure 7.
Target return and risk (efficient frontier). Source: authors’ elaboration.

Table 1.
List of Petroleum Fund assets invested in developed equity markets and used in this study, with their respective industries and sectors.
Table 1.
List of Petroleum Fund assets invested in developed equity markets and used in this study, with their respective industries and sectors.
| Symbol | Security | Industry | Sector | Unit Holding | Fair Value (USD) |
|---|---|---|---|---|---|
| AAPL | Apple Inc. (Cupertino, CA, USA) | Technology Hardware, Storage and Peripherals | Information Technology | 642,259 | 188,419,523 |
| MSFT | Microsoft Corp (Redmond, WA, USA) | Software | Information Technology | 1,060,212 | 166,962,186 |
| JNJ | Johnson & Johnson (New Brunswick, NJ, USA) | Pharmaceuticals | Healthcare | 449,929 | 65,590,650 |
| AZN.L | AstraZeneca PLC (Cambridge, England, UK) | Pharmaceuticals | Healthcare | 144,221 | 14,531,789 |
| 7203.T | Toyota Motor Corp (Toyota City, Aichi, Japan) | Auto Manufacturers | Consumer Cyclical | 385,62 | 27,368,635 |
| HSBA.L | HSBC Holdings PLC (London, UK) | Banks-Diversified | Financial Services | 3,279,754 | 25,717,212 |
| AMZN | Amazon.Com Inc. (Bellevue, WA, USA) | Internet Retail | Consumer Cyclical | 51,853 | 95,767,306 |
| SNW.F | Sanofi (Paris, France) | Drug Manufacturers—General | Healthcare | 199,146 | 20,029,311 |
| JPM | JPMorgan Chase & Co. (New York, NY, USA) | Banks—Diversified | Financial Services | 473,317 | 65,966,190 |
| NSRGY | Nestle SA (Vevey, Switzerland) | Packaged Foods | Consumer Defensive | 503,695 | 54,502,126 |
| 8306.T | Mitsubishi UFJ Financial Group, Inc. (Chiyoda City, Tokyo, Japan) | Banks—Diversified | Financial Services | 1,823,600 | 9,952,399 |
| 9433.T | KDDI Corporation (Chiyoda City, Tokyo, Japan) | Telecom Services | Communication Services | 391,1 | 11,706,906 |
| XOM | Exxon Mobil Corporation (Houston, TX, USA) | Oil and Gas Integrated | Energy | 634,464 | 44,253,864 |
| T | AT&T Inc. (Dallas, TX, USA) | Telecom Services | Communication Services | 1,094,545 | 42,763,873 |
| PG | The Procter & Gamble Company (Cincinnati, OH, USA) | Household and Personal Products | Consumer Defensive | 416,079 | 51,934,981 |
| BAC | Bank of America Corporation (Charlotte, NC, USA) | Banks—Diversified | Financial Services | 1,079,106 | 37,984,531 |
| PFE | Pfizer Inc. (Charlotte, NY, USA) | Drug Manufacturers—General | Healthcare | 985,722 | 38,600,874 |
| VZ | Verizon Communications Inc. (Delaware, NY, USA) | Telecom Services | Communication Services | 638,154 | 39,150,748 |
| SAP.DE | Sap Se (Walldorf, Germany) | Software—Application | Technology | 151,005 | 20,350,546 |
| DGE.L | Diageo plc (London, UK) | Beverages—Wineries and Distilleries | Consumer Defensive | 437,736 | 18,556,519 |
Source: Timor-Leste Ministry of Finance (2019) and (Yahoo Finance n.d.).
Table 2.
Descriptive statistics.
| Stock Code | N | Range | Minimum | Maximum | Mean | Std. Deviation | Skewness | Kurtosis |
|---|---|---|---|---|---|---|---|---|
| AAPL | 167 | 0.57 | −0.33 | 0.24 | 0.0250 | 0.09030 | −0.600 | 1.675 |
| MSFT | 167 | 0.42 | −0.17 | 0.25 | 0.0144 | 0.06687 | 0.041 | 0.989 |
| JNJ | 167 | 0.24 | −0.13 | 0.11 | 0.0089 | 0.04171 | −0.387 | 0.837 |
| AZN.L | 167 | 0.36 | −0.16 | 0.20 | 0.0118 | 0.06108 | 0.386 | 0.172 |
| X7203.T | 167 | 0.44 | −0.20 | 0.25 | 0.0065 | 0.07116 | 0.203 | 0.806 |
| HSBA.L | 167 | 0.41 | −0.18 | 0.23 | 0.0043 | 0.06234 | 0.317 | 1.290 |
| AMZN | 167 | 0.85 | −0.30 | 0.54 | 0.0276 | 0.10246 | 0.478 | 3.785 |
| SNW.F | 167 | 0.31 | −0.17 | 0.14 | 0.0057 | 0.05649 | −0.444 | 0.303 |
| JPM | 167 | 0.47 | −0.23 | 0.24 | 0.0128 | 0.07909 | −0.263 | 0.947 |
| NSRGY | 167 | 0.30 | −0.13 | 0.17 | 0.0112 | 0.04533 | −0.074 | 1.159 |
| X8306.T | 167 | 0.67 | −0.33 | 0.34 | −0.0001 | 0.09050 | 0.195 | 1.609 |
| X9433.T | 167 | 0.36 | −0.14 | 0.22 | 0.0112 | 0.06815 | 0.055 | 0.140 |
| XOM | 167 | 0.25 | −0.13 | 0.11 | 0.0043 | 0.04960 | −0.305 | 0.042 |
| T | 167 | 0.26 | −0.16 | 0.10 | 0.0097 | 0.05122 | −0.640 | 0.500 |
| PG | 167 | 0.23 | −0.12 | 0.11 | 0.0079 | 0.04308 | −0.294 | 0.156 |
| BAC | 167 | 1.25 | −0.52 | 0.73 | 0.0089 | 0.13012 | 0.499 | 7.279 |
| PFE | 167 | 0.31 | −0.18 | 0.14 | 0.0073 | 0.05252 | −0.300 | 0.489 |
| VZ | 167 | 0.27 | −0.12 | 0.15 | 0.0100 | 0.05093 | −0.095 | −0.143 |
| SAP.DE | 167 | 0.51 | −0.27 | 0.24 | 0.0096 | 0.06214 | −0.126 | 2.687 |
| DGE.L | 167 | 0.29 | −0.13 | 0.16 | 0.0115 | 0.04218 | −0.143 | 0.657 |
Source: authors’ calculation.
Table 3.
Result of portfolio diversification.
| Code | Equally Weighted (%) | Max Sharpe Ratio (%) | Minimum Variance (%) |
|---|---|---|---|
| AAPL | 5.00 | 5.9 | 2.29 |
| MSFT | 5.00 | 2.9 | 2.04 |
| JNJ | 5.00 | 3.2 | 4.41 |
| AZN.L | 5.00 | 3.1 | 4.93 |
| 7203.T | 5.00 | 0.4 | 5.87 |
| HSBA.L | 5.00 | 0.2 | 2.48 |
| AMZN | 5.00 | 8.3 | 3.92 |
| SNW.F | 5.00 | 1.5 | 4.02 |
| JPM | 5.00 | 10 | 2.45 |
| NSRGY | 5.00 | 10.4 | 3.80 |
| 8306.T | 5.00 | 0.3 | 0.03 |
| 9433.T | 5.00 | 4.4 | 6.75 |
| XOM | 5.00 | 9.1 | 8.00 |
| T | 5.00 | 10 | 3.16 |
| PG | 5.00 | 5.8 | 9.65 |
| BAC | 5.00 | 0.6 | 0.01 |
| PFE | 5.00 | 2.6 | 6.83 |
| VZ | 5.00 | 6.8 | 7.77 |
| SAP.DE | 5.00 | 3.8 | 11.2 |
| DGE.L | 5.00 | 10.7 | 10.39 |
| Total | 100.00 | 100.00 | 100.00 |
| Return | 1.04 | 1.22 | 1.008 |
| Risk | 3.64 | 3.38 | 3.12 |
| Sharpe Ratio | 28.56 | 36.14 | 32.29 |
Source: authors’ calculation.
Disclaimer/Publisher’s Note: The statements, opinions and data contained in all publications are solely those of the individual author(s) and contributor(s) and not of MDPI and/or the editor(s). MDPI and/or the editor(s) disclaim responsibility for any injury to people or property resulting from any ideas, methods, instructions or products referred to in the content. |
© 2024 by the authors. Licensee MDPI, Basel, Switzerland. This article is an open access article distributed under the terms and conditions of the Creative Commons Attribution (CC BY) license (https://creativecommons.org/licenses/by/4.0/).
Share and Cite
MDPI and ACS Style
Anuno, F.; Madaleno, M.; Vieira, E. Testing of Portfolio Optimization by Timor-Leste Portfolio Investment Strategy on the Stock Market. J. Risk Financial Manag. 2024, 17, 78. https://doi.org/10.3390/jrfm17020078
AMA Style
Anuno F, Madaleno M, Vieira E. Testing of Portfolio Optimization by Timor-Leste Portfolio Investment Strategy on the Stock Market. Journal of Risk and Financial Management. 2024; 17(2):78. https://doi.org/10.3390/jrfm17020078
Chicago/Turabian StyleAnuno, Fernando, Mara Madaleno, and Elisabete Vieira. 2024. "Testing of Portfolio Optimization by Timor-Leste Portfolio Investment Strategy on the Stock Market" Journal of Risk and Financial Management 17, no. 2: 78. https://doi.org/10.3390/jrfm17020078