
Investigating M-Payment Intention across Consumer Cohorts

Business Administration Division, Mahidol University International College, Mahidol University, Salaya, Nakhon Pathom 73170, Thailand
*
Author to whom correspondence should be addressed.
J. Theor. Appl. Electron. Commer. Res. 2024, 19(1), 431-447; https://doi.org/10.3390/jtaer19010023
Submission received: 8 August 2023
/
Revised: 27 December 2023
/
Accepted: 14 February 2024
/
Published: 19 February 2024
(This article belongs to the Collection Enhancing Consumer Experience through Mobile Commerce: Challenges and Opportunities)
Abstract
:This study investigates the widespread adoption of mobile payments (m-payments) and their impact on different generations, particularly post-COVID-19. We fill a gap in research by suggesting a new way to understand this phenomenon through the lens of social cognitive theory. We employed a multi-stage sampling technique, including purposive, quota, and snowball sampling, to ensure comparable group sizes for four generations and obtained usable survey data from 716 Thai online shoppers. The results reveal direct and indirect (through perceived values) significant relationships between technological self-efficacy and m-payment intention. While perceived values, which constitute functional, emotional, monetary, and social values, fully mediate the relationship between technological self-efficacy and m-payment intention in Gen B and Gen X consumers, it only partially mediates such a relationship in the Gen Y and Gen Z cohorts. Our findings also provide crucial theoretical and practical insights for digital commerce in the evolving landscape of m-payment adoption.
1. Introduction
The mobile payment (m-payment) adoption rate has been rather slow in the past few decades as users are concerned about the system’s complexity, reliability, and security [1]. M-payment is described as payments for goods, services, and bills/invoices between payers and receivers made using mobile devices and wireless Internet to complete financial transactions [2]. Examples of such technologies include near-field communication (NFC) [3] or quick response (QR) codes [4]. Hence, this study refers to m-payment as any contactless digital payment.
Despite the economic downturn brought by the COVID-19 pandemic to many industries, there was a sharp rise in e-commerce and digital payment during 2020 and 2022 [5]. Prior to COVID-19, the annual global growth rate of m-payment was steady (i.e., 12–16 percent) between 2018 and 2019 and more than 20 percent in 2021, with Asia Pacific being the major contributor [5,6]. With the advancement of e-commerce and the proliferation of mobile devices and social networks, digital payment and mobile wallets accounted for 45% of all B2C (Business-to-Consumer) e-commerce transactions in 2021 compared to debit/credit cards (32%), bank transfers (11%), and cash-on-delivery (4%) [7]. The number of people making digital payments including mobile payment services, B2C digital commerce, and B2C transfer increased by 8.3% between 2021 and 2022, with 321 million more users and a total transaction value of $8.49 trillion [7]. This demonstrates a significant contribution of digital transactions to the market, notably through e-commerce.
The popularity of m-payments is undeniable as the benefits gained by both trading parties are apparent. While enjoying online purchases made via mobile devices, transactions can be completed within a single device, making it faster, more convenient, and more secure for sellers and customers [8]. Retailers/sellers realize higher transaction volumes, improved customer loyalty, and lower transaction costs [9,10]. However, the most prominent hurdle to the implementation of m-payment is the issue of security (e.g., fraudulent transactions) and privacy, resulting in users’ hesitation to adopt m-payment [1,11].
Given the aforementioned emerging trend of m-payment, research on this topic is still in its early stage of development with a limited common research framework such as the proposed technology-personal-environment (TPE) paradigm [6]. Several themes appear in m-payment research, with the majority of them focusing on the intention to use m-payment by exploring several factors including, for example, perceived ease of use and usefulness from the technology acceptance model (TAM), subjective norms from the theory of planned behavior (TPB), trust, and perceived risk from innovation resistance theory, e.g., [12,13]. Since the framework of m-payment is still immature, this study applies the social cognitive theory (SCT) to investigate this phenomenon in the emerging economy context of Thailand by focusing on the intention to use m-payment in a triadic paradigm including personal, environmental, and behavioral variables. Specifically, our study applies SCT and perceived value to explain how technological self-efficacy influences perceived value and intention to use m-payment amongst consumers of different generations in Thailand. We also extend Zhu, Sangwan, and Lu’s [14] study which investigates perceived value as a unidimensional construct by conceptualizing and operationalizing ‘perceived value’ as a second-order construct comprising four first-order perceived values, namely, functional, emotional, monetary, and social.
Thailand was selected as our focal research context due to its recent emergent record (i.e., top five in the world) of online activities using m-payment services (33.5% of Internet users compared to 25.0% global average) [7], and the annual per capita transactions, increasing from 63 in 2017 to 312 in 2021 [15]. Despite this sharp rise in m-payment usage and online activities among Thai consumers, research on m-payment in Thailand is quite scarce with some works focusing on comparing m-payment service platforms [16], current/potential users [17], and m-payment adoption [10,18]—most of which were built on the unified theory of acceptance and use of technology (UTAUT), innovation diffusion theory (IDT), and technology acceptance model (TAM). Recently, Zhu, Charoennan, and Embalzado [19] focused on m-payment intention among the millennial generation (Gen M) in Bangkok.
Although the adoption of m-payment amongst this specific generation seems justified, other generations also significantly contributed to the growth of m-payments [20], especially after the COVID-19 pandemic. The significant generations in the market are baby boomers (Gen B), Generation X (Gen X), millennials or Generation Y (Gen Y), and the next generation or Generation Z (Gen Z) [21]. The senior cohort, Gen B, born between 1946 and 1964, displays traits such as substantial average disposable income, enthusiasm, positivity, self-confidence, and sociability [22]. Marketers consider the lifestyle, needs, attitudes, and behaviors of this demographic crucial for formulating effective marketing strategies aimed at attracting them [21]. Gen X (also known as digital immigrants), born between 1965 and 1980, is characterized by skepticism, resourcefulness, independence, and pragmatism, seeks to balance life and work, and values flexibility [21,23]. Gen Y, commonly referred to as millennials, encompasses individuals born between 1980 and 1995 [23]. This cohort, the first to experience early exposure to technology, shapes their communication style influenced by new technologies, the Internet, and social media networks, maintaining constant connectivity on multiple devices [21]. The final cohort, Gen Z, recognized as digital natives, distinguishes itself as the most educated, mobile, and connected consumer group. This cohort is characterized by social consciousness, technological proficiency, and a desire for innovation, maintaining connectivity through smartphones, tablets, and the Internet of Things [21]. Demonstrating the generational disparity, previous studies cf. [24] have identified both commonalities and variations when examining the intention to adopt m-payment across different generations.
The preceding paragraphs highlight several research gaps that hinder a comprehensive understanding of consumer behavior in the realm of m-payment. Firstly, past research has repeatedly investigated the relationships of m-payment with conventional theories such as TPB, TAM, or UTAUT, yet a mature framework capturing the intricate interrelationship between technology, human factors, and the environment is notably absent. Secondly, despite Thailand emerging as a leading user of m-payment services, there remains a dearth of research on this topic, particularly in the context of distinguishing between different generational cohorts. Therefore, this study aims to investigate the relationship between technological self-efficacy, perceived value (functional, emotional, monetary, and social), and intention to use m-payment services. The investigation also extends to exploring how these factors influence the intention to use m-payment among distinct cohorts in Thailand, namely, Gen B, X, Y, and Z.
2. Literature Review and Hypothesis Development
2.1. Theoretical Underpinning
The adoption of technology has been approached through several theoretical lenses, including the theory of reasoned action (TRA) [25], the theory of planned behavior (TPB) [26], the technology acceptance model (TAM) [27], the unified theory of acceptance and use of technology (UTAUT) [28], and the social cognitive theory (SCT) [29,30]; cf. [28] for further reading. UTAUT provides a new set of variables by incorporating the predictors envisioned in the aforementioned models such as TRA, TPB, TAM, IDT, and SCT [28]. The main predictors of this theory include performance expectancy, effort expectancy, social influence, and facilitating conditions to evaluate behavioral intention and actual behavior. Predictors of this paradigm are anchored in numerous theories in an attempt to unite the theory. For example, performance expectancy encompasses perceived usefulness from TAM and outcome expectations from SCT, whereas effort expectancy represents perceived ease of use from TAM [28]. However, predictors in the UTAUT are evaluated based on technological and environmental factors but the model neglects the user’s characteristics. As a result, to respond to the immature framework of TPE as elucidated by Leong, Hew, Wong, and Lin [6], this study relies on the SCT concept of the triadic relationship of personal, environmental, and behavioral factors.
The application of SCT to explicate behavioral intention has encompassed several industries in order to comprehend the role of human cognition, motivation, emotion, and behavior which shape the environment in which people live [31]. Bandura [29] proposed the most prominent framework for the social cognitive theory (SCT)—a triadic reciprocal model—explaining the bidirectional relationships interacting among personal, environmental, and behavioral determinants of human behavior, in which behavior is shaped, controlled, and influenced by internal personal characteristics and the environment. The personal determinant refers to a sense of control, believing that one can make changes or actions to resolve a problem [32]. Based on Bandura [33], self-efficacy was introduced as a personal determinant to explain new social modeling beyond mimicry response to observe how the pattern of behavior is generated to adopt, initiate, and maintain certain behaviors. As for the environmental determinant, SCT explains how the environment is imposed, selected, and constructed to eventually change human behavior [34]. This premise explains how the environment shapes human behavior depending on one’s decision to select and construct the environment, which then influences the responses in his or her actions. The following sections explain the roles of technology self-efficacy, perceived value, and m-payment intention in the SCT triadic model.
2.2. Technological Self-Efficacy
Self-efficacy can generally be defined as the belief or confidence that one has in his/her ability to successfully carry out a specific action [35]. The concept of self-efficacy further explains how an individual opts for a particular activity, considering specific behavioral settings, the effort needed, and persistence to face the problem [14,36]. Thus, an individual with higher self-efficacy is motivated to complete a task [34]. Individuals with low self-efficacy, on the other hand, will not be self-motivated to do something in which they are unsure of their capabilities. Accordingly, it is predicted that an individual’s higher degree of self-efficacy can make them more enthusiastic to commit certain behaviors and improve social integration [32,37]. Moreover, when an individual feels competent in their self-efficacy, it often results in a positive rather than a negative effect because he/she has confidence in taking the action [32].
The concept of self-efficacy has been widely applied in different contexts, including computer self-efficacy (CSE), e.g., [38], Internet self-efficacy (ISE) [39], and mobile self-efficacy, e.g., [14,40]. In this study, we aim to investigate how the technological self-efficacy of consumers may influence their m-payment intention; therefore, it is defined as the belief that one has the ability to search for more information or communicate with technical assistants to obtain the essential skills needed to operate the new technology [41].
Past studies also have explored self-efficacy for operating numerous technological devices in various contexts. Tao, Shao, Wang, Yan, and Qu [42] found that individuals with high self-efficacy perceived a healthcare application to be useful and easy to use. This finding further contributes to the studies of Hong, Lin, and Hsieh [43] and Zhang, Han, Dang, Meng, Guo, and Lin. [44], which only found a positive relationship between self-efficacy and perceived ease of use. Similarly, Zhu, So, and Hudson [45] and Cao, Li, Wang, and Ai [46] also discovered a positive link between technological self-efficacy and perceived value. Thus, we postulate that technological self-efficacy will affect both the psychological state and behavior response of consumers in m-payment intention.
2.3. Perceived Value
Perceived value can explain how consumers evaluate a product/service in their perception of its costs and benefits [47]. Zhu, Sangwan, and Lu [14] view perceived value, through VAM, as being affected by benefits and sacrifices which in turn contribute to adoption intention. Perceived sacrifice includes four dimensions (i.e., privacy risk, innovation resistance, technicality, and perceived fee) and perceived benefit includes three dimensions (i.e., facilitating conditions, usefulness, and enjoyment). Although this model captures both positive and negative effects of perceived value, the results show weak or little effect of perceived sacrifice on perceived value, e.g., [14,45,48]. Therefore, the influence of perceived sacrifice/cost might not be well explained in VAM.
Other perspectives on perceived value indicate that as consumer behavior becomes more complex, a unidimensional or bidimensional construct of perceived value might be inadequate to capture the concept [49,50]. Cao, Li, Wang, and Ai [46] found a weak positive link between live-streaming commerce self-efficacy on both perceived value and customer engagement. This weak effect could be attributed to their unidimensional conceptualization of perceived value which may not fully capture the entire domain of the construct. Therefore, a multidimensional scale to measure perceived value might be essential.
Previously, multidimensional scales of perceived value were introduced. For instance, Sheth, Newman, and Gross [51] proposed five dimensions of perceived value, including functional, conditional, social, emotional, and epistemic values. Sweeney and Soutar [52] validated a more recent multidimensional scale of consumer perceived value with four dimensions: quality, emotional, price, and social aspects. They argued that Sheth et al.’s [51] scale was problematic because the functional value, defined by product attributes including reliability, durability, and price, could exhibit positive effects as opposed to price, which may generate a negative effect. Thus, Sweeney and Soutar [52] proposed a split of functional value into quality and price. Table 1 summarizes the components used to conceptualize perceived value and the commonly associated dimensions (i.e., functional, emotional, social, and monetary values). Therefore, we propose that the perceived value be treated as a second-order construct that constitutes these four common dimensions [50,52,53].
2.3.1. Functional Value
Functional or utilitarian value, which refers to physical performance including reliability, durability, and price, is the most prominent key dimension of perceived value [51]. Sweeney and Soutar [52] refer to functional value as the quality of the product’s expected performance. In the context of m-payment, functional value refers to the benefits realized by users from completing the financial transaction effectively in due time. This value reflects the quality of the system, various options of advanced technology (e.g., QR code, NFC), the features available for users, and the ease of operating the system.
2.3.2. Emotional Value
Emotional value, also referred to as hedonic value, is defined as the ability to elicit emotions or affective states while obtaining a consumption experience with a product or service [51]. While functional value explicates extrinsic cognitive motivation, emotional value focuses on intrinsic affective motivation which generates favorable feelings such as liking and pleasantness [52]. The emotional value is defined and measured similarly to perceived enjoyment and perceived playfulness which explains how users are involved in a certain action without concern for any negative consequences [57]. Although using mobile payments may not offer the same level of enjoyment as playing games, the m-payment process is smooth and seamless, with no buffering or lag time, ultimately leading to positive feelings such as pleasure and joy [55].
2.3.3. Monetary Value
Sheth, Newman, and Gross [51] consider monetary value as an element of functional value to explain the perceived costs incurred by users. According to Hernandez-Ortega, Aldas-Manzano, Ruiz-Mafe, and Sanz-Blas [50], monetary value is the cost/benefit dimension of perceived value in which using the product will help save time, effort, and costs. In this study, monetary value is defined as the time and effort saved by using m-payment platforms [50,52]. M-payment eliminates many activities inherent in other payment methods (e.g., searching for an ATM or a bank for cash) which necessitate more effort, time, and additional fees (e.g., credit card annual fee). Thus, m-payment may be perceived as providing better monetary value.
2.3.4. Social Value
Social value is viewed as an evaluation associated with a social group [51]. It is a reflection of self-expression, self-concept, and self-image that seeks social acceptance and is referred to as a symbolic value [51,53]. By using the product, the self-concept is enhanced [52]. For instance, an individual’s decision to select a car brand is associated with how the brand can boost his/her self-image. Although m-payment might not be directly associated with a sophisticated image, it may provide a futuristic look since a cashless society is deemed trendy while cash payment offers an outdated look. Thus, using m-payment leads to a good impression and enhances social approval.
Due to its complex nature, perceived value has usually been treated as a multi-faceted second-order construct, e.g., [50,53,55]. Given the four eminent dimensions of perceived values—functional, emotional, social, and monetary values [48,50,51,52,53], this study proposes to reinvestigate perceived value as a second-order reflective construct and hypothesizes that:
H1.
Functional value, emotional value, monetary value, and social value are salient dimensions of perceived values.
2.4. M-Payment Intention
The behavioral determinant, the last component of the SCT, explains how individuals react to a different condition, object, or context, as well as the new technology [58]. This component explains how personal and environmental factors interact to predict individual action. In prior research within the realm of technology adoption, scholarly inquiries commonly integrate various behavioral intentions, encompassing aspects such as word-of-mouth intention, e.g., [59,60,61], online purchase intention, e.g., [62], or continuance usage intention, e.g., [59]. Consequently, behavioral intention can be categorized as the degree of an individual’s anticipation to execute a certain action [26,63]. Although behavioral intention is not an actual behavior, given a higher degree of intention, it can eventually predict the actual behavior [26]. As such, m-payment intention has been widely used in studies as it is strongly correlated with actual behavior in using m-payment [64].
Accordingly, the SCT triadic reciprocal relationship suggests the existence of relationships among technological self-efficacy, perceived values, and m-payment intention. It explains that individuals with higher technological self-efficacy will be keen to seek more information to learn how to use m-payment [34]. This, in turn, will influence them to perceive using m-payment as beneficial [42,45,46] and increase their m-payment intention. However, individuals with lower technological self-efficacy may be unlikely to opt for m-payment [36]. It is important to highlight that the concept of perceived value correlates with both perceived benefits and costs. The surplus of benefits over costs is integral to shaping the overall perceived value [47]. While other studies have explored the impact of perceived benefits and costs on behavioral intention [59,60], this study specifically focuses on examining perceived value. Within this concept, consumers have meticulously evaluated the benefits in relation to the sacrifices. In addition, it is noteworthy that concurrently incorporating both benefits and sacrifices in the same model may yield non-significant results, e.g., [14,45,48]. For instance, in the study of Liu, Lin, and Hsu [59], perceived usefulness from TAM and perceived seriousness from the health belief model (HBM) were operationalized as perceived benefits and costs, respectively, in the context of behavioral intention toward continued e-payment usage and no significant results were found. However, based on this line of argument and our prior discussion on SCT that technological self-efficacy will affect both the psychological state and behavior response of consumers in m-payment intention, the following hypotheses are formulated:
H2.
Technological self-efficacy positively influences perceived values.
H3.
Technological self-efficacy positively influences m-payment intention.
H4.
Perceived values positively influence m-payment intention.
The acceptance of technology reflects how different generations form their value and decision processes toward technology adoption [65]. To date, studies show differences in how consumers of various generations (from Gen B to Gen Z) adopt technology, e.g., [24]. Many studies believe that certain generations can be combined as they share similar characteristics [13,65,66]. However, studies regarding m-payment reveal contradictory findings. Agárdi and Alt [24] compared m-payment intention between Gen X and Gen Z and found differences in their considerations of compatibility and enjoyment. Moreover, past research tends to focus mainly on Gen Z because of their high engagement and higher technology adoption rate based on generation cohort theory (GCT) [67]. Gen Z can be a compelling focus in various fields, including job recruitment, organizational behavior, and consumer studies [68,69,70]. Their characteristics offer valuable insights in these areas as they are interested in social networks, engagement in multiple realities (both real and virtual worlds), and rapid reactions to new information and platforms [70]. Their traits contribute to the swift expansion of the Internet and mobile technologies [68]. However, with their preference for shopping in physical stores, their reactions to mobile technologies may vary [69]. While the younger generations (digital natives) are typically early adopters, older generations such as Gen B, X, and Y tend to lag in adopting new technologies. Thus, it is interesting to examine whether the proposed relationships are similar or different across Gen B, Gen X, Gen Y, and Gen Z. Therefore, the following hypotheses are proposed:
H5.
The relationships among technological self-efficacy, perceived values, and m-payment differ across consumer cohorts.
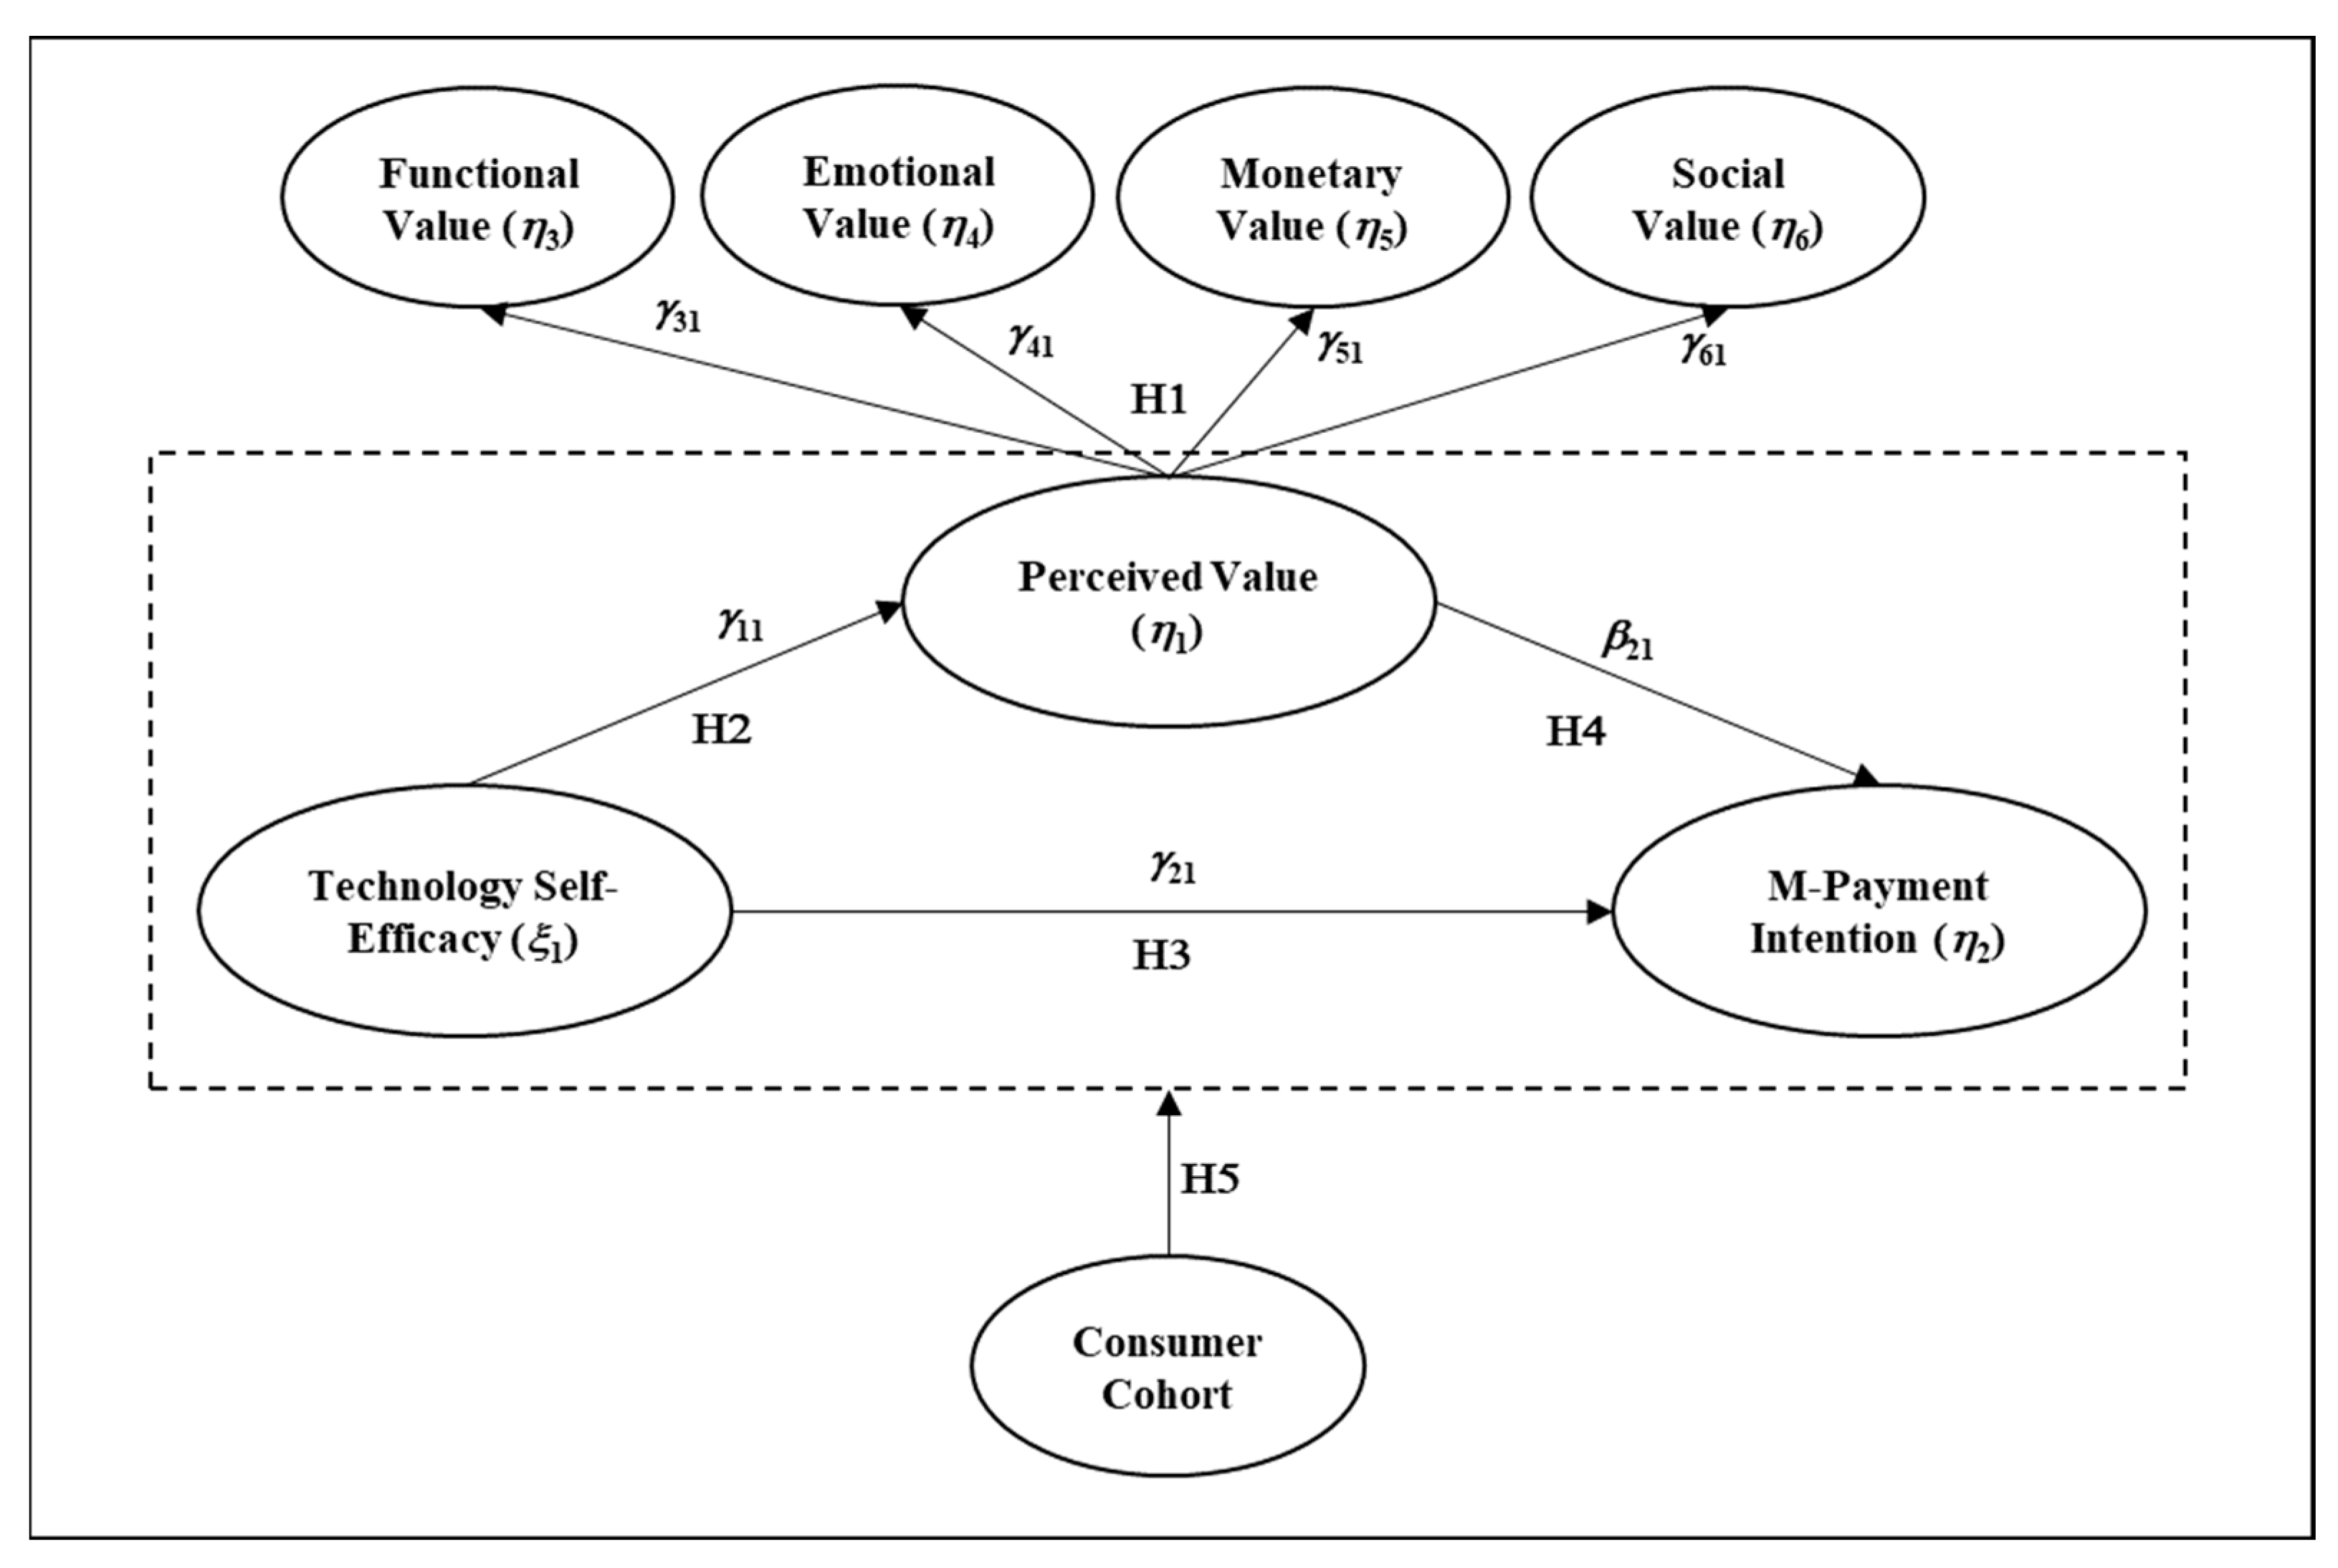
Building on SCT, this study proposes a model to predict m-payment intention by incorporating a triadic paradigm of personal, environmental, and behavioral variables (see Figure 1). While technological self-efficacy represents the personal variable in the model, a second-order reflective construct of perceived values, comprising functional, emotional, social, and monetary values, is viewed as an environment-related factor.
3. Research Method
3.1. Sample and Data Collection
Our data were collected from consumers in Thailand due to its recent surge in online shopping activities during January and March 2021 [7]. Since this study aims to compare consumers across four generations (Gen B, X, Y, and Z), a multi-stage sampling (purposive, quota, and snowball) technique was employed to enhance sample equivalence in terms of approximately equal group sizes for comparative purposes [71]. Hence, equal proportions of four specific generations (or consumer cohorts) and genders were specified before approaching the target population. Snowball sampling was used to identify shoppers with online shopping experiences from these specific cohorts and genders. An online electronic survey (Google Form) was used to obtain data from the initial groups of consumers. These initial groups were requested to send the link to other consumers who might be eligible to provide similar information and fall into one of the four cohorts that represent the specified generations. All respondents were recruited voluntarily without being offered any awards for participating in the survey. This resulted in a final sample size of 716 respondents (143 Gen B; 163 Gen X; 203 Gen Y; and 207 Gen Z) with 46.4% male; 52.7% female; and 1% preferred not to say. Other sample profiles, including age, income, and education are presented in Table 1. These demographics are consistent with those of the Thai population based on the Thailand National Statistics Office (www.nso.go.th). Therefore, our sample characteristics seem to resonate with those of Thailand’s population.
3.2. Research Instrument
The questionnaire briefly explains the broad objectives and expected benefits from the study and solicits consumers’ consent for data collection in compliance with the ethical protocol. From the filter question, it is confirmed that all respondents have had online shopping experience within the past one year (see Table 2). All scales to measure the constructs were adopted from prior studies (see scale sources from Table 3) and were itemized with a 7-point rating range.
3.3. Common Method Bias
Since a single informant was responsible for completing the questions, which were used for independent and dependent variables, a situation most likely prone to common method bias [71], several treatments were incorporated in both ex ante and ex post data collection. Firstly, various scale types and labels were used. Secondly, questions measuring other irrelevant constructs were interspersed throughout the questionnaire. Lastly, Harman’s single-factor analysis was performed to check the proportion of variance accounted for by the first factor. When the first factor accounts for a large proportion of the total variances extracted, the data could be susceptible to common method bias [75]. Therefore, an exploratory factor analysis (EFA) was performed to check the potential of this bias. The results from exploratory factor analysis through SPSS software version 26 revealed a clear three-factor solution (i.e., perceived value, technological efficacy, and m-payment intention) with the first factor accounting for 43.9% of the total variance; common method bias is not evident in our data.
4. Data Analysis and Results
4.1. Scale Assessment and Validation
We used AMOS version 22 to analyze our multiple-group second-order structural equations. The output from our analyses was used for scale assessment and hypothesis testing. The original scales adopted from prior literature were in English so the back-translation technique was used to ensure translation equivalence as suggested by Behling and Law [76]. Table 2 reports standardized factor loadings, composite reliabilities (CRs), average variance extracted (AVE), Cronbach’s alphas, and item-to-total correlations of the scales used in this study. Based on Bagozzi and Yi [77], our measurement model fits the data well with a significant Chi-Square (χ2) of 767.3 (163), comparative fit index (CFI) of 0.95, non-normed fit index (NNFI) or Tucker–Lewis coefficient (TLI) of 0.94, root mean square error of approximation (RMSEA) of 0.07, and standardized root mean square residual (SRMR) of 0.08. After eliminating reverse-worded items which have been documented to be problematic in Asian cultures, including Thailand, by Wong, Rindfleisch, and Burroughs [78] and items with low factor loadings, the remaining items significantly loaded into their designated constructs, which indicates convergent validity [79]. With composite reliabilities (CR) greater than 0.6 and average variance extracted (AVE) greater than 0.5, all scales provide evidence for construct reliabilities [77,80]. Moreover, Table 4 reports the square roots of AVEs along with correlations between the constructs in the study. With the square roots of AVEs greater than the corresponding correlations, the scales possess discriminant validity [80].
4.2. Hypothesis Testing
The first hypothesis postulates perceived value as a higher-order construct which constitutes four first-order constructs of functional value, emotional value, monetary value, and social values. From our confirmatory factor analysis (CFA) results presented in Table 3, perceived values are significantly reflected by functional value (γ31 = 0.72, p < 0.00), emotional value (γ41 = 0.74, p < 0.00), monetary value (γ51 = 0.95, p < 0.00), and social value (γ61 = 0.65, p < 0.00). Table 4 also indicates strong and significant correlations between each of these four first-order constructs and the second-order construct of perceived value with large effect sizes between 0.67 and 0.85. These parameter estimates (γ31, γ41, γ51, and γ61) are also significant in the structural models of the full sample and across the four sub-groups of consumer cohorts (see Table 5). Hence, the first hypothesis is supported.
To test hypotheses 2-4, we used structural equation modeling to estimate the parameters based on the hypothesized model. The model provided a good fit of data and yielded significant χ2 of 778.44 (164), CFI of 0.95, NNFI or TLI of 0.94, RMSEA of 0.07, and SRMR of 0.08 [77]. Table 5 presents the results of hypotheses 2–5. The second hypothesis proposes that technological self-efficacy has a positive impact on perceived value. This hypothesis is supported since the direct effect of technological self-efficacy on perceived value (full sample) is positive and significant (γ11 = 0.44, p < 0.05). Hypothesis 3, which indicates a positive influence of technological self-efficacy on m-payment intention, is also supported since the parameter estimate in the full sample is positive and significant (γ21 = 0.16, p < 0.01). Hypothesis 4 expects that perceived value would positively influence m-payment intention. From the results of the full sample, we gained support for this hypothesis because the path estimate is positive and significant (β21 = 0.59, p < 0.01).
Our last hypothesis postulates that the proposed relationships in the model are moderated by consumer cohorts, which refer to the four active generations of consumers (i.e., Gen B, Gen X, Gen Y, and Gen Z) at present. Thus, multiple-group structural equation modeling was employed to test this hypothesis and resulted in a good fit (χ2 = 2666.19 (840), CFI = 0.93, NNFI or TLI of 0.92, RMSEA of 0.04, and SRMR of 0.10) [77]. To compare across groups, the unstandardized parameter estimates are used since the standardized parameter estimates are adjusted by within-group variances [81]. From the results reported in Table 5, most hypothesized paths are significant with the results consistent with the four hypotheses across four generations except for the direct path between technological self-efficacy and m-payment intention (γ21), which is only significant and positive in Gen Y (γ21 = 0.20, p < 0.05) and Gen Z (γ21 = 0.05, p < 0.05), but not in Gen B (γ21 = 0.05, p > 0.10) and Gen X (γ21 = 0.11, p > 0.10). The relationship between technological self-efficacy and perceived value (γ11) is positive and significant across four groups (Gen B γ11= 0.36, p < 0.05; Gen X γ11 = 0. 35, p < 0.05; Gen Y γ11 = 0. 38, p < 0.05; Gen Z γ11 = 0. 23, p < 0.05). The relationship between perceived value and m-payment intention is positive and significant across four groups (Gen B β21 = 0.89, p < 0.05; Gen X β21 = 0. 91, p < 0.01; Gen Y β21 = 0.57, p < 0.01; Gen Z β21 = 0. 54, p < 0.05). Nonetheless, the indirect relationship (γ11 * β21) between technological self-efficacy and m-payment intentions through perceived value is positive and significant across the four groups (Gen B = 0.29, p < 0.01; Gen X = 0.31, p < 0.01; Gen Y = 0.21, p < 0.01; and Gen Z = 0.13, p < 0.05). These results indicate that the relationship between technological self-efficacy and m-payment intention only exists with the presence of perceived value in the older cohorts (i.e., Gen B and Gen X consumers). Therefore, the findings provide sufficient evidence to support hypothesis 5 since there are differences across generations as perceived value ‘fully’ mediates the relationship between technological self-efficacy and m-payment intention among Gen B and Gen X consumers while it ‘partially mediates’ such a relationship in the younger cohorts of Gen Y and Z. Accordingly, a summary of the hypothesis results is provided in Table 6.
5. Discussion and Conclusions
5.1. Theoretical Contributions
This study is among the first to conceptualize and empirically operationalize ‘perceived values’ as a second-order construct constituting functional, emotional, monetary, and social values, cf. [45]. Moreover, we also advanced existing theories by applying SCT to investigate how technological self-efficacy and perceived values affect m-payment intention and compared such relationships across four major consumer cohorts (i.e., Gen B, Gen X, Gen Y, and Gen Z) who represent the active groups of consumers globally [36,42,45,46]. Nevertheless, when investing in the same model for each generation, variation emerges. Notably, in Gen Z, the significance of the relationship between technological self-efficacy and perceived value diminishes, given their status as digital natives with unquestionable proficiency in technology [70,82]. This underscores the overshadowing effect of innate tech-savviness in Gen Z, making the emphasis on technological self-efficacy more pronounced, particularly in Gen B, X, and Y.
However, the effects of technological self-efficacy on m-payment intention can be explained in two distinct groups. For Gen B and X, the enhancement of their digital literacy does not directly influence their intentions to use m-payment. This suggests that factors beyond individual technological self-efficacy play a more prominent role in shaping their intention toward m-payment usage. On the other hand, for Gen Y and Z, considered younger generations in the context of technology adoption and sharing similar characteristics [68], their technological ability can directly impact their intention to use m-payment. This sense of confidence in using technology plays a crucial role in shaping their willingness to adopt m-payment.
Based on the aforementioned findings, our results further provide evidence of a ‘full mediation effect’ of perceived values on technological self-efficacy and m-payment relationship among the older cohorts (i.e., Gen B and Gen X consumers). This full mediating role provides insights that extend our theoretical understanding of the phenomenon. Specifically, for older consumers (i.e., Gen B and X), the feeling that they are able to navigate through new technology (as captured by technological self-efficacy) alone is insufficient for enhancing their usage intention. For them, realizing the comprehensive values (as conceptualized by the higher-order construct of perceived values) inherent in the innovative method is the main trigger that drives their usage intention. This aligns with their practical and realistic tendencies, emphasizing sensible considerations [21,23].
The partially mediating effects of ‘perceived values’ among the younger cohorts (Gen Y and Gen Z) in Thailand also provide insights that advance our theoretical understanding by pinpointing that there are dual paths toward the intention to use m-payments among these cohorts. Specifically, Gen Y and Z consumers are likely to use m-payment when they realize the value of using it as well as when they feel that they have the ability to use it. These results, which group generations based on their responses in the context of digital payment, are consistent with previous studies, where Gen B and X form one group [65], and Gen Y and Z constitute another [66]. This underscores the consideration of distinct treatment for various generations, whether individually or as groups, in addressing the digital payment context. Overall, our study has extended SCT by illustrating how an individual’s belief about one’s ability can directly and indirectly (i.e., through perception) affect behavioral intention. This study also demonstrates that such relationships are contingent upon consumers’ generations.
5.2. Practical Implications
Our study provides several implications for marketers, especially retailers operating in today’s digitalized business platforms. Firstly, educating target customers about innovative technology, such as m-payment, and ensuring their competence in using it is crucial. However, this approach may be more beneficial for all generations except Gen Z, given their higher comfort level with technology compared to other generations. Secondly, emphasizing the values provided by the innovations is essential, with technological advantages being particularly crucial for older generations (Gen B and X) in contrast to younger ones (Gen Y and Z). Implementing strategies to communicate and disseminate the technological benefits of new technology is highly recommended. Thirdly, customizing focus for different target markets classified by generation is vital. Our findings indicate that feelings of technological competence do not always lead to usage intention with younger generations (Gen Y and Z), who are likely to use m-payment regardless of perceived values. In contrast, older generations (Gen B and X) are driven by integrative perceived value (i.e., functional, emotional, monetary, and social), emphasizing the importance of competence in using m-payment. Retailers can promote m-payment usage across customer cohorts by tailoring strategies based on distinct value such as emphasizing the functional benefits for Gen B and X effectively.
6. Limitations and Future Research
We acknowledge several limitations of our study. First, the results may be limited in generalizability due to a one-country sampling context. Therefore, future research may incorporate multi-country studies to confirm the results. Second, using snowball sampling with online surveys may lead to self-selection bias which may also limit the generalizability of the findings. However, we employed multi-stage sampling by implementing quotas to ensure that the samples closely resembled our target population. Third, the use of behavioral intention (i.e., m-payment intention) may not fully represent actual behavior. Therefore, future research may integrate secondary data that measure actual behavior into the study. Last, other constructs that may influence m-payment intention and actual behavior can be included in further study.
Author Contributions
Conceptualization, A.T. and L.S.; methodology, A.T. and L.S.; formal analysis, A.T.; writing—original draft preparation, A.T. and L.S.; writing—review and editing, A.T.; funding acquisition, A.T. and L.S.; project administration, L.S. All authors have read and agreed to the published version of the manuscript.
Funding
This research received no external funding.
Institutional Review Board Statement
This study is approved by Assumption University Institutional Review Board, certification number 4/2020.
Informed Consent Statement
Not applicable.
Data Availability Statement
Data is contained within the article.
Conflicts of Interest
The authors declare no conflicts of interest.
References
- de Luna, I.R.; Liébana-Cabanillas, F.; Sánchez-Fernández, J.; Muñoz-Leiva, F. Mobile Payment Is Not All the Same: The Adoption of Mobile Payment Systems Depending on the Technology Applied. Technol. Forecast. Soc. 2019, 146, 931–944. [Google Scholar] [CrossRef]
- Dahlberg, T.; Guo, J.; Ondrus, J. A Critical Review of Mobile Payment Research. Electron. Commer. Res. Appl. 2015, 14, 265–284. [Google Scholar] [CrossRef]
- Shin, S.; Lee, W.-J. The Effects of Technology Readiness and Technology Acceptance on Nfc Mobile Payment Services in Korea. J. Appl. Bus. Res. 2014, 30, 1615–1626. [Google Scholar] [CrossRef]
- Yan, L.-Y.; Tan, G.W.-H.; Loh, X.-M.; Hew, J.-J.; Ooi, K.-B. Qr Code and Mobile Payment: The Disruptive Forces in Retail. J. Retail. Consum. Serv. 2021, 58, 102300. [Google Scholar] [CrossRef]
- Euromonitor International. Digital Consumer: Euromonitor from Trade Sources/National Statistics. Available online: https://www-portal-euromonitor-com.ejournal.mahidol.ac.th/statisticsevolution/index (accessed on 7 February 2023).
- Leong, L.-Y.; Hew, J.-J.; Wong, L.-W.; Lin, B. The Past and Beyond of Mobile Payment Research: A Development of the Mobile Payment Framework. Internet Res. 2022, 32, 1757–1782. [Google Scholar] [CrossRef]
- We Are Social. Digital 2023 Global Overview Report. 2023. Available online: https://wearesocial.com/uk/blog/2023/01/the-changing-world-of-digital-in-2023/ (accessed on 11 February 2023).
- Leong, C.-M.; Tan, K.-L.; Puah, C.-H.; Chong, S.-M. Predicting Mobile Network Operators Users M-Payment Intention. Eur. Bus. Rev. 2021, 33, 104–126. [Google Scholar] [CrossRef]
- Johnson, V.L.; Kiser, A.; Washington, R.; Torres, R. Limitations to the Rapid Adoption of M-Payment Services: Understanding the Impact of Privacy Risk on M-Payment Services. Comput. Hum. Behav. 2018, 79, 111–122. [Google Scholar] [CrossRef]
- Phonthanukitithaworn, C.; Sellitto, C.; Fong, M.W.L. An Investigation of Mobile Payment (M-Payment) Services in Thailand. Asia-Pac. J. Bus. Adm. 2016, 8, 37–54. [Google Scholar] [CrossRef]
- Hajek, P.; Abedin, M.Z.; Sivarajah, U. Fraud Detection in Mobile Payment Systems Using an Xgboost-Based Framework. Inf. Syst. Front. 2022, 25, 1985–2003. [Google Scholar] [CrossRef]
- Liébana-Cabanillas, F.; Singh, N.; Kalinic, Z.; Carvajal-Trujillo, E. Examining the Determinants of Continuance Intention to Use and the Moderating Effect of the Gender and Age of Users of Nfc Mobile Payments: A Multi-Analytical Approach. Inf. Technol. Manag. 2021, 22, 133–161. [Google Scholar] [CrossRef]
- Singh, A.K.; Sharma, P. A Study of Indian Gen X and Millennials Consumers’ Intention to Use Fintech Payment Services During COVID-19 Pandemic. J. Model. Manag. 2022, 18, 1177–1203. [Google Scholar] [CrossRef]
- Zhu, G.; Sangwan, S.; Lu, T.J. A New Theoretical Framework of Technology Acceptance and Empirical Investigation on Self-Efficacy-Based Value Adoption Model. Nankai Bus. Rev. Int. 2010, 1, 345–372. [Google Scholar] [CrossRef]
- Bank of Thailand. Payment Systems Report 2021: Thai Payments and the Next Step into the Digital World; Bank of Thailand: Bangkok, Thailand, 2021. [Google Scholar]
- Kaitawarn, C. Factor Influencing the Acceptance and Use of M-Payment in Thailand: A Case Study of Ais Mpay Rabbit. Rev. Integr. Bus. Econ. Res. 2015, 4, 222–230. [Google Scholar]
- Phonthanukitithaworn, C.; Sellitto, C.; Fong, M.W.A. Comparative Study of Current and Potential Users of Mobile Payment Services. Sage Open 2016, 6, 2158244016675397. [Google Scholar] [CrossRef]
- Chaveesuk, S.; Wutthirong, P.; Chaiyasoonthorn, W. The Model of Mobile Payment System Acceptance on Social Networks in Thailand: A Conceptual Framework. In Proceedings of the 2018 10th International Conference on Information Management and Engineering, Salford, UK, 22–24 September 2018; pp. 35–39. [Google Scholar] [CrossRef]
- Zhu, B.; Charoennan, W.; Embalzado, H. The Influence of Perceived Risks on Millennials’ Intention to Use M-Payment for Mobile Shopping in Bangkok. Int. J. Retail Distrib. Manag. 2022, 50, 479–497. [Google Scholar] [CrossRef]
- Mintel. Digital Lifestyles–Thai Consumer–2022. 2022. Available online: https://clients-mintel-com.ejournal.mahidol.ac.th/report/digital-lifestyles-thai-consumer-2022?fromSearch=%3Ffreetext%3Decommerce%2520thailand%26resultPosition%3D10 (accessed on 6 December 2022).
- Chaney, D.; Touzani, M.; Ben Slimane, K. Marketing to the (New) Generations: Summary and Perspectives. J. Strateg. Mark. 2017, 25, 179–189. [Google Scholar] [CrossRef]
- Lissitsa, S.; Laor, T. Baby Boomers, Generation X and Generation Y: Identifying Generational Differences in Effects of Personality Traits in on-Demand Radio Use. Technol. Soc. 2021, 64, 101526. [Google Scholar] [CrossRef]
- Meriac, J.P.; Woehr, D.J.; Banister, C. Generational Differences in Work Ethic: An Examination of Measurement Equivalence across Three Cohorts. J. Bus. Psychol. 2010, 25, 315–324. [Google Scholar] [CrossRef]
- Agárdi, I.; Alt, M.A. Do Digital Natives Use Mobile Payment Differently Than Digital Immigrants? A Comparative Study between Generation X and Z. Electron. Commer. Res. 2022, 1–28. [Google Scholar] [CrossRef]
- Ajzen, I.; Fishbein, M. Understanding Attitudes and Predicting Social Behavior; Prentice-Hall: Saddle River, NJ, USA, 1980. [Google Scholar]
- Ajzen, I. The Theory of Planned Behavior. Organ. Behav. Hum. Decis. Process. 1991, 50, 179–211. [Google Scholar] [CrossRef]
- Davis, F.D. Perceived Usefulness, Perceived Ease of Use, and User Acceptance of Information Technology. MIS Q. 1989, 13, 319–340. [Google Scholar] [CrossRef]
- Venkatesh, V.; Morris, M.G.; Davis, G.B.; Davis, F.D. User Acceptance of Information Technology: Toward a Unified View. MIS Q. 2003, 27, 425–478. [Google Scholar] [CrossRef]
- Bandura, A. Social Foundations of Thought and Action: A Social Cognitive Theory; Prentice-Hall: Saddle River, NJ, USA, 1986. [Google Scholar]
- Bandura, A. Self-Efficacy Mechanism in Psychobiologic Functioning. In Self-Efficacy: Thought Control of Action; Schwarzer, R., Ed.; Taylor & Francis Group: New York, NY, USA, 1992; Volume 2, pp. 355–395. [Google Scholar]
- Maddux, J.E.; Gosselin, J.T. Self-Efficacy. In Handbook of Self and Identity, 2nd ed.; Leary, M.R., Tangney, J.P., Eds.; The Guilford Press: New York, NY, USA, 2003; pp. 218–238. [Google Scholar]
- Luszczynska, A.; Schwarzer, R. Social Cognitive Theory. In Predicting Health Behaviour: Research and Practice with Social Cognition Models; Conner, M., Norman, P., Eds.; Open University Press: New York, NY, USA, 2005; Volume 2, pp. 127–169. [Google Scholar]
- Bandura, A. Self-Efficacy: Toward a Unifying Theory of Behavioral Change. Psychol. Rev. 1977, 84, 191–215. [Google Scholar] [CrossRef]
- Bandura, A. Social Cognitive Theory: An Agentic Perspective. Asian J. Soc. Psychol. 1999, 2, 21–41. [Google Scholar] [CrossRef]
- Maddux, J.E. Self-Efficacy. In Handbook of Social and Clinical Psychology: The Health Perspective; Snyder, C.R., Donelson, R.F., Eds.; Pergamon Press: Tarrytown, NY, USA, 1991; pp. 57–78. [Google Scholar]
- Bandura, A. Social Cognitive Theory of Self-Regulation. Organ. Behav. Hum. Decis. Process. 1991, 50, 248–287. [Google Scholar] [CrossRef]
- Bandura, A.; Adams, N.E. Analysis of Self-Efficacy Theory of Behavioral Change. Cogn. Ther. Res. 1977, 1, 287–310. [Google Scholar] [CrossRef]
- Ariff, M.S.M.; Yeow, S.; Zakuan, N.; Jusoh, A.; Bahari, A.Z. The Effects of Computer Self-Efficacy and Technology Acceptance Model on Behavioral Intention in Internet Banking Systems. Procedia Soc. Behav. Sci. 2012, 57, 448–452. [Google Scholar] [CrossRef]
- Lin, H.-F. Understanding Behavioral Intention to Participate in Virtual Communities. Cyberpsychol. Behav. 2006, 9, 540–547. [Google Scholar] [CrossRef]
- Lew, S.; Tan, G.W.-H.; Loh, X.-M.; Hew, J.-J.; Ooi, K.-B. The Disruptive Mobile Wallet in the Hospitality Industry: An Extended Mobile Technology Acceptance Model. Technol. Soc. 2020, 63, 101430. [Google Scholar] [CrossRef]
- Holden, H.; Rada, R. Understanding the Influence of Perceived Usability and Technology Self-Efficacy on Teachers’ Technology Acceptance. J. Res. Technol. Educ. 2011, 43, 343–367. [Google Scholar] [CrossRef]
- Tao, D.; Shao, F.; Wang, H.; Yan, M.; Qu, X. Integrating Usability and Social Cognitive Theories with the Technology Acceptance Model to Understand Young Users’ Acceptance of a Health Information Portal. J. Health Inform. 2020, 26, 1347–1362. [Google Scholar] [CrossRef]
- Hong, J.-C.; Lin, P.-H.; Hsieh, P.-C. The Effect of Consumer Innovativeness on Perceived Value and Continuance Intention to Use Smartwatch. Comput. Hum. Behav. 2017, 67, 264–272. [Google Scholar] [CrossRef]
- Zhang, X.; Han, X.; Dang, Y.; Meng, F.; Guo, X.; Lin, J. User Acceptance of Mobile Health Services from Users’ Perspectives: The Role of Self-Efficacy and Response-Efficacy in Technology Acceptance. Inform. Health. Soc. Care. 2017, 42, 194–206. [Google Scholar] [CrossRef]
- Zhu, G.; So, K.K.F.; Hudson, S. Inside the Sharing Economy: Understanding Consumer Motivations Behind the Adoption of Mobile Applications. Int. J. Contemp. Hosp. Manag. 2017, 29, 2218–2239. [Google Scholar] [CrossRef]
- Cao, J.; Li, J.; Wang, Y.; Ai, M. The Impact of Self-Efficacy and Perceived Value on Customer Engagement under Live Streaming Commerce Environment. Secur. Commun. Netw. 2022, 2022, 2904447. [Google Scholar] [CrossRef]
- Zeithaml, V.A. Consumer Perceptions of Price, Quality, and Value: A Means-End Model and Synthesis of Evidence. J. Mark. 1988, 52, 2–22. [Google Scholar] [CrossRef]
- Kim, Y.; Park, Y.; Choi, J. A Study on the Adoption of Iot Smart Home Service: Using Value-Based Adoption Model. Total Qual. Manag. Bus. 2017, 28, 1149–1165. [Google Scholar] [CrossRef]
- Lin, C.H.; Sher, P.J.; Shih, H.Y. Past Progress and Future Directions in Conceptualizing Customer Perceived Value. Int. J. Serv. Ind. Manag. 2005, 16, 318–336. [Google Scholar] [CrossRef]
- Hernandez-Ortega, B.; Aldas-Manzano, J.; Ruiz-Mafe, C.; Sanz-Blas, S. Perceived Value of Advanced Mobile Messaging Services: A Cross-Cultural Comparison of Greek and Spanish Users. Inf. Technol. People 2017, 30, 324–355. [Google Scholar] [CrossRef]
- Sheth, J.N.; Newman, B.I.; Gross, B.L. Why We Buy What We Buy: A Theory of Consumption Values. J. Bus. Res. 1991, 22, 159–170. [Google Scholar] [CrossRef]
- Sweeney, J.C.; Soutar, G.N. Consumer Perceived Value: The Development of a Multiple Item Scale. J. Retail. 2001, 77, 203–220. [Google Scholar] [CrossRef]
- Rintamäki, T.; Kirves, K. From Perceptions to Propositions: Profiling Customer Value across Retail Contexts. J. Retail. Consum. Serv. 2017, 37, 159–167. [Google Scholar] [CrossRef]
- Watanabe, E.A.d.M.; Alfinito, S.; Curvelo, I.C.G.; Hamza, K.M. Perceived Value, Trust and Purchase Intention of Organic Food: A Study with Brazilian Consumers. Br. Food. J. 2020, 122, 1070–1184. [Google Scholar] [CrossRef]
- Zhang, Q.; Ariffin, S.K.; Richardson, C.; Wang, Y. Influencing Factors of Customer Loyalty in Mobile Payment: A Consumption Value Perspective and the Role of Alternative Attractiveness. J. Retail. Consum. Serv. 2023, 73, 103302. [Google Scholar] [CrossRef]
- Zhong, J.; Chen, T. Antecedents of Mobile Payment Loyalty: An Extended Perspective of Perceived Value and Information System Success Model. J. Retail. Consum. Serv. 2023, 72, 103267. [Google Scholar] [CrossRef]
- Jameel, A.S.; Karem, M.A. Perceived Trust and Enjoyment: Predicting Behavioural Intention to Use Mobile Payment Systems. In Proceedings of the 2022 International Conference on Intelligent Technology, System and Service for Internet of Everything (ITSS-IoE), Hadhramaut, Yemen, 3–5 December 2022; pp. 1–6. [Google Scholar] [CrossRef]
- Boateng, H.; Adam, D.R.; Okoe, A.F.; Anning-Dorson, T. Assessing the Determinants of Internet Banking Adoption Intentions: A Social Cognitive Theory Perspective. Comput. Hum. Behav. 2016, 65, 468–478. [Google Scholar] [CrossRef]
- Liu, T.-L.; Lin, T.T.; Hsu, S.-Y. Continuance Usage Intention toward E-Payment During the COVID-19 Pandemic from the Financial Sustainable Development Perspective Using Perceived Usefulness and Electronic Word of Mouth as Mediators. Sustainability 2022, 14, 7775. [Google Scholar] [CrossRef]
- Saprikis, V.; Avlogiaris, G.; Katarachia, A. A Comparative Study of Users Versus Non-Users’ Behavioral Intention Towards M-Banking Apps’ Adoption. Information 2022, 13, 30. [Google Scholar] [CrossRef]
- Anastasiei, B.; Dospinescu, N.; Dospinescu, O. Word-of-Mouth Engagement in Online Social Networks: Influence of Network Centrality and Density. Electronics 2023, 12, 2857. [Google Scholar] [CrossRef]
- Bilal, M.; Jianqiu, Z.; Dukhaykh, S.; Fan, M.; Trunk, A. Understanding the Effects of Ewom Antecedents on Online Purchase Intention in China. Information 2021, 12, 192. [Google Scholar] [CrossRef]
- Davis, F.D.; Bagozzi, R.P.; Warshaw, P.R. User Acceptance of Computer Technology: A Comparison of Two Theoretical Models. Manag. Sci. 1989, 35, 982–1003. [Google Scholar] [CrossRef]
- Upadhyay, N.; Upadhyay, S.; Abed, S.S.; Dwivedi, Y.K. Consumer Adoption of Mobile Payment Services during COVID-19: Extending Meta-Utaut with Perceived Severity and Self-Efficacy. Int. J. Bank Mark. 2022, 40, 960–991. [Google Scholar] [CrossRef]
- Kim, S.; Jang, S.; Choi, W.; Youn, C.; Lee, Y. Contactless Service Encounters among Millennials and Generation Z: The Effects of Millennials and Gen Z Characteristics on Technology Self-Efficacy and Preference for Contactless Service. J. Res. Interact. Mark. 2021, 16, 82–100. [Google Scholar] [CrossRef]
- Santosa, A.D.; Taufik, N.; Prabowo, F.H.E.; Rahmawati, M. Continuance Intention of Baby Boomer and X Generation as New Users of Digital Payment during COVID-19 Pandemic Using Utaut2. J. Financ. Serv. Mark. 2021, 26, 259–273. [Google Scholar] [CrossRef]
- Cheung, M.L.; Leung, W.K.S.; Chan, H. Driving Healthcare Wearable Technology Adoption for Generation Z Consumers in Hong Kong. Young Consum. 2021, 22, 10–27. [Google Scholar] [CrossRef]
- Nguyen Ngoc, T.; Viet Dung, M.; Rowley, C.; Pejić Bach, M. Generation Z Job Seekers’ Expectations and Their Job Pursuit Intention: Evidence from Transition and Emerging Economy. Int. J. Eng. Bus. Manag. 2022, 14, 18479790221112548. [Google Scholar] [CrossRef]
- Marton, Z.; Ernszt, I.; Rodek, N.; Máhr, T. Change in Responsible Consumer Behaviour through Generations? ENTRENOVA-Enterp. Res. Innov. 2019, 5, 393–401. [Google Scholar] [CrossRef]
- Klopotan, I.; Aleksić, A.; Vinković, N. Do business ethics and ethical decision making still matter: Perspective of different generational cohorts. Bus. Syst. Res. J. 2020, 11, 31–43. [Google Scholar] [CrossRef]
- Reynolds, N.L.; Simintiras, A.C.; Diamantopoulos, A. Theoretical Justification of Sampling Choices in International Marketing Research: Key Issues and Guidelines for Researchers. J. Int. Bus. Stud. 2003, 34, 80–89. [Google Scholar] [CrossRef]
- Venkatesh, V.; Thong, J.Y.L.; Xu, X. Consumer Acceptance and Use of Information Technology: Extending the Unified Theory of Acceptance and Use of Technology. MIS Q. 2012, 36, 157–178. [Google Scholar] [CrossRef]
- Compeau, D.R.; Higgins, C.A. Computer Self-Efficacy: Development of a Measure and Initial Test. MIS Q. 1995, 19, 189–211. [Google Scholar] [CrossRef]
- Mainardes, E.W.; de Almeida, C.M.; de-Oliveira, M. E-Commerce: An Analysis of the Factors That Antecede Purchase Intentions in an Emerging Market. J. Int. Consum. Mark. 2019, 31, 447–468. [Google Scholar] [CrossRef]
- Podsakoff, P.M.; MacKenzie, S.B.; Lee, J.-Y.; Podsakoff, N.P. Common Method Biases in Behavioral Research: A Critical Review of the Literature and Recommended Remedies. J. Appl. Psychol. 2003, 88, 879–903. [Google Scholar] [CrossRef] [PubMed]
- Behling, O.; Law, K.S. Translating Questionnaires and Other Research Instruments; Sage Publications, Inc.: Thousand Oaks, CA, USA, 2000. [Google Scholar]
- Bagozzi, R.; Yi, Y. Specification, Evaluation, and Interpretation of Structural Equation Models. J. Acad. Mark. Sci. Rev. 2012, 40, 8–34. [Google Scholar] [CrossRef]
- Wong, N.; Rindfleisch, A.; Burroughs, J.E. Do Reverse-Worded Items Confound Measures in Cross-Cultural Consumer Research? The Case of the Material Values Scale. J. Consum. Res. 2003, 30, 72–91. [Google Scholar] [CrossRef]
- Diamantopoulos, A.; Siguaw, J.A. Introducing Lisrel; SAGE: Newcastle upon Tyne, UK, 2000. [Google Scholar]
- Fornell, C.; Larcker, D.F. Evaluating Structural Equation Models with Unobservable Variables and Measurement Error. J. Mark. Res. 1981, 18, 39–50. [Google Scholar] [CrossRef]
- Singh, J. Measurement Issues in Cross-National Research. J. Int. Bus. Stud. 1995, 26, 597–619. [Google Scholar] [CrossRef]
- Francis, T.; Hoefel, F. The Influence of Gen Z—The First Generation of True Digital Natives—Is Expanding. 2018. Available online: https://www.mckinsey.com/industries/consumer-packaged-goods/our-insights/true-gen-generation-z-and-its-implications-for-companies#/ (accessed on 23 April 2023).
Figure 1.
Research model.


Table 1.
Components of perceived value.
| Functional | Emotional | Social | Monetary | Others | |
|---|---|---|---|---|---|
| Sheth, Newman, and Gross [51] | ✕ | ✕ | ✕ | Condition Epistemic | |
| Sweeney and Soutar [52] | ✕ | ✕ | ✕ | ✕ | |
| Zhu, Sangwan, and Lu [14]; Zhu, So, and Hudson [45] | ✕ | ✕ | ✕ | ||
| Hernandez-Ortega, Aldas-Manzano, Ruiz-Mafe, and Sanz-Blas [50] | ✕ | ✕ | ✕ | ✕ | |
| Rintamäki and Kirves [53] | ✕ | ✕ | ✕ | ✕ | |
| Watanabe, Alfinito, Curvelo, and Hamza [54] | ✕ | ✕ | ✕ | ✕ | |
| Zhang, Ariffin, Richardson, and Wang [55] | ✕ | ✕ | ✕ | ✕ | Epistemic |
| Zhong and Chen [56] | ✕ | ✕ | ✕ |
(Source: Composed by authors).
Table 2.
Measurements and reliability scores.
| Characteristics | Total (n = 716) | Gen B (n = 143) | Gen X (n = 163) | Gen Y (n = 203) | Gen Z (n = 207) |
|---|---|---|---|---|---|
| Gender | |||||
| Male | 332 (46.4%) | 73 (51.1%) | 73 (44.8%) | 96 (47.3%) | 90 (43.5%) |
| Female | 377 (52.7%) | 70 (49%) | 90 (55.2%) | 102 (50.2%) | 115 (55.6%) |
| Prefer not to say | 7 (0.9%) | - | - | 5 (2.5%) | 2 (1%) |
| Age (years) | |||||
| Mean | 36.5 | 59.6 | 46.7 | 27.4 | 21.4 |
| S.D. | 15.2 | 3.7 | 4.7 | 3.9 | 1.7 |
| Monthly income (THB) | |||||
| <15,000 | 191 (26.7%) | 31 (21.7%) | 11 (6.7%) | 34 (16.7%) | 115 (55.6%) |
| 15,001–30,000 | 231 (32.3%) | 19 (13.3%) | 46 (28.2%) | 87 (42.9%) | 79 (38.2%) |
| 30,001–45,000 | 91 (12.7%) | 30 (21%) | 20 (12.3%) | 34 (16.7%) | 7 (3.4%) |
| >45,000 | 203 (28.3%) | 63 (44%) | 86 (52.7%) | 48 (23.6%) | 6 (2.8%) |
| Highest Education | |||||
| Below undergraduate | 158 (22.1%) | 56 (39.2%) | 51 (31.3%) | 17 (8.4%) | 34 (16.4%) |
| Bachelor degree | 463 (64.6%) | 60 (41.9%) | 81 (49.7%) | 152 (74.9%) | 170 (82.1%) |
| Post bachelor degree | 95 (13.3%) | 27 (18.9%) | 31 (19%) | 34 (16.7%) | 3 (1.4%) |
| Latest online shopping | |||||
| Today | 106 (14.8%) | 5 (3.5%) | 18 (11.0%) | 50 (24.6%) | 33 (15.9%) |
| Yesterday | 121 (16.9% | 8 (5.6%) | 23 (14.1%) | 42 (20.7%) | 48 (23.2%) |
| Within the past one week | 216 (30.2%) | 38 (26.6%) | 54 (33.1%) | 59 (29.1%) | 65 (31.4%) |
| Within the past one month | 155 (21.6%) | 38 (26.6%) | 40 (24.5%) | 34 (16.7%) | 43 (20.8%) |
| Within the past three months | 51 (7.1%) | 20 (14.0%) | 13 (8.0%) | 10 (4.9%) | 8 (3.9%) |
| Within the past six months | 27 (3.8%) | 10 (7.0%) | 8 (4.9%) | 3 (1.5%) | 6 (2.9%) |
| Within the past one year | 14 (2.0%) | 6 (4.2%) | 2 (1.2%) | 2 (1.0%) | 4 (1.9%) |
| More than one year ago | 26 (3.6%) | 18 (12.6%) | 5 (3.1%) | 3 (1.5%) | 0 (0%) |
Table 3.
Scale assessment and CFA results.
| Research Constructs and Items | Standardized Loadings a | Item-to-Total Correlation |
|---|---|---|
| 1. Perceived value (α = 0.80; CR = 0.91; AVE = 0.66) (Seven-point Likert scale, anchored “strongly disagree” and “strongly agree”) Source: Venkatesh, Thong, and Xu [72] | ||
| Functional value (α = 0.89; CR = 0.95; AVE = 0.86) | 0.72 b | |
| I find mobile payment useful in my daily life. | 0.88 b | 0.79 |
| Using mobile payment helps me accomplish payment quickly. | 0.85 (27.70) | 0.79 |
| Using mobile payment increases my payment productivity. | 0.89 (29.59) | 0.81 |
| Emotional value (α = 0.93; CR = 0.97; AVE = 0.90) | 0.74 (18.94) | |
| Using mobile payment is fun. | 0.81 b | 0.86 |
| Using mobile payment is enjoyable. | 0.91 (37.19) | 0.86 |
| Using mobile payment is very entertaining. | 0.91 (36.96) | 0.86 |
| Monetary value (α = 0.81; CR = 0.91; AVE = 0.84) | 0.95 (21.22) | |
| Using mobile payment is reasonably priced | 0.92 b | 0.68 |
| Using mobile payment is a good value for money. | 0.80 (22.72) | 0.68 |
| Social value (α = 0.90; CR = 0.94; AVE = 0.79) | 0.65 (16.06) | |
| The use of mobile payment helps me feel acceptable. | 0.86 b | 0.79 |
| The use of mobile payment makes a good impression on other people. | 0.87 (29.80) | 0.81 |
| The use of mobile payment gives me social approval | 0.86 (29.32) | 0.81 |
| 2. Technology self-efficacy (α = 0.96; CR = 0.97; AVE = 0.85) I could complete the tasks using online… (Seven-point scale anchored, “not at all confident” and “totally confident”) Source: Compeau and Higgins [73] | ||
| … if there was no one around to tell me what to do as I go.c | ||
| … if I had never used a platform like it before.c | ||
| … if I had only the instructions/manuals for reference.c | ||
| … if I had seen someone else using it before trying it myself. | 0.81 b | 0.79 |
| … if I could call someone for help if I got stuck. | 0.87 (28.21) | 0.85 |
| … if someone else had helped me get started. | 0.88 (28.77) | 0.85 |
| … if I had a lot of time to complete the task for which the platform was provided. | 0.89 (29.68) | 0.87 |
| … if I had just the build-in help facility for assistance. | 0.90 (30.19) | 0.88 |
| … if someone showed me how to do it first. | 0.86 (27.94) | 0.84 |
| … if I had used similar platform before this one to do the same task. | 0.86 (27.94) | 0.84 |
| 3. M-Payment Intention (α = 0.81; CR = 0.94; AVE = 0.97) (Seven-point Likert scale, anchored “strongly disagree” and “strongly agree”) Source: Mainardes, de Almeida, and de-Oliveira [74] | ||
| In the future, I intend to use mobile payment to make purchases. | 0.90 b | 0.68 |
| If I am in need of a product/service, I will use the mobile payment to make the purchase. | 0.89 (28.16) | 0.68 |
| In the near future, I do not intend to use the mobile payment to do my shopping.c | ||
a t-values are in parentheses. b Item fixed for model estimation. c Item excluded after validity and reliability check.
Table 4.
Discriminant validity, correlations, and descriptive statistics.
| 1 | 2 | 3 | 4 | 5 | 6 | 7 | |
|---|---|---|---|---|---|---|---|
| 1. Perceived value | 0.81 | ||||||
| 2. Functional Value | 0.67 * | 0.93 | |||||
| 3. Emotional Value | 0.84 * | 0.39 * | 0.95 | ||||
| 4. Monetary Value | 0.85 * | 0.59 * | 0.59 * | 0.92 | |||
| 5. Social Value | 0.79 * | 0.25 * | 0.61 * | 0.55 * | 0.89 | ||
| 6. M-payment Intention | 0.61 * | 0.60 * | 0.47 * | 0.53 * | 0.38 * | 0.97 | |
| 7. Technological Efficacy | 0.42 * | 0.51 * | 0.30 * | 0.43 * | 0.16 * | 0.45 * | 0.92 |
| Mean | 5.02 | 5.83 | 4.66 | 5.14 | 4.500 | 5.4 | 4.8 |
| SD | 1.13 | 1.24 | 1.58 | 1.30 | 1.6 | 1.4 | 1.4 |
Notes: Numbers along the diagonal represent the square root of the average variance extracted (AVE) of the constructs measured by multiple-item scales in this study. * if p < 0.001 (two-tailed).
Table 5.
Standardized and unstandardized parameter estimates (with standard errors) of multiple-group analyses.
Table 5.
Standardized and unstandardized parameter estimates (with standard errors) of multiple-group analyses.
| Paths | Full Sample (n = 716) | Gen B (n = 143) | Gen X (n = 163) | Gen Y (n = 203) | Gen Z (n = 207) |
|---|---|---|---|---|---|
| Perceived Value→Functional Value (γ31) | 0.63 0.73 ** (0.05) | 0.69 0.86 ** (0.12) | 0.72 0.91 ** (0.11) | 0.52 0.55 ** (0.09) | 0.43 0.45 ** (0.09) |
| Perceived Value→Emotional Value (γ41) | 0.76 1.05 ** (0.05) | 0.78 1.12 ** (0.12) | 0.77 1.08 ** (0.11) | 0.75 1.02 * (0.10) | 0.70 0.95 ** (0.11) |
| Perceived Value→Monetary Value (γ51) | 0.73 0.95 ** (0.05) | 0.72 0.94 ** (0.12) | 0.76 1.03 ** (0.08) | 0.72 0.93 ** (0.10) | 0.68 0.88 ** (0.10) |
| Perceived Value→Social Value (γ61) | 0.71 0.92 * (0.05) | 0.77 1.09 ** (0.13) | 0.78 1.11 ** (0.11) | 0.72 0.94 * (0.10) | 0.67 0.87 ** (0.11) |
| Direct Effect Technological Self-Efficacy→Perceived Value (γ11) | 0.44 0.36 * (0.04) | 0.42 0.36 * (0.11) | 0.45 0.35 * (0.08) | 0.42 0.38 * (0.09) | 0.27 0.23 * (0.12) |
| Technological Self-Efficacy→M-Payment Intention (γ21) | 0.16 0.16 ** (0.04) | 0.05 0.06 (0.11) | 0.11 0.11 (0.08) | 0.20 0.21 * (0.08) | 0.22 0.21 * (0.08) |
| Perceived Value→M-Payment Intention (β21) | 0.59 0.73 ** (0.05) | 0.69 0.89 * (0.13) | 0.69 0.91 ** (0.05) | 0.49 0.57 ** (0.09) | 0.47 0.54 * (0.10) |
| Indirect Effect Technological Self-Efficacy→Perceived Value→M-Payment Intention (γ11 * β21) | 0.26 0.27 * (0.04) | 0.29 0.32 ** (0.10) | 0.31 0.32 ** (0.07) | 0.21 0.22 ** (0.07) | 0.13 0.12 * (0.07) |
| Total Effect Technological Self-Efficacy→M-Payment Intention [γ21 + (γ11 * β21)] | 0.42 0.43 * (0.04) | 0.34 0.37 ** (0.12) | 0.42 0.44 * (0.08) | 0.41 0.42 * (0.08) | 0.35 0.33 ** (0.07) |
The number at the top refers to standardized parameter estimates used for within-group comparison. The second number with two-tailed significance levels highlighted (* if p < 0.05; ** if p < 0.01) are unstandardized parameter estimates used for between-group comparisons.
Table 6.
Summary of findings.
| Hypothesis | Results |
|---|---|
| H1. Functional value, emotional value, monetary value, and social value are salient dimensions of perceived value. | Supported |
| H2. Technological self-efficacy positively influences perceived value. | Supported |
| H3. Technological self-efficacy positively influences m-payment intention. | Supported |
| H4. Perceived value positively influences m-payment intention. | Supported |
| H5. The relationships among technological self-efficacy, perceived value, and m-payment differ across consumer cohorts. | Supported |
Disclaimer/Publisher’s Note: The statements, opinions and data contained in all publications are solely those of the individual author(s) and contributor(s) and not of MDPI and/or the editor(s). MDPI and/or the editor(s) disclaim responsibility for any injury to people or property resulting from any ideas, methods, instructions or products referred to in the content. |
© 2024 by the authors. Licensee MDPI, Basel, Switzerland. This article is an open access article distributed under the terms and conditions of the Creative Commons Attribution (CC BY) license (https://creativecommons.org/licenses/by/4.0/).
Share and Cite
MDPI and ACS Style
Thoumrungroje, A.; Suprawan, L. Investigating M-Payment Intention across Consumer Cohorts. J. Theor. Appl. Electron. Commer. Res. 2024, 19, 431-447. https://doi.org/10.3390/jtaer19010023
AMA Style
Thoumrungroje A, Suprawan L. Investigating M-Payment Intention across Consumer Cohorts. Journal of Theoretical and Applied Electronic Commerce Research. 2024; 19(1):431-447. https://doi.org/10.3390/jtaer19010023
Chicago/Turabian StyleThoumrungroje, Amonrat, and Lokweetpun Suprawan. 2024. "Investigating M-Payment Intention across Consumer Cohorts" Journal of Theoretical and Applied Electronic Commerce Research 19, no. 1: 431-447. https://doi.org/10.3390/jtaer19010023