
Tax Compliance in Slovenia: An Empirical Assessment of Tax Knowledge and Fairness Perception


1
Faculty of Economics and Business, University of Maribor, 2000 Maribor, Slovenia
2
Faculty of Economics and Business, University of Zagreb, 10000 Zagreb, Croatia
*
Author to whom correspondence should be addressed.
J. Risk Financial Manag. 2024, 17(3), 89; https://doi.org/10.3390/jrfm17030089
Submission received: 11 January 2024
/
Revised: 12 February 2024
/
Accepted: 15 February 2024
/
Published: 20 February 2024
(This article belongs to the Special Issue Sustainable Tax and Accounting Reporting in Building a New Tax Culture)
Abstract
:Complex tax systems can result in tax evasion, which further impacts the revenues necessary to achieve sustainable development goals. Enhancing taxpayer education, tax knowledge, and tax fairness perception is essential for boosting revenues to support societal sustainability. The aim of this study was to assess the levels of tax knowledge and tax fairness perception within the Slovene taxpayer population, with a specific focus on the differences related to gender and settlement size. Further, the connections between tax knowledge and various aspects of tax fairness were explored. The Kruskal–Wallis test was used to assess the statistical significance of gender and settlement size differences and the Kendall’s coefficient of rank to determine the association between the tax knowledge and fairness perception dimensions. The results provide evidence that highlights disparities in tax knowledge between male and female taxpayers (p-value = 0.0116). Additionally, this study demonstrates that settlement size does not significantly impact tax knowledge perception among Slovene taxpayers (p-value = 0.2067). However, tax fairness encompasses various dimensions, and our research reveals no disparities based on gender (p-value = 0.7263) or settlement size (p-value = 0.2786). When assessing the correlation between tax knowledge and tax fairness perception, the results indicate statistically significant but weak correlations in both directions, depending on the specific fairness dimension.
Keywords:
tax compliance; tax evasion; tax fairness; tax knowledge; gender; settlement size; Slovenia1. Introduction
Tax systems are complex and complicated, and taxpayers with limited or no prior tax knowledge may struggle to grasp their tax obligations. This can result in unintentional or intentional non-compliance (Carley et al. 2010), leading to the loss of entitled benefits and reduced state revenues, particularly affecting the most vulnerable in society. A valuable tool for helping raise the tax revenues necessary to achieve sustainable development goals is improving taxpayer education, their tax knowledge (OECD 2015, 2021), and the equality of the tax systems (OECD 2022). This approach aims to achieve higher tax compliance, involving the concept of “reciprocity”, which encompasses both the “public goods provided by the state” and the perception of fairness within the tax system (Saad 2010, 2014).
Tax education has been a key component of the OECD’s priorities (as indicated in the 2015 and 2021 surveys). To build a new tax culture centered on a “culture of tax compliance” means educating taxpayers to perceive tax payments as an integral part of their relationship with the government, built upon rights and responsibilities (OECD 2021). Tax education plays a critical role in promoting voluntary tax compliance, enhancing taxpayer understanding of the tax system, improving their perceptions of the tax system’s fairness, and building trust in tax authorities, leading to more effective compliance and enforcement (Mukhlis et al. 2015; Gunaasih 2022; Kumi and Kwasi 2023). Merely informing taxpayers about their tax obligations falls short (Moore 2019; Craig and Slemrod 2022). Therefore, new communication strategies via social networks and social media are becoming important (Juliobenedrick et al. 2023; Puklavec et al. 2023), even in raising tax compliance awareness.
The potential for a gap in public tax knowledge exists alongside the financial tax gap, which represents the disparity between budgeted and actual government tax revenues and is a substantial concern from a social justice standpoint and in the public interest (Edgley and Holland 2021). Increasing levels of financial and tax literacy could yield a dual benefit: not only would enhanced financial and tax literacy positively affect tax morale, but this impact might be amplified through the influence of fairness (Phyllis and Balavac-Orlic 2022). Higher education levels lead to increased tax knowledge (Kumi and Kwasi 2023; Gunaasih 2022; Fauziati et al. 2016; Saad 2014; Eriksen and Fallan 1996). Conversely, low levels of tax knowledge have been linked to negative attitudes toward tax payment (Inasius 2019a, 2019b; Ali and Ahmad 2014; Lewis 1982). Tax knowledge exhibits a positive correlation with tax compliance (Mukhlis et al. 2015). The level of knowledge is important in the way people comprehend the reality underlying taxation and the associated attitude toward taxation that is expressed (Eriksen and Fallan 1996). A solid understanding of taxation is essential for boosting tax awareness (Palil 2010) as higher tax knowledge leads to higher tax compliance and poor tax knowledge leads to higher tax non-compliance (Kirchler et al. 2008). Tax knowledge is important as it can significantly change attitudes toward the fairness of the tax system (Fallan 1999). Prior studies tend to focus on the effect of tax knowledge on the overall fairness of the tax system, even though there is evidence that fairness is a multi-dimensional construct of general, exchange, horizontal, vertical, retributive, personal, and administrative fairness (Saad 2010; Gilligan and Richardson 2005). The prevailing theory in the tax compliance literature suggests that taxpayers’ perceived fairness in the tax system enhances their trust in the government, exerting a positive influence on compliance (Jimenez and Iyer 2016). If taxpayers perceive fairness and equity in taxation, they tend to be more compliant; conversely, when they believe they do not receive any benefits, they are more inclined to engage in tax evasion (Amin et al. 2022). Perceptions of the tax fairness dimensions might vary between countries (Saad 2012). Tax education positively impacts tax knowledge, which, in turn, influences tax fairness positively, and this significantly contributes to tax compliance (Mukhlis et al. 2013, 2015). Insufficient tax knowledge (Inasius 2019a, 2019b) stands as a significant challenge for numerous tax authorities, knowing that taxpayer education is linked to local economic, social, and cultural realities. There are many factors linked to tax knowledge and the perception of tax fairness. Although authors highlight economic, psychological, and socio-demographic factors in tax compliance, research on the gender and settlement size impact on taxpayers’ tax knowledge and tax fairness perception is limited (Saad 2010, 2012; Mohamad et al. 2013). Gender differences are driven by various mechanisms, including income disparities, occupational disparities, family responsibilities, tax knowledge and financial literacy, legal and regulatory factors, risk aversion, enforcement and penalties, social and cultural norms, and access to resources (Coelho et al. 2022). Fallan (1999) identified a higher level of tax literacy among males, while Formanova et al. (2021) could not find a gender effect on the level of tax literacy. The results are mixed and country-specific. Besides gender differences, Williams (2020) argues that on the European level, taxpayers in villages and rural areas are more likely to be non-compliant. Altering the tolerance for tax non-compliance can be achieved through educational efforts and awareness-raising campaigns.
Each country possesses distinctive cultural, social, economic, and legal characteristics (Singh et al. 2023); it is expected that these contexts shape taxpayers’ perceptions, behaviors, and tax compliance differently by geographic area. Citizens in the EU and OECD countries possess some of the highest education levels globally (Dayioğlu Erul 2020). Therefore, they may use their advanced education and knowledge to exploit legal loopholes for non-compliance. Alternatively, they might choose to relocate their investments to countries with lower tax rates or less stringent audits, using their knowledge as a strategic advantage instead of emphasizing greater compliance (Dayioğlu Erul 2020). On the other hand, Vincent’s (2023) findings indicate that a lack of tax knowledge tends to worsen the negative impacts of sub-national taxing authority and discretionary control over tax authorities on tax compliance. A comparative analysis conducted by the European Commission (2019) on non-compliance among EU Member States (period 2001–2016) reveals that Slovenia is among the 14 Member States with the lowest estimated lost revenue regarding tax non-compliance (accounting for less than 5% of the EU-28 total). An additional integrative analysis on tax compliance by Surugiu et al. (2021) utilized unbalanced panel data for the European Union (EU28), including Slovenian data, covering the period from 2007 to 2017. This analysis demonstrated a positive and significant influence of the quality of the education system on tax compliance, similar to findings in studies by Dayioğlu Erul (2020) and Tilahun (2019). The design of tax policies in all Member States should always consider the gender gaps prevailing (Nerudova et al. 2019), and European institutions and Member States are required to analyze and assess tax policies concerning socioeconomic gender gaps (Gunnarsson et al. 2017). Slovenia belongs to the economy, being a member of the EU and OECD, a country with a high influence on international tax regulations and guidelines. According to the data from the Statistical Office of the Republic of Slovenia (SURS 2023), females have recently attained higher levels of education than males. Only 40 percent of individuals live in settlements larger than 5000, as Slovenia has many small settlements, with the majority residing in rural areas. Financial literacy is considered to be low according to internationally established criteria (UMAR 2023). Therefore, improving financial and other types of literacy, especially among adults, is among the priorities of the country (UMAR 2023).
Thus, recognizing the importance of tax knowledge and tax fairness on compliance, based on the presented literature and strategic documents of the EU and OECD, the first question that arises is whether tax knowledge perception depends on gender and settlement size. Secondly, do the dimensions of tax fairness perception differ based on gender and settlement size? And thirdly, what is the relationship between tax knowledge perception and tax fairness perception?
The aim of this study is to assess the level of tax knowledge perception and tax fairness perception among Slovene taxpayers, examining differences based on gender and settlement size. By examining Slovenian taxpayers, new insights into factors, such as tax knowledge and fairness perception within a specific region can be gained. The findings may offer valuable information for Slovenian policymakers to tailor tax educational policies as well as for other countries with similar social, political, and economic situations. As the empirical evidence in this study is limited to tax knowledge perceptions and tax fairness perceptions, it is expected that the results of this study will contribute to the literature on tax compliance behavior (tax compliance factors). This study generates additional evidence for the limited literature available on these aspects in Slovenia, especially by analyzing differences based on gender and settlement size. Further, the study proposes some educational initiatives based on the results to enhance existing taxpayer knowledge and awareness.
The findings of this study indicate disparities in perceived tax knowledge between male and female taxpayers. Furthermore, this research demonstrates that the size of one’s settlement does not notably affect the level of tax knowledge among Slovene taxpayers. The statistically significant relationship between tax knowledge and tax fairness perception was relatively weak in both directions, contingent on the particular dimension of fairness being considered. However, in order to better understand the relationship between gender and tax knowledge and settlement size and tax knowledge while controlling for relevant factors such as education, income, and marital status, a more comprehensive multivariate analysis based on data from an improved questionnaire and a stratified random sample should be conducted in future studies.
2. Literature Review and Theoretical Background
Becker (1968) and Allingham and Sandmo (1972) represent the first attempts to develop a framework for tax compliance behaviour. Their Economic Approach (Rational Choice Theory) involves taxpayers engaging in both tax evasion and tax avoidance. Taxpayers commonly undertake a cost-benefit analysis, assessing potential penalties and the tax loss they might face if their evasion is detected (Güzel et al. 2019). The Moral Sentiments The Planned Behaviour Theory, a concept within social psychology, explains individuals behavior through the examination of behavioral intentions influenced by attitudes toward three key components: the behavior itself, subjective norms, and perceived behavioral control (Sundari et al. 2022; Taing and Chang 2020). The Behavioural Approach, emphasizes that the behavior of taxpayers in complying with taxes is shaped by non-economic factors and not just by economic ones. The non-economic factors of tax compliance include trust, tax morality, perception of justice/fairness, beliefs, norms (personal and social), deterrence, and educational awareness.
This study investigated two non-economic factors of tax compliance, tax knowledge perception, and tax fairness perception. The educational level of taxpayers significantly influences their understanding of taxes, particularly with respect to tax laws and regulations. Tax knowledge helps taxpayers navigate declaration procedures effectively, accurately determine tax liabilities (Nguyen 2022). A prevailing agreement in tax compliance research highlights the important role of a fair tax system in shaping taxpayers’ compliance behavior (Taing and Chang 2020; Nguyen 2022; Inasius 2019a). Therefore, education on taxation has a positive impact on tax knowledge (Kumi and Kwasi 2023; Gunaasih 2022), leading to a positive influence on the perceptions of tax fairness, which in turn significantly contributes to enhanced tax compliance, Mukhlis et al. (2015).
2.1. Tax Knowledge
In the tax compliance literature, the term “tax knowledge” lacks a singular, universally accepted definition and is used in various contexts. Tax knowledge encompasses a broad spectrum of fiscal awareness, including general financial knowledge, awareness of tax evasion possibilities, overall educational background, and familiarity with tax laws (Devos 2016). According to Wong and Lo (2015), tax knowledge pertains to an individual’s assessment of their capability to adhere to tax regulations, including both technical expertise in taxation and a broader understanding of the tax system and compliance requirements. Tax knowledge is a fundamental component of a voluntary tax compliance system (Kasippilai 2000). Non-compliance with tax regulations may arise due to the taxpayer’s insufficient knowledge and skills to adhere to them (OECD 2019b). Udin (2015) considered tax knowledge as one of the crucial factors in determining taxpayers’ tax obligation correctly. Loo (2006) emphasized that in a self-assessment system, taxation knowledge stands out as the most influential factor in shaping taxpayer compliance behavior.
There are several types of knowledge, including implicit knowledge, explicit knowledge, empirical knowledge, and rationalism knowledge (Damajanti 2015). Saad (2014) determined two dimensions of tax knowledge: knowledge acquired through formal education and knowledge focused on potential tax evasion opportunities, while Bornman and Ramutumbu (2019) identify three categories of tax knowledge: general knowledge, procedural knowledge, and legal knowledge. There is limited research (Saad 2010; Mohamad et al. 2013) measuring next to general knowledge and also specific tax knowledge (legal and technical knowledge).
General tax knowledge for the individual means to understand the overall fiscal strategies of the government, i.e., to understand why taxes should be paid, to understand one’s personal financial situation, and to understand the influence of taxation on personal financial situation (Bornman and Ramutumbu 2019). Saad (2010) and Mohamad et al.’s (2013) idea is that general tax knowledge relates to a perceived idea of the tax system and its purpose.
Legal knowledge highlights individuals’ knowledge of regulatory aspects, including their obligations and responsibilities, rights, and consequences in the form of penalties for non-compliance (Saad 2010; Mohamad et al. 2013). Bornman and Ramutumbu (2019) suggested that legal knowledge can be divided into a conceptual understanding of tax legislation, which includes a high-level awareness of legislative terminology and the capacity to differentiate between various taxation concepts. Additionally, they proposed a technical understanding of tax legislation, which involves the capability to apply legal tax knowledge to one’s specific situation and ensure precise compliance with tax obligations (Bornman and Ramutumbu 2019). Taxpayers are feeling tax incompetent because of the complexity of the tax laws and because of that, they lose interest in the tax system (McKerchar 2001). The situation becomes notably demanding because tax laws are usually subject to frequent changes and are often too complex for the average person to understand, which is particularly true for many small business owners (Bornman and Ramutumbu 2019).
Technical knowledge pertains to individuals’ capability to fill out and submit their tax return form (Saad 2010; Mohamad et al. 2013). In some research, it is also defined as procedural knowledge, which refers to understanding the process and timing for submitting a tax return. According to Oladipupo and Obazee (2016), procedural knowledge encompasses several key elements. These include understanding the rationale behind the current structure and administration of the tax system, familiarity with tax requirements, particularly in relation to registration and filing obligations, and awareness of diverse compliance measures (Oladipupo and Obazee 2016). Additionally, procedural knowledge involves a certain degree of consciousness and attentiveness regarding procedures and protocols associated with tax return filing, comprehension of the processes and obligations involved in maintaining tax compliance, and the practice of timely, accurate, and comprehensive record-keeping for the completion and submission of tax returns and relevant documents (Oladipupo and Obazee 2016). Bornman and Ramutumbu (2019) proposed that procedural tax knowledge can be delineated into two key components: interacting with tax authorities and maintaining essential records for tax-related purposes.
In the existing literature, most studies examined the relationship between tax knowledge and tax compliance. The results of these studies are mixed, from the confirmation of existing correlation between tax knowledge and tax compliance, where taxpayers’ decisions regarding tax compliance are largely influenced by their tax knowledge (Hofmann et al. 2008; Azmi et al. 2016; Maqsudi et al. 2021; Remali and Jalil 2021; Remali et al. 2018), to non-existing correlation (Nicoleta 2011; Ghani et al. 2020). According to Hofmann et al. (2008), tax knowledge is a fundamental factor that affects tax compliance. In the context of individual taxpayers’ attitudes, having a solid understanding of tax laws is crucial, and there is a notable positive correlation between tax knowledge and the level of tax compliance (Azmi et al. 2016). Maqsudi et al. (2021) also found that taxpayer knowledge directly and positively influences taxpayer compliance. Contrary to that, Nicoleta (2011) found that tax knowledge is negatively linked to tax compliance behavior and revealed that taxpayers with a higher level of tax knowledge were more capable of identifying discrepancies in the tax system and regulations, which, in turn, led to increased instances of tax non-compliance. Ghani et al. (2020) indicated that tax knowledge does not significantly impact tax compliance among self-employed individuals. According to Palil et al. (2013), individuals with sufficient tax knowledge can mitigate unintentional noncompliance. In other words, this implies that tax knowledge can enhance the degree of tax compliance. Remali and Jalil (2021) claimed that tax education can help undergraduate students enhance their tax compliance by positively influencing their perceptions of the tax system and ethical attitudes. Additionally, some authors have suggested that education is linked to knowledge and, in this way, search for connections with tax compliance (Putri and Venusita 2019; Natasha and Yustina 2020). However, they mostly did not find any significant partial influence, as general education is not always associated with an understanding of the tax system and specific tax knowledge. One of the goals of this study was to test the relationship between tax knowledge and two socio-demographic factors (gender and settlement size). As the first main hypothesis, which was further tested with two subhypotheses, we defined the following:
H1:
The level of tax knowledge differs significantly by gender and settlement size among taxpayers in Slovenia.
Stotsky (1996) and Gunnarsson et al. (2017) demonstrated that gender differences exist even in taxation (OECD 2022). Tax policies significantly influence the economic participation and overall well-being of both females and males. These policies play a crucial role in shaping gender outcomes by impacting disposable consumption, incomes, and wealth. Therefore, tax policies are instrumental in influencing the overall well-being of individuals across genders OECD (2022). Socioeconomic inequality between males and females derives from legal cultures and economic structures (Torgler and Schneider 2004). The division of labor plays a central role in shaping fundamental objectives and norms in society, introducing a gendered dimension to the distributive and allocative effects of tax laws and policies. Males traditionally earn more and are wealthier than females; they accumulate more wealth in capital income, property rights, and financial investments and are therefore more oriented toward entrepreneurship (OECD 2022). Females are clustered in lower-income groups and have higher poverty rates than males. Paid work favors males rather than females. While males’ labor is more valued publicly in the market, females tend to be more reproductive inside the private domain of the home (Gunnarsson et al. 2017).
Implicit and explicit gender bias exists in most tax systems around the world, and eliminating bias may increase equality within tax systems (Grown et al. 2022). Females and males can be deliberately treated differently due to favorable tax law provisions, regulations, and procedures (explicit gender bias) or because the tax system and taxes affect their well-being differently (implicit bias). The inefficiencies of any tax system must be continually tested. Even if females and males are taxed under the same tax law, the structure of the tax system can have different impacts on females versus males (Grown et al. 2022). Gender differences drive various mechanisms, shaping the gender perception of the tax system differently between males and females. Coelho et al. (2022) identified differences in labor supply, progressivity on pay gaps, and lower effective capital income taxation on the personal income tax burden gap as gender bias in taxation. It is evident that gender differences exist (OECD 2022; Stotsky 1996; Gunnarsson et al. 2017) due to interaction with economic or societal differences between males and females.
Several researchers have examined gender as a demographic variable (Lohse and Qari 2014; Amponsah and Adu 2017; D’Attoma et al. 2017), demonstrating that males are less compliant than females. Kastlunger et al. (2010) pointed out that gender needs to be examined with caution as it affects socialization and education. Natasha and Yustina (2020) and Formanova et al. (2021) could not find a gender effect on the level of tax knowledge or literacy, which does not align with Fallan’s (1999) conclusion that reportedly identified a higher level of tax literacy among males. A sizable gender gap in financial knowledge was identified by Yao et al. (2023). Although gender-sensitive tax laws are essential, they cannot attain gender equality. However, Fallan’s (1999) study unveiled a non-significant result that gender does not possess predictive power in this context.
When explaining the reasons for the gender gap in tax knowledge, we can follow the findings of Yao et al. (2023), who identified some key factors for explaining a possible gender gap in financial knowledge. These mechanisms can be assumed to also apply to the gap in tax knowledge.
Gender differences depend on the complex interactions between specific family contexts and the socialization of gender roles, i.e., the family financial socialization process. In this process, norms, values, standards, attitudes, knowledge, and behaviors are acquired, contributing to the well-being of the individual and financial viability (Yao et al. 2023; Danes 1994). The socialization processes positively correlate with individuals’ subjective self-evaluated knowledge and objective knowledge (Zhu 2018; Deenanath et al. 2019). Previous research (LeBaron and Kelley 2020) on traditional gender roles depicts males as the breadwinners, financially responsible, and females as the caregivers, highlighting differences in parenting. Male children tend to receive more experiences in information about financial matters compared to female children (Yao et al. 2023).
Another particularly important source identified for acquiring financial knowledge is formal (informal) financial education. Prior research has found positive causal effects (Kaiser et al. 2021) of education programs on knowledge and financial behaviors, favoring females. Even after taking formal courses (Danes and Haberman 2007; Danes and Brewton 2014), females gained more knowledge. Yao et al.’s (2023) investigation confirmed that, in comparison to family socialization, financial experiences beyond the family, such as education, play significantly more substantial roles in influencing the gender gap in financial knowledge among males and females. Eriksen and Fallan (1996) found that females and males learn tax knowledge differently; there are unique learning patterns, as reported by Fallan (1999). Coelho et al. (2022) observed that gender differences are driven by various mechanisms, including income disparities, occupational disparities, family responsibilities, tax knowledge and financial literacy, legal and regulatory factors, risk aversion, enforcement and penalties, social and cultural norms, and access to resources. As Formanova et al. (2021) could not find a gender effect on the level of tax literacy, which does not align with Fallan’s (1999) conclusion that reportedly identified a higher level of tax literacy among males, the mix result needs additional testing country-specific.
We believe that (tax) cultural, social norms, and (tax) values, as well as society expectation regarding responsibility, may influence the level of type and engagement in acquiring tax knowledge by gender differently. Other potential reasons for variations in tax knowledge by gender could derive from historical gender roles, due to unequal access to education—educational disparities, unequal access to financial resources and opportunities for financial decision-making, and occupational segregation. The scope of this research is limited to the subjective perception of tax knowledge based on self-evaluated knowledge, focusing on general knowledge, legal knowledge, and technical knowledge. If our study confirms gender differences in tax knowledge, further detailed research should be conducted, testing, for example, effective knowledge and the possible mechanisms driving gender differences. Building on the previous literature, the current study seeks to examine the following subhypothesis:
H1a:
The level of tax knowledge differs significantly between male and female taxpayers in Slovenia.
When examining the differences by settlement type between rural and urban areas, there seems to have been a shift over time, with a smaller percentage of tax non-compliance observed in rural areas and an increase in non-compliance rates in small or medium-sized towns (Williams 2020). Although there were no significant differences between urban and rural residents in their likelihood of engaging in tax non-compliance in 2007 and 2013, by 2019, those living in large urban areas were significantly less likely to be non-compliant compared to those in rural areas or villages (Williams 2020). Therefore, Williams (2020) argues that at the European level, taxpayers in villages and rural areas are more likely to be non-compliant. Altering the tolerance for tax non-compliance can be achieved through educational efforts and awareness-raising campaigns, e.g., higher tax knowledge. There are few other studies measuring the impact of a taxpayer’s settlement size (rural or urban area) on their compliance, with some empirical evidence supporting the influence of the area variable for businesses on tax compliance (Dissanayake and Premaratna 2020; Williams 2020).
There could be several reasons why differences might be expected based on settlement size. Significant disparities in rural areas, both in OECD and non-OECD countries, exist primarily in terms of mobility, the accessibility of public transport, the adoption of new information, and communication technologies, as well as the availability of sufficient and high-quality resources for education and training (OECD 2006, 2019a). Wood (2023) identifies the following reasons for differences in knowledge between urban and rural areas. First, the availability of resources, such as well-equipped educational institutions, favors urban areas, making it challenging for rural areas, which often lack these resources. Consequently, access to specific and high-quality education in taxation, as well as highly qualified educators, is difficult (Wood 2023). Due to the distance and limited access to formal educational institutions in rural areas, access to specific knowledge is restricted, and local knowledge needs to be disseminated through others, such as online communication channels, for which the infrastructure is not always adapted (Wood 2023). Among the most significant factors in knowledge dissemination are communication networks, which are more crucial for spreading specific tax knowledge in rural areas as well as transport and access to services (Pateman 2011). Due to the distance and limited access to formal educational institutions in rural areas, access to specific knowledge is restricted, and local knowledge needs to be disseminated through others, such as online communication channels, for which the infrastructure is not always adapted. Access to technology, facilitating online resources and tools for learning about tax matters, is not equal. There are more economic activities in urban areas than in rural areas. Urban areas have more robust government services, including tax-related education and assistance, compared to urban areas. Second, socio-economic factors, especially income levels, are higher in urban areas, and this significantly influences educational, that is, knowledge differences (Wood 2023). Rural individuals are found to have lower financial (i.e., tax) literacy levels than their urban individuals, and a possible explanation could be found in several socio-economic and demographic variables, such as age, income level, marital status, and employment status (Mckenzie 2022).
This study examines the existence of the differences between rural and urban taxpayers in tax knowledge perception but does not investigate the mechanisms and reasons behind them, which could be the subject of future research. The subhypothesis states the following:
H1b:
The level of tax knowledge differs significantly between rural taxpayers and urban taxpayers in Slovenia.
2.2. Tax Fairness
Social psychologists discovered that tax compliance is affected by the taxpayers’ perceptions of fairness and unfairness (Tyler 1997). Psychological elements, including attitudes, norms, and the perceived fairness of the tax system, hold equal significance as economic factors in enhancing taxpayer compliance (Kirchler 2007). In general, research examining the impact of fairness consistently reveals that “taxpayers are less inclined to adhere to a tax system they perceive as unjust, inequitable, and therefore lacking legitimacy” (Wenzel 2002). Kirchler et al. (2008) proposed in a slippery-slope framework that taxpayer compliance relies on a combination of economic and non-economic factors. Taxpayers adhere to tax compliance either out of fear of the tax authorities or due to a sense of obligation. The dimension of fear pertains to the perceived authority’s power and the enforced compliance, including economic factors like audit rates and penalties. The sense of obligation, on the other hand, is associated with trust in the tax authorities and voluntary compliance, including non-economic factors such as norms, attitudes, and the perceived fairness of the tax system. The literature on tax morale has revealed that, in addition to deterrence mechanisms (Kirchler 2007; Alm 2019), the social and institutional context in which individuals engage with one another can have a substantial impact on their tax morale (Bergolo et al. 2020).
According to Kassa (2021), tax fairness is defined as the equity in tax collection procedures, principles, and execution, and when the tax collection process lacks fairness, it can lead to unethical practices. Tax fairness is a topic of debate, contention, and controversy since all taxpayers do not pay taxes using the same tax rates (Abate 2019). Fairness is linked to the perception of a harmonious balance between taxes paid and the benefits of public goods received. Despite the extensive discussion about individual motivations for tax compliance, the political economy literature still provides limited consideration to the impact of individual attitudes regarding fairness and wealth redistribution on tax morale (Castañeda 2023).
Previous research indicates the importance of fairness in taxation (Gobena and Van Dijke 2017; Niesiobędzka and Kołodziej 2020). Fairness could be observed from many different aspects, and therefore, there are many understandings of this concept (Sikayu et al. 2022). When taxpayers believe that the existing tax processes and procedures are unjust toward them, they might be hesitant to collaborate with tax audit officials (Kirchler et al. 2008). Individuals who are more sensitive to fairness are less inclined to view tax payment as a civic duty and more inclined to rationalize tax evasion (Castañeda 2023). Tax evasion is more likely to happen among taxpayers who perceive the tax system as unfair, leading them to exhibit non-compliance with their tax obligations (Sing and Bidin 2020). Tax fairness is a non-economic determinant of tax evasion and represents a significant factor influencing taxpayer behavior (Alm et al. 2017).
Ullah et al. (2018) find that most of the survey participants (individual taxpayers in Pakistan) believe that transparency and fairness within the system would directly contribute to an increase in tax revenue. Chan et al. (2000) discovered that when taxpayers believe that the government does not allocate tax revenue fairly, it leads to a perception of tax unfairness. Saad (2010) found that taxpayers considered the current income tax system fair, but there was no proof that this perception significantly affected their compliance behavior. Additionally, Saad (2010) found that fairness perceptions were influenced by tax knowledge and tax complexity, while Mohamad et al. (2013) indicated a significant difference in tax knowledge and fairness perception between accounting and non-accounting students.
There are various classifications of the dimensions and sub-dimensions of fairness in the literature and ways defined by the authors (Gerbing 1988; Azmi and Perumal 2008; Farrar et al. 2020). Based on previous research (Hartner et al. 2008; Van Dijke and Verboon 2010; Wenzel 2002; Farrar et al. 2020, 2022), Saad (2010) suggested ten dimensions of fairness, but in her study, seven dimensions were identified to be important in assessing the fairness of the income tax system: general fairness, exchange fairness, vertical fairness, horizontal fairness, personal fairness, retributive fairness, and administrative fairness. General fairness assesses individuals’ opinions regarding the overall fairness of the (income) tax system (Saad 2010). Exchange fairness focuses on the fairness in the relationship between the benefits received from public goods and services provided by the government and the tax burden placed on taxpayers (Bayram et al. 2017). Personal fairness pertains to an individual’s self-interest, whereas administrative fairness encompasses both the content of tax law (policy fairness) and the procedures followed by the tax authority (procedural fairness) (Saad 2010). Vertical equity is a judgment regarding the appropriate tax burden for taxpayers with varying abilities to pay while horizontal equity is a judgment that taxpayers with equal ability to pay should be subjected to the same taxation (Susilawati 2022). In other words, horizontal fairness pertains to the equitable distribution of benefits and costs among individuals within the same group, while vertical fairness concerns the allocation of benefits and costs among individuals who are not of equal standing (Bayram et al. 2017). In the context of tax behavior, some have authors categorized fairness as distributive, procedural, and retributive justice (Comunale et al. 2019). Among the principles of justice, distributive justice and procedural justice are given the most attention (Druckman 2020). Distributive justice concerns the fairness of the decision’s outcome, while procedural justice pertains to the fairness of the decision-making process (Druckman and Wagner 2016). Distributive justice refers to the equity of outcomes in resource allocation or distribution and boasts the longest history of research in social psychology (Wenzel 2003). The primary four principles of distributive justice include equality, proportionality, compensation, and need (Druckman and Wagner 2016). Another categorization of distributive fairness can be horizontal fairness, vertical fairness, or fairness in exchanges with the government (Bayram et al. 2017).
Wenzel (2003) observed distributive, procedural, and redistributive justice in tax research on the societal, group, and individual levels. The individual level of analysis of distributive justice in tax research includes analysis of personal tax burdens, personal benefits, and personal options related to tax evasion compared to others, other times, or relative income. Procedural justice encompasses the consideration of the process (Druckman 2020) and includes analysis of holding regard for everyone’s dignity and maintaining consistency compared to others, expression, authority, process and decision control, information and explanation, effectiveness, and balancing service quality against expenses incurred by the individual (Wenzel 2003). It offers a way to assess individuals’ perceptions regarding the legitimacy of an authority and their compliance with the rules and decisions established by that authority (Hoong Voon et al. 2023). Redistributive justice includes an analysis of the appropriateness of a penalty for individuals (penalties) and inflexibility or lack of consideration in the audit process for individual cases (audits) (Wenzel 2003).
Incorporating gender considerations is important across all tiers of research, policy development, and advocacy in the realm of tax fairness/justice; overlooking this dimension implies forfeiting the chance to achieve an equitable tax system (Christain Aid 2014). Even if explicit and implicit gender biases do not exist in a tax system, implementing a gender-based tax system may face challenges in achieving high compliance, as it can still be perceived as unfair by taxpayers. Therefore, when designing tax systems and tax policies and considering the gender gaps (Nerudova et al. 2019), these should not be overlooked. The reason why tax fairness perception differs might be also found in the non-uniform distribution of tax preferences in society, which varies depending on the urbanization rate (Andersson 2017). This study limited the research to all dimensions of fairness defined by Saad (2010, 2012), who confirmed positive perceptions of personal, vertical, and administrative fairness. However, for exchange, horizontal, and retributive fairness perceptions, the results were mixed. Fairness perception by dimensions can differ among different groups, as Mohamad et al. (2013) revealed in their research on accounting and non-accounting students. Measuring perceptions on all dimensions of fairness by gender and settlement size was identified as a literature gap. Therefore, as the second main hypothesis, which was further tested with two subhypotheses, we defined the following:
H2:
The level of tax fairness differs significantly by gender and settlement size among taxpayers in Slovenia.
In addition to the gender arguments already stated under subhypothesis one, why expect gender differences in tax knowledge, we believe that the same mechanisms apply to tax fairness. Gender differences in the perception of tax fairness are anticipated because females often earn lower incomes, enter and exit the labor market at different life stages, and contribute significantly to unpaid labor and caregiving responsibilities at home, in family businesses, and within the community (Nerudova et al. 2019; Hundsdoerfer and Eva 2020). These variations also arise from the prevailing gender roles in society (Christain Aid 2014). Altering female and male awareness with improved tax knowledge raises perceptions of the fairness of the tax system (Fallan 1999). Research has confirmed gender disparities in perceptions of fairness concerning distributive and procedural justice (Hundsdoerfer and Eva 2020) and in redistributive fairness (Nerudova et al. 2019). Male participants are particularly responsive to procedural justice violations in their fairness perceptions, while female participants tend to adjust their fairness perceptions based on the outcomes of the tax allocation procedure (Hundsdoerfer and Eva 2020). To test whether gender differences exist in different dimensions of tax fairness, the subhypothesis was as follows:
H2a:
The level of tax fairness differs significantly between male and female taxpayers in Slovenia.
Disparities between urban and rural areas can impact individuals’ perspectives on taxes (Mohammed and Tangl 2024). The literature explains that these disparities may arise from actual differences in taxation between urban and rural areas in terms of paying different types of taxes and receiving tax exemptions and allowances that some are entitled to while others are not (Beck et al. 2016), affecting both vertical and horizontal fairness. We expect that the tax fairness perception between urban and rural areas will be different due to differences in economic, social, and cultural conditions, as well as the varying needs and expectations of individuals in both types of areas. Access to services and infrastructure, as well as access to tax education and specific tax knowledge, can influence the perception of tax fairness in these different environments. Therefore, to examine the dimensions of tax fairness perception based on settlement size, the following subhypothesis was formulated:
H2b:
The level of tax fairness differs significantly between rural and urban taxpayers in Slovenia.
The perception of the fairness of the tax system can be improved by raising tax knowledge (Fallan 1999). These findings are inconsistent with Chucks and Azaka’s (2023) conclusion, which states that the level of tax knowledge does not influence individuals’ perception of tax fairness. Contrary to this, Saad (2010) confirmed a positively oriented relationship between tax knowledge and fairness dimensions and concluded that, in general, tax knowledge had varying effects on fairness perceptions, except for horizontal fairness (Saad 2010, 2014). Specifically, technical knowledge was found to significantly influence vertical fairness, retributive fairness, and personal fairness, while legal knowledge was only significant in shaping taxpayers’ perceptions of retributive fairness (Saad 2010). The results in the literature are mixed. Based on these findings, we further tested the third hypothesis:
H3:
Tax knowledge positively influences the dimensions of fairness perception of Slovene taxpayers.
3. Materials and Methods
In the conducted survey, the respondents were Slovene taxpayers who provided answers to a long range of questions related to the tax topic. For most respondents, the tax topic tends to be a sensitive topic. Therefore, in order to select respondents and further recruit them, the snowball sampling approach was used (a non-probability sampling technique).
Snowball sampling is a non-probability sampling technique used in social sciences to select respondents from populations that may be marginalized, hidden, or hard to identify with traditional sampling methods. The snowball sampling starts with a small group of respondents who provide information about other possible respondents. These respondents are then asked to participate in the survey and to recommend other potential respondents with specific characteristics. The process continues until there are no more recommendations or the planned sample size is reached.
Snowball sampling can be employed when studying attitudes toward sensitive topics like tax payments or opinions about the tax system. However, it is crucial to emphasize that snowball sampling could introduce bias into the survey results. Specifically, respondents may recommend others who share similar characteristics and opinions with the existing respondents, leading to a non-representative sample. Therefore, the results obtained through snowball sampling should be interpreted and observed carefully, with the main focus on the characteristics of the observed respondents.
In the survey, which was carried out from March to May 2023, 390 respondents who completed the questionnaire participated. The survey included in-depth and detailed questions related to the taxpayers’ attitude toward the tax system in Slovenia.
Table 1 shows a list of the selected variables from the questionnaire, the key variables for conducting the analysis. Overall, 30 items were adopted from previous studies. Items measuring tax knowledge (GK1, LK1, LK2, LK3, TK1, TK2, and TK3) from Mohamad et al. (2013) and Saad (2010), items measuring tax fairness (GF1, GF2, GF3, GF4, GF5, HF1, EF1, VF2, and RF1) from Mohamad et al. (2013), and items measuring personal (PF1–PF9) and administrative fairness (AF1, AF2) from Braithwaite et al. (2001) were included, while 12 items (marked as “overall”) are introduced by calculating the averages of subdimension variables for the purpose of further analyzing the results.
While the survey questions were based on previous research studies, additional steps were taken to validate the survey questionnaire. Initially, the content of the survey questionnaire was validated, ensuring that all relevant aspects of the observed topic were appropriately measured and covered. Furthermore, some questions were slightly modified to enhance their clarity. Pilot testing was carried out with a small sample of respondents, and suggestions for improving the questionnaire were duly considered. Additionally, the data collection process was closely monitored to promptly address any unexpected issues that may have arisen.
Those 30 observed variables, listed in Table 1, belong to the 5-point Likert scale type of question, with the answer range from 1 (strong disagreement) to 5 (strong agreement). The variables were grouped according to their main dimensions, tax knowledge, and fairness perceptions. Inside those dimensions, variables were grouped further according to their following subdimensions. There are three tax knowledge subdimensions introduced: general knowledge, legal knowledge, and technical knowledge. The definitions and understanding of those items are provided by Saad (2010), and Mohamad et al. (2013). In the dimension of fairness perception, seven subdimensions were defined as follows: general fairness, exchange fairness, horizontal fairness, vertical fairness, retributive fairness, personal fairness, and administrative fairness. The definitions and understanding of those items are provided by Saad (2010) and Braithwaite et al. (2001) are presented in Appendix A. An additional 12 variables were introduced by calculating the averages of subdimension variables. Values from the variable legal knowledge (LK) were calculated as averages of variables LK1, LK2, and LK3 for each respondent separately. The tax knowledge (TAXK) variable was calculated as an average of variables GK, LK, and TK, which present the three subdimensions under the tax knowledge dimension. Similarly, the variable fairness perceptions (FAIRP) was estimated by considering seven fairness perceptions subdimensions: GF, EF, HF, VF, RF, PF, and AF. The analysis of the data was conducted using Microsoft Excel, R 4.3.0, and RStudio 2023.06.1+524. The data editing was conducted using Microsoft Excel, whereas the statistical analyses were performed in RStudio.
The analysis was conducted as follows: In the first step, the structure of the respondents according to their main demographic characteristics was observed. That was first performed on the overall level, and after that, it was according to the respondents’ gender and the respondents’ settlement type in which they live. The separate view of respondents according to their gender (H1a) and settlement type (H1b) is important. Research hypothesis H1a states that the level of tax knowledge differs significantly between females and males and H1b between rural taxpayers and urban taxpayers, respectively. To inspect whether those differences are statistically significant or not, the Kruskal–Wallis test was applied. The Kruskall–Wallis test (Kruskal–Wallis rank sum test) is a rank-based nonparametric test in which at the null hypothesis it is assumed that there are no statistically significant differences between two or more groups, whereas at the alternative hypothesis it is assumed that there is at least one group statistically different from the others. The test statistic is equal to the following:
where is the total number of observations in all groups, is the number of groups, is the observations’ number in the -th group, is the rank of the -th observation from the -th group, is the average rank of all observations in the -th group, and is the average rank of all observations (Kruskal and Allen 1952; Dunn 1964). The Kruskal–Wallis test is appropriate since the observed data are assumed not to follow a normal distribution, a consequence of using the Likert scale with only five answer options. Additionally, two independent groups were observed (males vs. females and respondents from rural vs. urban settlements). The preliminary analysis indicates similar distributions in each group in terms of the shape and spread. However, a significant Kruskal–Wallis test will not indicate a difference in medians but the presence of a statistically significant difference between the groups, ensuring comparability for different variables. Finally, the large total sample size ensures that each group sample has more than 20 observations (Zar 2010). The Kruskal–Wallis test will be applied to inspect research hypothesis H2 (the level of tax fairness differs significantly between females and males (H2a), and between rural taxpayers and urban taxpayers respectively (H2b) as well. Finally, to investigate research hypothesis H3, tax knowledge positively influences the dimensions of fairness perception of Slovene taxpayers, the Kendall’s coefficient of rank is used to determine the association between the tax knowledge with seven fairness perception dimensions. The Kendall’s coefficient of rank is suitable for use when observing the association between ordinal variables measured on the Likert scale. To make appropriate adjustments for ties, Kendall’s Tau-b statistic is used in the analysis (Agresti 2010):
where is the number of concordant pairs, is the number of discordant pairs, , , is the number of tied values in the -th group of ties for the first variable, , and is the number of tied values in the -th group of ties for the second variable. Kendall’s Tau-b statistic ranges from −1 to 1, where −1 indicates a perfect negative association, while a value of 1 indicates a perfect positive association. If Kendall’s Tau-b statistic equals 1, this would imply that there is no association between the two observed variables. It has been demonstrated that Kendall’s Tau-b statistic is robust against outliers. Additionally, Kendall’s Tau-b statistic is often employed in cases where the observed variables are not normally distributed.
4. Results
4.1. Demographic Structure of Respondents
In Table 2, the structure of all 390 respondents, according to their main demographic characteristics, is given. The share of respondents was calculated by taking the ratio of the number of respondents in a certain category to the total number of respondents (n = 390) and multiplying the result by 100.
In the survey, 52% females and 48% males participated. Most respondents have a vocational secondary education (42%), and most respondents have a gross income in the range from EUR 1001 to 2000 (50%). The vast majority of respondents have stated that they are Christians (73%). Where a marital status is observed, 41% of respondents are married, whereas 37% of the respondents are in domestic partnership or cohabiting. According to the settlement type in which they live, 60% of respondents are from a rural settlement, whereas 40% of respondents are from an urban settlement. In this research, rural settlements are considered to have 3000 or fewer inhabitants. On the other hand, rural settlements are those with more than 3000 inhabitants. The structure of the respondents’ demographic characteristics according to gender is provided in Table 3.
The share of female respondents was calculated by taking the ratio of the number of female respondents in a certain category to the total number of female respondents (n = 203) and multiplying the result by 100. Similarly, the share of male respondents was calculated by taking the ratio of the number of male respondents in a certain category to the total number of male respondents (n = 187) and multiplying the result by 100. This approach allows for the comparison of distributions across different variables (education, gross income, religion, marital status, and type of settlement) between female and male respondents. The demographic characteristics of female and of male respondents are quite similar. However, it can be concluded that considerable differences are present if the education and the marital status of respondents are observed. There are more females with tertiary education or university degree than males (37% vs. 20%). On the other side, there are fewer females with vocational, secondary education than males (35% vs. 49%). There are also more married females than males (47% vs. 34%), but there are fewer single females than males (11% vs. 26%).
The structure of the respondents’ demographic characteristics according to the settlement type in which they live is given in Table 4.
The share of rural respondents was calculated by taking the ratio of the number of respondents living in rural settlements in a certain category to the total number of respondents living in rural settlements (n = 233) and multiplying the result by 100. Similarly, the share of urban respondents was calculated by taking the ratio of the number of respondents living in urban settlements in a certain category to the total number of respondents living in urban settlements (n = 157) and multiplying the result by 100. This approach allows for the comparison of distributions across different variables (gender, education, gross income, religion, and marital status) between respondents living in rural settlements and respondents living in urban settlements. The main differences between respondents who live in a rural or in urban settlement appear in variables such as education and religion. There are more respondents with vocational, secondary education from rural settlements than from urban settlements (47% vs. 34%), but there are fewer respondents from rural settlements with a tertiary education or university degree than from urban settlements (25% vs. 35%). There are more Christians in rural settlements than in urban settlements (78% vs. 66%). Respondents from urban settlements tend to be less religious than respondents from rural settlements (15% vs. 7%).
It has to be emphasized that the focus of the paper is to observe the differences between respondents based on gender (female vs. male) and type of settlement (rural vs. urban) in the areas of tax knowledge and fairness perception. Therefore, to better understand the structure of respondents according to these two main variables of interest, the distributions of respondents for different demographic variables are shown in Table 3 and Table 4. However, other demographic variables (education, gross income, religion, and marital status) will not be further analyzed as they are not the main focus of the paper’s research.
4.2. Tax Knowledge Differences by Gender and Settlement Size
In this chapter, tax knowledge level differences between females and males and between respondents from rural and urban settlements are investigated. Table 5 shows the average levels of tax knowledge variables for females, males, respondents from a rural settlement, and respondents from an urban settlement. The average levels were calculated as the means of all respondents belonging to specific groups (females, males, respondents from rural settlements, and respondents from urban settlements) for each tax knowledge variable separately. All tax knowledge variables are rated on a scale from one to five, where one indicates strong disagreement with the statement related to the tax knowledge variables, and five indicates strong agreement with the statement. The midpoint, value 3, in this context, signifies that a respondent neither disagrees nor agrees with the statement in the tax knowledge variable. Therefore, all calculated averages presented in Table 5 should be interpreted in the context of specific groups of respondents tending to agree or disagree with certain tax knowledge variables.
The highest average tax knowledge level for females is achieved at variable GK1 (3.33), whereas males have the highest average at variable TK1 (3.42). On the other hand, the lowest average tax knowledge level for both females (2.31) and males (2.58) was achieved at variable TK3. Respondents from a rural settlement have the highest average at variable GK1 (3.37) and the lowest average at variable TK3 (2.27). Respondents from an urban settlement have the highest average at variable TK1 (3.42) and the lowest average at variable LK3 (2.52). In Figure 1, box plots of variable tax knowledge (TAXK) according to gender are shown (Figure 1).
A box plot consists of a “box” that is delimited by the values of the first and third quartiles. Inside this box or between the first and third quartiles, the median value can be found. In addition to the quartiles, a box plot provides information about the minimum and maximum values. However, the presented box plots will also provide information about potential outliers. Data values that may be considered potential outliers are shown as circles in the box plots.
If those box plots are compared, it could be concluded that females have lower values of TAXK levels than males. Namely, all five key elements of a box plot—minimum, first quartile, median, third quartile, and maximum—are lower for females than for males for the observed variable. Similarly, in Figure 2 box plots of variable tax knowledge (TAXK) according to settlement type are provided.
It seems that the variability level of variable TAXK is larger at respondents from a rural settlement than at respondents from an urban settlement. This conclusion can be drawn by observing the data range (the difference between the maximum and the minimum) and the interquartile range (the difference between the third and the first quartile). On the other hand, the median values are at the same level for respondents who live in rural settlements and respondents who live in urban settlements (median = 2.86). It should be emphasized that the box plot analysis was presented only for the main variable under study, which is the variable TAXK, whereas the box plots for other tax knowledge dimensions are not shown.
Kruskal–Wallis rank sum test results, in which tax knowledge variables according to gender and settlement type are compared, are given in Table 6.
In Table 6, the test statistics of the conducted Kruskal–Wallis rank sum tests and their corresponding p-values are provided separately. If the p-value is lower than 0.05, it can be concluded that there is a statistically significant difference in the tax knowledge level for a certain tax knowledge variable between females and males when observed according to gender, or between respondents living in urban and rural settlements when observed according to settlement type variables.
According to the results, statistically significant differences, at the significance level of 0.05, between females and males regarding tax knowledge level appeared to be at variables TAXK (p-value = 0.0116), LK (p-value = 0.0316), LK2 (p-value = 0.0195), TK (p-value = 0.0227), and TK3 (p-value = 0.0369). So, the research subhypothesis H1a, that the level of tax knowledge differs significantly between females and males, can be accepted. However, the research subhypothesis H1b, that the level of tax knowledge differs significantly between rural taxpayers and urban taxpayers, cannot be accepted. Namely, there are statistically significant differences, at the significance level of 0.05, between respondents from a rural settlement and from an urban settlement at LK1 (p-value = 0.0425), TK (p-value = 0.0167), and TK3 (p-value = 0.0006) but not at variable TAXK (p-value = 0.2067).
4.3. Fairness Perception Differences by Gender and Settlement Size
Fairness perception levels have been separately observed for gender and settlement type. The average values throughout fairness perception variables are given in Table 7. The average levels were calculated as the means of all respondents belonging to specific groups (females, males, respondents from rural settlements, and respondents from urban settlements) for each fairness perception variable separately. Similar to the tax knowledge variables, the fairness perception variables are also rated on a scale from one to five with the same meaning of the values. Therefore, one indicates strong disagreement with the statement related to the fairness perception variables, the midpoint (value three) signifies that a respondent neither disagrees nor agrees with the statement, and five indicates strong agreement with the fairness perception statement. Therefore, all calculated averages provided in Table 7 should be interpreted as the levels of disagreement or agreement of specific groups of respondents with the fairness perception variables.
Both females and males have achieved the highest average value at variable VF1 with the same value of 3.95. The lowest average values for females and males have also been achieved at the same variables GF4 (female = 2.42; male = 2.64) and PF6 (female = 2.69; male = 2.63). If respondents are compared by the type of settlement in which they live it can be noticed that there are a lot of similarities present here as well. So, respondents from a rural settlement and respondents from an urban settlement have achieved the highest average value at variable VF1 (rural settlement = 4.01; urban settlement = 3.85). The lowest average values from both categories, respondents from a rural settlement and respondents from an urban settlement, were recorded at variable GF4 (rural settlement = 2.47; urban settlement = 2.60).
The data distributions of variable FAIRP according to respondents’ gender are shown in Figure 3.
According to the box plots given in Figure 3, it can be concluded that males could have a slightly higher variability level of the fairness perceptions (FAIRP) variable distribution than females. This conclusion can be drawn from the fact that males have a lower minimum (without outliers) and a higher maximum (without outliers) in variable FAIRP than females. Additionally, males have a lower first quartile but a higher third quartile in variable FAIRP compared to female respondents. However, the average levels seem to be quite the same between males and females at the variable FAIRP.
The data distributions of variable FAIRP according to the settlement type in which respondents live are presented by box plots in Figure 4.
The box plots suggest that respondents from a rural settlement and respondents from an urban settlement have quite similar distributions of variable FAIRP. For example, the first quartile for respondents who live in rural settlements is 2.96, whereas for respondents who live in urban settlements, it is 3.00. Similarly, the median for respondents who live in rural settlements is 3.17, whereas for respondents who live in urban settlements, it is 3.22. Again, the box plots are presented only for the main variable under study, FAIRP, whereas the box plots for other fairness perception dimensions are not shown.
In Table 8 Kruskal–Wallis rank sum test results are provided, in which fairness perception variables according to gender and settlement type are compared.
In Table 8, the test statistics of the conducted Kruskal–Wallis rank sum tests and their corresponding p-values are provided separately. If the p-value is lower than 0.05, it can be concluded that there is a statistically significant difference in fairness perception levels for a certain fairness perception variable between females and males when observed according to gender or between respondents living in urban and rural settlements when observed according to settlement type variables. The results from Table 7, Figure 3, and Figure 4 already indicated what could be the Kruskal–Wallis rank sum test results. According to results from Table 8, at the significance level of 0.05, there is a statistically significant difference between females and males only at variable AF1 (p-value = 0.0263). Similarly, statistically significant differences, at the significance level of 0.05, between respondents from a rural settlement and from an urban settlement are present only at variables RF1 (p-value = 0.0004) (consequently at variable RF as well) and PF6 (p-value = 0.0500). Therefore, the research subhypothesis (H2a, H2b) that the level of tax fairness differs significantly between females and males and between rural taxpayers and urban taxpayers, respectively, can be rejected.
4.4. Tax Knowledge Correlation with Fairness Perception Dimensions
The correlation between overall tax knowledge (variable TAXK) and fairness perception dimensions (variables GF, EF, HF, VF, RF, PF, and AF) was measured by applying the Kendall’s coefficient of rank. The correlation results are given in Table 9. Along with Kendall’s Tau-b statistic, the related p-value is provided as well. If the p-value is lower than 0.05, it can be concluded that there is a statistically significant association between the variable TAXK and the observed fairness perception dimension. If the association is statistically significant, the strength of the association can be commented upon.
According to the results from Table 9, all observed correlations are statistically significant at significance level 0.05. However, tax knowledge is mostly weakly associated with fairness perception dimensions. The highest association levels are present at the GF and RF fairness perception dimensions. In those two cases, it could be concluded that tax knowledge is medium and positively associated with GF (Kendall’s = 0.2936) and RF (Kendall’s = 0.2922), respectively. The results have shown that tax knowledge is negatively associated with HF (Kendall’s = −0.1262) and with VF (Kendall’s = −0.1805). Therefore, the third research hypothesis, H3, that tax knowledge positively influences the dimensions of fairness perception of Slovene taxpayers, can be partially accepted.
5. Discussion
For the purpose of selecting respondents, the snowball sampling approach was used. This method is appropriate when investigating sensitive topics, such as personal finances and tax behaviors, due to privacy concerns and a reluctance to disclose certain sensitive information. However, snowball sampling could lead to bias in the results due to a non-representative sample. Therefore, the drawn conclusions should be limited only to the observed sample.
The findings regarding taxpayers’ tax knowledge indicate that taxpayers perceive themselves as having an average level of general tax knowledge. When comparing the results of tax knowledge perception levels between male and female taxpayers in Slovenia, it was revealed that females have a lower overall tax knowledge level than males (TAXK). Among the dimensions of tax knowledge perceptions, females tend to believe more than males that the taxation obligation in the existing income tax system is fair and equitable. The highest score in male perception was achieved for the statement about their lack of technical knowledge regarding deductions from their tax liability. On the other hand, both females and males had the lowest average tax knowledge level when it came to the technical knowledge of whether it is acceptable to overstate tax deductions on one’s tax returns. It should be emphasized that our research measured the perception of tax knowledge, not the reasons influencing perception, and not differences in actual tax knowledge between females and males. Statistically, females in Slovenia achieve higher levels of formal education than males (SURS 2023). Nevertheless, their perception is that their tax knowledge is lower than that of males. The explanation for such results could be attributed to various underlying mechanisms, including historical, sociological, psychological, economic, institutional, or others. According to Yao et al. (2023) and their family financial socialization process theory, as well as the conclusions of Zhu (2018) and Deenanath et al. (2019), individuals’ subjective self-evaluated knowledge correlates with socialization processes. These factors undoubtedly influence the educational self-image of females in Slovenia. Further research is needed to examine this more precisely. If we compare our results to those from Saad’s (2010) study, our taxpayers exhibit notably much lower levels of perceived general, legal, and technical tax knowledge, irrespective of gender. Still, as the differences in overall tax knowledge in our research were significant, the research subhypothesis H1a, that the level of tax knowledge differs significantly between females and males, was accepted. These results are similar to Fallan’s (1999) conclusion that males and females may possess varying levels of tax knowledge, but these differences were not substantial in his research; therefore, he sees that gender lacks predictive influence. This result does not align with the findings of Natasha and Yustina’s (2020) study, in which no gender differences in tax knowledge and tax compliance were identified. They concluded that socialization could be conducted uniformly regardless of gender, as males and females absorb tax knowledge from the same media in the same amount (Natasha and Yustina 2020).
The results of the research subhypothesis H1b indicate that the variability in the level of overall tax knowledge perception is higher among taxpayers from rural settlements compared to taxpayers from urban areas. Taxpayers in rural areas perceive the existing income tax system as sufficient for most citizens, even though it may not be perfect. However, urban taxpayers scored the highest on the statement about having low knowledge of tax deductions (technical knowledge). On the other hand, rural taxpayers tend to disapprove of the acceptability of overstating tax deductions on their tax returns (technical knowledge), while urban taxpayers have slightly better legal knowledge concerning appeals against tax authority assessments compared to those in rural areas. However, the research subhypothesis H1b, which suggests that the level of tax knowledge significantly differs between rural and urban taxpayers, was not accepted. There are no statistically significant differences in overall tax knowledge (TAXK), although there are statistically significant differences in LK1, TK, and TK3. Our finding shows that taxpayers’ tax knowledge perception is independent of their living area (urban and rural). Potential reasons behind these results might stem from the fact that the Slovenian tax system (tax administration) is well-organized, has good information support, and taxpayers are informed about crucial tax matters, such as meeting tax obligations (tax return deadlines), primarily through public media (TV, radio), and online.
Further, our results also show that both females and males have achieved the highest average value in the variable of vertical fairness, indicating that higher-income earners should pay more taxes than lower-income earners. Both females and males mostly disagree with the idea that tax evasion is justified as ethical, even if the tax system is not fair. When measuring their perceived attitude toward personal fairness, they both perceive a specific group of taxpayers, namely board members, as not paying their fair share of taxes under the current income tax system. According to the results, males may have a slightly higher level of variability in the distribution of the fairness perceptions (FAIRP) variable compared to females. However, the average levels of the FAIRP variable appear to be quite similar between males and females. When comparing taxpayers based on the type of settlement they live in, it becomes evident that there are numerous similarities. Both taxpayers from rural settlements and those from urban settlements have achieved the highest average value in the variable of vertical fairness, which suggests that higher-income earners should pay more taxes than lower-income earners. However, both categories recorded the lowest average values in the variable of general fairness. This implies that tax evasion is considered ethical if the tax system is perceived as unfair. Taxpayers from rural and urban settlements exhibit quite similar distributions in the FAIRP variable. The subhypotheses H2a and H2b, which hypothesized significant differences in tax fairness levels between females and males, as well as between rural and urban taxpayers, were rejected. Statistically significant differences were found only between respondents from rural and urban settlements in variables RF1 (and consequently RF) and PF6, but not in the overall variable of fair perception (FAIRP). Our results are not in line with Hundsdoerfer and Eva’s (2020) findings, where gender disparities in perceptions of fairness concerning distributive and procedural justice were confirmed. Male participants are particularly responsive to procedural justice violations in their fairness perceptions, while female participants tend to adjust their fairness perceptions based on the outcomes of the tax allocation procedure (Hundsdoerfer and Eva 2020).
The third hypothesis (H3) predicts a positive influence of tax knowledge on the perception of tax fairness dimensions. The results show that all observed correlations between tax knowledge (TAXK) and fairness dimensions were statistically significant, but weak. General fairness and redistributive fairness exhibited the most moderate associations among all dimensions with tax knowledge. Still, further analysis, using Kendall’s test, confirmed statistically significant correlations between tax knowledge and various tax fairness dimensions, including general, exchange, redistributive, personal, and administrative fairness. However, the correlations were negative for horizontal and vertical fairness, also known as distributive fairness. Horizontal fairness pertains to providing equitable tax treatment to taxpayers in similar economic circumstances, while vertical fairness evaluates taxpayers’ ability to pay and their preference for the tax rate structure (progressive or not). The negative relationship suggests that higher tax knowledge does not necessarily lead to a higher perception of distributive fairness within the existing income tax system. Therefore, the third research hypothesis, H3, was partially accepted. One explanation for this finding is mostly like that of Saad (2010), who suggests that taxpayers may believe that they should not be taxed equally solely based on income without considering their financial responsibilities or social welfare. Our findings align with previous studies (Saad 2010; Fallan 1999; White 1990) that assert tax knowledge increases taxpayers’ perceptions of tax fairness. However, the findings do not fully align with Eriksen and Fallan (1996), whose conclusions suggest that the perception of fairness increases with tax knowledge, and with the more knowledgeable taxpayers viewing the tax system more favorably. We defined tax knowledge and tax fairness as multidimensional, but the Eriksen and Fallan (1996) study did not distinguish between these dimensions. According to our study, higher tax knowledge does not appear to support taxpayers in perceiving greater distributive fairness.
Policymakers should consider addressing this problem. Based on our results, we propose specific policy recommendations in the field of educational initiatives, which should be tailored and gender-specific at all formal educational levels as well as informal educational levels. For this purpose, tailored communication strategies and approaches should be employed. The OECD (2021) report presents 149 educational initiatives in 59 developed and developing countries, providing cross-country comparisons as a tool to assist policymakers in this regard. In the past, Slovenia has already implemented some effective communication tools to raise awareness about individuals’ tax obligations and payment deadlines, utilizing public communication channels such as TV shows, radio, and modern e-administration tools. However, there is a deficiency in educating individuals, providing in-depth tuition, and building new knowledge and skills in this regard. Tools similar to the TaxEdu portal at the European level could be developed in Slovenia as well, utilizing short videos but in the Slovene language.
More detailed reasons for such results and (non)differences between different groups of respondents should be investigated in future research, with a focus solely on this narrow topic. Nevertheless, based on Eriksen and Fallan’s (1996) conclusion, it remains essential to provide more tax knowledge to larger segments of society to improve the perception of tax fairness and enhance tax compliance.
6. Conclusions
The aim of this study was to determine the level of tax knowledge and tax fairness perception of the tax system among Slovene taxpayers, with a focus on gender and settlement size differences. Additionally, the study aimed to investigate the correlations between tax knowledge and tax fairness dimensions.
This article presents evidence indicating that tax knowledge differs between male and female taxpayers. This gap should be addressed through the development of appropriate educational programs in tax education. These programs should promote voluntary compliance and enhance taxpayers’ understanding of the tax system, particularly when disseminating information to both male and female taxpayers using different strategies. It also demonstrates that settlement size is not a relevant factor influencing tax knowledge among Slovene taxpayers. However, when examining tax fairness, the results lead to different conclusions. Tax fairness consists of various dimensions, and our research revealed no differences based on gender and settlement size. When the correlation between tax knowledge and tax fairness perception was measured, the results showed statistically significant but weak correlations in both directions, depending on the fairness dimension.
To overcome this limitation in further studies, a probability sampling approach should be employed. One approach would be to use a stratified random sampling approach based on the most important characteristics of the population, such as income level, age, gender, etc. However, in that case, much higher non-response rates should be expected, along with significantly higher survey costs.
In this paper, the conducted analyses were based on the Kruskal–Wallis rank sum test and Kendall’s coefficient of rank Tau-b. The choice of the statistical approach was determined by the type of observed variables, which were defined in the questionnaire as questions given on the Likert scale with only five answer options. Additionally, the choice of the statistical analysis was guided by the research aims and hypotheses. Therefore, the range of possible appropriate statistical methods was very narrow but straightforward. For future research, it is recommended to redefine survey questions so that they are quantitative variables. In that case, a wider range of different statistical analyses could be employed.
The practical application of this study’s findings suggests that policymakers should also consider taxpayers’ perceptions of distributive fairness and tax knowledge when developing communication strategies and educational programs. These strategies should be designed to enhance the distributive fairness dimension, benefiting taxpayers. According to our results, they should be applied and presented differently by gender, as a statistically significant relationship was found. Further testing in other countries using our measurement instrument would be necessary to determine whether these gender differences exist. A subject for further debate and research may also be whether this approach is economically meaningful or not. If taxpayers perceive tax knowledge gender-dependent, authorities and educators should adapt their approaches by using different communication strategies to enhance tax compliance through improved tax knowledge. The tax knowledge dimensions are vital components in shaping compliance behavior. Understanding the influence of specific factors places policymakers in a stronger position to affect the compliance behavior of taxpayers and devise more precise strategies for improving various facets of tax knowledge. Since we have only partially confirmed the correlation between tax knowledge and tax fairness, future research could explore other economic and psychological factors and their relationship with tax knowledge and tax fairness. In tax practice, there can be a distinction between perception and actual tax knowledge, so future research could measure the actual knowledge of taxpayers, which would require the development of a new measurement instrument. Also, other tax-related variables, such as tax liability, should be included in further studies. This study aimed to evaluate tax knowledge levels and perceptions of tax fairness among Slovenian taxpayers, with a particular emphasis on gender and settlement size disparities. To achieve this, the questionnaire and sampling methods were tailored to yield preliminary findings and insights. Demographic factors such as education, income, and marital status were predominantly employed to profile the sample and respondents. Future research endeavors should involve refining the questionnaire and employing a stratified random sampling approach to more accurately examine the interplay between gender, tax knowledge, and other demographic variables. Additionally, applying advanced multivariate approaches such as an ordered probit or ordered logit model would enhance the understanding and depiction of these relationships.
Author Contributions
Conceptualization, L.H., I.P. and B.Ž.; methodology, L.H. and B.Ž.; software, B.Ž.; validation, L.H. and B.Ž.; formal analysis, L.H., I.P. and B.Ž.; investigation, L.H., I.P. and B.Ž.; resources, L.H., I.P. and B.Ž.; data curation, L.H. and B.Ž.; writing—original draft preparation, L.H., I.P. and B.Ž.; writing—review and editing, L.H., I.P. and B.Ž.; visualization, L.H., I.P. and B.Ž.; supervision, L.H., I.P. and B.Ž.; project administration, L.H. and I.P. All authors have read and agreed to the published version of the manuscript.
Funding
This research received no external funding.
Informed Consent Statement
Not applicable.
Data Availability Statement
Upon request from the corresponding author.
Conflicts of Interest
The authors declare no conflicts of interest.
Appendix A. Variable Definition
| Code | |
| TAXK | Tax knowledge perceptions |
| GK | Relates to an idea of the tax system/structure and its purpose. |
| LK | Emphasises taxpayers’ knowledge on the regulation aspects of the income tax system, responsibility, rights and the penalty for non-compliance. |
| TK | Concerns with taxpayers’ ability to fill their tax return. |
| FAIRP | Fairness Perceptions |
| GF | Measures general taxpayers’ judgments about fairness of the income system. |
| EF | Expresses a reciprocal exchange between taxpayers and the government. |
| HF | Considers equitable tax treatment for taxpayers with comparable economic positions. |
| VF | Assumes the ability to pay and preference for tax progressive rate structure. |
| RF | Addresses the fairness of imposed punishments and penalties. |
| PF | Involves the self-interest of the taxpayers. |
| AF | Pertains to the fairness of the content of the tax law. |
References
- Abate, Abera Aynekulu. 2019. Factors affecting presumptive tax collection in Ethiopia: Evidence from category “c” taxpayers in bahir dar city. Journal of Tax Administration 5: 74–96. [Google Scholar] [CrossRef]
- Agresti, Alan. 2010. Analysis of Ordinal Categorical Data, 2nd ed. New York: John Wiley & Sons. [Google Scholar]
- Ali, Azwadi, and Norsiah Ahmad. 2014. Trust and Tax Compliance among Malaysian Working Youth. International Journal of Public Administration 37: 389–96. [Google Scholar] [CrossRef]
- Allingham, Michael G., and Agnar Sandmo. 1972. Income tax evasion: A theoretical analysis. Journal of Public Economics 1: 323–38. [Google Scholar] [CrossRef]
- Alm, James. 2019. What motivates tax compliance? Journal of Economic Surveys 33: 353–88. [Google Scholar] [CrossRef]
- Alm, James, Kim M. Bloomquist, and Michael McKee. 2017. When you know your neighbour pays taxes: Information, peer effects and tax compliance. Fiscal Studies 38: 587–613. [Google Scholar] [CrossRef]
- Amin, Shahnaz Noorul, Putri Zaqqeya Amin Buhari, Abu Sofian Yaacob, and Zuberi Iddy. 2022. Exploring the Influence of Tax Knowledge in Increasing Tax Compliance by Introducing Tax Education at Tertiary Level Institutions. Open Journal of Accounting 11: 57–70. [Google Scholar] [CrossRef]
- Amponsah, Stephen, and Kofi Osei Adu. 2017. Socio-demographics of tax stamp compliance in upper Denkyira east municipal and upper Denkyira west district in Ghana. International Journal of Law and Management 59: 1315–30. [Google Scholar] [CrossRef]
- Andersson, Per F. 2017. Democracy, Urbanization, and Tax Revenue. Studies in Comparative International Development 53: 111–50. [Google Scholar] [CrossRef]
- Azmi, Anna Azriati Che, Suria Zainuddin, Mohd Zulkhairi Mustapha, and Yusni Naw. 2016. The mediating effect of tax fairness on the relationship between knowledge, complexity and voluntary tax compliance. Asian Journal of Accounting Perspectives 9: 1–12. [Google Scholar] [CrossRef]
- Azmi, Anna Che, and Kamala A. Perumal. 2008. Tax Fairness Dimensions in an Asian Context: The Malaysian Perspective. International Review of Business 4: 11–19. [Google Scholar]
- Bayram, Nuran, Mine Aydemir, Zuhal Yıldırım, and Reyhan Leba Tansöker. 2017. Confirmatory Factor Analysis on Tax Compliance Intentions, General Fairness, Procedural Fairness and Social Norms. Business and Economics Research Journal 8: 749–58. [Google Scholar] [CrossRef]
- Beck, Marisa, Rivers Nicholas, and Yonezawa Hidemichi. 2016. A rural myth? Sources and implications of the perceived unfairness of carbon taxes in rural communities. Ecological Economics 124: 124–34. [Google Scholar] [CrossRef]
- Becker, Gary S. 1968. Crime and punishment: An economic approach. Journal of Political Economy 76: 169–217. [Google Scholar] [CrossRef]
- Bergolo, Marcelo L., Leites Martin, Truglia Ricardo Perez, and Strehl Matias. 2020. What Makes a Tax Evader? NBER Working Paper no. w28235. Cambridge: National Bureau of Economic Research, pp. 1–52. [Google Scholar]
- Bornman, Marina, and Pusheletso Ramutumbu. 2019. A conceptual framework of tax knowledge. Meditari Accountancy Research 27: 823–39. [Google Scholar] [CrossRef]
- Braithwaite, Valerie, Reinhart Monika, Mearns Malcolm, and Graham Rachelle. 2001. The Community Hopes, Fears and Actions Survey, Goals and Measures. Centre for Tax System Integrity Working Paper 3. Canberra: The Australian National University. [Google Scholar]
- Carley, Kathleen M., Dawn C. Robertson, Michael K. Martin, Ju-Sung Lee, Jesse L. St. Charles, and Brian R. Hirshman. 2010. Predicting Intentional and Inadvertent Noncompliance, Recent Research on Tax Administration and Compliance. Selected Papers Given at the 2010 IRS Research Conference. Available online: http://www.casos.cs.cmu.edu/publications/papers/CMU%20IRS%20Research%20Conference_v7.pdf (accessed on 3 November 2023).
- Castañeda, Néstor. 2023. Fairness and Tax Morale in Developing Countries. Studies in Comparative International Development 31: 1–25. [Google Scholar] [CrossRef]
- Chan, Chan W., Troutman Coleen S., and O’Bryan David. 2000. An expanded model of taxpayer compliance: Empirical evidence from the United States and Hong Kong. Journal of International Accounting, Auditing and Taxation 9: 83–103. [Google Scholar] [CrossRef]
- Christain Aid. 2014. Taxing Man and Woman—Why Gender Is Crucial for a Fair Tax System. Available online: https://www.oecd.org/dac/gender-development/44896295.pdf (accessed on 20 October 2023).
- Chucks, Akan David, and Lilian Azaka. 2023. The perception of tax fairness and tax knowledge of taxpayers in response to the Finance Act of 2019–2023. International Journal of Science Academic Research 4: 6368–74. [Google Scholar]
- Coelho, Maria, Davis Aieshwarya, Klemm Alexander, and Buitron Carolina Osorio. 2022. Gendered Taxes: The Interaction of Tax Policy with Gender Equality. IMF Working Paper No WP/22/26. Washington, DC: International Monetary Fund. [Google Scholar]
- Comunale, Christie L., Charles A. Barragato, and Denise Buhrau. 2019. Framing tax audit risks: The role of temporal framing and perceived fairness. Advances in Accounting Behavioral Research 22: 1–9. [Google Scholar] [CrossRef]
- Craig, Ashley C., and Joel Slemrod. 2022. Tax Knowledge and Tax Manipulation: A Unifying Model. Working Paper 30151. Cambridge: National Bureau of Economic Research. [Google Scholar]
- Damajanti, Anita. 2015. Pengaruh Pengetahuan Terhadap Kepatuhan Wajib Pajak Perorangan Di Kota Semarang. Jurnal Dinamika Sosial Budaya 17: 12–28. [Google Scholar] [CrossRef]
- Danes, Sharon M. 1994. Parental Perceptions of Children’s Financial Socialization. Financial Counseling and Planning 5: 23. [Google Scholar]
- Danes, Sharon M., and Heather Haberman. 2007. Teen Financial Knowledge, Self-Efficacy, and Behavior: A Gendered View. Journal of Financial Counseling and Plannin 18: 13. [Google Scholar]
- Danes, Sharon M., and Katherine Brewton. 2014. The Role of Learning Context in High School Students’ Financial Knowledge and Behavior Acquisition. Journal of Family and Economic Issues 35: 81–94. [Google Scholar] [CrossRef]
- D’Attoma, John, Volintiru Clara, and Steinmo Sven. 2017. Willing to share? Tax compliance and gender in Europe and America. Research and Politics 4: 1–10. [Google Scholar] [CrossRef]
- Dayioğlu Erul, Rana. 2020. Socio-Economic Variables and Tax Compliance In The Scope Of Fiscal Sociology: A Research On The European Union And OECD. The Journal of Social Science 4: 1–7. [Google Scholar] [CrossRef]
- Deenanath, Veronica, Sharon M. Danes, and Jang Joyoung. 2019. Purposive and Unintentional Family Financial Socialization, Subjective Financial Knowledge, and Financial Behavior of High School Students. Journal of Financial Counseling and Planning 30: 83–96. [Google Scholar] [CrossRef]
- Devos, Ken. 2016. A comparative study of compliant and non-compliant individual taxpayers in Australia. Journal of Business and Policy Research 2: 180–96. [Google Scholar]
- Dissanayake, Nadee, and Sandaram P. Premaratna. 2020. Influence of Business Location on Tax Compliance: An Application of the Slippery-Slope Framework. Proceeding of the Open University Research Sessions (OURS 2019): 1–7. Available online: https://www.researchgate.net/publication/350035070_INFLUENCE_OF_BUSINESS_LOCATION_ON_TAX_COMPLIANCE_AN_APPLICATION_OF_THE_SLIPPERY-SLOPE_FRAMEWORK (accessed on 20 October 2023).
- Druckman, Daniel. 2020. Looking back and looking forward in negotiation and conflict research. International Negotiation 25: 130–50. [Google Scholar] [CrossRef]
- Druckman, Daniel, and Lynn M. Wagner. 2016. Justice and negotiation. Annual Review of Psychology 67: 387–413. [Google Scholar] [CrossRef] [PubMed]
- Dunn, Olive Jean. 1964. Multiple comparisons using rank sums. Technometrics 6: 241–52. [Google Scholar] [CrossRef]
- Edgley, Carla, and Kevin Holland. 2021. “Unknown unknowns” and the tax knowledge gap: Power and the materiality of discretionary tax disclosures. Critical Perspectives on Accounting 81: 102227. [Google Scholar] [CrossRef]
- Eriksen, Knut, and Lars Fallan. 1996. Tax knowledge and attitudes towards taxation; A report on a quasiexperiment. Journal of Economic Psychology 17: 387–402. [Google Scholar] [CrossRef]
- European Commission. 2019. Estimating International Tax Evasion by Individuals. Taxation Papers Taxation and Customs Union Working Paper No 76-2019. Brussels: European Commission. [Google Scholar]
- Fallan, Lars. 1999. Gender, Exposure to Tax Knowledge and Attitudes towards Taxation: An Experimental Approach. Journal of Business Ethics 18: 173–84. [Google Scholar] [CrossRef]
- Farrar, Jonathan, Dawn W. Massey, Errol Osecki, and Linda Thorne. 2020. Tax Fairness: Conceptual Foundations and Empirical Measurement. Journal of Business Ethics 162: 487–503. [Google Scholar] [CrossRef]
- Farrar, Jonathan, Steven E. Kaplan, and Linda Thorne. 2022. The Effect of Interactional Fairness and Detection on Taxpayers’ Compliance Intentions. Journal of Business Ethics 154: 167–80. [Google Scholar] [CrossRef]
- Fauziati, Penerbit, Arie Frinola Minovia, Resti Yulistia Muslim, and Rasidah Nasrah. 2016. The Impact of Tax Knowledge on Tax Compliance Case Study in Kota Padang. Indonesia Journal of Advanced Research in Business and Management Studies 2: 22–30. [Google Scholar]
- Formanova, Lucie, Michal Mádr, Břetislav Andrlík, and Veronika Hrabalová. 2021. Factors influencing the level of tax literacy of students of bachelor study programmes in economics at Faculties of Economics. Law and Economics Review 12: 308–23. [Google Scholar] [CrossRef]
- Gerbing, Monica Diane. 1988. An Empirical Study of Taxpayer Perceptions of Fairness. Ph.D. dissertation, University of Texas at Austin, Ann Arbor, MI, USA. [Google Scholar]
- Ghani, Hazman Hadi Abdul, Nadiah Abd Hamid, Soliha Sanusi, and Roszilah Shamsuddin. 2020. The Effect of Tax Knowledge, Compliance Costs, Complexity and Morale Towards Tax Compliance Among Self-Employed in Malaysia. Global Business and Management Research: An International Journal 12: 18–32. [Google Scholar]
- Gilligan, George, and Grant Richardson. 2005. Perceptions of Tax Fairness and Tax Compliance in Australia and Hong Kong: A Preliminary Study. Journal of Financial Crime 12: 331–43. [Google Scholar] [CrossRef]
- Gobena, Lemessa Bayissa, and Marius Van Dijke. 2017. Fear and caring: Procedural justice, trust, and collective identification as antecedents of voluntary tax compliance. Journal of Economic Psychology 62: 1–16. [Google Scholar] [CrossRef]
- Grown, Caren, Ozer Ceren, and Bronchi Chiara. 2022. Gender Differences in Taxation: Why Do They Matter? Available online: https://blogs.worldbank.org/developmenttalk/gender-differences-taxation-why-do-they-matter (accessed on 10 October 2023).
- Gunaasih, Sang Ayu Putu Piastini. 2022. Investigation of taxation knowledge, services, and sanctions of the head of village government financial affairs of Gunung Kidul regency in Indonesia. In Environmental, Social, and Governance Perspectives on Economic Development in Asia. Bingley: Emerald Publishing Limited, pp. 157–67. [Google Scholar] [CrossRef]
- Gunnarsson, Åsa, Schratzenstaller Margit, and Spangenberg Ulrike. 2017. Gender Equality and Taxation in the European Union. Available online: http://www.europarl.europa.eu/supporting-analyses (accessed on 7 October 2023).
- Güzel, Sonnur Aktas, Gökhan Özer, and Murat Özcan. 2019. The effect of the variables of tax justice perception and trust in government on tax compliance: The case of Turkey. Journal of Behavioral and Experimental Economics 78: 80–86. [Google Scholar] [CrossRef]
- Hartner, Martina, Rechberger Silvia, Kirchler Erich, and Schabmann Alfred. 2008. Procedural fairness and tax compliance. Economic Analysis & Policy 38: 137–52. [Google Scholar] [CrossRef]
- Hofmann, Eva, Hoelzl Erik, and Kirchler Erich. 2008. Preconditions of Voluntary Tax Compliance: Knowledge and Evaluation of Taxation, Norms, Fairness, and Motivation to Cooperate. Zeitschrift für Psychologie 216: 209–17. [Google Scholar] [CrossRef]
- Hoong Voon, Yuen, Che Azmi Anna, and Jayasingam Sharmila. 2023. The effects of concession timing, perceived fairness and aggressiveness on tax negotiation offers. Pacific Accounting Review 35: 1–18. [Google Scholar] [CrossRef]
- Hundsdoerfer, Jochen, and Matthaei Eva. 2020. Gender Discriminatory Taxes, Fairness Perception, and Labor Supply. Discussion Paper, No. 2020/6. Berlin: Freie Universität Berlin, School of Business & Economics. [Google Scholar] [CrossRef]
- Inasius, Fany. 2019a. Factors influencing SME tax compliance: Evidence from Indonesia. International Journal of Public Administration 42: 367–79. [Google Scholar] [CrossRef]
- Inasius, Fany. 2019b. Voluntary and enforced tax compliance: Evidence from small and medium- sized enterprises in Indonesia. Advances in Taxation 26: 99–111. [Google Scholar] [CrossRef]
- Jimenez, Peggy, and Govind S. Iyer. 2016. Tax compliance in a social setting: The influence of social norms, trust in government, and perceived fairness on taxpayer compliance. Advances in Accounting, incorporating Advances in International Accounting 34: 17–26. [Google Scholar] [CrossRef]
- Juliobenedrick, Bryan, Draven Davidson, and Ilham Condro Prabowo. 2023. The Relationships between Social Media Narcissism, Tax Knowledge, and Trust in Government on Tax Compliance. Paper presented at E3S Web of Conferences—The 5th International Conference of Biospheric Harmony Advanced Research (ICOBAR 2023), Jakarta, Indonesia, June 27; Les Ulis: EDP Sciences, vol. 426, p. 02143. [Google Scholar]
- Kaiser, Tim, Annamaria Lusardi, Lukas Menkhoff, and Carly Urban. 2021. Financial education affects financial knowledge and downstream behaviors. Journal of Financial Economics 145: 255–72. [Google Scholar] [CrossRef]
- Kasippilai, Jeyapallan. 2000. Taxpayer knowledge index as a clue for non-compliance. Journal on Pakistan’s Taxation Laws 81: 45–91. [Google Scholar]
- Kassa, Erstu Tarko. 2021. Factors influencing taxpayers to engage in tax evasion: Evidence fromWoldia City administration micro, small, and large enterprise taxpayers. Journal of Innovation and Entrepreneurship 10: 8. [Google Scholar] [CrossRef]
- Kastlunger, Barbara, Dressler Stefan G., Kirchler Erich, Mittone Luigi, and Voracek Martin. 2010. Sex differences in tax compliance: Differentiating between demographic sex, gender-role orientation, and prenatal masculinization (2D: 4D). Journal of Economic Psychology 31: 542–52. [Google Scholar] [CrossRef]
- Kirchler, Erich. 2007. The Economic Psychology of Tax Behavior. New York: Cambridge University Press. [Google Scholar]
- Kirchler, Erich, Hoelzl Erik, and Wahl Ingrid. 2008. Enforced versus Voluntary Tax Compliance: The Slippery Slope Framework. Journal of Economic Psychology 29: 210–25. [Google Scholar] [CrossRef]
- Kruskal, William H., and Wallis W. Allen. 1952. Use of ranks in one-criterion variance analysis. Journal of the American Statistical Association 47: 583–621. [Google Scholar] [CrossRef]
- Kumi, Richmond, and Bannor Richard Kwasi. 2023. Job performance, knowledge and perceived power of tax officers on tax morale amongst agrochemical traders in Ghana. Arab Gulf Journal of Scientific Research 41: 260–82. [Google Scholar] [CrossRef]
- LeBaron, Ashley B., and Heather H. Kelley. 2020. Financial Socialization: A Decade in Review. Journal of Family and Economic Issues 42: 195–206. [Google Scholar] [CrossRef] [PubMed]
- Lewis, Alan. 1982. The social psychology of taxation. The British Psychological Society 21: 151–58. [Google Scholar] [CrossRef]
- Lohse, Tim, and Salmai Qari. 2014. Gender differences in deception behavior: The role of the counterpart. Applied Economics Letters 21: 702–5. [Google Scholar] [CrossRef]
- Loo, Ern Chen. 2006. The Influence of the Introduction on Self-Assessment on Compliance Behaviour of Individual Taxpayers in Malaysia. Ph.D. thesis, University of Sydney, Sydney, Australia. [Google Scholar]
- Maqsudi, Achmad, Tri Ratnawati, and Slamet Riyadi. 2021. Socialization, Service and Knowledge Matter with Taxpayer Compliance: An Empirical Study in Indonesia. Journal of Asian Finance, Economics and Business 8: 89–95. [Google Scholar]
- Mckenzie, Leanne Carvalho. 2022. U.S. Financial Literacy: Does Urban-Rural Residency Matter? Theses and Dissertations. Available online: https://scholarsjunction.msstate.edu/td/5601 (accessed on 15 November 2023).
- McKerchar, Margaret. 2001. The Study of Income Tax Complexity and Unintentional Non-Compliance: Research Method and Preliminary Findings (October 2001). Atax Discussion Paper No. 6. Camperdown: University of Sydney. [Google Scholar]
- Mohamad, Marziana, Norsalihah Mohd Nor, Norshiela Bakar, and Winnie Lemi Anak Nanta. 2013. Accounting vs Non Accounting Majors: Perceptions on Tax Knowledge, Fairness and Perceived Behavioural Control. International Journal of Asian Social Science 3: 1887–96. [Google Scholar]
- Mohammed, Hunad, and Anita Tangl. 2024. Taxation Perspectives: Analyzing the Factors behind Viewing Taxes as Punishment—A Comprehensive Study of Taxes as Service or Strain. Journal of Risk and Financial Management 5: 5. [Google Scholar] [CrossRef]
- Moore, Mick. 2019. Intelligent Government: How Research Can Help Increase Tax Compliance. ATAP Working Paper, No. 9. Brighton: International Centre for Tax and Development. Available online: https://opendocs.ids.ac.uk/opendocs/bitstream/handle/20.500.12413/14501/ATAP9.pdf?sequence=42&isAllowed=y (accessed on 10 October 2023).
- Mukhlis, Imam, Sugeng Hadi Utomo, and Yuli Soesetyo. 2013. Increasing Tax Compliance Through Strengtheing Capacity of Education Sector for Export Oriented SMEs Handicarft Field in East Java Indonesia. European Scientific Journal 10: 170–84. [Google Scholar]
- Mukhlis, Imam, Sugeng Hadi Utomo, and Yuli Soesetyo. 2015. The role of taxation education on taxation knowledge and its effect on tax fairness as well as tax compliance on handicraft SMEs sectors in Indonesia. International Journal of Financial Research 6: 161–69. [Google Scholar] [CrossRef]
- Natasha, Irina, and Andi Ina Yustina. 2020. Causal Relations Between Knowledge, Norms, and Tax: A Study of Gender Differences on Taxpayers. Ekuilibrium: Journal Ilmiah Bidang Ilmu Ekonomi 15: 14–26. [Google Scholar] [CrossRef]
- Nerudova, Danuse, Janova Jitka, Hampel David, Dobranschi Marian, and Rozmahel Petr. 2019. Sustainability of the Taxation Systems in the Eu: A Proposal of an Evaluation Model. Brussels: European Commission. [Google Scholar]
- Nguyen, Thu Hien. 2022. The Impact of Non-economic Factors on Voluntary Tax Compliance Behaviou: A Case Studa of Smal and Medium Enterprises in Vetnam. Economies 20: 179. [Google Scholar] [CrossRef]
- Nicoleta, Barbuta-Misu. 2011. A review of factors for tax compliance. Economics and Applied Informatics Journal 1: 69–76. [Google Scholar]
- Niesiobędzka, Malgorzata, and Sabina Kołodziej. 2020. The fair process effect in taxation: The roles of procedural fairness, outcome favorability and outcome fairness in the acceptance of tax authority decisions. Current Psychology 39: 246–53. [Google Scholar] [CrossRef]
- OECD. 2006. Investment Priorities for Rural Development. Edinburgh: OECD Publishing. [Google Scholar]
- OECD. 2015. Building Tax Culture, Compliance and Citizenship: A Global Source Book on Taxpayer Education. Paris: OECD Publishing. Available online: https://www.hvtc.edu.vn/Portals/0/files/6357919998959274612314481e.pdf (accessed on 15 January 2024).
- OECD. 2019a. Rural 3.0 Highlights People-Centred Rural Policy—Policy Highlights. Paris: OECD Publishing. Available online: https://www.oecd.org/rural/rural-development-conference/documents/Rural-3.0-Policy-Highlights.pdf (accessed on 15 October 2023).
- OECD. 2019b. Tax Morale: What Drives People and Businesses to Pay Tax? Paris: OECD Publishing. [Google Scholar]
- OECD. 2021. Building Tax Culture, Compliance and Citizenship: A Global Source Book on Taxpayer Education, 2nd ed. Paris: OECD Publishing. [Google Scholar]
- OECD. 2022. Tax Policy and Gender Equality: A Stocktake of Country Approaches. Paris: OECD Publishing. [Google Scholar]
- Oladipupo, Adesina, and Uyioghosa Obazee. 2016. Tax knowledge, penalties and tax compliance in small and medium scale enterprises in Nigeria. IBusiness 8: 1–9. [Google Scholar] [CrossRef]
- Palil, Mohd Rizal. 2010. Tax Knowledge and Tax Compliance Determinants in Self-Assessment System. Ph.D. thesis, University of Birmingham, Birmingham Business School, Birmingham, UK. [Google Scholar]
- Palil, Mohd Rizal, Akir Mohd Rusyidi, and Ahmad Wan Fadilla B. 2013. The perception of tax payers on tax knowledge and tax education with level of tax compliance: A study the influences of religiosity. ASEAN Journal of Economics, Management and Accounting 1: 118–29. [Google Scholar]
- Pateman, Tim. 2011. Rural and urban area: Comparing lives using rural/urban classification. Regional Trends 43: 11–86. [Google Scholar] [CrossRef]
- Phyllis, Alexander, and Merima Balavac-Orlic. 2022. Tax morale: Framing and fairness. Economic Systems 46: 100936. [Google Scholar]
- Puklavec, Žiga, Christoph Kogler, Olga Stavrova, and Marcel Zeelenberg. 2023. What we tweet about when we tweet about taxes: A topic modelling approach. Journal of Economic Behavior and Organization 212: 1242–54. [Google Scholar] [CrossRef]
- Putri, Khansa Chetisa, and Lintang Venusita. 2019. The Effect of Gender, Education, and Nationalism Level of Individual Taxpayers Toward Tax Mojokerto Compliance: A Case Study on Kpp Pratama. KnE Social Sciences 3: 170–87. [Google Scholar] [CrossRef]
- Remali, Azrinawati Mohd, Aliyah Nur Satar Abdul Satar, Farah Nor Adiba Mamad, Nut Fatini Zainal Abidin, and Siti Zafirah Zainuddin. 2018. Tax Knowledge, Tax Penalty and Tax Rate on Tax Compliance among Small Medium Enterprise in Selangor. Global Business and Management Research: An International Journal 10: 12–23. [Google Scholar]
- Remali, Azrinawati Mohd, and Abdul Jalil. 2021. Does Education Influence Tax Compliance? Global Business and Management Research: An International Journal 13: 963–72. [Google Scholar]
- Saad, Natrah. 2010. Fairness Perceptions and Compliance Behaviour: The Case of Salaried Taxpayers in Malaysia after Implementation of the Self-Assessment System. eJournal of Tax Research 8: 32–63. [Google Scholar] [CrossRef]
- Saad, Natrah. 2012. Perceptions of Tax Fairness and Tax Compliance Behaviour: A Comparative Study. Jurnal Pengurusan 36: 89–100. [Google Scholar]
- Saad, Natrah. 2014. Tax Knowledge, Tax Complexity and Tax Compliance: Taxpayers’ View. Procedia—Social and Behavioral Sciences 109: 1069–75. [Google Scholar] [CrossRef]
- Sikayu, Susan Hydra, Rahmat Mariam, and Chan Ai Nyet. 2022. Fairness, Transparency and Attitude towards Tax Evasion amongst Owners of SMEs. International Journal of Service Management and Sustainability 7: 145–66. [Google Scholar] [CrossRef]
- Sing, Tee Leap, and Zainol Bidin. 2020. Sales tax compliance and its determinants in Malaysia. Advanced International Journal of Banking, Accounting and Finance (Aijbaf) 2: 1–20. [Google Scholar] [CrossRef]
- Singh, Anupama, Singh Aarti, Kumar Sharma Haresh, and Majumder Saibal. 2023. Criteria Selection of Housing Loan Based on Dominance-Based Rough Set Theory: An Indian Case. Journal of Risk and Financial Management 309: 309. [Google Scholar] [CrossRef]
- Stotsky, Janet Gale. 1996. Gender Bias in Tax Systems. IMF Working Paper No. 96/99. Available online: https://papers.ssrn.com/sol3/papers.cfm?abstract_id=882995 (accessed on 5 October 2023).
- Sundari, Retno Ika, Anis Chariri, and Dwi Cahyo Utomo. 2022. Does Tax Awareness Mediate Tax Amnesty and Tax Authorities toward Tax Compliance? General Management 23: 269–77. [Google Scholar] [CrossRef]
- SURS. 2023. Statistical Office of the Republic of Slovenia. Available online: https://www.stat.si/StatWeb/News/Index/11504 (accessed on 30 January 2024).
- Surugiu, Marius-Razvan, Christina-Raluca Mazilescu, and Surugiu Camelia. 2021. Analysis of the Tax Compliance in the EU: VECM and SEM. Mathematics 9: 2170. [Google Scholar] [CrossRef]
- Susilawati, Neni. 2022. A Systematic Literature Review for Distinguishing Tax Terms: Equality, Equity, Justice, and Fairness. Journal of Economics and Behavioral Studies 13: 19–39. [Google Scholar] [CrossRef] [PubMed]
- Taing, Heang Boong, and Yongjin Chang. 2020. Determinants of tax compliance intention: Focus on the theory of planned behavior. International Journal of Public Administration 44: 62–73. [Google Scholar] [CrossRef]
- Tilahun, Manchillot. 2019. Economic and Social Factors of Voluntary Tax Compliance: Evidence from Bahir Dar City. International Journal of Accounting Research 6: 182–88. [Google Scholar] [CrossRef]
- Torgler, Benno, and Friedrich Georg Schneider. 2004. Does Culture Influence Tax Morale? Evidence from Different European Countries. Working Paper No. 2004-17 2004. TaxEdu. Available online: https://taxedu.campaign.europa.eu/ (accessed on 5 October 2023).
- Tyler, Tom R. 1997. The psychology of legitimacy: A relational perspective on voluntary deference to authorities. Personality and Social Psychology Review 1: 323–45. [Google Scholar] [CrossRef]
- Udin, Noraza Mat. 2015. Malaysian Tax System and Individual Tax Knowledge. University Utara Malaysia. Available online: https://works.bepress.com/noraza_matudin/1 (accessed on 5 October 2023).
- Ullah, Farman, Muhammad Israr Khan, and Ilyas Sharif. 2018. Impact of tax fairness system on individual compliance behaviors in Pakistan. City University Research Journal 8: 47–57. [Google Scholar]
- UMAR. 2023. Urad Republike Slovenije za makroekonomske analize in razvoj. Poročilo o razvoju 2023. Available online: https://www.umar.gov.si/fileadmin/user_upload/razvoj_slovenije/2023/slovenski/POR2023.pdf (accessed on 30 January 2024).
- Van Dijke, Marius, and Peter Verboon. 2010. Trust in authorities as a boundary condition to procedural fairness effects on tax compliance. Journal of Economic Psychology 31: 80–91. [Google Scholar] [CrossRef]
- Vincent, Roce Camille. 2023. Vertical taxing rights and ta x compliance norms. Journal of Economic Behaviour & Orhanization 205: 443–67. [Google Scholar] [CrossRef]
- Wenzel, Michael. 2002. The impact of outcome orientation and justice concerns on taxpayers’ compliance: The role of taxpayers’ identity. Journal of Applied Psychology 87: 629–45. [Google Scholar] [CrossRef]
- Wenzel, Michael. 2003. Tax Compliance and the Psychology of Justice: Mapping the Field (Chapter 3). In Taxing Democracy: Understanding Tax Avoidance and Evasion. Aldershot: Ashgate Publishing. [Google Scholar] [CrossRef]
- White, Michelle J. 1990. Why are Taxes So Complex and Who Benefits? Tax Notes 47: 341–54. [Google Scholar]
- Williams, Colin. 2020. Evaluating Public Administration Approaches towards Tax Non Compliance in Europe. Administrative Sciences 10: 43. [Google Scholar] [CrossRef]
- Wong, Raymond M. K., and Agnes Lo. 2015. Can Education Improve Tax Compliance? Evidence from Different Forms of Tax Education. HKIBS Working Paper Series 074-1415. Available online: http://commons.ln.edu.hkibswp/93 (accessed on 15 October 2023).
- Wood, Richard Mark. 2023. A Review on Education differences in Urban and Rural Areas. International Research Journal of Educational Research 14: 1–3. [Google Scholar]
- Yao, Man, Tori I. Rehr, and Erica P. Regan. 2023. Gender Differences in Financial Knowledge among College Students: Evidence from a Recent Multi-institutional Survey. Journal of Family and Economic Issues 44: 693–713. [Google Scholar] [CrossRef]
- Zar, Jerrold H. 2010. Biostatistical Analysis, 5th ed. Upper Saddle River: Pearson Prentice Hall. [Google Scholar]
- Zhu, Alex Yue Feng. 2018. Parental Socialization and Financial Capability Among Chinese Adolescents in Hong Kong. Journal of Family and Economic Issues 39: 566–76. [Google Scholar] [CrossRef]
Figure 1.
Box plots of variable tax knowledge (TAXK) according to gender.

Figure 2.
Box plots of variable tax knowledge (TAXK) according to settlement type.

Figure 3.
Box plots of variable fairness perceptions (FAIRP) according to gender.

Figure 4.
Box plots of variable Fairness perceptions (FAIRP) according to settlement type.


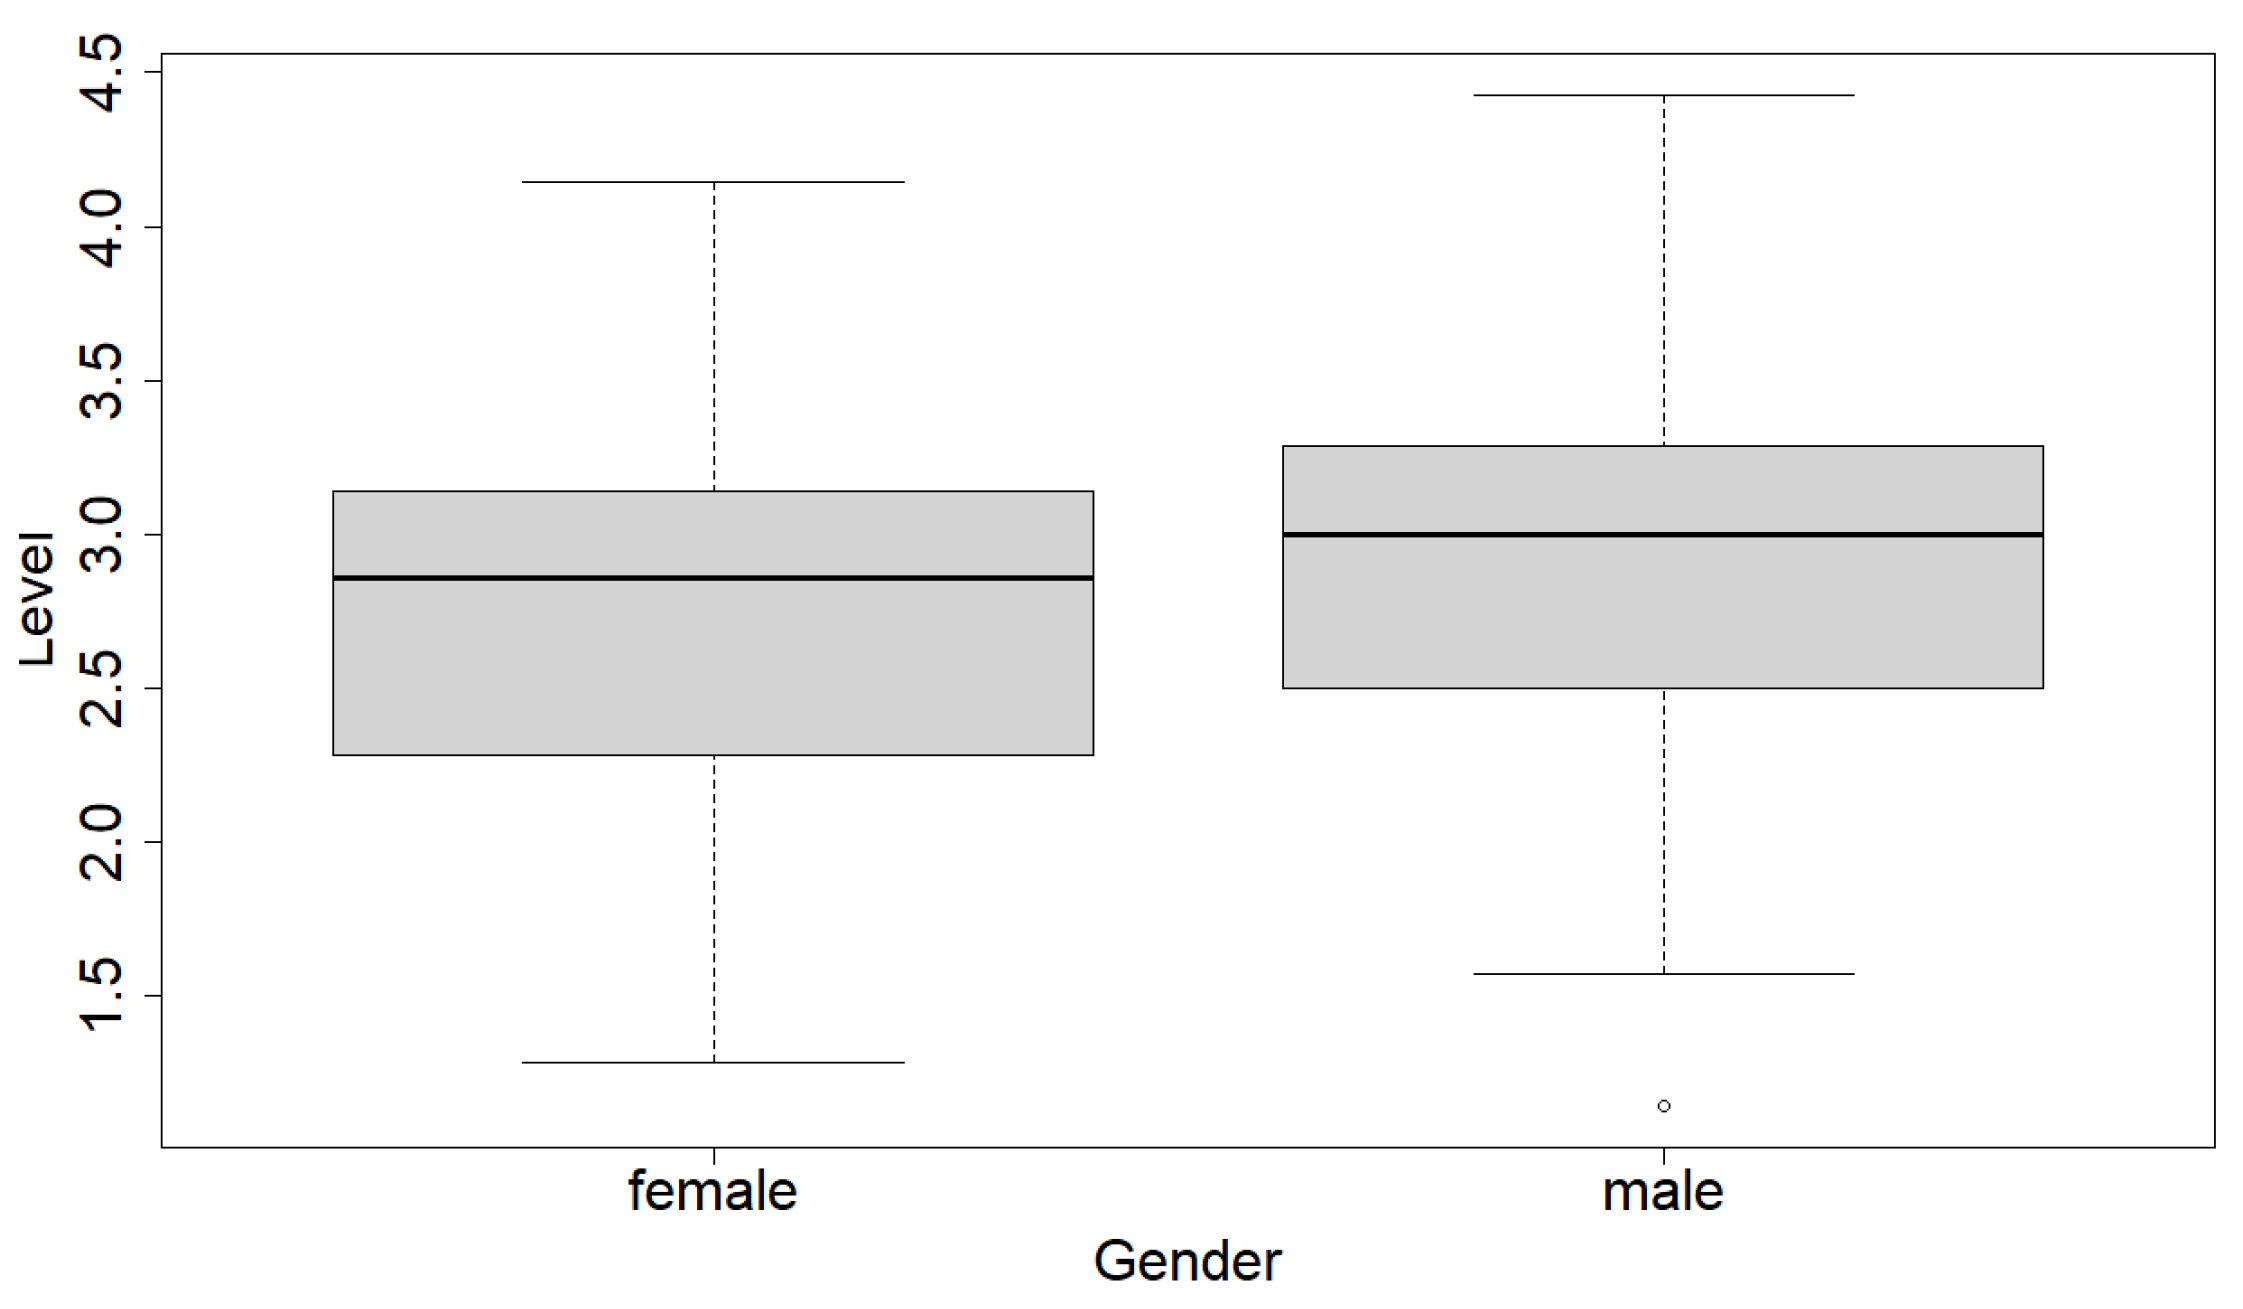
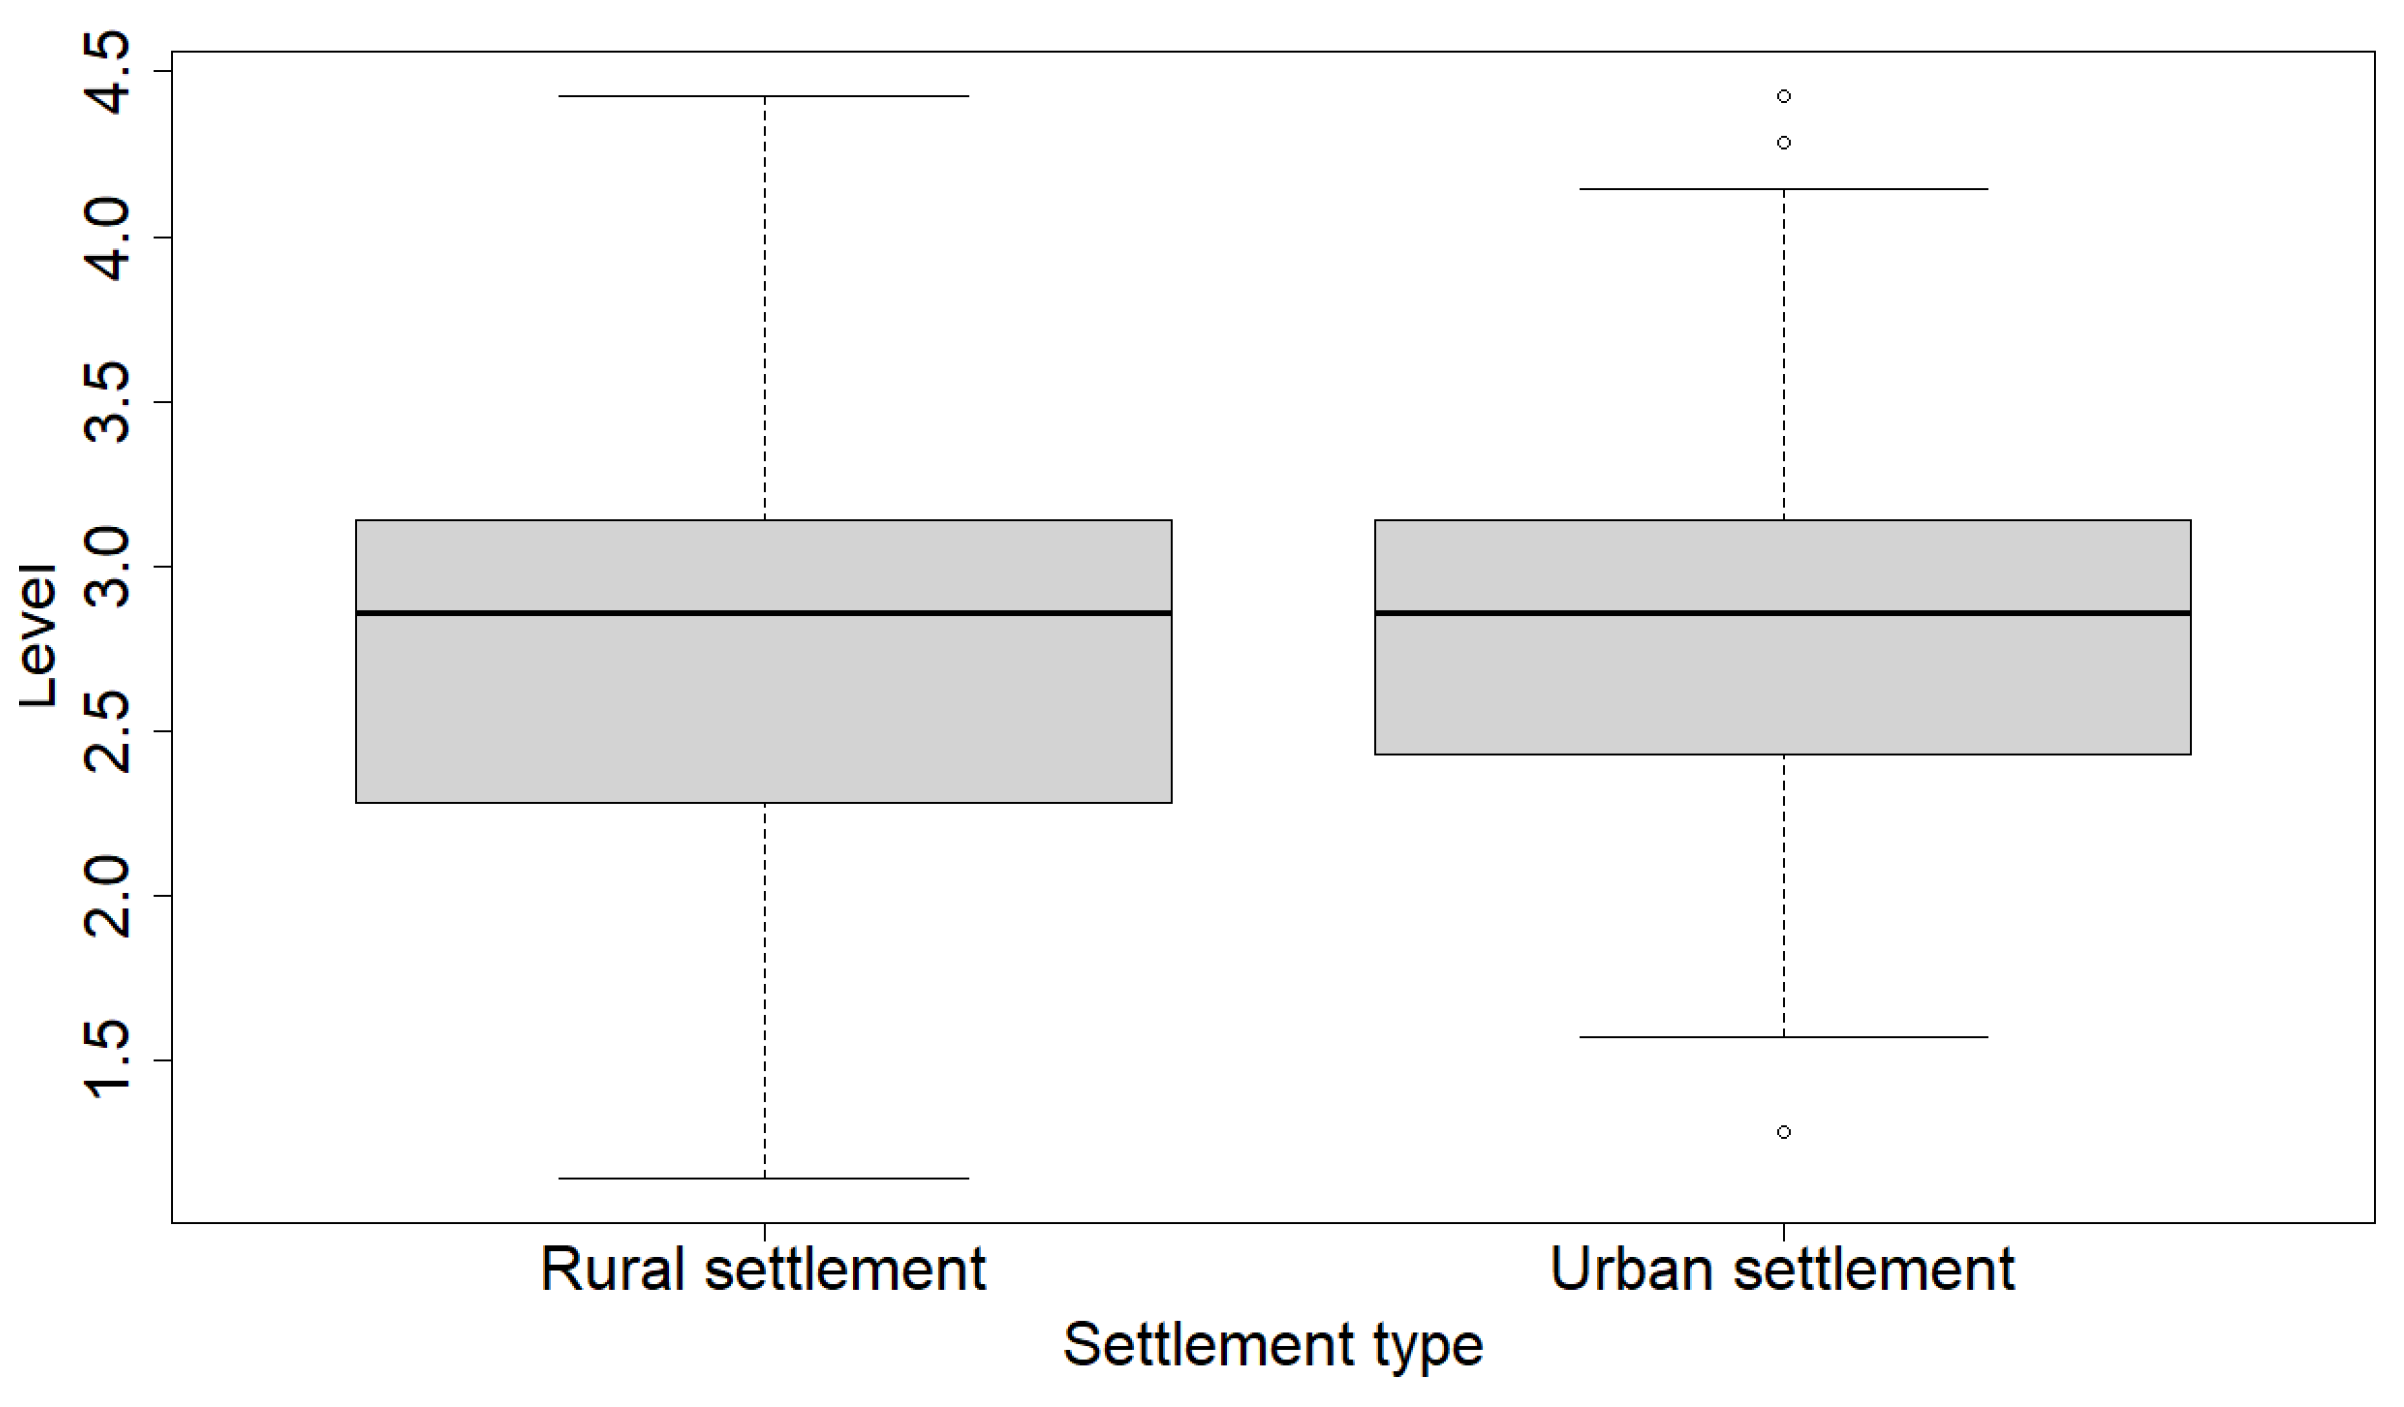
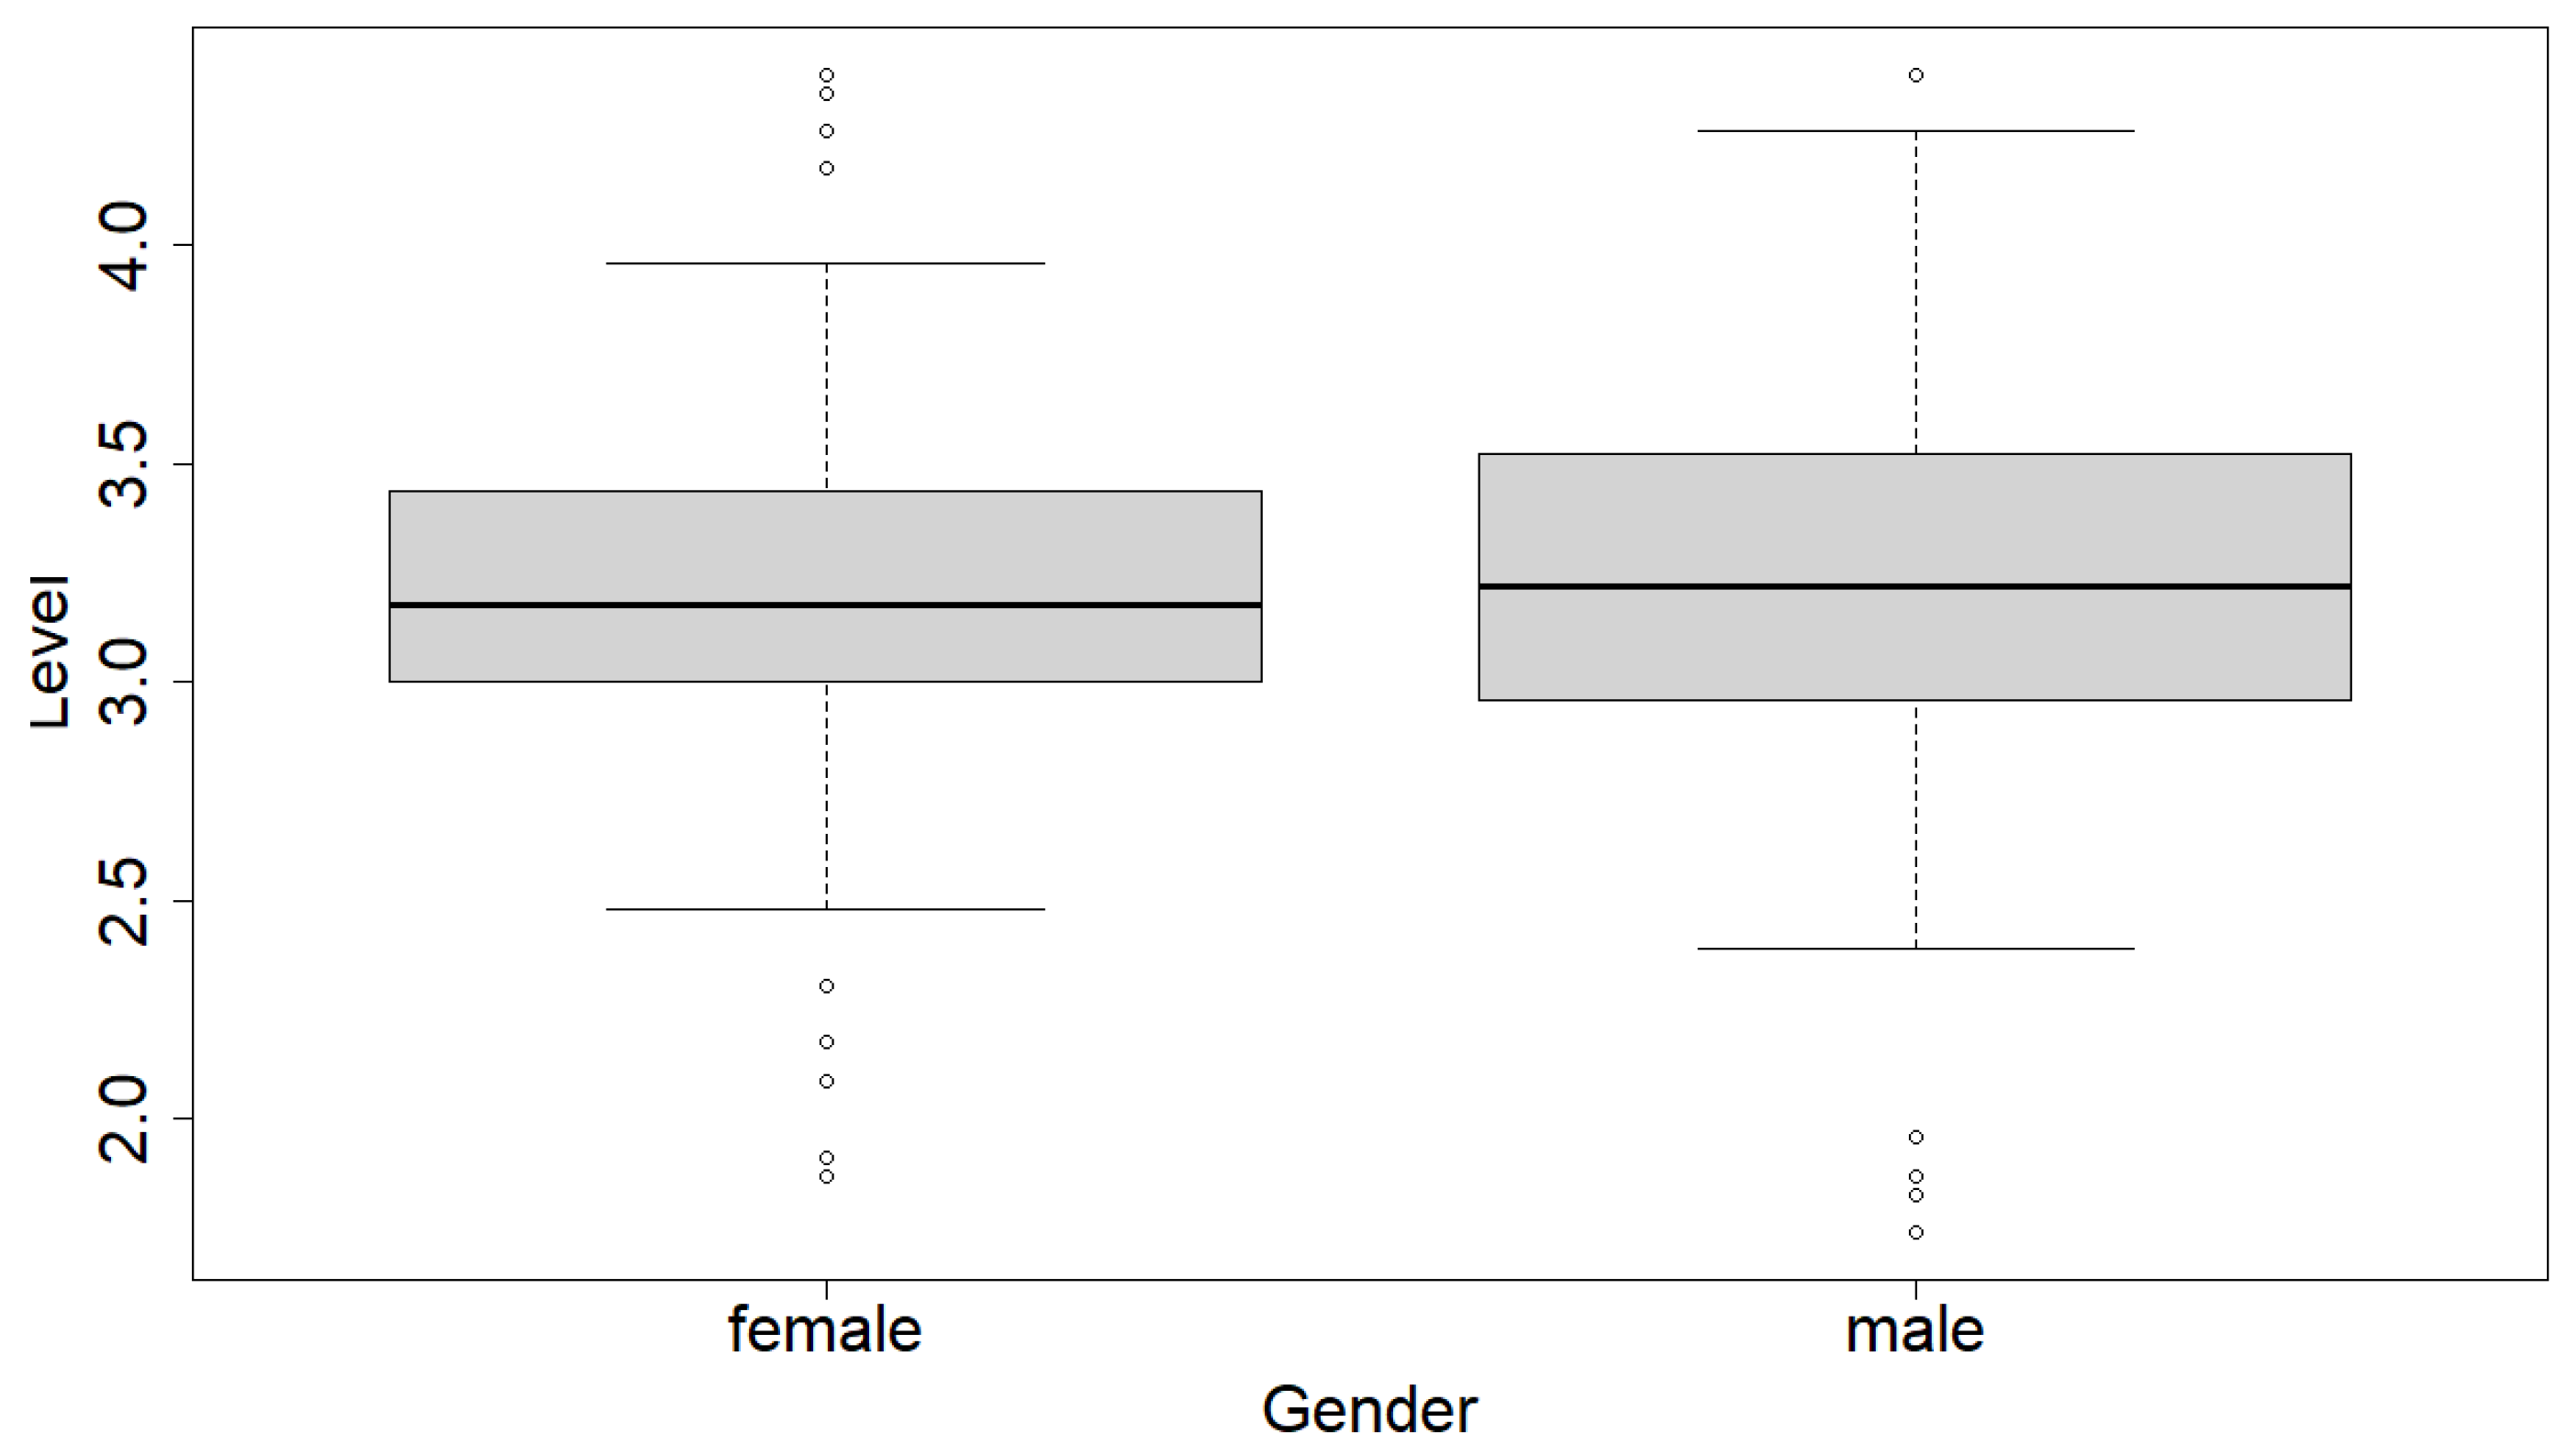
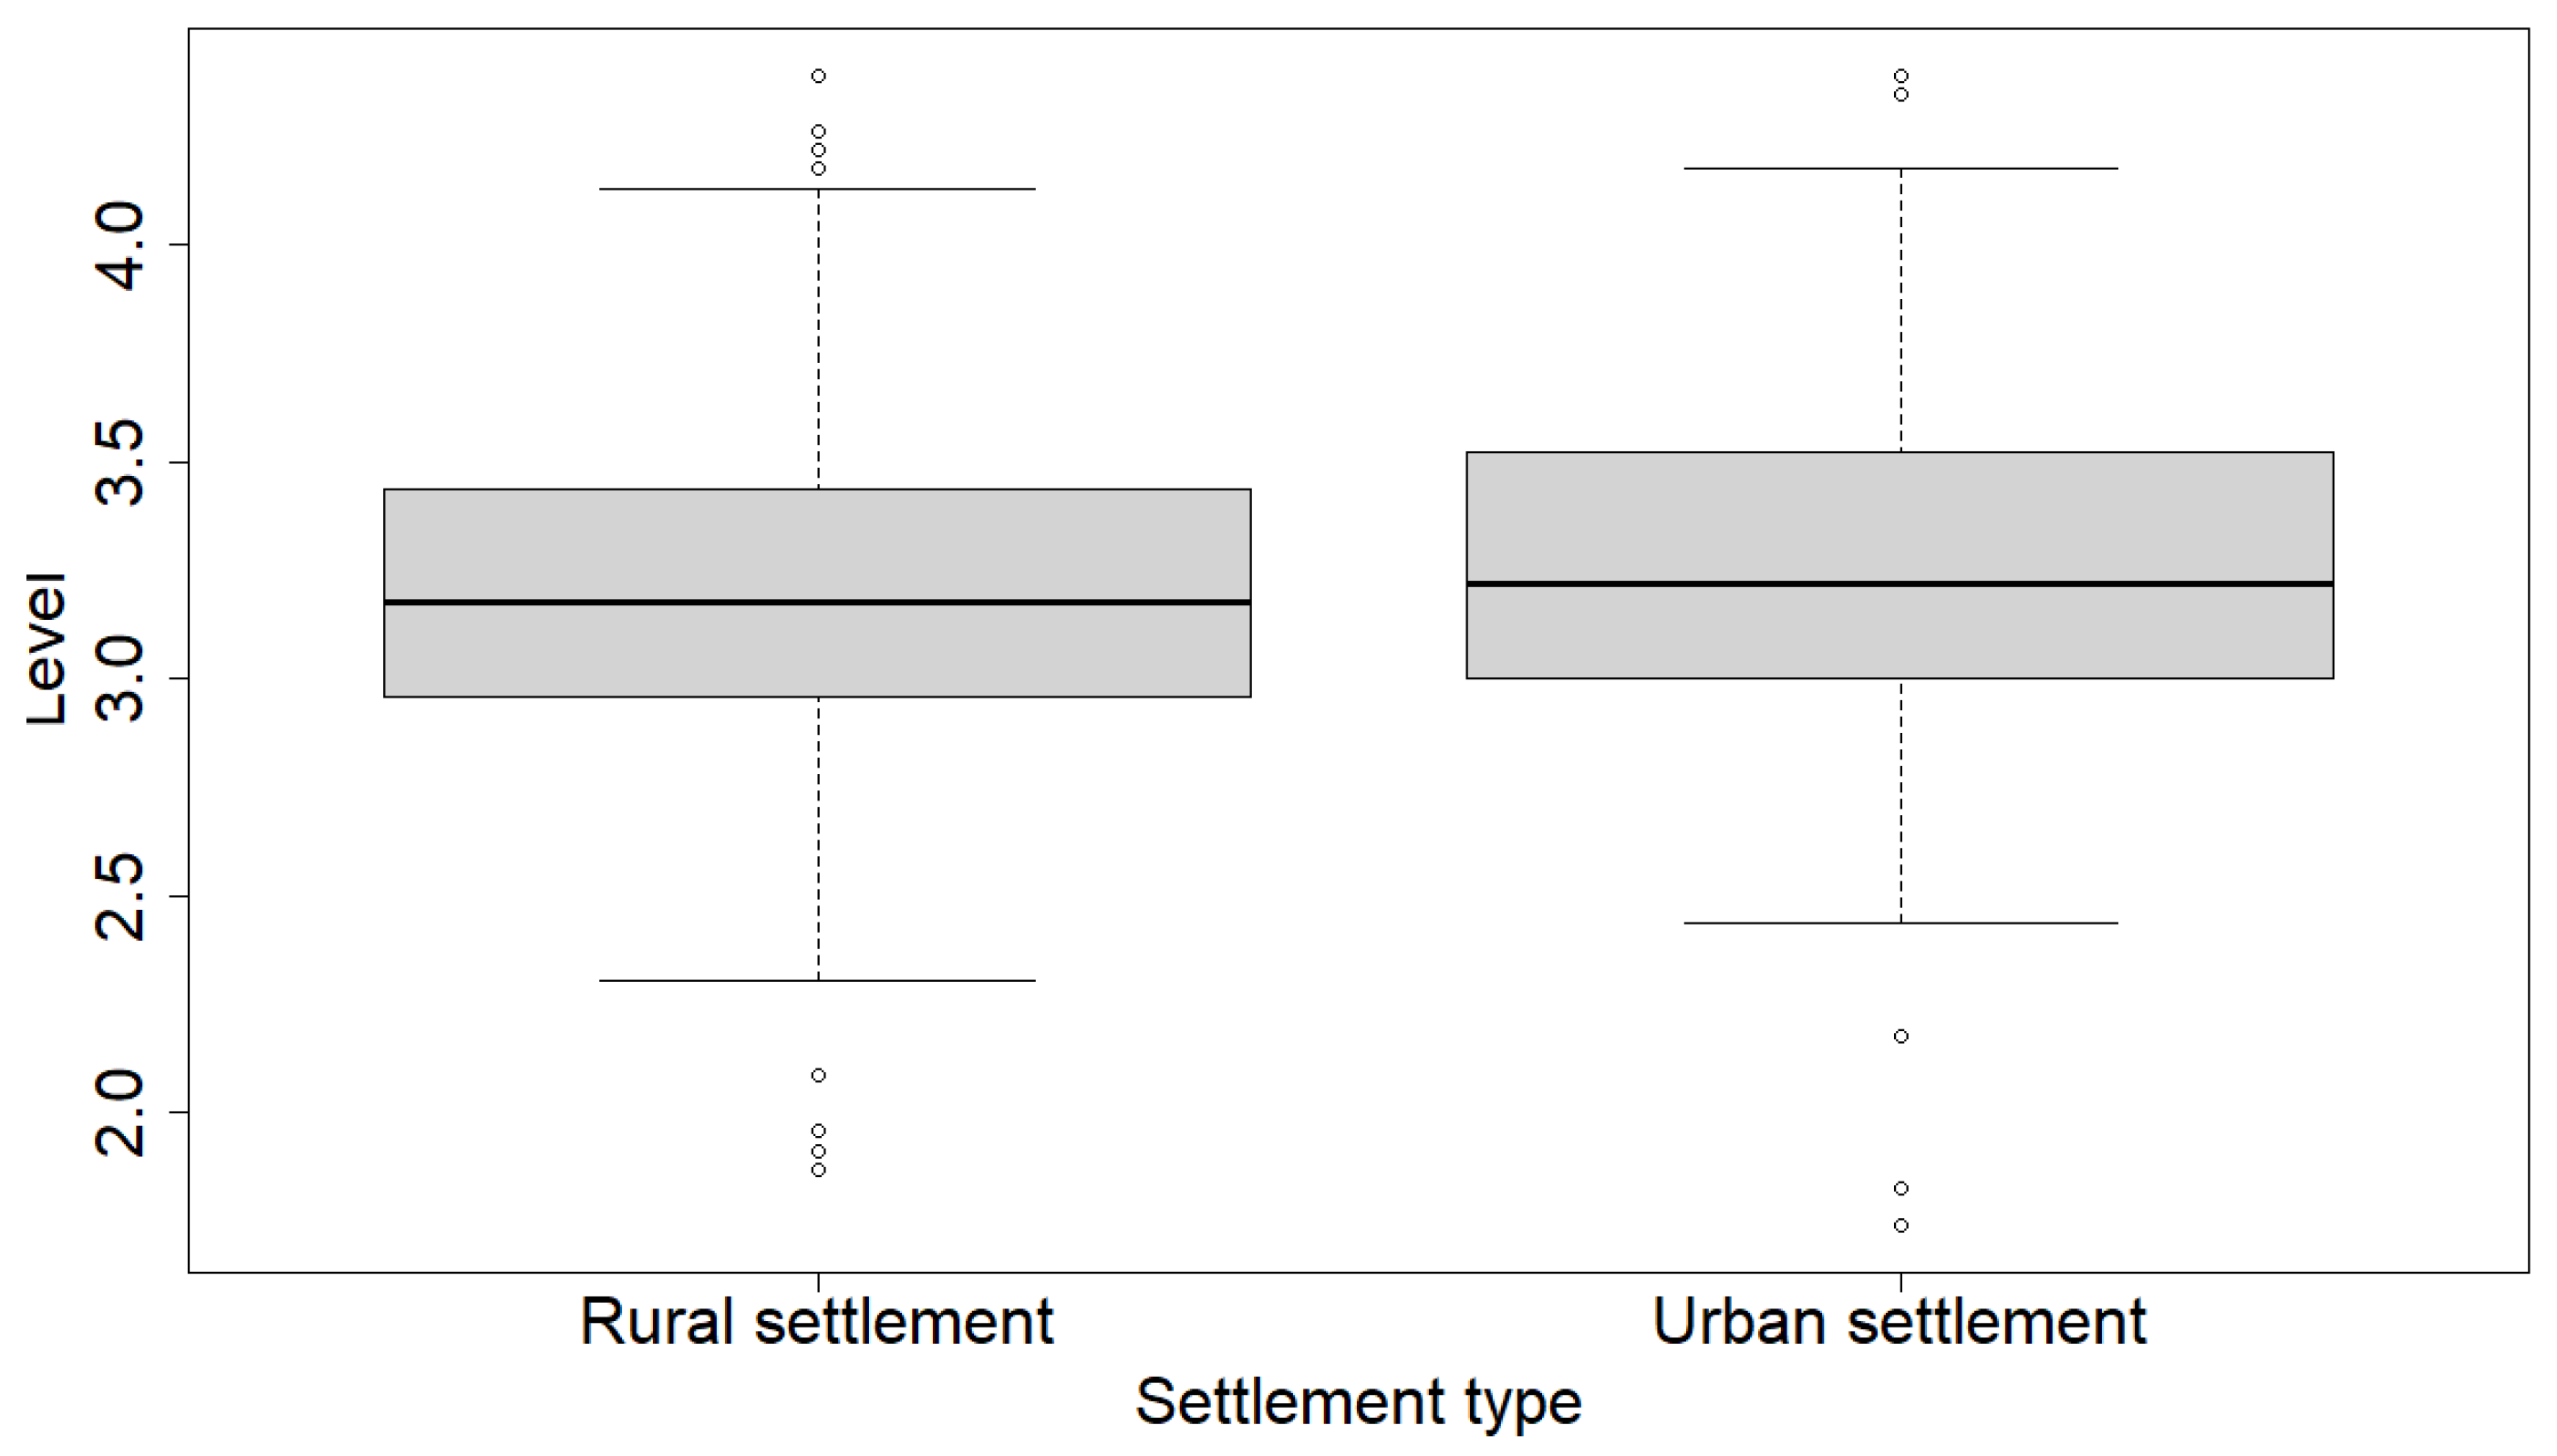
Table 1.
List of observed questions and variables.
| Code | Dimension | Question/Statement |
|---|---|---|
| TAXK | Tax knowledge perceptions | Overall |
| GK | General knowledge | Overall |
| GK1 | General knowledge | The tax system may not be perfect, but it works well enough for most citizens. |
| LK | Legal knowledge | Overall |
| LK1 | Legal knowledge | If I detect not reporting my exact income, I believe that the tax authority is tolerant toward my offence and most probably it will escape without any punishment. |
| LK2 | Legal knowledge | Working for cash in hand payment without paying tax is a trivial offence. |
| LK3 | Legal knowledge | Taxpayers cannot object to or make appeals against the tax authority’s assessments. |
| TK | Technical knowledge | Overall |
| TK1 | Technical knowledge | I have little idea about the deductions that I can claim as a taxpayer in the computations of my tax liability. |
| TK2 | Technical knowledge | To my knowledge, I can deduct all personal expenses in calculating my tax liability. |
| TK3 | Technical knowledge | Do you think it is acceptable to overstate tax deductions on one’s tax returns? |
| FAIRP | Fairness perceptions | Overall |
| GF | General fairness | Overall |
| GF1 | General fairness | I believe everyone pays their fair share of income tax under the current income tax system. |
| GF2 | General fairness | I think the government spend too much tax revenue on unnecessary welfare assistance. |
| GF3 | General fairness | Given the scope of social rights, taxes are not too high. |
| GF4 | General fairness | Tax evasion is ethical if the tax system is unfair. |
| GF5 | General fairness | Generally, I feel that income tax is a fair tax. |
| EF | Exchange fairness | Overall |
| EF1 | Exchange fairness | By paying the right amount of income tax, I believe that other people, especially the poor will get the benefit. |
| HF | Horizontal fairness | Overall |
| HF1 | Horizontal fairness | It is fair for individuals with similar amounts of income to pay similar amounts of income tax. |
| VF | Vertical fairness | Overall |
| VF1 | Vertical fairness | Higher-income earners should pay more taxes than lower-income earners. |
| VF2 | Vertical fairness | It is fair that high-income earners are subject to tax at progressively higher tax rates than middle-income tax. |
| RF | Retributive fairness | Overall |
| RF1 | Retributive fairness | It is fair that individuals who deliberately evade their taxes should be penalized with the same amount of penalty regardless of the amount of tax evaded. |
| PF | Personal fairness | Overall |
| PF1 | Personal fairness | I believe that I pay my fair share of the burden under the current income tax system. |
| PF2 | Personal fairness | Do you believe that waiters pay a fair share of taxes under the current income tax system? |
| PF3 | Personal fairness | Do you believe that farmers pay a fair share of taxes under the current income tax system? |
| PF4 | Personal fairness | Do you believe that workers in a manufacturing company pay a fair share of taxes under the current income tax system? |
| PF5 | Personal fairness | Do you believe that surgeons and medical doctors pay a fair share of taxes under the current income tax system? |
| PF6 | Personal fairness | Do you believe that board members of large national corporations pay a fair share of taxes under the current income tax system? |
| PF7 | Personal fairness | Do you believe that judges pay a fair share of taxes under the current income tax system? |
| PF8 | Personal fairness | Do you believe that entrepreneurs pay a fair share of taxes under the current income tax system? |
| PF9 | Personal fairness | Do you believe that teachers pay a fair share of taxes under the current income tax system? |
| PF10 | Personal fairness | Do you believe that construction workers pay a fair share of taxes under the current income tax system? |
| PF11 | Personal fairness | Do you believe that public servants pay a fair share of taxes under the current income tax system? |
| AF | Administrative fairness | Overall |
| AF1 | Administrative fairness | The tax authority respects honest taxpayers. |
| AF2 | Administrative fairness | The tax authority is trustworthy by you in administering the tax system fairly. |
Table 2.
Structure of respondents; n = 390 respondents.
| Variable | Items | Share of Respondents, % |
|---|---|---|
| Gender | Female | 52% |
| Male | 48% | |
| Education | No education | 0% |
| Primary school | 4% | |
| Vocational, secondary education | 42% | |
| Higher secondary education | 19% | |
| Tertiary education or university degree | 29% | |
| Master’s or doctoral degree in science | 6% | |
| Gross income | Less than EUR 500 | 2% |
| From EUR 501 to EUR 1000 | 11% | |
| From EUR 1001 to EUR 2000 | 50% | |
| More than EUR 2001 | 17% | |
| I do not have one | 1% | |
| I prefer not to answer | 19% | |
| Religion | Christianity | 73% |
| Islam | 3% | |
| Hinduism | 0% | |
| Buddhism | 0% | |
| I am not religious | 11% | |
| Other | 3% | |
| I prefer not to answer | 11% | |
| Marital status | Single | 18% |
| Married | 41% | |
| Divorced | 4% | |
| Domestic partnership/cohabiting | 37% | |
| Type of settlement | Rural settlement | 60% |
| Urban settlement | 40% |
Table 3.
Structure of respondents according to gender: females = 203 respondents; males = 187 respondents.
Table 3.
Structure of respondents according to gender: females = 203 respondents; males = 187 respondents.
| Variable | Items | Share of Female Respondents, % | Share of Male Respondents, % |
|---|---|---|---|
| Education | No education | 0% | 1% |
| Primary school | 4% | 3% | |
| Vocational, secondary education | 35% | 49% | |
| Higher secondary education | 17% | 22% | |
| Tertiary education or university degree | 37% | 20% | |
| Master’s or doctoral degree in science | 7% | 6% | |
| Gross income | Less than EUR 500 | 1% | 2% |
| From EUR 501 to EUR 1000 | 13% | 8% | |
| From EUR 1001 to EUR 2000 | 49% | 52% | |
| More than EUR 2001 | 16% | 19% | |
| I do not have one | 1% | 1% | |
| I prefer not to answer | 20% | 19% | |
| Religion | Christianity | 74% | 71% |
| Islam | 3% | 4% | |
| Hinduism | 0% | 0% | |
| Buddhism | 0% | 1% | |
| I am not religious | 10% | 11% | |
| Other | 1% | 4% | |
| I prefer not to answer | 12% | 9% | |
| Marital status | Single | 11% | 26% |
| Married | 47% | 34% | |
| Divorced | 3% | 5% | |
| Domestic partnership/cohabiting | 39% | 35% | |
| Type of settlement | Rural settlement | 59% | 61% |
| Urban settlement | 41% | 39% |
Table 4.
Structure of respondents according to settlement type: rural settlement = 233 respondents; urban settlement = 157 respondents.
Table 4.
Structure of respondents according to settlement type: rural settlement = 233 respondents; urban settlement = 157 respondents.
| Variable | Items | Share of Rural Respondents, % | Share of Urban Respondents, % |
|---|---|---|---|
| Gender | Female | 51% | 54% |
| Male | 49% | 46% | |
| Education | No education | 0% | 0% |
| Primary school | 4% | 3% | |
| Vocational, secondary education | 47% | 34% | |
| Higher secondary education | 18% | 22% | |
| Tertiary education or university degree | 25% | 35% | |
| Master’s or doctoral degree in science | 6% | 7% | |
| Gross income | Less than EUR 500 | 0% | 3% |
| From EUR 501 to EUR 1000 | 12% | 9% | |
| From EUR 1001 to EUR 2000 | 49% | 52% | |
| More than EUR 2001 | 18% | 16% | |
| I don’t have one | 1% | 1% | |
| I prefer not to answer | 20% | 19% | |
| Religion | Christianity | 78% | 66% |
| Islam | 1% | 7% | |
| Hinduism | 0% | 0% | |
| Buddhism | 0% | 1% | |
| I am not religious | 7% | 15% | |
| Other | 3% | 2% | |
| I prefer not to answer | 11% | 10% | |
| Marital status | Single | 17% | 20% |
| Married | 41% | 40% | |
| Divorced | 5% | 2% | |
| Domestic partnership/cohabiting | 36% | 38% |
Table 5.
Average level of tax knowledge variables according to gender and settlement type; n = 390 respondents.
Table 5.
Average level of tax knowledge variables according to gender and settlement type; n = 390 respondents.
| Code | Gender | Settlement Type | ||
|---|---|---|---|---|
| Female | Male | Rural Settlement | Urban Settlement | |
| TAXK | 2.72 | 2.90 | 2.76 | 2.87 |
| GK | 3.33 | 3.33 | 3.37 | 3.27 |
| GK1 | 3.33 | 3.33 | 3.37 | 3.27 |
| LK | 2.52 | 2.73 | 2.59 | 2.66 |
| LK1 | 2.49 | 2.70 | 2.48 | 2.75 |
| LK2 | 2.60 | 2.89 | 2.76 | 2.72 |
| LK3 | 2.46 | 2.59 | 2.53 | 2.52 |
| TK | 2.71 | 2.93 | 2.72 | 2.94 |
| TK1 | 3.28 | 3.42 | 3.30 | 3.42 |
| TK2 | 2.53 | 2.78 | 2.60 | 2.73 |
| TK3 | 2.31 | 2.58 | 2.27 | 2.68 |
Table 6.
Kruskal–Wallis rank sum test results, tax knowledge variables according to gender and settlement type; degrees of freedom = 1; n = 390 respondents.
Table 6.
Kruskal–Wallis rank sum test results, tax knowledge variables according to gender and settlement type; degrees of freedom = 1; n = 390 respondents.
| Code | Gender | Settlement Type | ||
|---|---|---|---|---|
| Kruskal–Wallis Chi-Squared | p-Value | Kruskal–Wallis Chi-Squared | p-Value | |
| TAXK | 6.36 | 0.0116 * | 1.59 | 0.2067 |
| GK | 0.01 | 0.9383 | 2.35 | 0.1252 |
| GK1 | 0.01 | 0.9383 | 2.35 | 0.1252 |
| LK | 4.62 | 0.0316 * | 0.72 | 0.3967 |
| LK1 | 2.88 | 0.0898 | 4.12 | 0.0425 * |
| LK2 | 5.46 | 0.0195 * | 0.16 | 0.6868 |
| LK3 | 1.06 | 0.3032 | 0.00 | 0.9451 |
| TK | 5.19 | 0.0227 * | 5.73 | 0.0167 * |
| TK1 | 1.22 | 0.2695 | 1.17 | 0.2801 |
| TK2 | 3.56 | 0.0591 | 1.00 | 0.3172 |
| TK3 | 4.35 | 0.0369 * | 11.91 | 0.0006 * |
* Note: p-values lower than 0.05 level are denoted with *.
Table 7.
Average level of fairness perception variables according to gender and settlement type; n = 390 respondents.
Table 7.
Average level of fairness perception variables according to gender and settlement type; n = 390 respondents.
| Code | Gender | Settlement Type | ||
|---|---|---|---|---|
| Female | Male | Rural Settlement | Urban Settlement | |
| FAIRP | 3.21 | 3.23 | 3.20 | 3.25 |
| GF | 2.93 | 3.03 | 2.96 | 3.01 |
| GF1 | 2.75 | 2.88 | 2.75 | 2.91 |
| GF2 | 3.58 | 3.64 | 3.65 | 3.55 |
| GF3 | 2.71 | 2.89 | 2.77 | 2.84 |
| GF4 | 2.42 | 2.64 | 2.47 | 2.60 |
| GF5 | 3.20 | 3.12 | 3.15 | 3.17 |
| EF | 3.22 | 3.44 | 3.25 | 3.44 |
| EF1 | 3.22 | 3.44 | 3.25 | 3.44 |
| HF | 3.91 | 3.79 | 3.85 | 3.85 |
| HF1 | 3.91 | 3.79 | 3.85 | 3.85 |
| VF | 3.89 | 3.91 | 3.96 | 3.82 |
| VF1 | 3.95 | 3.95 | 4.01 | 3.85 |
| VF2 | 3.84 | 3.87 | 3.90 | 3.78 |
| RF | 2.79 | 2.72 | 2.56 | 3.06 |
| RF1 | 2.79 | 2.72 | 2.56 | 3.06 |
| PF | 3.20 | 3.17 | 3.17 | 3.21 |
| PF1 | 3.90 | 3.81 | 3.87 | 3.84 |
| PF2 | 3.19 | 3.38 | 3.27 | 3.29 |
| PF3 | 3.11 | 3.09 | 3.08 | 3.14 |
| PF4 | 3.44 | 3.38 | 3.44 | 3.37 |
| PF5 | 2.99 | 3.02 | 3.00 | 3.01 |
| PF6 | 2.69 | 2.63 | 2.57 | 2.80 |
| PF7 | 2.95 | 2.88 | 2.86 | 3.01 |
| PF8 | 2.97 | 3.06 | 2.98 | 3.06 |
| PF9 | 3.41 | 3.28 | 3.32 | 3.39 |
| PF10 | 3.17 | 3.20 | 3.20 | 3.15 |
| PF11 | 3.35 | 3.17 | 3.28 | 3.25 |
| AF | 3.13 | 3.24 | 3.20 | 3.16 |
| AF1 | 3.26 | 3.48 | 3.40 | 3.30 |
| AF2 | 3.01 | 3.00 | 2.99 | 3.03 |
Table 8.
Kruskal–Wallis rank sum test results, fairness perception variables according to gender and settlement type; degrees of freedom = 1; n = 390 respondents.
Table 8.
Kruskal–Wallis rank sum test results, fairness perception variables according to gender and settlement type; degrees of freedom = 1; n = 390 respondents.
| Code | Gender | Settlement Type | ||
|---|---|---|---|---|
| Kruskal–Wallis Chi-Squared | p-Value | Kruskal–Wallis Chi-Squared | p-Value | |
| FAIRP | 0.12 | 0.7263 | 1.17 | 0.2786 |
| GF | 2.80 | 0.0944 | 1.13 | 0.2874 |
| GF1 | 1.26 | 0.2608 | 2.01 | 0.1562 |
| GF2 | 0.36 | 0.5501 | 0.59 | 0.4432 |
| GF3 | 2.78 | 0.0957 | 0.70 | 0.4023 |
| GF4 | 2.78 | 0.0952 | 1.51 | 0.2191 |
| GF5 | 0.65 | 0.4184 | 0.25 | 0.6138 |
| EF | 3.67 | 0.0553 | 2.58 | 0.1083 |
| EF1 | 3.67 | 0.0553 | 2.58 | 0.1083 |
| HF | 0.56 | 0.4548 | <0.01 | 0.9904 |
| HF1 | 0.56 | 0.4548 | <0.01 | 0.9904 |
| VF | 0.30 | 0.5829 | 0.95 | 0.3287 |
| VF1 | 0.11 | 0.7429 | 1.32 | 0.2514 |
| VF2 | 0.74 | 0.3882 | 0.32 | 0.5731 |
| RF | 0.33 | 0.5684 | 12.57 | 0.0004 * |
| RF1 | 0.33 | 0.5684 | 12.57 | 0.0004 * |
| PF | 0.09 | 0.7661 | 0.42 | 0.5150 |
| PF1 | 1.19 | 0.2763 | 0.30 | 0.5827 |
| PF2 | 3.83 | 0.0503 | 0.18 | 0.6744 |
| PF3 | 0.06 | 0.8035 | 0.35 | 0.5554 |
| PF4 | 0.22 | 0.6359 | 0.18 | 0.6721 |
| PF5 | 0.06 | 0.8023 | 0.23 | 0.6316 |
| PF6 | 0.48 | 0.4862 | 3.84 | 0.0500 * |
| PF7 | 0.31 | 0.5784 | 1.45 | 0.2288 |
| PF8 | 0.38 | 0.5393 | 0.26 | 0.6101 |
| PF9 | 0.69 | 0.4056 | 0.43 | 0.5131 |
| PF10 | 0.02 | 0.8791 | 0.01 | 0.9434 |
| PF11 | 1.57 | 0.2102 | 0.11 | 0.7439 |
| AF | 2.41 | 0.1206 | 0.27 | 0.6060 |
| AF1 | 4.94 | 0.0263 * | 0.47 | 0.4914 |
| AF2 | 0.02 | 0.8870 | 0.08 | 0.7810 |
| AF2 | 0.02 | 0.8870 | 0.08 | 0.7810 |
* Note: p-values lower than 0.05 level are denoted with *.
Table 9.
Tax knowledge correlation with fairness perception dimensions; Kendall’s coefficient of rank correlation ; n = 390 respondents.
Table 9.
Tax knowledge correlation with fairness perception dimensions; Kendall’s coefficient of rank correlation ; n = 390 respondents.
| Fairness Perception Dimensions | Kendall’s | p-Value |
|---|---|---|
| GF | 0.2936 | <0.0001 |
| EF | 0.1083 | 0.0054 |
| HF | −0.1262 | 0.0014 |
| VF | −0.1805 | <0.0001 |
| RF | 0.2922 | <0.0001 |
| PF | 0.0901 | 0.0116 |
| AF | 0.1219 | 0.0013 |
Disclaimer/Publisher’s Note: The statements, opinions and data contained in all publications are solely those of the individual author(s) and contributor(s) and not of MDPI and/or the editor(s). MDPI and/or the editor(s) disclaim responsibility for any injury to people or property resulting from any ideas, methods, instructions or products referred to in the content. |
© 2024 by the authors. Licensee MDPI, Basel, Switzerland. This article is an open access article distributed under the terms and conditions of the Creative Commons Attribution (CC BY) license (https://creativecommons.org/licenses/by/4.0/).
Share and Cite
MDPI and ACS Style
Hauptman, L.; Žmuk, B.; Pavić, I. Tax Compliance in Slovenia: An Empirical Assessment of Tax Knowledge and Fairness Perception. J. Risk Financial Manag. 2024, 17, 89. https://doi.org/10.3390/jrfm17030089
AMA Style
Hauptman L, Žmuk B, Pavić I. Tax Compliance in Slovenia: An Empirical Assessment of Tax Knowledge and Fairness Perception. Journal of Risk and Financial Management. 2024; 17(3):89. https://doi.org/10.3390/jrfm17030089
Chicago/Turabian StyleHauptman, Lidija, Berislav Žmuk, and Ivana Pavić. 2024. "Tax Compliance in Slovenia: An Empirical Assessment of Tax Knowledge and Fairness Perception" Journal of Risk and Financial Management 17, no. 3: 89. https://doi.org/10.3390/jrfm17030089