1. Introduction
Forecasting holds a paramount significance across a spectrum of life’s domains, particularly in the context of foreseeing future events amid the pervasive uncertainties that enshroud the global economy. The heightened importance of precision in statistical data forecasting assumes a pivotal role, empowering policymakers to make informed decisions, facilitate effective planning, address challenges confronting economic and societal progress, and enhance competitive capabilities. The banking sector in Jordan stands as a vital component within the financial landscape, playing a crucial role in financing the Jordanian economy, fostering economic expansion, facilitating the funding of infrastructural ventures, and nurturing collaborations between the public and private sectors, all while exhibiting a notable degree of financial efficiency.
By the conclusion of 2021, the banking sector in Jordan had achieved a remarkable milestone, with the total assets within the sector surpassing the threshold of 60 billion Jordanian dinars. This significant growth underscores the sector’s pivotal role in the country’s financial landscape. Moreover, the banking sector’s assets were found to be in a relatively strong position when compared to the overall economy, with an asset ratio equivalent to 194% of the gross domestic product (GDP). The magnitude of total deposits held within banks was equally impressive, amounting to 126% of the GDP. These figures demonstrate the sector’s substantial financial influence and its capacity to mobilize resources for the broader economic development of Jordan.
One notable aspect of the Jordanian banking sector is its sound financial health. The capital adequacy ratio, a critical measure of a bank’s financial strength, stood at a robust 18.3% by the end of 2020. This reflects the sector’s ability to maintain an adequate capital buffer to absorb unexpected losses and ensure the stability of the financial system. Additionally, the legal liquidity ratio reached a remarkable 136.5% during the same period, indicating that the sector has maintained a high degree of liquidity, which is essential for fulfilling its obligations and ensuring its resilience in the face of economic challenges. Furthermore, the banking sector in Jordan is not only demonstrating financial strength but is also actively embracing digital transformation as a key element of its strategy. This commitment to digitalization aligns with broader financial inclusion goals, as it opens up opportunities for more individuals and businesses to access and benefit from financial services. The sector’s forward-thinking approach is not only in response to changing technological landscapes, but also a proactive step to promote economic growth and foster inclusivity.
In conclusion, the Jordanian banking sector’s substantial asset base, its strong position within the economy, and its commitment to digital transformation and financial inclusion all contribute to its significance in the nation’s economic development. These developments not only reflect the sector’s past achievements, but also its potential to further drive growth and progress in Jordan’s financial and economic landscape.
The precision of forecasting financial statements within the banking sector holds a significant bearing on the overall performance of banks across various critical dimensions. These dimensions encompass liquidity, profitability, investment, employment, and the management of risks inherent in lending and providing financial facilities. As such, financial planners and decision makers within the banking industry are intrinsically motivated to strive for the utmost degree of accuracy in predicting the performance of banks. This pursuit of precision in forecasting financial outcomes is multifaceted and carries profound implications.
To begin, the accuracy of forecasting plays an instrumental role in assessing a bank’s liquidity position. Liquidity management is crucial for banks as it directly influences their capacity to meet short-term obligations, fund daily operations, and ensure the timely settlement of customer transactions. Accurate forecasts empower decision makers to preemptively allocate resources in order to maintain optimal liquidity levels, thus averting potential crises and optimizing the utilization of the available funds.
Profitability represents another pivotal facet of bank performance intricately linked to forecasting accuracy. The ability to project financial performance with precision aids in estimating profits, assessing income streams, and making informed decisions concerning investments and expansion strategies. Accurate financial forecasts enable banks to tailor their business strategies, allocate resources efficiently, and ultimately enhance their profitability, thus contributing to their sustained competitiveness. Furthermore, the judicious prediction of financial outcomes is invaluable for the prudent allocation of resources towards investments and employment. Banks rely on their forecasts to identify opportunities for growth, expansion, and investment in various financial products and services. By achieving a high degree of forecast accuracy, decision makers can confidently allocate capital to promising investment opportunities, thus fostering economic development and creating employment opportunities, which are vital for the overall economic prosperity of a nation.
Lastly, the effective management of risks is paramount for the stability and security of banks. Risks arise from lending and granting financial facilities, and a lack of accuracy in forecasting can expose banks to potential financial crises. Accurate financial projections provide insight into potential risks and allow decision makers to devise strategies to mitigate and hedge against these risks, therefore safeguarding the stability and soundness of the banking sector.
In conclusion, the pursuit of forecast accuracy within the banking sector is an endeavor with multifaceted implications. It underpins the effective management of liquidity, the enhancement of profitability, the prudent allocation of resources to investments and employment, and the mitigation of risks. By achieving a high degree of forecast accuracy, financial planners and decision makers not only elevate the competitiveness of banks, but also contribute to the stability and economic growth of the broader financial system. As such, the pursuit of accuracy in forecasting financial statements remains an integral element in the strategic decision-making process within the banking industry.
The early prediction of bank failure is of paramount importance as it serves as a crucial preventive measure to safeguard financial institutions from the perils of liquidation and bankruptcy. Consequently, an extensive body of literature has emerged, delving into the prediction of bank failures. This research has yielded invaluable insights into the dynamics of forecasting, as well as contributing to the enhancement of the understanding of the factors associated with the financial well-being of banks.
Cui (
2011) stands as a notable contributor to this field, as their work is centered on the analysis of the bank failure rate and prediction using the autoregressive integrated moving average (ARIMA) model. The model selection, validation, and classification of bank failures based on total assets serve as key components of their study. Cui’s research endeavors to provide a comprehensive understanding of the factors that underlie the prediction of bank failures.
Gnagne and Moran (
2020) have offered a distinctive model for predicting the total monthly number of commercial bank failures in the United States. Their model is founded on macroeconomic variables, initially proposed by
McCracken and Ng (
2016). Their analysis has revealed a robust and pivotal connection between housing sector-related factors and the incidence of bank failures, highlighting the significance of the interplay between developments in this sector and the vulnerabilities within the banking industry.
Adeyeye and Oloyede (
2014) have made significant contributions by examining an improved linear discrimination model designed to forecast the bank failure rate in Nigeria. Their model combines principal component analysis (AE) and discriminant analysis (DA) to facilitate estimation. Impressively, their model achieved a high degree of accuracy in predicting the status of failing banks, suggesting that discriminant analysis can serve as an effective indicator of impending bank failures. This research underscores the potential for the early detection of issues within banks, thereby enabling timely corrective measures to prevent failure.
Hasan and Sheakh (
2020) have delved into an advanced forecasting technique tailored to the banking sector in Bangladesh. They have examined the application of the exponential smoothing method, the Holt method, and the Winter method, with a focus on predicting the number of customers and customer entities on various time scales, ranging from daily to yearly. This innovative approach not only assists in determining customer wait times, but also aids bank managers in optimizing the number of bank tellers, thereby reducing operational costs. Hasan and Sheakh’s research provides a practical tool for enhancing bank management and improving customer service.
In summary, the extensive body of research on the early prediction of bank failures encompasses a wide array of methodologies and insights. These studies collectively contribute to the advancement of knowledge in the field, providing valuable tools and strategies to aid financial institutions in preserving their stability and resilience in the face of potential economic challenges.
In the realm of forecasting bank failures, numerous studies have taken a distinct approach by harnessing the capabilities of machine learning methods. One such study, conducted by
Agrapetidou et al. (
2020), presented a machine learning methodology termed AutoML, specifically applied to forecast the failure of US banks during the period spanning 2007 to 2013. Referred to as “Just Add Data” (JAD), this model demonstrated exceptional predictive capabilities, with an area under the curve (AUC) score of 0.985. The outcomes of this research underscored the efficacy of JAD and the AutoML tool in enhancing the productivity of financial data analysts, while concurrently mitigating the risks associated with systematic statistical errors. This approach holds promise as a valuable asset for stakeholders involved in banking risk assessment and management.
On another front, several studies have steered their attention towards forecasting the efficiency of banks.
Yaghoubi and Fazli (
2022), for instance, delved into the assessment and prediction of bank efficiency by introducing a hybrid model that ingeniously amalgamates Monte Carlo simulation technology (MC) with the genetic algorithm (GA) and the imperial competitive algorithm (ICA). The primary objective of this hybrid model is to fine-tune the performance parameters of MC–GA and MC–ICA. The results of their investigation illuminated the model’s remarkable accuracy in forecasting efficiency, which has substantial implications for bank managers and regulators seeking to optimize their institutions’ performance. This innovative approach allows for more informed decision making, efficient resource allocation, and, ultimately, the enhancement of the overall banking landscape.
In conclusion, these studies represent two distinctive branches of research within the broader scope of banking forecasting. The first employs AutoML in the JAD model to predict bank failures, emphasizing the gains in productivity and error prevention it offers to financial data analysts. The second utilizes a hybrid model integrating MC, GA, and ICA to forecast bank efficiency, showcasing its ability to provide precise efficiency assessments. These approaches contribute to the refinement of predictive tools for risk assessment and management, as well as the optimization of bank performance. They exemplify the ongoing efforts to employ cutting-edge methodologies and technologies in the banking sector, ultimately enhancing its resilience and competitiveness in an ever-evolving financial landscape.
2. Literature Review
In the expansive realm of economic literature and statistical studies, a multitude of efforts have been directed towards the enhancement of predictive accuracy over time. These endeavors have yielded valuable insights, fostering an evolving understanding of data forecasting and its applications across diverse fields. This narrative provides a comprehensive overview of several notable contributions in this domain, encompassing various methodologies and their implications.
Hwang et al. (
2012) addressed the limitations of conventional methods used to evaluate data-driven predictive model performance, specifically in the context of hydrological data-driven forecasting. Their study introduced the concept of the relative correlation coefficient (RCC) to gauge predictive efficiency concerning the naive model (representing an unchanged scenario). The findings accentuated the merits of RCC, indicating its superiority over traditional evaluation techniques by providing a metric for assessing model improvements relative to the naive model in data-driven forecasting.
Kriechbaumer et al. (
2014) made significant strides in boosting the performance of autoregressive integrated moving average (ARIMA) models for forecasting metal prices. Their research entailed optimizing the choice of wavelet transform type, wave function, and the number of decomposition levels employed in multiple resolution analysis (MRA). The outcomes were striking, showcasing a substantial improvement in prediction accuracy, particularly in forecasting aluminum, copper, lead, and zinc prices. This achievement testified to the effectiveness of their model in surpassing classical ARIMA models. In a distinct line of inquiry,
Hossain et al. (
2021) explored statistical methods for prediction, focusing on both high-frequency and low-frequency empirical mode decomposition (EMD) components. They introduced two novel approaches, namely the EMD–ARIMA–EWMA and EMD–EWMA–ARIMA methods, which were subsequently compared with four other forecasting methods. The results underscored the superior predictive accuracy of the EMD–ARIMA–EWMA method when contrasted with basic ARIMA and EWMA techniques. This research offers a promising avenue for financial forecasting and decision making.
Wang and Chaovalitwongse (
2018) presented a comprehensive overview of forecasting methods, detailing their basic procedures, underlying assumptions, applications, and limitations. They accentuated the significance of deploying a blend of quantitative and qualitative techniques in order to evaluate prediction performance comprehensively, serving as a robust foundation for decision support.
Tamuke et al. (
2018) conducted an in-depth analysis of ARIMA and ARIMAX methodologies for predicting the headline consumer price index (HCPI) in Sierra Leone. Their research illuminated the suitability of both ARIMAX and ARIMA methodologies in providing accurate projections of HCPI trends, underscoring their potential for facilitating decision making in economic planning and policy development.
Jordan and Messner (
2019) explored the utilization of predict accuracy indicators and dynamic methods to enhance planning quality, with a focus on a practical case study of a manufacturing company. Their research underlined the critical role of organizational and market context in shaping the quality of performance measures, underscoring the importance of context-specific performance evaluation.
Prayudani et al. (
2019) delved into a method for measuring prediction accuracy using mean squared error (MSE) and mean absolute error percentage (MAPE) in conjunction with random K-nearest neighbor (RKNN). Their investigation yielded impressive results, exemplifying the potential for enhancing prediction accuracy through carefully selected error metrics and algorithmic approaches.
Bandara et al. (
2021) introduced a data-intensive forecasting approach to improve global forecasting models (GFM) accuracy, particularly in settings with limited data abundance. They harnessed time series augmentation techniques, including GRATIS, moving block bootstrap (MBB), and dynamic time warping barycentric averaging (DBA), to generate synthetic time series data. Their study advocated two strategies, the pooled and transfer learning strategy, with the pooled strategy being more suitable for smaller datasets and the transfer strategy excelling with more comprehensive data.
Safarkhani and Moro (
2021) made significant strides in developing an accurate ratin tool to predict customer subscription to long-term bank deposits. Their approach sought to reduce the complexity of data modeling while enhancing the classification algorithm performance. The research demonstrated improvements in classification accuracy when compared to the existing methods, emphasizing the efficacy of the proposed fuzzy algorithm and other modeling techniques.
Koutsandreas et al. (
2021) conducted a meticulous analysis of the measures of forecasting accuracy, exploring whether the relative order of forecasting methods changes across different accuracy metrics. Their research illuminated the minor differences between various error measures, both in terms of percentage, relative, and scale measures, providing valuable insights for accurate forecasting.
Van Khanh et al. (
2021) introduced a method to enhance the efficiency of the fuzzy time series prediction model by leveraging swarm optimization algorithms and a novel puzzle removal technique. Their findings demonstrated the superior efficiency of the proposed forecasting model for both first-order and high-order fuzzy time series predictions, setting the stage for enhanced predictive capabilities.
Nystrom (
2021) put forward a wavelet-enabled prediction methodology for lightning, using chaotic EFM data. The application of wavelet denoising to chaotic time series EFM was found to be promising in enhancing lightning prediction accuracy, particularly when compared to the basic persistence model. Additionally, the research highlighted an improved imputation method that generated prediction accuracy exceeding 95%, a noteworthy achievement in the field of meteorological forecasting.
Gisavandani et al. (
2022) delved into the impact of discrete wave transformations (DMODWTs) on machine learning (ML) models. Their research evaluated the performance of regression and classification models in estimating daily downtime and sediment loading (SSL). The study introduced innovative methods, such as TOPSIS and maximum interference DMODWT (MODMODWT), to enhance ML models. The findings underscored the potential of DMODWT in improving the accuracy of ML models, with the TOPSIS method and Taylor chart RT-MODMODWT-db4 being identified as the most effective models for estimating daily SSL.
Moving towards artificial intelligence tools in forecasting, a particular focus emerged on neural networks and their integration with wavelet transformations.
Tealab et al. (
2017) presented novel neural network models, including deep learning neural networks, with or without hybrid methodologies like fuzzy logic, to address the shortcomings of traditional neural networks. Their research aimed at improving predictive accuracy, particularly for nonlinear or dynamically changing time series data, with significant potential for performance enhancement.
Mehdiyev et al. (
2016) emphasized the evaluation of the prediction model performance, highlighting the importance of accuracy measures. The study undertook a comprehensive review of prediction technologies, including Bayesian networks, artificial neural networks, support vector machines (SVM), logistic regression, and others, accompanied by an in-depth analysis of accuracy metrics. This research provides a comprehensive reference for selecting the appropriate measures of accuracy to evaluate the performance of prediction models.
Bozic and Babić (
2018) proposed a hybrid model that integrated wavelet transform, neural networks, and statistical time series models to enhance prediction accuracy. The research demonstrated the potential for noise reduction through the application of wavelet basis functions, ultimately generating more accurate results. Their work has implications for improving predictive.
This article is organized as follows: the mathematical models will be discussed in
Section 2. Then, the research design and methodology are explained in
Section 3.
Section 4 will discuss the data set and the results of the study. Finally,
Section 5 will conclude this research.
4. Research Design and Methodology
The research objectives can be succinctly delineated as follows: firstly, to model banking time series data through the utilization of the maximal overlap discrete wavelet transform (MODWT); secondly, to scrutinize fluctuations within historical data sourced from the Amman Stock Exchange (ASE), spanning the years 2011 to 2020; and finally, to enhance forecasting accuracy by integrating MODWT functions with a fitted autoregressive integrated moving average (ARIMA) model.
In greater detail, the employed methodology involves the decomposition of data using MODWT functions, specifically Haar, Daubechies (d4), Coiflet (c4), least symmetric (LA8), and best localized (Bl14), applying them to historical return data. Subsequently, the detailed coefficients are employed to identify fluctuations and analyze the historical volatility data. A fitted ARIMA model, utilizing the approximation coefficients, is then employed for forecasting. The proposed technique is subsequently compared with a direct ARIMA modeling approach.
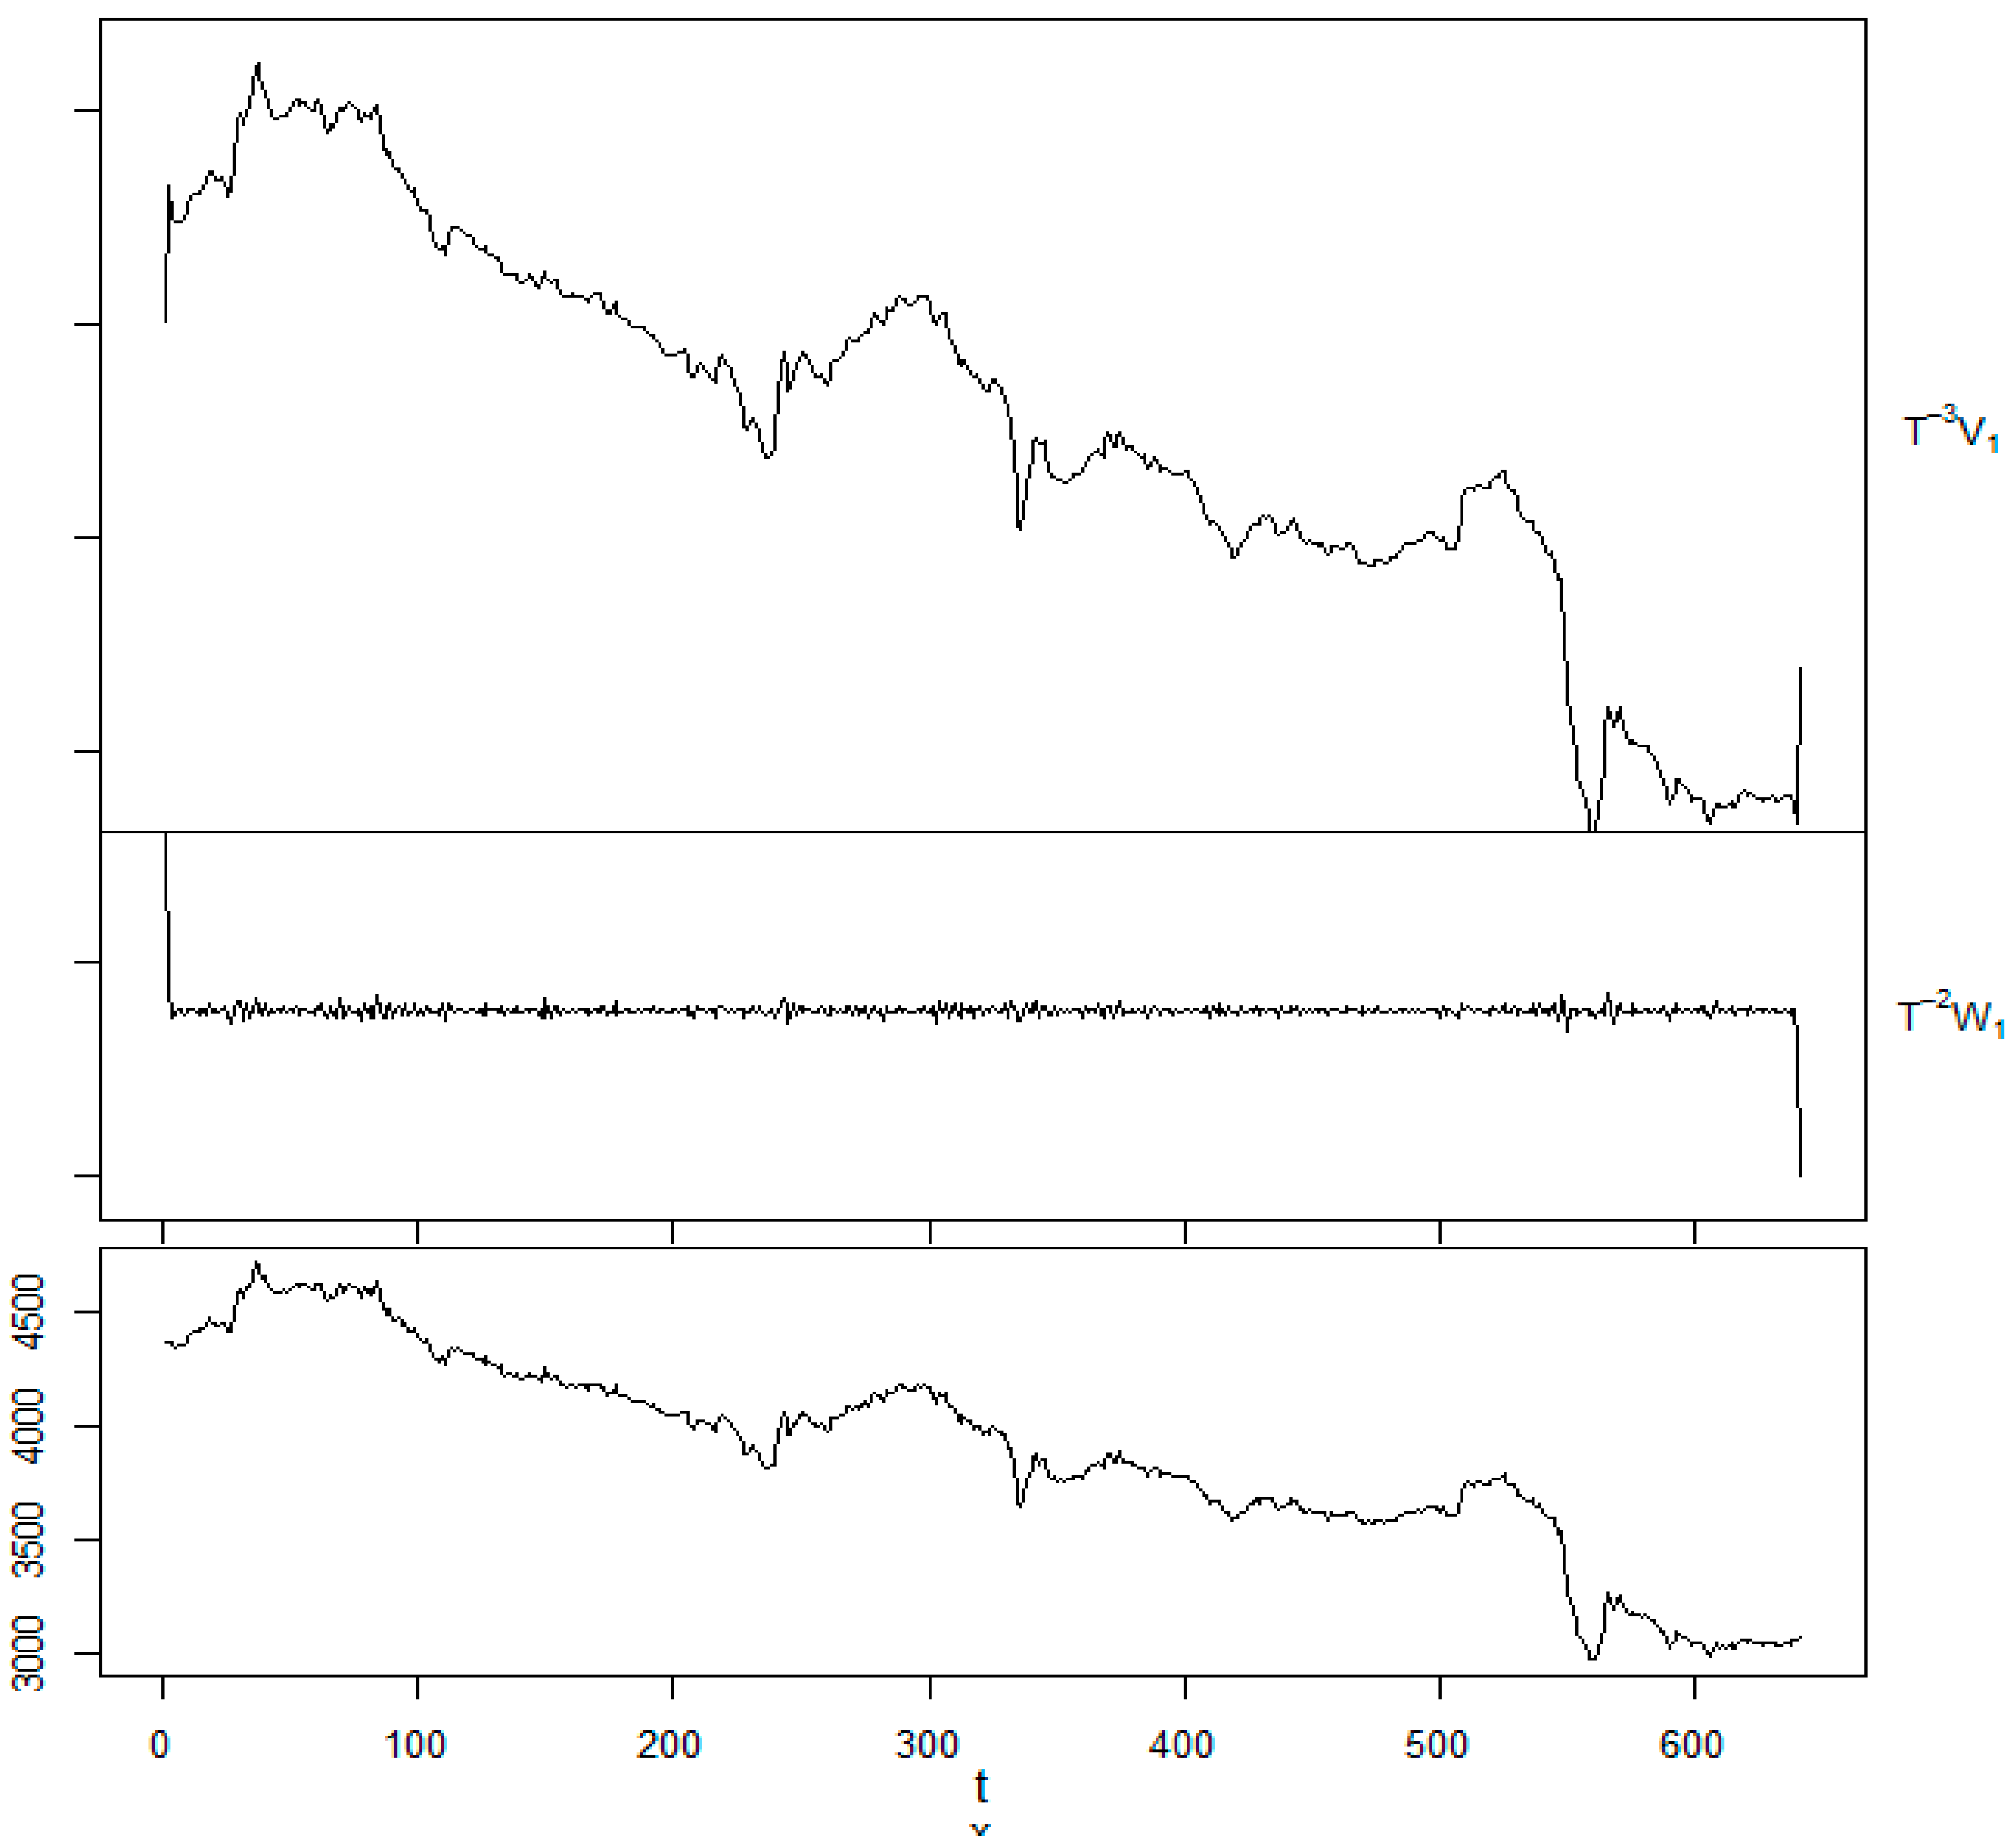
The proposed method operates by transforming data into two sets: details series (DA1 (n)) and approximation series (CA1 (n)), which exhibit favorable characteristics for financial data due to its significant fluctuations. The filtering effect of MODWT contributes to the efficacy of these series, particularly in handling rough data patterns. The authors emphasize the repeated application of the wavelet process in instances of highly erratic data patterns. Pre-processing aims to minimize statistical criteria, such as root mean squared error (RMSE), between the signal before and after transformation, thus facilitating noise removal from the original data. The authors advocate for the adoption of MODWT twice during the pre-processing of training data to mitigate overfitting risks, in accordance with prior research (
Gençay et al. 2001).
For a fair comparison, the authors allocate 90% of the dataset, encompassing both original and transformed data, to the proposed model, selecting the best model for further application. The chosen model is then tested against other proposed models using the remaining 10% of the data. This approach, while different from the conventional 90/10 data division, is justified by the substantial dataset at the authors’ disposal.
6. Conclusions
This article undertakes a comprehensive investigation into the volatility pattern inherent in the Amman Stock Exchange (ASE), encompassing modeling, study, and the enhancement of forecasting accuracy. The analytical focus is directed toward the entire closed price index dataset spanning the temporal domain from October 2014 to December 2022. The analytical framework employed herein rests upon a non-linear spectral model, specifically the maximum overlapping discrete wavelet transform (MODWT), utilizing the Coiflet function (C6), in conjunction with the autoregressive integrated moving average (ARIMA) model.
Throughout the article, particular attention is devoted to the examination of fluctuations and noteworthy events within the ASE during the specified period. These fluctuations and events are subjected to a detailed discussion, elucidating their implications and thus contributing to a holistic understanding of the observed volatility pattern. Furthermore, the article introduces a novel model, denoted as ARIMA–MODWT utilizing the C6 function. This model is systematically evaluated against alternative models, with the fitted ARIMA model serving as a benchmark. The comparative analysis is grounded in statistical criteria, encompassing metrics such as the mean squared error (MSE), root mean squared error (RMSE), mean absolute error (MAE), and mean absolute percentage error (MAPE).
The findings of this comparative analysis substantiate the superiority of the proposed ARIMA-MODWT model employing the C6 function. Noteworthy improvements are evident in forecasting accuracy, as indicated by the aforementioned statistical metrics. This underscores the efficacy of MODWT in the decomposition of the dataset, thereby facilitating the identification and comprehension of significant events. The integration of MODWT contributes meaningfully to the forecasting capabilities, rendering the proposed model particularly robust.
The results of this research can be extended to future works by, for example, applying this method in other international stock markets. Moreover, many other types of data can be used, such as gold price, oil price, and others, which will be useful for investors and for decision making.


 ,
, 
