


Abstract
The Lucy LOng Range Reconnaissance Imager (L'LORRI) took 1549 images of the Didymos–Dimorphos binary system, starting 12 hr before the Double Asteroid Redirection Test (DART) impact event on 2022 September 26 and ending 24 hr after it. The Lucy imaging campaign provided pre-impact monitoring of the baseline brightness of the Didymos system, as well as intensive 1 s cadence imaging starting 3 minutes prior to impact and extending until 4 minutes after impact, and then continued monitoring at increasing cadences and image exposure times to measure the Didymos system brightness changes produced by ejecta released during the impact. One of the L'LORRI images encompassed the exact time when the DART spacecraft impacted Dimorphos, but there is no evidence of a thermally generated optical flash in the image. L'LORRI observed a shell of fast-moving ejecta, and we derive a range of projected speeds (∼0.26–3.6 km s−1) for that material. The much slower moving ejecta (≲1 m s−1) stayed within a single L'LORRI pixel for the entire duration of the Lucy-DART program. We find that the slow ejecta were responsible for 57.4% ± 2.2% of the total post-impact brightness increase measured by L'LORRI, while the fast ejecta were responsible for 42.6% ± 2.3% of the post-impact brightness increase. The initial brightness increase relative to the pre-impact Didymos system brightness was significantly smaller for L'LORRI compared to that measured by some ground-based observers, which is plausibly explained by differences in phase angles and different responses to sodium emission depending on the camera spectral bandwidths.
Export citation and abstract BibTeX RIS

Original content from this work may be used under the terms of the Creative Commons Attribution 4.0 licence. Any further distribution of this work must maintain attribution to the author(s) and the title of the work, journal citation and DOI.
1. Introduction
NASA's Lucy mission is the first to provide flyby reconnaissance of the Jovian trojan asteroids, which are thought to be primordial small bodies that formed at a variety of heliocentric distances during the early stages of the solar system's formation and were subsequently captured into Jupiter's L4 and L5 Lagrange stability zones (Levison et al. 2021). Since its successful launch on 2021 October 16, the Lucy spacecraft has been orbiting the Sun within the inner solar system. On 2022 October 16, Lucy executed the first of three Earth gravity assists (EGAs) that put the spacecraft on the correct trajectory to achieve its encounters with the Jovian trojans. The Double Asteroid Redirection Test (DART) kinetic impact on the secondary body of the Didymos–Dimorphos binary system occurred 20 days prior to EGA1, at a time when the Lucy spacecraft was well placed to observe it. Lucy carries a sensitive panchromatic camera, the Lucy LOng Range Reconnaissance Imager (L'LORRI; Weaver et al. 2023), which detected the binary system with high signal-to-noise ratio (S/N) and with temporal cadences as fast as once per second.
The observing geometry from Lucy was different from the terrestrial view: the range to the Didymos system was 0.126 au from Lucy versus 0.0757 au from Earth, and the solar phase angle was 31 9 versus 532 (see Figure 1). Although L'LORRI is a relatively small telescope (with a 20 cm diameter primary mirror) and was farther from Didymos than Earth was, Lucy's camera provided observations at the exact time of impact (to within 1 s), as well as essentially continuous coverage of the early development of the impact plume, unencumbered by weather, time-of-day, or Earth occultation issues (e.g., Earth occultation of the Hubble Space Telescope precluded observations until ∼15 minutes after impact; Li et al. 2023). Fortunately, excellent weather conditions generally prevailed at multiple Earth-based observing sites that had visibility of the Didymos system at the time of the DART impact event, producing voluminous amounts of excellent data (see Thomas et al. 2023). The Lucy data provide unique complementary information on the DART impact event, and the Lucy results can be compared to those obtained from other facilities. In the following sections, we discuss the results from the Lucy-DART investigation and their implications for our understanding of the DART impact event.

Figure 1. The geometry of the DART impact observations as viewed from Earth and the Lucy spacecraft. Left: centered on the Sun (yellow) and showing the orbit of Earth (blue), the path of the DART spacecraft (white), and partial views of Didymos's orbit (orange) and the path of the Lucy spacecraft (cyan). Right: centered on Didymos and depicting the orbit of Dimorphos (orange) and the directions to the Sun, the Lucy spacecraft, and Earth at the time of the DART spacecraft impact into Dimorphos. The table in the lower right corner gives the distance to Didymos from Earth and the Lucy spacecraft (Δ) and the solar phase angle (ϕ) at the time of impact.
Download figure:
Standard image High-resolution image2. Results
2.1. Observations
All of the Lucy observations discussed here were taken with L'LORRI (Weaver et al. 2023), which is the highest-resolution and most sensitive optical imager on the Lucy spacecraft. L'LORRI has two image formats: the 1 × 1 format has 1024 × 1024 optically active pixels, while the 4 × 4 format combines four rows and four columns of data during the CCD readout, resulting in images with 256 × 256 pixels. All of the L'LORRI images obtained during the DART impact investigation were taken in the 4 × 4 format, with each individual pixel subtending 4 0595 on a side, which projects to a spatial scale of 371 km at Didymos. L'LORRI's full field of view (FOV) is 17
 3516 × 173492, independent of CCD format.
The L'LORRI images were processed by the Lucy calibration pipeline, which included exposure time correction (when necessary), bias subtraction (a two-step process), frame transfer correction, and flat-fielding, as described further in Weaver et al. (2023). The calibrated images have low-signal level (≤5 DN) scattered light artifacts, probably associated with the presence of the bright Earth only 28° from the instrument boresight. We first removed an average background level from each each image (using row and column averages in two separate passes), and then we subtracted a background image that removed essentially all the scattered light artifacts. This background image was created using three different median images: one was the straight median of 280 pre-impact 9.9 s images, one was a median of 124 pre-impact 9.9 s images that had Didymos in the same location, and one was a median of 156 pre-impact 9.9 s images that had Didymos in a different location. The straight median of 280 images had faint residuals of Didymos in two locations (the same locations as in the other two median images), but those areas were replaced by the appropriate areas of the other two median images, producing a final background image that essentially had no trace of Didymos itself. All of the analysis discussed here employed these background-subtracted L'LORRI images. Figure 2 shows a composite image of Didymos, produced by combining 280 of the background-subtracted pre-impact images. Each of the images included in the composite had an exposure time of 9.9 s, which means that the total on-target exposure time was 2772 s (46.2 minutes).

Figure 2. A composite pre-impact Didymos image produced by averaging 280 of the 9.9 s pre-impact images, cropped to 128 × 128 pixels centered on Didymos, and using an ASINH intensity stretch ranging from −0.3 to 180 DN. The compass shows the directions of celestial north (N) and east (E), and the scale bar is 30'' across.
Download figure:
Standard image High-resolution imageFrom a robust mean of the pre-impact 9.9 s L'LORRI images, we derive a Didymos system signal level (integrated over the point-spread function) of 36.89 ± 1.65 DN s−1, where the error refers to the standard deviation (σ) of all the individual measurements (265 points total, after deleting outliers), not the error in the mean. Note that this error includes light-curve variation intrinsic to Didymos, which has an amplitude of ±4%. We used the observed spectral energy distribution (SED) of Didymos and the L'LORRI exposure time calculator to determine a "color correction" (0.054) that allowed us to convert the measured L'LORRI count rate to a V-mag in the standard Johnson–Cousins magnitude system (Weaver et al. 2023). The mean pre-impact V-mag of Didymos measured by L'LORRI (15.099 ± 0.049) is within the range of values predicted (14.96 ≤ V ≤ 15.11) using the absolute V-mag (Hv = 18.160 ± 0.042) and phase law (G = 0.20 ± 0.02) cited by Pravec et al. (2012). All the L'LORRI V-mags given in this paper quote 1σ measurement uncertainties, as determined by the S/Ns of the relevant observations. We note, however, that there is an additional absolute calibration uncertainty that depends on the SED of the target (Weaver et al. 2023), which we estimate to be ∼3% for a Didymos-like SED.
The L'LORRI investigation of the DART impact event was divided into eight separate observational phases, starting 12 hr before the impact and ending 24 hr afterward (Table 1). L'LORRI could not resolve the binary, but instead recorded the total brightness of the system, which increased after the DART impact owing to reflected sunlight from the ejecta. The first two phases were designed to obtain baseline photometry of the Didymos system covering both the Didymos–Dimorphos mutual orbit period (11.92 hr) and the rotational period of Didymos (2.26 hr). In both phases, we took sets of five 9.9 s exposures, with a new image taken every 10 s for each set. In phase 1, each set was repeated every 900 s, while each set was repeated every 420 s for phase 2. Phase 3 covered the impact event itself at 1 s cadence, starting 3 minutes before impact and ending 4 minutes afterward. Lucy had a clear view of the predicted DART impact site, theoretically enabling L'LORRI to detect an optical flash in the unlikely event that it was brighter than Didymos itself (see later discussion). L'LORRI observations during phases 4–8 were designed to monitor the temporal and spatial evolution of ejecta associated with the impact event. In each of those phases, pairs of images with different exposure times were taken, and the pairs were repeated at the cadences listed in Table 1. The shorter exposure times (0.1 s) were taken to ensure that there would be no CCD saturation even if the DART ejecta cloud was unexpectedly bright, but none of the 9.9 s images were saturated, so the shorter exposures were excluded from our analysis of phases 4–8. A total of 1549 L'LORRI images were taken during the Lucy-DART campaign, but our analysis is restricted to 1137 images (i.e., excluding the 412 images with 0.1 s exposure times). Finally, we note that the Lucy-DART observing plan had to be finalized several months in advance of its execution on the spacecraft (this is the nominal timeline for the Lucy mission planning process), and the L'LORRI images could not be downlinked to the ground until ∼3 weeks after the DART impact.
Table 1. L'LORRI Observing Plan for the DART Impact Event
| Phase | Start | Stop | Texp | Cadence | No. Images |
|---|---|---|---|---|---|
| (hr from impact) | (hr from impact) | (s) | (s) | ||
| 1 | −12.000 | −3.000 | 9.9 | 900 | 180 |
| 2 | −3.000 | −0.050 | 9.9 | 420 | 125 |
| 3 | −0.050 | +0.067 | 0.9 | 1 | 420 |
| 4 | +0.067 | +0.200 | 0.1, 4.9 | 13 | 74 |
| 5 | +0.200 | +0.800 | 0.1, 9.9 | 20 | 216 |
| 6 | +0.800 | +3.000 | 0.1, 9.9 | 120 | 132 |
| 7 | +3.000 | +9.743 | 0.1, 9.9 | 360 | 136 |
| 8 | +10.743 | +24.000 | 0.1, 9.9 | 360 | 266 |
Note. The Lucy LORRI (L'LORRI) observing plan consisted of eight separate observing phases (labeled 1 through 8) spanning from 12 hr before impact to 24 hr after impact. "Start" and "Stop" give the start and stop times for each phase, relative to the impact time, which occurred at 2022 September 26 23:15:26.944 UTC as viewed from the Lucy spacecraft. The exposure times ("Texp") for each image taken during each phase, the time between consecutive sets of images (or pairs of images) in each phase ("Cadence"), and the number of images taken during each phase ("No. Images") are all listed. Relatively short exposures (0.9 s) were taken at 1 s cadence starting 3 minutes before impact and extending through 4 minutes after impact to provide the best possible temporal coverage of the event. The 1 hr gap between phases 7 and 8 was needed to perform a momentum dump of the spacecraft's reaction wheels. See the text for further discussion.
Download table as: ASCIITypeset image
2.2. Photometry
Figure 3 displays L'LORRI photometry of the Didymos system spanning all eight phases of the Lucy-DART program. For all the plotted points, the measured signal (DN s−1) is derived from aperture photometry using a 3-pixel-radius (1113 km radius projected distance at Didymos) circular aperture centered on Didymos after subtraction of a background signal derived from the mode of the pixels contained in an annular region with an inner radius of 10 pixels and an outer radius of 15 pixels from the centroided Didymos location. The pre-impact photometry shows only small signal variations (∼8% peak-to-trough amplitude) consistent with the ground-based pre-impact light curve (see Thomas et al. 2023). A periodogram analysis of the pre-impact L'LORRI 9.9 s exposures shows a well-defined rotational period of 2.266 ± 0.004 hr (1σ), which is consistent with the known rotational period of Didymos (2.2600 ± 0.0001 hr; Pravec et al. 2006) at the 2σ level. The L'LORRI pre-impact light-curve data are also consistent with the known Didymos–Dimorphos orbital period (11.92 hr), but the relatively short sampling period (12 hr pre-impact) is not long enough to definitively determine the orbital period.

Figure 3. L'LORRI photometry of the DART impact event. The image inset in the upper right corner shows the placement of the synthetic photometry apertures on a L'LORRI image of the Didymos system shortly after the impact: the green circle is used to determine the "target" signal (3-pixel radius, projecting to 1113 km at Didymos), after subtraction of a background signal derived from the measured level in the annular regions defined by the cyan (inner radius is 10 pixels) and magenta (outer radius is 15 pixels) circles. The large dip in the photometry near 1 hr post-impact is caused by the fast ejecta moving into the background annulus, but by ∼6 hr after impact all the fast ejecta had exited the background region and the signal settled down to a steady-state value. The mean count rates and V-mag values of pre-impact Didymos (dashed blue line), the fast+slow ejecta (dashed orange line), and the slow ejecta (dashed red line) are also indicated. A dashed pink vertical line indicates the impact time of the DART spacecraft into Dimorphos, as viewed from Lucy. See the text for further discussion.
Download figure:
Standard image High-resolution imageThe impact time at the DART spacecraft was 2022 September 26 23:14:24.183 ± 0.0015 s UTC (Daly et al. 2023), which, after accounting for the light-travel time, translates to an impact time of 2022 September 26 23:15:26.944 UTC as viewed from the Lucy spacecraft. The impact of the DART spacecraft into Dimorphos resulted in a sharp rise in the signal from the Didymos system, which was produced by light from the subsequently released ejecta. As confirmed by observations from multiple other facilities (see Fitzsimmons et al. 2023), the ejecta could be divided into two different groups: the "fast ejecta," which were moving away from Didymos with sky-projected speeds up to a few kilometers per second, and much slower moving ejecta (≲1 m s−1) that stayed within a single L'LORRI pixel for the entire duration of the Lucy-DART program. The pre-impact mean signal level was 36.89 ± 1.65 DN s−1, the mean signal level of the slow ejecta was 116.11 ± 2.11 DN s−1, and the peak signal level of the fast plus slow ejecta (derived from a single 4.9 s image taken 305 s after impact) was 175 ± 2 DN s−1. Thus, we find that the slow ejecta was responsible for 57.4% ± 2.2% of the total post-impact brightness increase measured by L'LORRI, while the fast ejecta was responsible for 42.6% ± 2.3% of the post-impact brightness increase. The V-mag values associated with the pre-impact and post-impact signals are provided in Figure 3. The spatial morphology of the ejecta is displayed in Figure 4.
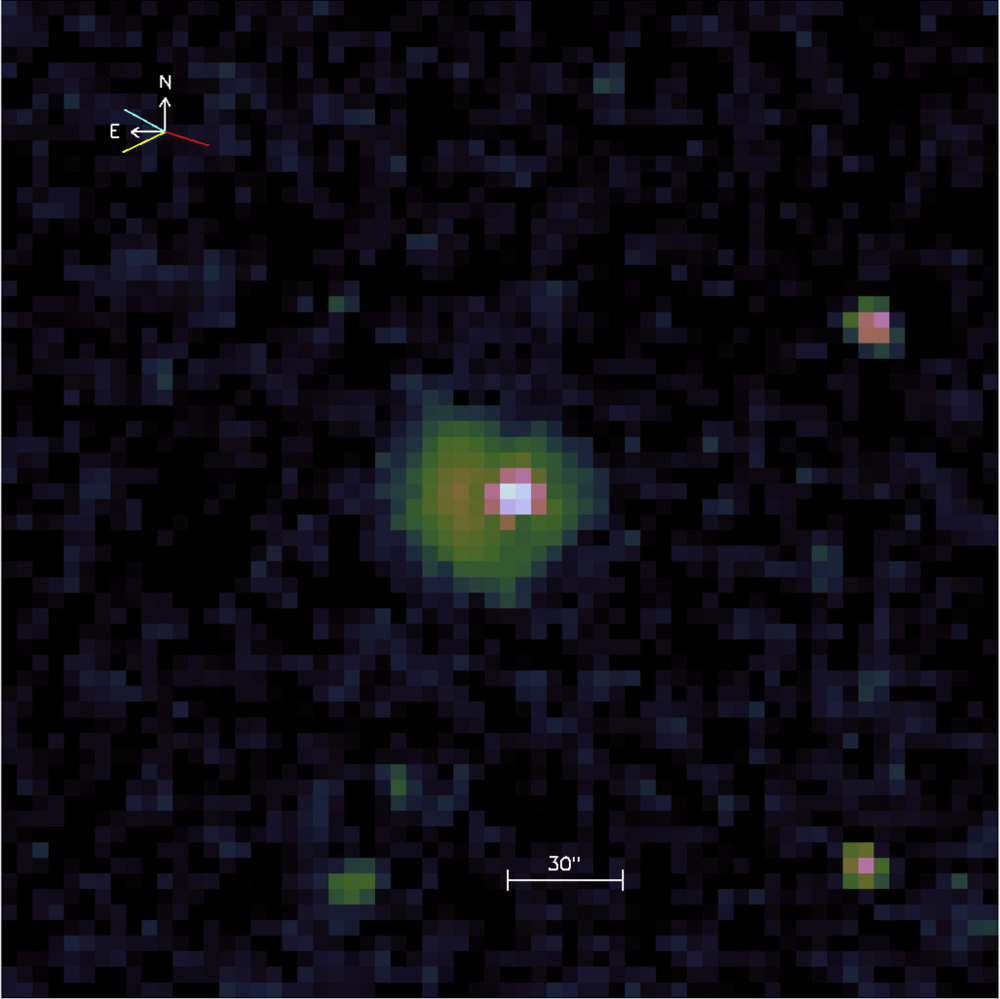
Figure 4. Composite of five L'LORRI images of the Didymos system, each with an exposure time of 9.9 s, after subtraction of the pre-impact image of Didymos to better reveal the ejecta morphology. The image is displayed using an ASINH intensity stretch (ranging from −1 to 1000 DN) and a cubehelix color scheme. The mid-exposure time was 897 s (14 minutes 57 s) after the DART impact. The frame is centered on Didymos; each pixel subtends 371 km at Didymos. Projected directions to the Sun (yellow), Didymos's heliocentric velocity (cyan), and the DART spacecraft velocity (red) are shown; the compass shows celestial north (N) and east (E). Slower-moving dust is concentrated near the location of Didymos, but there is also a shell of early-released, fast-moving (up to ∼3.6 km s−1 projected speed) ejecta that is more concentrated to the east. Other objects in the field are stars.
Download figure:
Standard image High-resolution imageThe projected speeds of the fast-moving ejecta were measured by looking carefully at the L'LORRI photometry and finding where the ejecta entered, or exited, either the target aperture or the background annular region, and when the Didymos system brightness settled down to a relatively constant value after all the fast ejecta had left the synthetic apertures and no new ejecta were being produced. The timings of these inflections in the photometry are noted in Figures 3 and 5, the latter being a zoomed-in version of the former. The fastest ejecta started to leave the target aperture ∼305 ± 5 s after impact, which corresponds to a projected outflow speed of ∼3.6 ± 0.1 km s−1. The target signal starts to dip below the eventual asymptotic value ∼1094 s after impact, which is when ejecta moving with a speed of ∼1.7 km s−1 starts entering the background annulus. All of the fast ejecta seem to have exited the outer radius of the background region by ∼6 hr after the impact, which implies that the slowest of the fast ejecta had projected speeds of ∼0.26 km s−1. We also measured the location of the peak brightness (which presumably defines the location of peak mass outflow for the fast ejecta; see Figure 4) and derived a projected speed of ∼1.4 ± 0.2 km s−1. All the above fast ejecta outflow speeds are consistent with those derived from measurements at other facilities (Fitzsimmons et al. 2023; Graykowski et al. 2023).
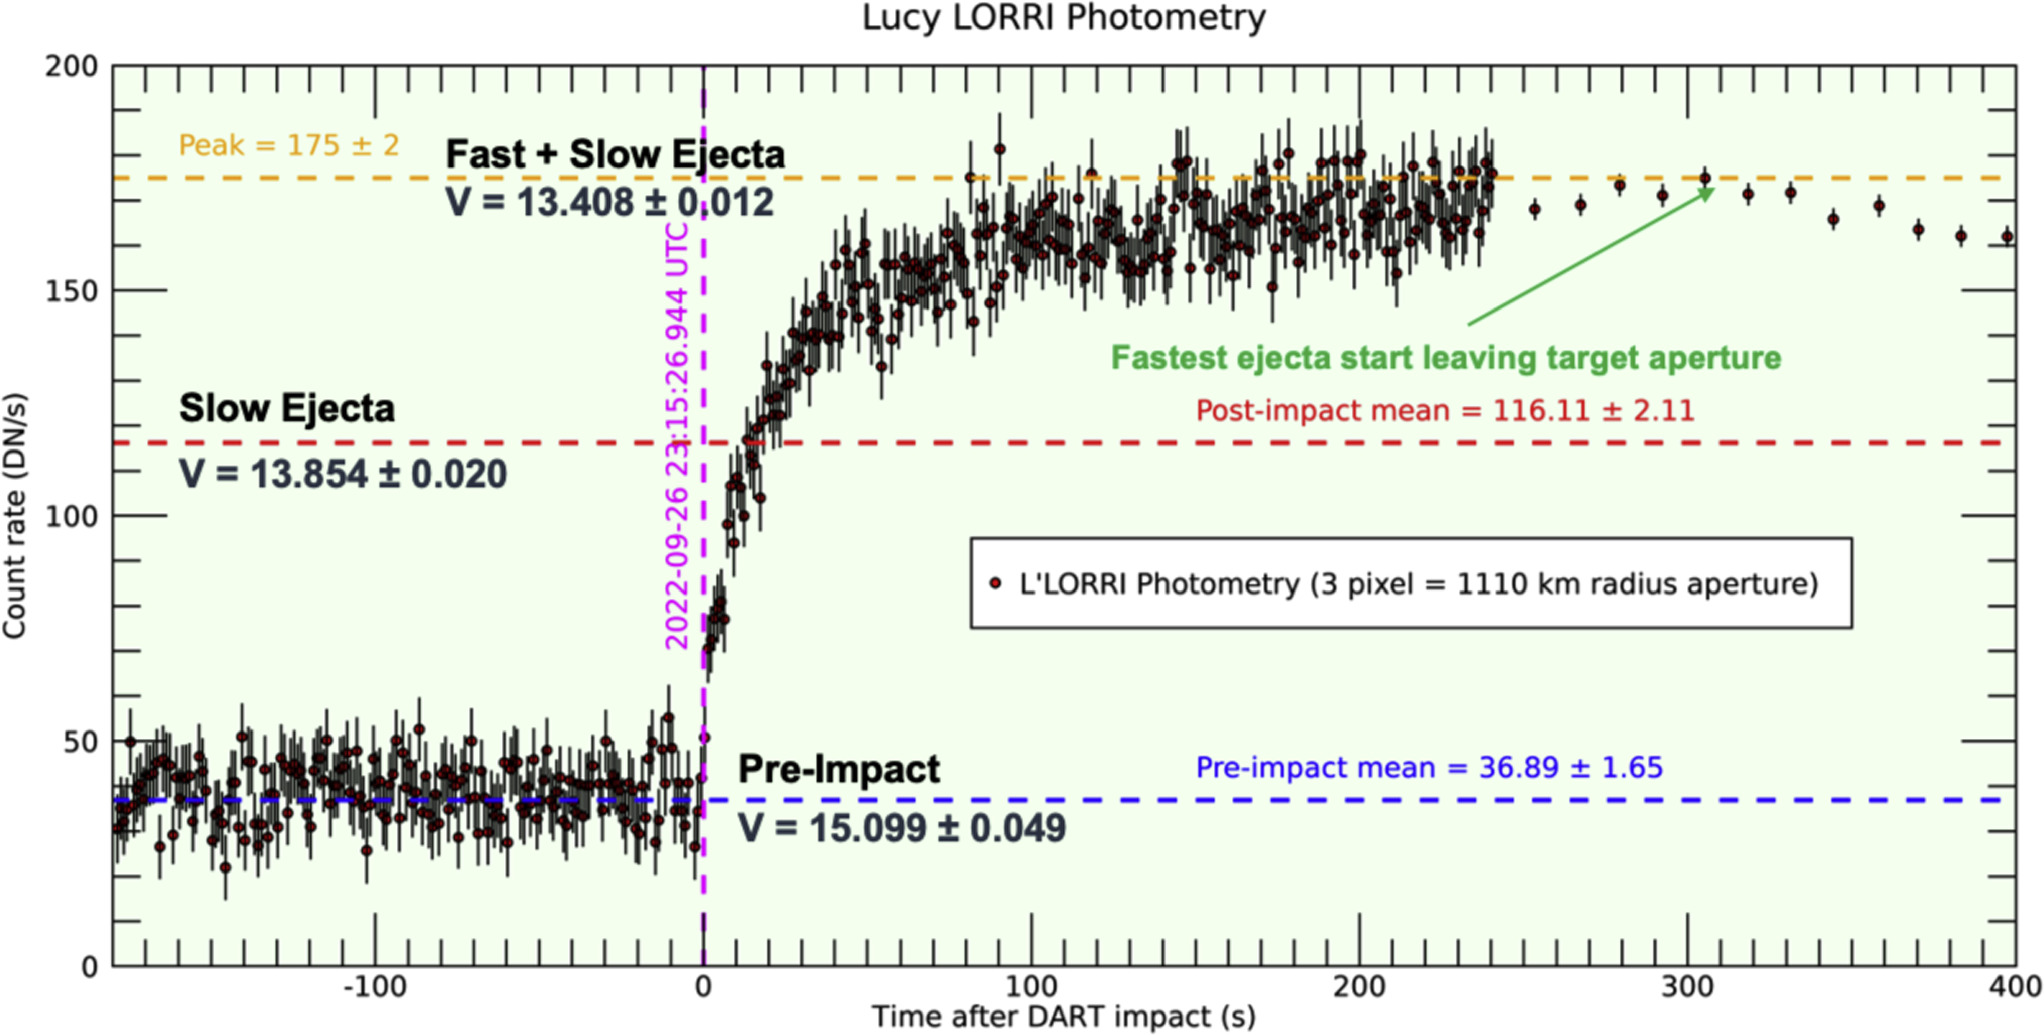
Figure 5. L'LORRI photometry spanning from 180 s before to 400 s after the time of the DART impact event. Points from the first 7 minutes (3 minutes before to 4 minutes after the impact) were derived from 0.9 s exposures taken at 1 Hz cadence. The other points were derived from 4.9 s exposures taken every 13 s. The fastest-moving ejecta start to leave the target aperture (3-pixel radius) at ∼305 s after the impact, as indicated by the green arrow. The mean count rates and V-mag values of pre-impact Didymos (dashed blue line), the fast+slow ejecta (dashed orange line), and the slow ejecta (dashed red line) are also indicated. A dashed pink vertical line indicates the impact time of the DART spacecraft into Dimorphos, as viewed from Lucy. See the text for further discussion.
Download figure:
Standard image High-resolution image2.3. Search for an Impact Flash
L'LORRI's unobscured view of the DART spacecraft impact into Dimorphos motivated us to design an observing plan that enabled searching for a thermally generated optical impact flash associated with the impact event. In laboratory impact experiments, the self-luminous impact flash typically lasts less than a millisecond (Ernst & Schultz 2003), but lunar meteoroid impact flashes can last up to 600 ms (Ortiz et al. 2002). Analysis of the temporal evolution of the flash detected when the Deep Impact spacecraft impacted into comet 9P/Tempel (when a 370 kg projectile was directed at 10.3 km s−1 into the comet nucleus; A'Hearn et al. 2005) showed that there were three different phases: (1) a relatively faint "first light," (2) a very bright "central flash" that saturated the images, and (3) self-luminous light from a downrange-moving "vapor plume" (Ernst & Schultz 2007). The morphology of the latter vapor plume resembles the outflowing partial shell of optical emission associated with the fast ejecta detected from multiple facilities (including Lucy) after the DART impact event, but the Deep Impact vapor plume was only visible within the first second after that impact, whereas the shell of fast ejecta from the DART impact event could be tracked for multiple minutes. We were interested in determining whether L'LORRI could detect any "central flash" from the DART impact, in addition to the outflowing ejecta.
Although L'LORRI can take exposure times as short as 1 ms, the maximum cadence of L'LORRI images is 1 Hz. And for exposure times smaller than 1 s, there is effectively a "dead time" of 100 ms in each 1 s interval (in addition to a frame scrub and frame transfer, each lasting ∼12 ms, ∼76 ms is set aside for various detector processing steps), producing a "window" of up to 900 ms when imaging can take place. Given the uncertainties in the exact impact time (more than 1 s when the Lucy-DART observing program was being designed) and the uncertainty in the timing of L'LORRI exposures (the requirement is 1 s for planning, but ground calibration suggests that the post-observation time-tagging should be accurate at the 1 ms level), we decided to use L'LORRI exposure times of 900 ms to improve the chances that the impact time would land somewhere within L'LORRI's exposure window. Indeed, the DART impact time was 99 ms after the start of one of the L'LORRI images and 801 ms before the end of that image, which means that that image successfully captured the impact event.
Figure 6 shows the photometry for the ejecta only (i.e., the pre-impact Didymos signal has been subtracted) starting 50 s before impact and extending to 100 s after impact. There is a rapid rise in signal during the first 2 s, a leveling-off of the signal for ∼5 s, another rapid rise in signal starting at ∼7 s, followed by a steady rise for the next ∼40 s and a very minor increase in signal after that. However, there is no obvious "flash" because the image that captured the impact event has a signal level that is 2–3 times smaller than the signal in the following image. Presumably there was an impact flash, but its duration must have been so short that its integrated brightness was extremely diluted over the 900 ms exposure time and was dwarfed by the signal from scattered sunlight produced by any ejected material, whose signal was present (and increasing) over the entire 900 ms exposure.
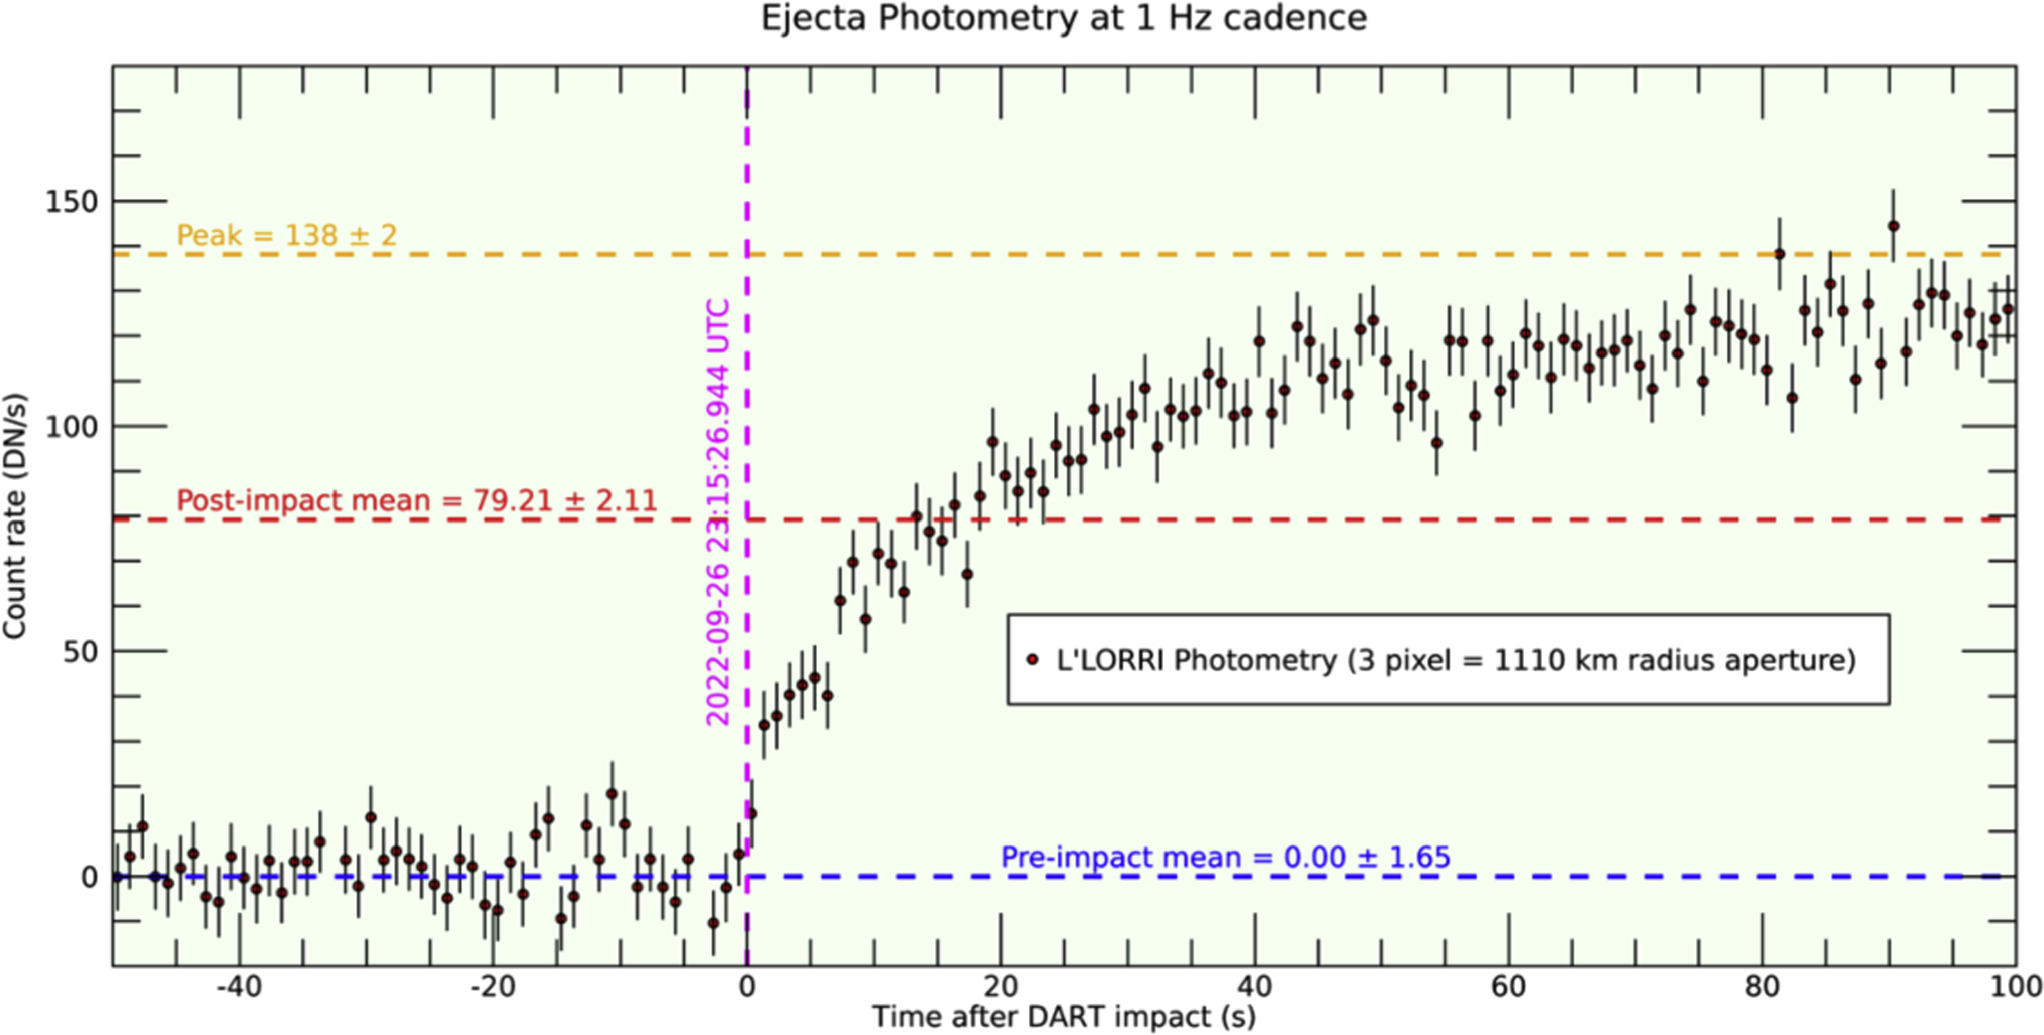
Figure 6. L'LORRI photometry of the ejecta only (i.e., pre-Didymos signal has been subtracted) starting 50 s before the time of the DART impact event and ending 100 s after the impact. The mean count rates for the pre-impact period (dashed blue line), for the fast+slow ejecta peak (dashed orange line), and for the post-impact mean signal of the slow ejecta (dashed red line) are also indicated. A dashed pink vertical line indicates the impact time of the DART spacecraft into Dimorphos, as viewed from Lucy. See the text for further discussion.
Download figure:
Standard image High-resolution imageWe have used the L'LORRI data to constrain the properties of the central flash. As a criterion for flash detection, we require the signal from the L'LORRI image overlapping the DART impact to be at least as bright as the signal in the following L'LORRI image. The overlap image has a signal of 15.4 ± 8.2 DN s−1, while the next image has 37.4 ± 8.2 DN s−1. Thus, we assume that a signal of 40 DN s−1 in the overlap image is sufficient to claim detection of the flash. We assume an SED of a 4000 K blackbody for the self-luminous ejecta; Schultz et al. (2007) suggested 3900–4200 K as the range for the Deep Impact central flash. We assume that the duration of the flash is 100 ms, which gives the following relations:


where "CF" refers to the average central flash signal rate for a 100 ms time interval somewhere within the L'LORRI exposure containing the DART impact time. With the above assumptions, we find that a flash having V = 12.85, or brighter, and a duration of 100 ms would have been detected by L'LORRI. Thus, a flash lasting 100 ms would have needed to be ∼8 times brighter than the pre-impact Didymos system to have been detectable by L'LORRI.
Given that the kinetic energy of the DART impact was only about half that of the Deep Impact event (∼11 GJ vs. ∼19 GJ), we would expect the DART flash to have a lower brightness, a shorter duration, and a cooler temperature compared to Deep Impact. Thus, our inability to detect the DART flash with L'LORRI is not surprising; shorter exposure times, faster image cadences, and possibly a more sensitive camera are required to characterize optical flashes for these types of impacts.
2.4. Amplitude of the Ejecta Signal: Lucy versus ATLAS
Figure 7 compares the L'LORRI photometry to that obtained from the Asteroid Terrestrial-impact Last Alert System (ATLAS; Tonry et al. 2018) facility in South Africa. In both cases, the photometry refers to the signal collected in apertures projecting to the same physical size at Didymos (∼1100 km radius aperture). The ATLAS photometry discussed here was taken through the "cyan" filter, usually referred to as the "c band," which covers a wavelength range of 420–650 nm (at the 50% of peak sensitivity values). We have subtracted a constant value from the raw ATLAS magnitudes so that its pre-impact value is identical to L'LORRI's measured V-mag, and we note that this should not affect the magnitude difference measured post-impact. Although the exposure times and cadence of the L'LORRI and ATLAS measurements were very different (0.9 s exposures for L'LORRI vs. 30 s exposures for ATLAS; samples taken every 1 s for L'LORRI vs. 41 s for ATLAS), both show similar rise times post-impact and plateau at approximately the same times. But the amplitude of the signal increase is significantly larger for the ATLAS points: the ATLAS plateau is 2.46 mag brighter (i.e., a brightness increase by a factor of 9.64) than the pre-impact value, while the L'LORRI plateau is only 1.69 mag brighter (i.e., a brightness increase by a factor of 4.74).

Figure 7. L'LORRI photometry is compared to the ATLAS photometry, zoomed in near the time of the DART impact event. Although the signal rise times are similar for the L'LORRI and ATLAS data, the amplitude of the increase is significantly larger for ATLAS. See the text for further discussion.
Download figure:
Standard image High-resolution imageGiven that the L'LORRI data were taken at a significantly smaller phase angle compared to that of Earth-based facilities (319 vs. 532), we first explored whether phase effects alone might explain the Lucy versus ATLAS discrepancy. The results discussed above are consistent with the following brightness relations:


where "B" refers to the brightness, subscript "L" refers to Lucy, subscript "G" refers to Ground (i.e., ATLAS), superscript "E" refers to the ejecta, superscript "D" refers to Didymos (the solid body), and superscript "T" refers to the total.
If we now define "ϕSB" as the solid-body phase factor ratio at 32° (Lucy) versus 53° (ground) and "ϕE" as the ejecta phase factor ratio at 32° versus 53°, we can write


And substituting the values from Equations (5) and (6) above, we can write

Thus, the solid-body phase factor ratio must be ∼2.39 times larger than the ejecta phase factor ratio to reconcile the post- to pre-impact Lucy versus ATLAS brightness ratios. But we already know ϕSB: using G = 0.2 (Pravec et al. 2012) gives ϕSB = 1.68, and we immediately see that ϕE must be less than 1 (ϕE = 1.68/2.39 = 0.70). That is, explaining the Lucy versus ATLAS pre- to post-impact brightness discrepancy purely as a phase-angle effect requires the ejecta phase function to be increasing between 32° and 53°.
A scattering function that rises with increasing phase angle generally implies the presence of small, forward-scattering dust particles (Lolachi et al. 2023). It is likely that the impact of the DART spacecraft into Dimorphos produced a population of small particles that were explosively ejected from the system at relatively high speeds. We note that if the initial brightness increase was only ∼2.0 mag, then a phase law similar to that measured for typical cometary dust particles (Schleicher & Bair 2011) could fully explain the smaller post- to pre-impact brightness ratio measured by L'LORRI.
2.5. Sodium Emission
Some remarkable, and apparently unique, ground-based spectroscopic observations of the DART impact event showed prominent optical emissions from the alkali metals sodium (Na), lithium (Li), and potassium (K) (Shestakova et al. 2023). These observations were conducted at roughly five air masses, which made absolute calibrations problematic, but the spatially resolved spectra clearly showed material flowing outward from Didymos with a projected speed of ∼1.5–1.7 km s−1 and with the signal dominated by atomic line emission, not continuum associated with dust scattering, for spectral extractions offset from the location of Didymos. These authors suggested that the observed atoms were being released from dust clouds that were ejected at high speed following the DART impact event. Others (Fitzsimmons et al. 2023) have suggested that these atomic emissions formed in a vapor cloud ejected during the DART impact event and that these alkali atoms compose the bulk of the fast-moving ejecta seen emanating from the Didymos system. Fitzsimmons et al. (2023) also proposed that the wavelengths of these atomic emissions relative to the camera bandwidths (BWs) might explain the presence or absence of the partial shell of fast ejecta in the camera images.
If the emission in the outflowing ejecta is dominated by the atomic lines, this can have a profound effect on the observed post- to pre-impact brightness ratio of the Didymos system, as demonstrated by the following simplified relations:


where SPost
T is the total post-impact signal from the Didymos system, SDidy is the signal from the pre-impact Didymos system, SE
T is the total ejecta signal,  is the pre-impact signal from the Didymos system, SE
Line is the ejecta signal from atomic lines, and SE
Cont is the continuum ejecta signal from dust particles. The second term of Equation (13) is the enhancement in the system signal level produced by the ejecta.
is the pre-impact signal from the Didymos system, SE
Line is the ejecta signal from atomic lines, and SE
Cont is the continuum ejecta signal from dust particles. The second term of Equation (13) is the enhancement in the system signal level produced by the ejecta.
Assuming that the system throughput (i.e., the system quantum efficiency, or QE) is approximately constant over the BW of the instrument, including the region containing sodium line emission (which dominates the atomic line emissions according to Shestakova et al. 2023), then we can write


where FDidy is the absolute flux from the pre-impact Didymos system, nNa is the number of sodium atoms in the FOV, and ndust is the number of dust particles in the FOV.
Thus, we see that the enhancement term in the ratio of post- to pre-impact brightness is inversely proportional to BW if atomic sodium emission dominates the ejecta signal. If continuum dust emission dominates the ejecta signal, then the ratio of post- to pre-impact brightness should be independent of the instrument BW, neglecting any potential phase-angle effects. Although we have made simplifying assumptions here, it seems clear that the ratio of post- to pre-impact brightness can be significantly reduced by "resolution dilution" of the sodium signal for wide-BW instruments, if sodium emission is a significant fraction of the ejecta optical signal.
BW for L'LORRI is ∼375 nm, and BW for ATLAS is ∼230 nm (both are wavelength ranges at ∼50% of their peak QE), which implies that the ejecta enhancement term should be ∼1.6 times larger for ATLAS, assuming that the ejecta emission is dominated by sodium emission and phase-angle effects are negligible. Given that the L'LORRI enhancement term is 3.74 (= 4.74 − 1), we would expect the ATLAS enhancement term to be 6.1 and the ratio of post- to pre-impact system brightness to be 7.1, again assuming that the ejecta emission is dominated by sodium emission and phase-angle effects are negligible. However, the measured ratio of post- to pre-impact system brightness for ATLAS is 9.64, which suggests that effects other than resolution dilution are also playing a role.
We have modeled how the signal measured by L'LORRI is affected by the presence of sodium atoms in the fast ejecta, assuming that the sodium emissions are optically thin. First, we calculated the resonant scattering efficiency, or g-factors, for the two sodium lines (D1 and D2) using atomic parameters from the NIST chemistry workbook 15 and a high-resolution solar spectrum compiled by the International Halley Watch.
As shown in Figure 8, the sodium g-factors are strongly dependent on the heliocentric radial velocity ( ) of the sodium atoms. Sodium g-factors for various velocities relevant for the DART impact event are provided in Table 2. Assuming that emissions from sodium atoms produce a substantial portion of the light observed from the fast ejecta (i.e., the ejecta released within the first few minutes after the DART impact), the partial-shell structure associated with the fast ejecta might naturally be a consequence of the vastly different g-factors for the sodium atoms released in different directions relative to the Sun, with stronger emissions seen in the sunward-facing hemisphere owing to the larger g-factors at larger values of
  . Note also that light scattering from free atoms is isotropic, which implies a flat phase function for the ejecta if sodium atoms dominate the optical emission from the fast ejecta (see Section 2.4).

Figure 8. The solar spectrum is plotted near the location of the sodium D lines: D2 has λ = 5889.95095 Å, and D1 has λ = 5895.92424 Å. The solar scattering efficiencies, or g-factors, of any sodium atoms in the DART ejecta depend strongly on the heliocentric radial velocities ( ) of those atoms. Sodium atoms ejected toward the Sun (i.e., with negative values of
  ) absorb sunlight at wavelengths longward of the corresponding solar lines, while atoms ejected away from the Sun (i.e., with positive values of
  ) absorb sunlight at wavelengths shortward of the corresponding solar lines.
  for Didymos itself is −4.487 km s−1, and this would be the effective
  for sodium atoms ejected perpendicular to the Sun−Didymos line. For sodium atoms ejected from Didymos toward the Sun at a speed of 1.8 km s−1, the effective
  is −6.287 km s−1; the dashed vertical lines show where the absorptions for the D lines would be for this case. Sodium atoms ejected from Didymos away from the Sun at a speed of −4.487 km s−1 have an effective
  of 0 km s−1.
Download figure:
Standard image High-resolution imageTable 2. Sodium G-factors

| gD2 | gD1 | gtotal |
|---|---|---|---|
| (km s−1) | (photons s−1) | (photons s−1) | (photons s−1) |
| −6.287 | 2.30 | 1.65 | 3.95 |
| −4.487 | 1.30 | 0.87 | 2.17 |
| 0.000 | 0.54 | 0.31 | 0.85 |
Note. The scattering efficiencies, or g-factors ("g"), of the two optical sodium resonance lines strongly depend on the heliocentric radial velocity ( ) of the sodium atoms in the ejecta cloud (see Figure 8). Sodium atoms ejected from the Didymos system during the DART impact event will have a range of
  values depending on the direction and speed of their ejection. See the text for further discussion.
Download table as: ASCIITypeset image
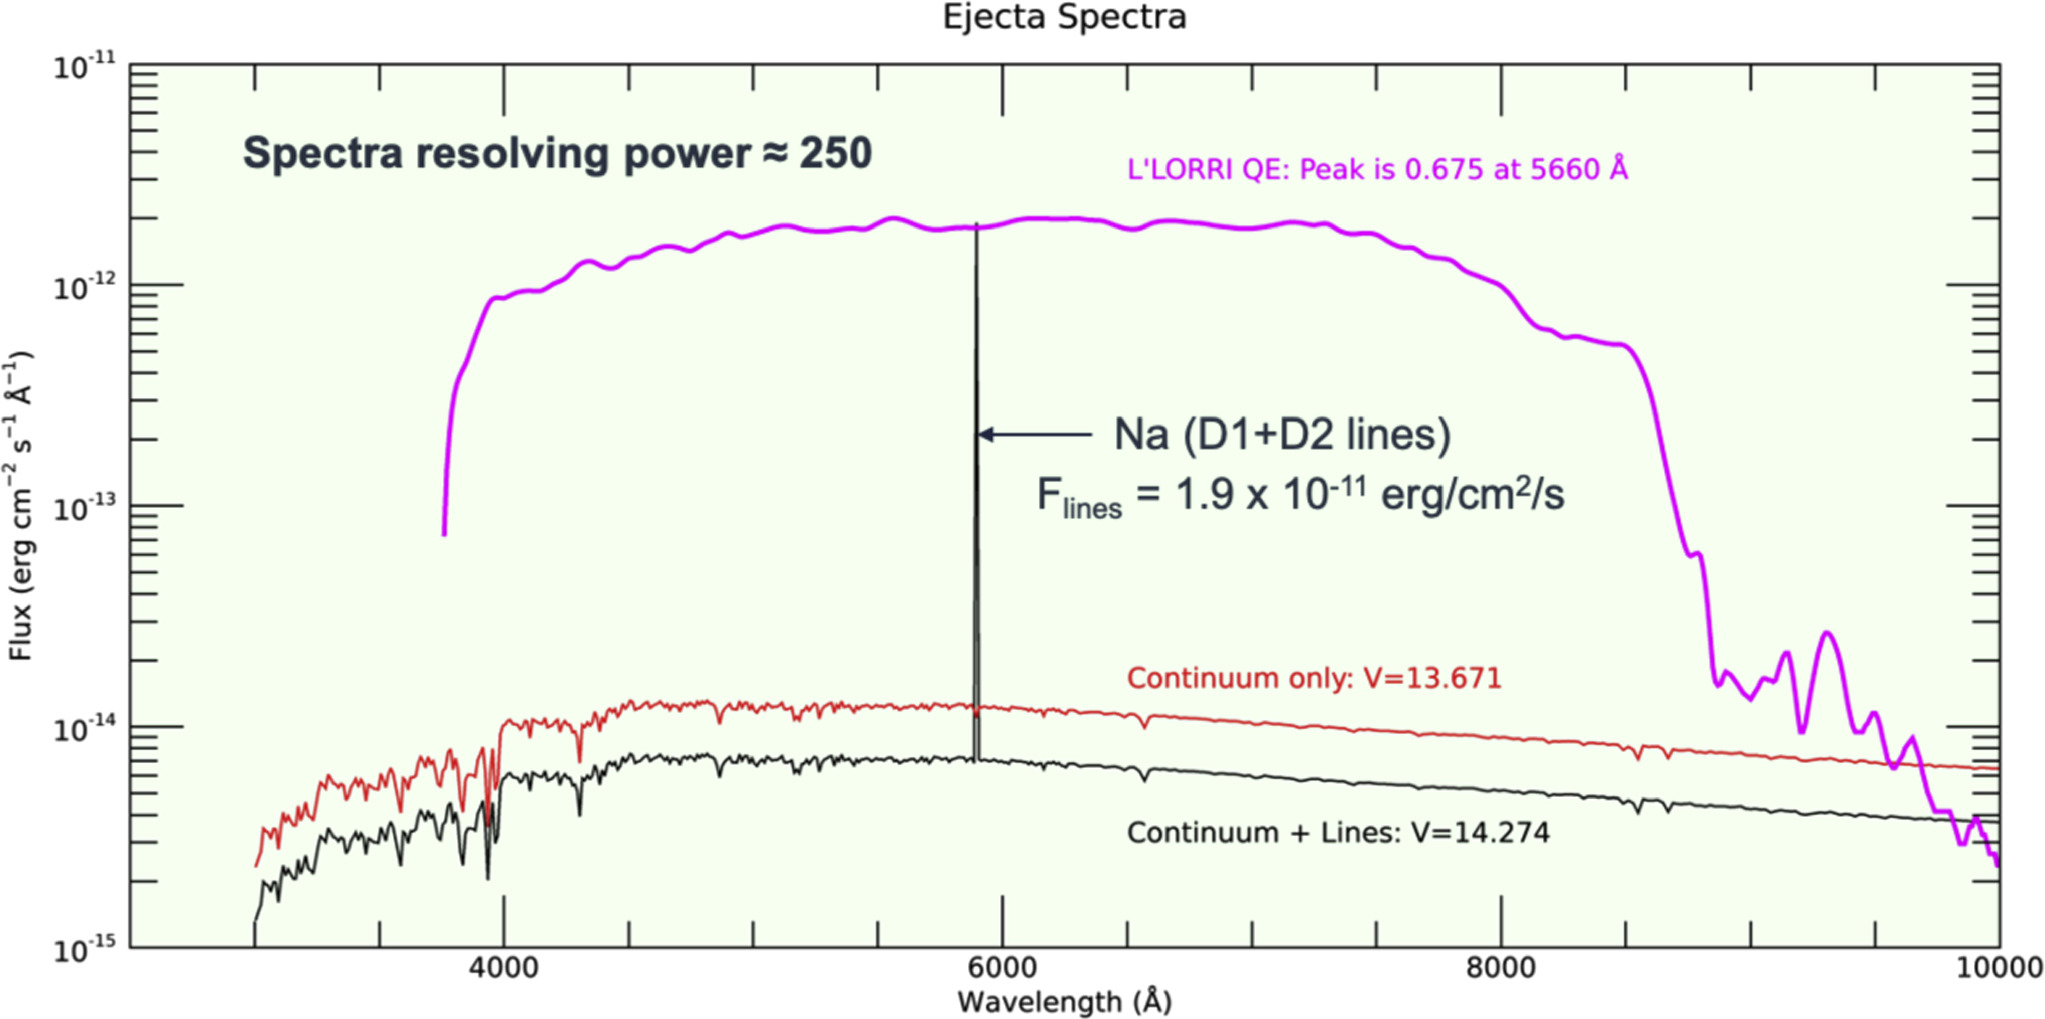
We considered two extreme cases for the SED of the ejecta emission during the first few minutes after the DART impact: one SED assumes that all the fast ejecta emission is due to resonant scattering of sunlight by sodium atoms while the emission from the slow ejecta is due to continuum scattering of sunlight by dust particles, and one SED assumes that there is no sodium and all the emission (from both fast and slow ejecta) is due to continuum scattering of sunlight by dust particles. We also assume that the dust continuum emission has the same SED as Didymos itself (i.e., a typical S-type asteroid SED). In both cases, the total ejecta emission equals the values measured by L'LORRI. The results are displayed in Figure 9.
Figure 9. Model spectra for the DART ejecta only (i.e., not including light from Didymos or Dimorphos), including both continuum and sodium line emissions. The black line is the spectrum (at a resolving power of ∼250) assuming that all of the emission associated with the fast ejecta is produced by the sodium D lines. In that case, the line-integrated emission totals to an observed flux of 1.9 × 10⁻¹¹ erg cm−2 s−1, and the V-mag would be 14.274. The red line is the spectrum (again at a resolving power of ∼250) assuming that there is no atomic line emission (i.e., all the emission is scattered sunlight from dust grains in the ejecta), in which case V = 13.671. The magenta curve shows the relative QE of L'LORRI, whose peak is 0.675 at a wavelength of 5660 Å.
Download figure:
Standard image High-resolution image
The flux from sodium atoms is given by

where "Fphoton" is the flux in photon units (photons cm−2 s−1 Å−1), "L" is the luminosity of the sodium cloud (isotropic scattering), "Δ" is the distance from the Lucy spacecraft to the target (cm), "g" is the sodium g-factor at r = 1 au, "r" is the target's heliocentric distance (au), and "nNa" is the total number of sodium atoms being observed.
Adopting a g-factor of 3.95, we calculate that the total flux from the sodium lines needed to account for all the fast ejecta emission is 1.9 × 10⁻¹¹ erg cm−2 s−1, which corresponds to a photon flux of 5.63 photons cm−2 s−1. Since the mass of a single sodium atom is 3.816 × 10⁻²³ g, the total mass of sodium in the cloud is ∼2.64 kg. The latter value is an upper limit in the sense that all of the fast ejecta optical emission is attributed to sodium, whereas some of that emission must be due to scattered sunlight from small dust particles. On the other hand, using a smaller sodium g-factor, which is appropriate for sodium atoms not moving directly toward the Sun, would result in more sodium atoms needed to produce the observed emission.
Assuming a composition for the ejecta that is similar to L or LL ordinary chondrites (which should be applicable to Didymos) and a relative sodium mass abundance of ∼0.7% (Jarosewich 1990, 2006), the total mass released in the fast ejecta could be as large as ∼2.64/0.007 = 380 kg, which is ∼66% of the DART spacecraft mass (579.4 kg; Cheng et al. 2023). However, sodium can be preferentially released during the heating of asteroidal material (Masiero et al. 2021), which means that the total mass in the fast ejecta might be smaller.
Using ground-based optical images, Graykowski et al. (2023) estimated the mass of dust in the fast ejecta: they derive 700 ± 120 kg if the average dust particle radius is ∼0.1 μm and 7000 ± 1200 kg if the average dust particle radius is ∼1 μm. The smaller value is comparable to the total fast ejecta mass derived above assuming chondritic abundance of sodium, but Graykowski et al. (2023) neglected emission from sodium and assumed that all the signal from the fast ejecta was due to scattered sunlight from small dust grains. We need to understand what fraction of the fast ejecta signal was due to sodium versus dust to determine more accurately the mass of the fast ejecta. We note that Graykowski et al. (2023) estimated a total mass of ∼107 kg for the slow ejecta, assuming that all the slow ejecta signal was due to scattered sunlight from millimeter-sized dust. Using Atacama Large Millimeter/submillimeter Array observations taken several hours after the DART impact, Roth et al. (2023) calculated that the submillimeter continuum flux from the slow ejected could be produced by millimeter-sized grains having a total mass in the range ∼(0.9–5.2) × 107 kg. Clearly, the slow-moving ejecta dominated the mass budget of the dust expelled from the DART impact event.
Jewitt et al. (2023) discovered multiple meter-sized boulders near Didymos during deep imaging with the Hubble Space Telescope on 2023 December 19, and they estimate a total mass of ∼5 × 10⁶ kg for those bodies. Thus, the mass ejected in large boulders during the DART impact event was comparable to the mass ejected in millimeter-sized particles.
3. Summary
We conducted an extensive imaging campaign of the DART impact event using the L'LORRI camera on NASA's Lucy spacecraft, starting 12 hr before impact and extending through 24 hr after impact. Photometry of the pre-impact L'LORRI images was consistent with both the absolute brightness and temporal variation predicted from pre-impact models of the Didymos system. We took a series of 0.9 s images at 1 Hz cadence starting 3 minutes before impact and extending through 4 minutes after impact to provide intensive monitoring during this critical period. L'LORRI images displayed a sharp rise in the brightness of the Didymos system immediately following the impact, but we did not detect the signature of a thermally generated optical flash, probably because the flash's duration was significantly shorter than the exposure duration. We found that a flash lasting 50 ms with an average brightness of V = 12.85, about 8 times brighter than the value for the pre-impact Didymos system, would be required to produce a detectable signal by L'LORRI. The increase in the DART ejecta brightness during the first 100 s after the impact was composed of two components: the "fast ejecta" had a range of outflow speeds (∼0.26–3.6 km s−1) and produced ∼43% of the post-impact brightness increase, while much slower moving ejecta (with speeds ≲1 m s−1) were responsible for the rest of the increase (∼57%). Emission from the fast ejecta was composed of both atomic line emission (mainly resonantly scattered sunlight from sodium atoms; Shestakova et al. 2023) and sunlight scattered by small dust grains ejected during the impact event, but the relative contributions of these two sources are uncertain. Although the fast and slow ejecta produced comparable changes in the brightness of the Didymos system following the impact of the DART spacecraft into Dimorphos, the mass of the fast ejecta must be orders of magnitude smaller than the mass contained in the slow ejecta.
The initial brightness increase relative to the pre-impact Didymos system brightness was significantly smaller for L'LORRI compared to that observed by the ground-based ATLAS facility. If most of the emission from the fast ejecta is due to atomic sodium, the brightness increase of the Didymos system depends roughly inversely on the spectral BW of the observing system, and that might be the main reason why L'LORRI recorded a smaller brightness increase. But at least part of the L'LORRI-ATLAS brightness increase discrepancy can plausibly be explained by a phase-angle effect, if sunlight scattered by the fast ejecta has an essentially constant phase law (or even slightly increasing) between phase angles of 32° and 53°.
Acknowledgments
We thank the engineers and managers on the Lucy mission whose tireless efforts enabled the successful execution of the Lucy-DART observing program. Financial support for his work was provided by the DART mission, NASA contract No. 80MSFC20D0004.
Facility: Lucy - .
Software: Interactive Data Language (IDL), licensed by the Harris Corporation.