


Abstract
Stereophotoclinometry (SPC) was the prime method of shape modeling for NASA's OSIRIS-REx mission to asteroid Bennu. Here we describe the extensive testing conducted before launch to certify SPC as NASA Class B flight software, which not only validated SPC for operational use but also quantified the accuracy of this technique. We used a computer-generated digital terrain model (DTM) of a synthetic asteroid as the truth input to render simulated truth images per the planned OSIRIS-REx observing campaign. The truth images were then used as input to SPC to create testing DTMs. Imaging sets, observational parameters, and processing techniques were varied to evaluate their effects on SPC's performance and their relative importance for the quality of the resulting DTMs. We show that the errors in accuracy for SPC models are of the order of the source images' smallest pixel sizes and that a DTM can be created at any scale, provided there is sufficient imagery at that scale. Uncertainty in the spacecraft's flight path has minimal impact on the accuracy of SPC models. Subtraction between two DTMs (truth and simulated) is an effective approach for measuring error but has limitations. Comparing the simulated truth images with images rendered from the SPC-derived DTMs provides an excellent metric for DTM quality at smaller scales and can also be applied in flight by using real images of the target. SPC has limitations near steep slopes (e.g., the sides of boulders), leading to height errors of more than 30%. This assessment of the accuracy and sensitivity of SPC provides confidence in this technique and lessons that can be applied to future missions.
Export citation and abstract BibTeX RIS

Original content from this work may be used under the terms of the Creative Commons Attribution 4.0 licence. Any further distribution of this work must maintain attribution to the author(s) and the title of the work, journal citation and DOI.
1. Introduction
Stereophotoclinometry (SPC), a fusion of the stereophotogrammetry and photoclinometry techniques, is used to create digital terrain models (DTMs) from images (Gaskell et al. 2008, 2023; Palmer et al. 2022). SPC leverages the strengths of each technique to mitigate the weaknesses of the other: stereo provides a fixed position in 3D space, while photoclinometry gives a pixel-to-pixel slope determination that leads to a high-resolution surface shape. Additionally, the SPC process uses a system of three equations for every pixel, allowing the determination of the two orthogonal slope components and the albedo (i.e., how much light will be reflected by each spot on the surface). Because the DTM contains both albedo and topography, SPC can use that information to render synthetic images, allowing a direct comparison of the DTM to the input images.
SPC has been used extensively on numerous flight missions to determine the topography of asteroids, comets, planets, and satellites (see Palmer et al. 2022 for a list). We used it to develop DTMs of the 500 m diameter rubble-pile asteroid (101955) Bennu during the Origins, Spectral Interpretation, Resource Identification, and Security–Regolith Explorer (OSIRIS-REx) sample return mission (Barnouin et al. 2020; Lauretta et al. 2021). These DTMs served multiple purposes, both scientific (e.g., Barnouin et al. 2019) and operational (e.g., Jackman 2017; Mario et al. 2022; Norman et al. 2022; Olds et al. 2022). The OSIRIS-REx mission also produced lidar-based DTMs of Bennu (e.g., Daly et al. 2017, 2020; Jackman et al. 2017; Seabrook et al. 2019, 2022 Barnouin et al. 2020). Lidar-based shape modeling was not baselined for operational purposes because performance could not be guaranteed before launch, though it was eventually used in aspects of operations.
Although SPC-derived products had been used to support optical navigation around asteroids and comets (e.g., Barnouin-Jha et al. 2008; Gaskell et al. 2008; Mastrodemos et al. 2015), little formal testing had been performed on the SPC code or the products it generates. OSIRIS-REx was the first mission to formally use SPC as part of the operational navigational software, necessitating extensive prelaunch and in-flight evaluation (Craft et al. 2020; Al Asad et al. 2021; Mario et al. 2022; Weirich 2022; Adam et al. 2023; Palmer et al. 2024a). The key functionality to demonstrate before launch was that SPC could support proximity operations around Bennu and meet the OSIRIS-REx mission requirements. It was also necessary to characterize the amount of margin in the accuracy, precision, and residual error of planned SPC products by identifying a baseline (i.e., the accuracy of an SPC model given a nominal suite of parameters) and then evaluating the impact of varied conditions.
Here, we describe prelaunch theoretical analyses to determine the sensitivity of SPC performance to input variables and processing techniques, as well as empirical analyses of simulations with respect to mission requirements. Versions 2.1A7 and 3.0A0 of the SPC code were used for these tests. The original scope of the tests was to demonstrate the production of a global DTM to a ground sample distance (GSD) of 35 cm. During testing, the requirements were tightened to include higher-resolution topography at a GSD of 0.5 cm in support of natural feature tracking (NFT; Olds 2014; Lorenz et al. 2017; Olds et al. 2022), an autonomous navigation technique for guiding the spacecraft to Bennu's surface for sample collection. This testing was part of a broader evaluation of the altimetric products that would be generated by the OSIRIS-REx mission, as summarized in Barnouin et al. (2020).
This study provides a systematic assessment of SPC and detailed quality metrics, confirmed by reference to a "truth" DTM of a synthetic Bennu-like asteroid. The truth DTM and planned mission profile were used to render test data, and success was assessed as the degree to which SPC could reproduce the truth DTM. This evaluation provides significant new insights into SPC's sensitivity and performance that should be useful to future missions. This paper focuses on a direct measurement of the error between a truth DTM and the SPC-generated DTM. A companion paper (Palmer et al. 2024a) focuses on how the input data, mostly observational geometry, impact the quality of the DTM.
The major prelaunch tests to support OSIRIS-REx flight operations were denoted F1–F6 (Table 1). This work focuses on F1–F3, which were required to certify SPC as NASA Class B software. The F1 test suite provided the baseline performance of SPC. It assumed that imagery was obtained following the nominal mission profile (Lauretta et al. 2017) but did not include errors associated with image collection. The F2 test suite was used to identify improvements in the accuracy of the DTM if more images, or images with better geometries or resolution, were collected. The F3 test suite studied the impact of off-nominal observations such as reduced quality of data, number of images, and location of the terrain on the target body. F4 and F6 simulated the generation of global DTMs from local-scale maplets with GSDs of 75 cm (the preliminary mission requirement) and 35 cm (the final mission requirement), respectively, as described in Weirich (2022). F5 and two additional tests specific to evaluating SPC for navigation are described in Adam et al. (2023) and Mario et al. (2022).
Table 1. Descriptions of the Major Tests of SPC for Use on the OSIRIS-REx Mission
| Test ID | Test Name | Test Description | Truth DTM | Reference |
|---|---|---|---|---|
| Unit | Unit Testing | Unit-level testing to verify software requirements | Shape 2 | N/A |
| F1 | Idealized Mission a | Simulated mission without navigation knowledge error | Shape 3 | This work |
| F2 | Maximizing Performance a | Data and processes to maximize performance | Shape 3 | This work; Palmer et al. (2024a) |
| F3 | Sensitivity Analysis a | Impact of less-than-optimal data | Shape 3 | This work; Palmer et al. (2024a) |
| F4 | 75 cm DTM | Simulated Approach and Preliminary Survey | Shape 4 | Weirich (2022) |
| F5 | Navigation (75 cm DTM) | Simulated Orbit A | Shape 4 | Adam et al. (2023) |
| F6 | 35 cm DTM | Simulated Detailed Survey and Orbit B in the blind | Shape 4 | Weirich (2022) |
| NTE3 | Integration with Nav | Identification of pole axis and size errors | Shape 4 | Adam et al. (2023) |
| NFT Thread Test | NFT features | Generation of navigation features for NFT | Shape 4 | Mario et al. (2022) |
Note.
a Only F1, F2, and F3 were required for Class B certification. Other tests provided performance assessments for the OSIRIS-REx mission.Download table as: ASCIITypeset image
2. Methods
The tests used a set of truth DTMs of a computer-generated synthetic asteroid as a reference. Simulated images of these models were rendered under various observation conditions using planned mission trajectories. The resulting image suites were the primary inputs to create DTMs, which were then quantitatively compared with the truth DTM.
2.1. Simulated Data Used for Testing
The starting point for all tests was creating a large set of simulated data. This was a substantial, iterative task, as the test data underwent improvements to capture lessons learned and investigate specific aspects of the effectiveness of SPC. By the end of the effort, the simulated data were mature, realistic, and stable, which allowed for a systematic and practical test of the mission's operational profile (Weirich 2022). All the tests started with a truth DTM and a truth flight trajectory that provided the position and pointing from which the synthetic images were rendered. A second test data set was created comprising synthetic images and a degraded flight trajectory that included errors in the spacecraft position and pointing knowledge. Using these two sets of data inputs, a testing DTM could be constructed and evaluated.
2.1.1. Truth DTMs
For these tests, truth DTMs provided an absolute reference for simulation and comparison. Three truth models that differed in resolution and complexity were created as the evaluation techniques improved, allowing higher-fidelity assessments.
For the global DTM tests, the models were based upon the radar-based DTM of Bennu shown in Figure 1 (Nolan et al. 2013a, 2013b). The radar model had a 1σ uncertainty of 20 m for small-scale topographic features (M. Nolan 2014, personal communication). A utility called CreatorP, created to support the SPC software, was used to change the surface's height, roughness, topographic features, and albedo from those of the radar DTM. This tool underwent several revisions throughout the testing process as different surface characteristics were desired.
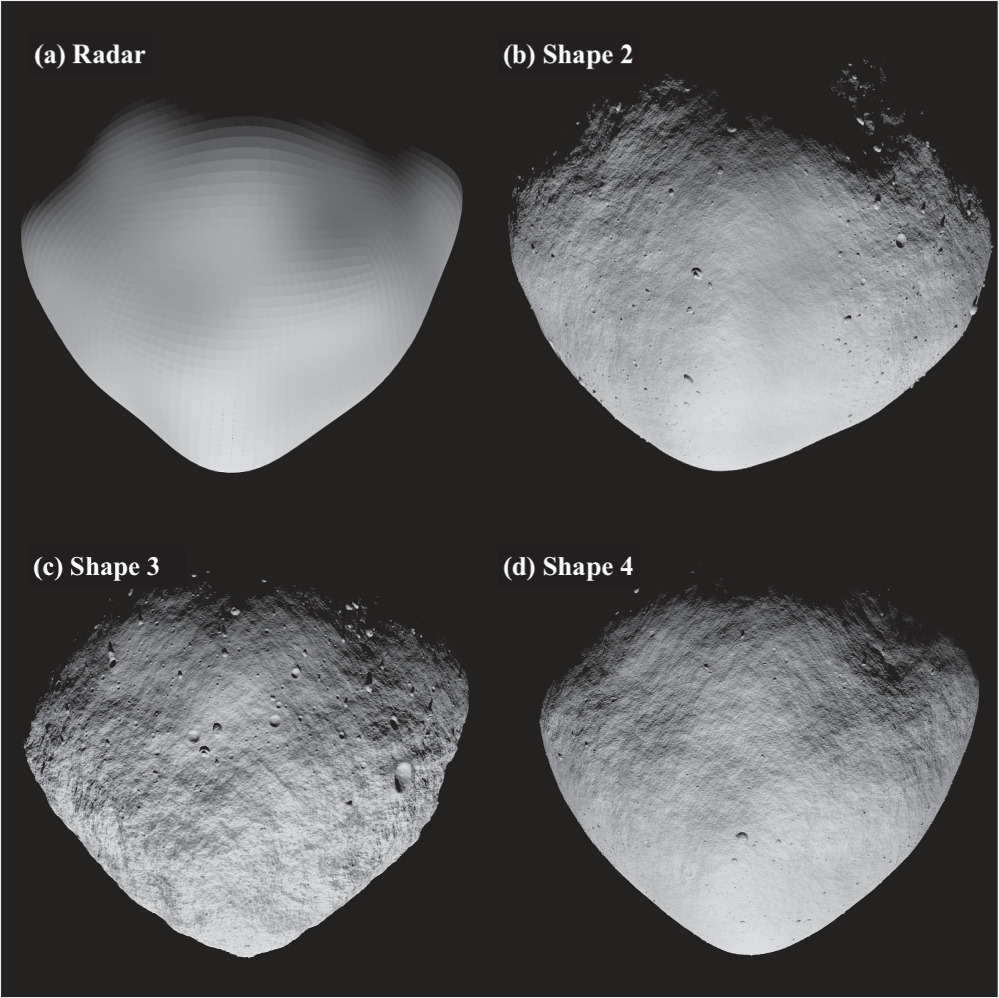
Figure 1. (a) The radar shape, the starting DTM for all of the synthetic asteroids. (b) Shape 2 was the first truth model used in testing. It lacked albedo variation, so it was of limited benefit during testing. (c) The shape 3 truth model was used for most of the testing. This model comprised the source data for almost all of the baseline and sensitivity tests. The entire surface was rough with large boulders and provided no location that met the prelaunch expectations for a suitable sample collection site. These roughness attributes were modeled according to observations of the asteroids Itokawa and Eros (see Barnouin et al. 2020, for details). (c) The shape 4 truth model was used for two tests that fully simulated the DTM generation that would be conducted once at Bennu (Weirich 2022).
Download figure:
Standard image High-resolution imageShape 1 was an early truth model used for visualizations only. Shape 2 (Figure 1) was the first truth DTM used in these tests. To create shape 2, the radar DTM was deformed, and craters and boulders were added. The resulting DTM had a GSD of 75 cm and did not include albedo information. This DTM lacked the required resolution to generate images for the last part of the Approach mission phase and none of the Preliminary Survey mission phase (Lauretta et al. 2021). It was used for software unit-level testing and as a stepping stone for more expansive testing. This early testing provided lessons on generating synthetic DTMs and the requirements for their testing and evaluation.
Using the experience from shape 2, shape 3 was created with albedo features and rough terrain (Figure 1). The GSD of shape 3 was 5 cm globally, with three regions with finer-resolution synthetic terrain as locations for simulating the OSIRIS-REx Touch-And-Go (TAG) sample collection maneuver (Lauretta et al. 2017, 2022). The GSD in these regions was increased to 1 cm for a 100 × 100 m area at each of the three simulated TAG sites. TAG site 1 had a 25 × 25 m region with a 0.25 cm GSD.
Shape 3 was used extensively for much of the initial testing but had limitations that led us to generate a further improved model for additional testing beyond that required for software certification. First and most importantly, the topography at all scales was too rough to meet the requirements we were testing. There was no location (including the three simulated TAG sites) where the OSIRIS-REx spacecraft could safely perform TAG as defined by the mission requirements (at the time, with a 25 m safety radius). Second, shape 3 was created with versions at multiple resolutions; however, the data generation process was imperfect, such that there were minor differences in features between them. Thus, it was impossible to use data generated at multiple model resolutions in a single coherent test.
The final synthetic asteroid created to support testing for the OSIRIS-REx mission was shape 4 (Figure 1). This model was not used for the tests in this paper but was used in the follow-on tests described in Weirich (2022).
2.2. Truth Image Creation
The truth images were created using the flight profile defined in the OSIRIS-REx Design Reference Mission (DRM) Revision C (Lauretta et al. 2017). The DRM defined several phases of mission operations; the Approach, Preliminary Survey, Detailed Survey (Baseball Diamond flybys), and Orbit B phases, in order of increasing detail and finer image resolution, were used in the testing.
The truth DTMs and computed trajectories based on the mission design were used as input for rendering the images (Table 2). For some tests, we altered the navigational error, types of images, number of images, latitude, photometric function, and other parameters. The key sensitivity tests of the F1–F3 testing suites are detailed in Table 3.
Table 2. Images Used for the Nominal Flight Tests, F1
| Phase | Number of Images | Sub-spacecraft Location | Resolution |
|---|---|---|---|
| Approach | 242 | Equatorial | 52 cm |
| Preliminary Survey | 2108 | Poles and equator | 15 cm |
| Detailed Survey | 1357 | Limited midlatitude, nadir | 5 cm |
| Orbit B a | 277 | Terminator obit | 1 cm |
Note.
a Few results were garnered from the Orbit B data set because the extreme observing conditions made them of minimal use.Download table as: ASCIITypeset image
Table 3. Sensitivity Tests
| Test Name | Mission Profile | Scope | Identifier |
|---|---|---|---|
| No Error | DRM | Mission simulation | F1 |
| Nominal Error | Expanded DRM | Mission simulation | F3A |
| Knowledge error and nav uncertainty | Expanded DRM | Focused study | F3G |
| Amount of Processing | DRM | Focused study | F2: Test 3 |
| Photometric Function | Expanded DRM | Focused study | F3F |
| Shape to Height Parameters | DRM | Focused study | F2: Test 6 |
| Dependence on Latitude | DRM | Focused study | F3H |
Note. "Mission simulations" test whether the images and procedures can meet mission requirements. "Focused studies" are more expansive tests to characterize the impact of a specific variable. The DRM was a complete prelaunch mission scenario with a well-defined baseline suite of imagery data. "Expanded DRM" used the existing DRM but doubled the number of images to improve the stereo viewing geometries as depicted in Figure 2.
Download table as: ASCIITypeset image
The Flight Dynamics group at NASA Goddard Space Flight Center (GSFC) used the software Freespace to render the images from the DTMs using the original McEwen photometric function (McEwen 1991). These images were generated using the GEOMOD geometry modeling tool and the Phillum physically based stochastic ray tracer, both developed at GSFC. Because the point spread for the OSIRIS-REx camera was less than 1, no point-spread function was added to the images. Additionally, no electronic noise or cosmic rays were added. This is a reasonable assumption because during actual flight operations, cosmic rays in images used in generation of the DTM were virtually absent. As such, this approach produced photorealistic synthetic images for which we knew the exact spacecraft pose, again based on the mission design.
2.3. Testing Methodology
As described in Palmer et al. (2022), SPC generates DTMs in a progressive manner, starting with low-resolution images and decreasing the DTM's GSD as the quality of the model and resolution of the images improve during mission progression. We created a starting DTM by using simulated images of the mission phases Approach and Preliminary Survey. The processing was stopped early, resulting in a modest but stable DTM with a GSD of 75 cm over the entire surface. This early model was used as the starting data for most of our tests.
We added the Detailed Survey images with a pixel size of approximately 5 cm. Then, we created a DTM with a 35 cm GSD and used the images to calculate the x-slopes, y-slopes, and albedo at every pixel. We did this over a 50 m square area in a simulated TAG site. We performed 5–50 iterations of the Align, Extract, and Solve (AES) procedure (Palmer et al. 2022), in which image data is extracted and converted into topography. Further high-quality maplets (small 99 × 99 pixel DTMs) were created as needed depending on the testing goals and results.
Because the Preliminary and Detailed Survey mission phase images had significantly higher resolution than the model GSD (15 and 5 cm, respectively), there was sufficient data that allowed the tests to improve the model.
2.4. Evaluation Techniques for SPC Products
Two types of evaluation of the SPC-derived models were undertaken: internal consistency checks and comparisons with truth models. We performed these evaluations at the global level and regionally. When we were testing the performance at the TAG site, which was 50 × 50 m, we evaluated the center 20 × 20 m as a representation of the entire region in order to expedite testing.
Internal consistency is a measure of how consistent the DTM is with the data used to create it—specifically, how closely every control point on the model and every image agree with one another. In SPC, control points are the centers of the maplets used to construct a DTM. Each control point can be described in two different ways: observed and calculated.
The observed position of a control point is defined as a pixel/line in an image. Every image will have the pixel/line position of each assigned maplet. This pixel/line position is assigned manually or automatically using normalized cross-correlation routines, and it is solely based on the image data and pattern matching.
The position of a control point is calculated by projecting its 3D position onto each image. Within SPC, each maplet has a single point that defines its center position in body-fixed space. Using the position and pointing of the spacecraft's camera, one can calculate at which pixel/line position the control point would intersect the image.
The internal residual error can be calculated as the delta between a maplet's calculated pixel/line position and its observed pixel/line for every image.
Using these residual values, as well as the agreement of maplets with one another, SPC provides statistics defining how well the DTM agrees with each piece of the assimilated source data. Our key metric is called the formal uncertainty, which is the rms elevation difference of the error between the calculated and observed position of all maplets, limb points, and neighboring maplets for every image, as described in Gaskell et al. (2023). The formal uncertainty used for this evaluation is calculated slightly differently than the metric "FormU" developed by Weirich (2022), which uses only the position of all maplets and limb points for every image.
Comparison with other DTMs is the evaluation type used most heavily in this study, but it is not used exclusively. There are three methods of comparison: rms, profiles, and normalized cross-correlation (which does not involve comparison with other DTMs).
One of the most frequently used comparative evaluation techniques for measuring the quality of DTMs is rms. This technique evaluates the difference between the two models. The distance for every vertex is measured between one DTM and the closest surface of another DTM. For our testing, we evaluated each vertex of the SPC-generated DTM and identified the smallest distance to any portion of any of the triangular plates on the synthetic truth DTM. In this study, rms comparisons follow a two-step process. First, a model DTM is translated and rotated to minimize the rms differences between it and the truth DTM. The DTM registration was done using the iterative closest-point method (Besl & McKay 1992), which involves finding the best rigid transformation (translation and rotation) that minimizes the mean-square distance between the data sets. Second, the sum of the squares of all of the differences is rooted to make the rms, which indicates the mean displacement between the two models. This metric is convenient because it provides a distance in physical units and is a standard statistical technique. By measuring the distance from a vertex to the nearest point on the triangular plate, the rms technique avoids issues with GSD size and sampling locations.
The second comparative evaluation technique compares vertical profiles between the truth DTM and the SPC-generated DTM. The height of the surface is plotted between two points that are equivalent on both DTMs. The truth DTM will have more detail in the profile, whereas the generated DTM will typically have a smoother profile. Additional tests were conducted focusing on the impact of the images and their observation geometries; these are described in a companion paper (Palmer et al. 2024a).
The third comparative evaluation technique is the normalized cross-correlation of the real and simulated images (Lewis 1995). While a visual comparison between truth and rendered images provides a strong indication of quality, normalized cross-correlation provides an objective standard of evaluation. This technique computes the correlation between truth images and images rendered from the DTM being tested. Normalized cross-correlation is used heavily in optical navigation for various missions (Mastrodemos et al. 2015; Olds et al. 2022; Adam et al. 2023). One of its most significant benefits is that actual images of the asteroid's surface acquired in flight are used as truth during operations. The more accurate the DTM, the higher the cross-correlation score will be, indicating a higher fidelity in the surface representation. As the normalized cross-correlation score approaches 1.0, the closer the model is to the truth, whereas a score of 0 indicates no correlation at all.
In contrast to the alignment step of the SPC algorithm, where a segment of an image is correlated with a single maplet, DTM evaluation is performed by cross-correlating an entire image frame with its equivalent computed from the multimaplet DTM. Correlation scores will thus be influenced partly by errors in the maplet positions but dominantly by the realism with which photoclinometry is able to reproduce small features within the maplets. The correlation scores are not sensitive to errors in the vertical scale of the maplets that may arise from the choice of photometric function, because such errors cancel out between the photoclinometry and image-rendering steps.
While using a single image for analysis is useful, this technique is most powerful for identifying high-quality DTMs when there is a wide variation in illumination geometries, as described in Palmer et al. (2024a). Multiple illumination geometries allow vertical or albedo errors to be more clearly identified as a lower correlation score.
3. Tests and Results
We present the tests and their outcomes organized by the conditions and parameters assessed (Table 3), rather than chronologically.
3.1. Evaluating Error Due to Uncertainties in Spacecraft Knowledge
During an observation campaign, discrepancies between the estimated navigation solution and actual spacecraft positions will influence DTM generation. The first three tests in Table 3 assessed the impact of these errors.
To best describe the different concepts and parameters used in the tests, a few definitions are necessary.
- Planned flight path. What the mission requested the spacecraft to fly. The imaging plan is based on this planned flight path.
- Actual flight path. What the spacecraft actually flew, which can never be fully known. Due to real-world unknowns (e.g., the exact amount of fuel that was used during an orbital maneuver), there will be an offset between the planned flight path and the actual flight path.
- Flight error. The difference between the planned flight path and the actual flight path. This does not impact DTM generation and is ignored in this discussion.
- Reconstructed flight path. The navigation team's postflight estimate of the flight path is based on images, Doppler, and telemetry.
- Knowledge error. The difference between the navigation team's reconstructed flight path and the actual flight path. This error cannot be known precisely because the actual fight path is unknown, but the navigation team can give statistical estimates.
- Navigation uncertainty. The statistical estimate of the knowledge error based on the quality of the data inputs when building the reconstructed flight path. SPC uses this estimate to provide a weighting value for the reconstructed flight path.
The actual flight path, the flight error, and the knowledge error cannot be known during a real mission. However, with a synthetic data set, these parameters are explicitly created, so they are known. This makes it possible to test the quality of DTM generation based on parameters that are important but unavailable during flight.
The following tests place boundaries on how knowledge errors and navigational uncertainties influence an SPC-derived product. We evaluated the quality of DTMs by exploring cases spanning extremes in spacecraft position knowledge—from no error to a large (1 km) error—when approaching and orbiting a small body like Bennu.
3.1.1. No Error in Spacecraft Knowledge (Test F1)
This first test assumed a perfect correspondence between the planned, actual, and reconstructed flight paths. These no-error conditions provided a performance baseline to which other tests could be compared. This test also provided the best performance metric to assess how much better SPC performed over mission requirements.
One of the authors (R.W.G.) performed this test blind, using only the simulated imagery with no access to the truth DTM during the test. Another author (E.E.P.) separately performed this test, not in the blind, and analyzed both models during the testing. In this way, we could assess performance in actual operations under the test assumptions and explore methods of improving future performance. The test lasted for 6 weeks.
The F1 test used images generated from the shape 3 truth model and the planned position of the spacecraft throughout proximity operations. The first test the DTM generated was a 75 cm GSD model based on the simulated data from the Approach and Preliminary Survey mission phases (Figure 2). The performance of the DTM met the accuracy required by the mission (Table 4) and indicated that the imaging plan for the Approach and Preliminary Survey mission phases was sufficient. The model had an absolute accuracy (rms) of 56.5 cm, which met the requirement by a large margin.
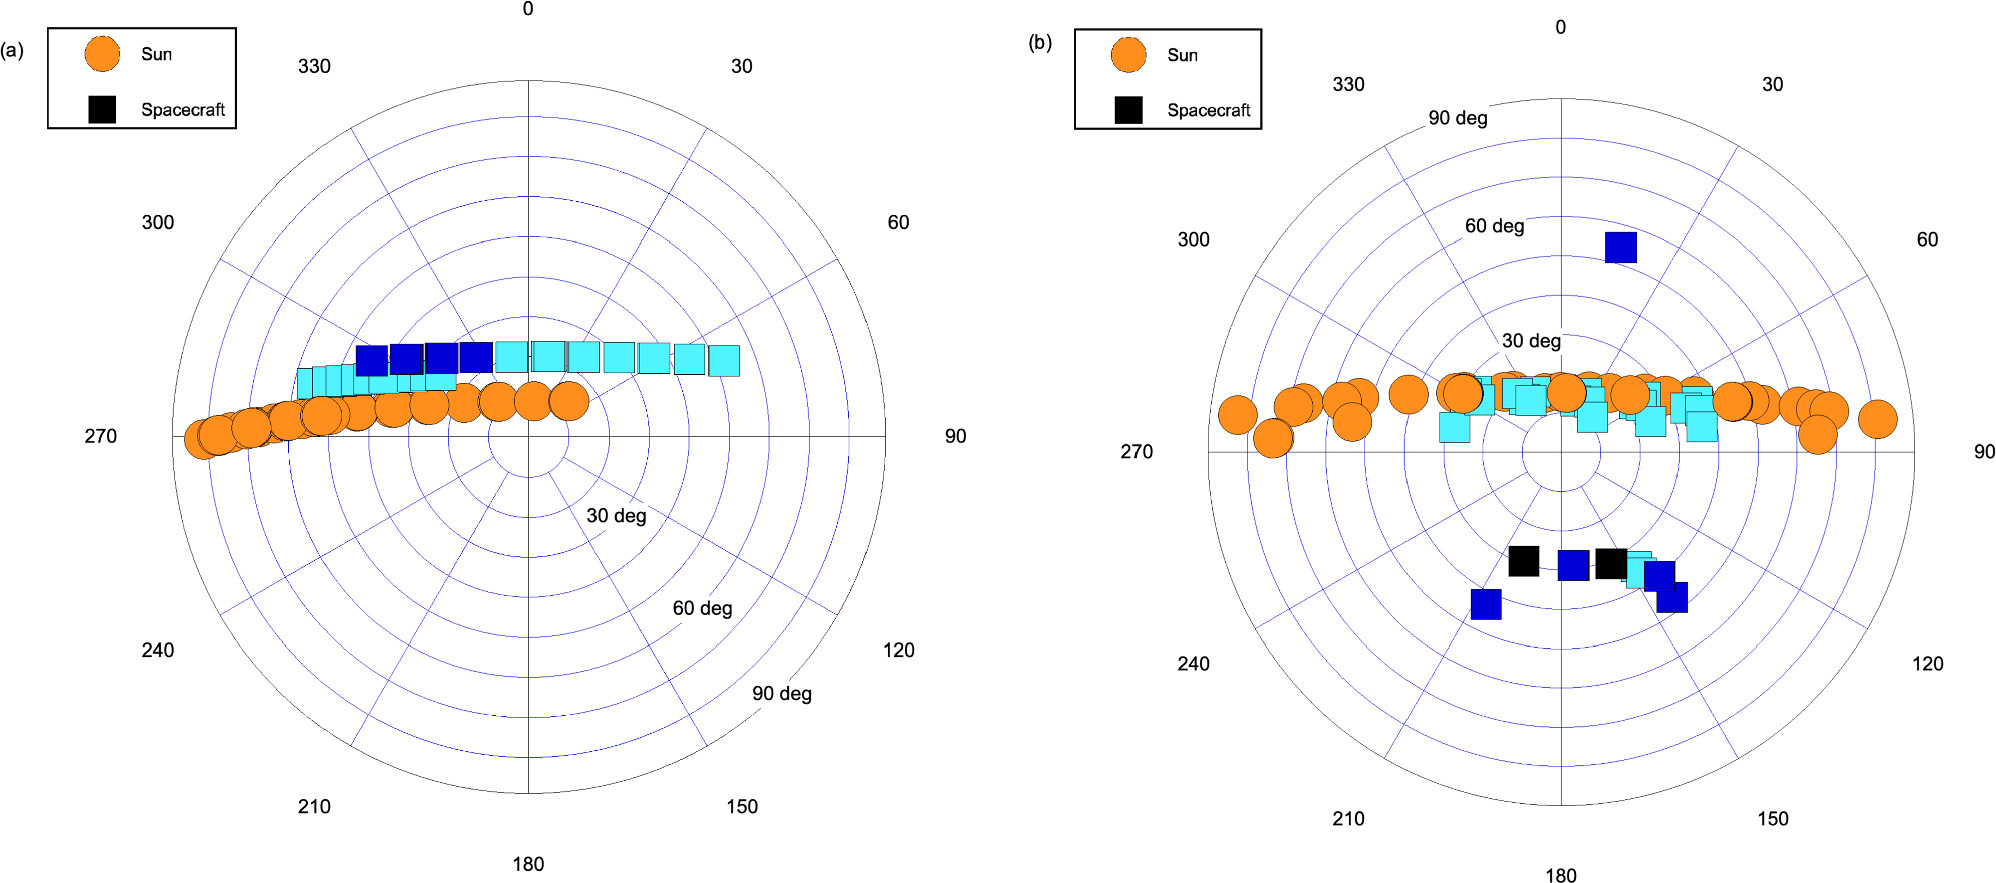
Figure 2. This shows the observational geometries for the (a) original DRM and (b) expanded DRM. These only show the Preliminary Survey and Detailed Survey images. The image pixel size is as follows: cyan is 30–60 cm, blue is 10–15 cm, and black is 4–5 cm. The polar plot is an effective way to describe the viewing geometries by displaying both the azimuth angle and zenith angle. The polar plot shows the position of the spacecraft (squares) and the position of the Sun (circle). Both plots are viewed from the surface looking up. The radial grid lines indicate azimuth, where north is 0° and east is 90°. The concentric grid lines indicate the zenith angle, with 0° being straight up. This example is based upon the testing TAG site, which was at −8° latitude.
Download figure:
Standard image High-resolution imageTable 4. Mission Requirements and Results for the No-error Test
| Model | DTM GSD (cm) | Required Accuracy (cm) | Test Accuracy (cm) | Formal Uncertainty a (cm) |
|---|---|---|---|---|
| Preliminary Survey | 75 b | 100 | 56.5 | 49 |
| Detailed Survey | 35 b | 75 | 49.2 | 45 |
| TAG operations | 5 b | 14 | 4.5 | 5 |
Notes.
a FormU was approximated by the average residual error of all data calculated by SPC's internal consistency tool RESIDUALS. b These requirements were defined in the OSIRIS-REx Mission Requirement Document that provided the details of each mission requirement and the justification.Download table as: ASCIITypeset image
The second DTM generated in this test was a 35 cm GSD DTM based on data collected through the simulated Detailed Survey mission phase. This DTM also met the accuracy requirements (75 cm in this case), which was needed to support navigation (Table 4). However, the test demonstrated that the existing plan for the Detailed Survey had a minimal number of images and observing stations. Although the Baseball Diamond flybys of the Detailed Survey produced images with a pixel scale of 5 cm, the DTM's accuracy was around 49 cm. Previous work with SPC suggested that accuracy should be near the pixel size of the imagery. The 49 cm accuracy first indicated that the image data set was inadequate. An evaluation of the image coverage indicated that the model was predominantly a result of Preliminary Survey images rather than Detailed Survey images. More imaging at the Detailed Survey distance was required. The two observing stations used in the DRM for the Detailed Survey provided only two unique observing geometries for the equator and only one observing geometry for the higher latitudes. Further, even the two equatorial images were too limited in stereo angle to constrain the shape as effectively as desired.
Due to the inadequate performance of the existing observing plan, it was necessary to define a better imaging data set, which drove much of the testing and analysis reported in Palmer et al. (2024a). This effort elucidated the requirements for an effective imaging data set for SPC, eventually leading to additional imaging requirements and an updated mission plan (Lauretta et al. 2017).
The third and final DTM generated for this test was a region of 50 × 50 m around a simulated TAG site. The SPC-generated DTM indicated that the imaging plan for Orbit B was insufficient. Observing the TAG site from the near-terminator orbit resulted in a phase angle that was almost always greater than 90°, which meant that either the incidence or emission angle (or both) had to be significantly compromised with respect to the ideal. These compromises in image geometries produced only a marginal-quality DTM at a 5 cm GSD.
The test met the operational mission requirements regarding accuracy (Table 4). However, because accuracy cannot be measured in flight, FormU and other residual error measurements were computed and compared with accuracy to evaluate their utility as proxies for it that can be used in flight. One pretest expectation was for FormU to be half of the desired accuracy; however, with this data set, that was not accomplished. Further work has indicated that FormU can be an acceptable proxy for accuracy, but only to about a factor of 2 (Weirich 2022), consistent with these results. Additionally, experience suggests that the ruggedness of the terrain may have an impact on FormU, but this hypothesis has not been systematically tested.
3.1.2. Nominal Flight Error in Spacecraft Knowledge (F3A)
The no-error F1 test described above validated that the SPC software could, given sufficient imaging, generate a sufficiently high-quality model. The nominal-error (F3A) test was conducted to ensure that the mission plan, software, and procedures were robust enough to accommodate realistic navigational knowledge errors.
When the navigation team generates a reconstructed navigation solution using images, the quality and consistency of the data provide an estimation of the uncertainty in their solution. This defines how much weight or trust can be placed on the reconstructed navigation solution. One benefit of SPC is that it will not only use the uncertainty provided by the navigation team but also perform its own refinements of the position and pointing of the spacecraft for each image.
Prior to launch, the estimated 1σ navigational uncertainty estimates in position were 400 m during the Approach mission phase, 100 m during the Preliminary Survey, and 6.4 m during the Detailed Survey mission phase. Pointing error was estimated to be 1 mrad. For the F3A test, imagery was generated using the planned flight trajectory. Then this 1σ level error was added to build a reconstructed trajectory, which is what the test used as the starting position of the spacecraft for observation. The error in position was added as the same vector for each image, while each image's pointing error was a random displacement. This ensured that the data set used in this test provided a realistic representation of the expected performance in flight.
In the nominal-error test, maplets were created at several GSDs as the data were processed: 20, 10, 5, and 2 cm. The 2 cm GSD maplets were ultimately resampled to 5 cm GSD. For this test, the additional processing did not improve the rms-measured accuracy, but using the 2 cm DTM resampled to 5 cm provided additional small-scale detail. The images rendered from these data looked more like the source images, improving the precision of the matching step and thus overall cross-correlation performance.
This test showed that with the level of error expected during operations, SPC could meet the mission requirements of accuracy (Table 5). The performance was of the same order of magnitude as the no-error test. Based on the success of this test, additional testing was done to characterize the impact of these key parameters over a wider range of values.
Table 5. Results for the Nominal-error Test
| Model | DTM GSD (cm) | Required Accuracy (cm) | Test Accuracy (cm) |
|---|---|---|---|
| Preliminary Survey | 75 | 100 | 106 |
| Detailed Survey | 35 | 75 | 46 |
Note. Formal uncertainty was not measured for this test.
Download table as: ASCIITypeset image
3.1.3. Knowledge Error and Navigation Uncertainty (F3G)
Based on the above results, an additional test was created to understand how specific processing constraints influenced the quality of DTMs produced. The two variables tested were knowledge error and navigation uncertainty. Before launch, the navigation team estimated that the difference between the actual flight path and their reconstructed flight path (knowledge error) would be 6.4 m (1σ = 6.4 m) during the Detailed Survey Baseball Diamond flybys. To test the knowledge error, we evaluated the DTM and correction to the spacecraft position based upon errors of 0.25σ, 0.5σ, 0.75σ, 1σ, 1.5σ, 2σ, and 3σ (i.e., from 1.6 to 19.2 m). The error was added proportionally to all components of the spacecraft position vector.
SPC uses as much data as possible to update the spacecraft's estimated position and weights different data based on their quality. One parameter SPC uses to this end is navigation uncertainty, which can be thought of as how much confidence the navigation team has in its solution. We ran the suite of tests twice: once with a navigation uncertainty of 6.4 m and a second time with a navigation uncertainty of 1 km.
We used three tools to identify the impact of the knowledge error and navigation uncertainty on the generated DTMs and spacecraft pose. First, the rms deviation between the truth terrain and the model DTM was calculated. Second, we used normalized cross-correlation to identify how well the images rendered from the SPC-generated model terrain matched the truth images (Lewis 1995; Mario et al. 2022). Finally, we measured how well SPC corrected the spacecraft's position (Table 6).
Table 6. Results of Navigation Study Comparing Two Levels of Navigation Uncertainty
| Knowledge Error | Nav. Uncertainty | rms (cm) | Correlation | Mean Camera Displacement a (m) |
|---|---|---|---|---|
| 0.25σ | 6.4 m | 8.41 | 0.7619 | 2.0 |
| 0.5σ | 6.4 m | 8.34 | 0.7625 | 1.8 |
| 0.75σ | 6.4 m | 8.50 | 0.7617 | 1.8 |
| 1σ | 6.4 m | 8.24 | 0.7641 | 1.7 |
| 1.5σ | 6.4 m | 8.58 | 0.7684 | 1.6 |
| 2σ | 6.4 m | 8.41 | 0.7537 | 1.6 |
| 3σ | 6.4 m | 7.93 | 0.7679 | 2.0 |
| 0.25σ | 1 km | 8.01 | 0.7628 | 4.7 |
| 0.5σ | 1 km | 7.93 | 0.7633 | 5.1 |
| 0.75σ | 1 km | 7.96 | 0.7637 | 5.4 |
| 1σ | 1 km | 7.67 | 0.7672 | 4.7 |
| 1.5σ | 1 km | 8.00 | 0.7606 | 5.6 |
| 2σ | 1 km | 7.86 | 0.7510 | 5.3 |
| 3σ | 1 km | 7.67 | 0.7683 | 5.0 |
Note.
a When the spacecraft position is corrected, there is likely to be some error between the truth position (where the images were taken) and where SPC estimates the position to be, which is the camera displacement.Download table as: ASCIITypeset image
Knowledge error—Varying the knowledge error between 0.25σ and 3σ while keeping the navigation uncertainty set (first at 6.4 m, then at 1 km) had only a small impact on any of the evaluated parameters (Table 6). Both the generated DTM and the spacecraft pose update were similar for all levels of knowledge errors, indicating that SPC is not highly sensitive to errors between the actual flight path and the reconstructed flight path, at least in this scenario.
With respect to the quality of the DTM, the rms errors were minor and consistent without regard to what knowledge error was used. The average rms was only 8.35 cm, with a standard deviation of only 0.2 cm. These errors are minimal compared to most tests and real-world examples. Further, the cross-correlation scores demonstrated that all cases could render comparable images. The average score for generating images that contained high-fidelity features was 0.763, with a standard deviation of 0.005.
Navigation uncertainty—We noted small rms differences in topography between the two levels of uncertainty. The 6.4 m uncertainty led to an average rms error of 8.35 cm, while the 1 km uncertainty value generated an rms of 7.87 cm. Although the latter allowed a more correct fit, the difference was less than half a centimeter, which is indicative of noise or testing artifacts rather than a fundamental change caused by uncertainty. The image cross-correlation showed similar stability in the solution. The average correlation score was 0.763 for the 6.4 m uncertainty and 0.762 for the 1 km uncertainty—almost indistinguishable.
The correction to the spacecraft's position was more impacted by different amounts of navigation uncertainty. The tests with 6.4 m uncertainty had all the images corrected to within 2 m of their actual position, whereas the tests with 1 km uncertainty had a scattering of corrections up to 5.6 m—i.e., some images were better corrected than others. What is interesting is that for each subtest, the displacement was controlled by the uncertainty, not the different amounts of knowledge error used.
3.2. Impact of Software Parameters
Here we evaluate whether different processing of the same data impacts the accuracy of a DTM. SPC has a variety of options that can be turned on or off to improve processing. Some sets of data have difficult or unique situations where the default parameters are not as effective as alternate ones. Thus, we evaluate some of the significant options to identify which ones work best for the expected mission profile.
3.2.1. Limited Evaluation of Photometric Function Selection (F3F)
This test was conducted to evaluate the impact of photometric functions on the DTM. Over the years, various photometric functions have been tried, with the best-performing model being the modified lunar photometric model that combines Lambertian scattering with a Lommel–Seeliger model for SPC. There are two specifications of this model, McEwen (1991) and McEwen (1996), with the former specification having a factor of 2 in one of its terms, which is the favored formula (Equations (1) and (2)). The McEwen (1996) function has been used the most during applications of SPC prior to 2016. However, for the mission, the McEwen (1991) model that included the factor of 2 was used, so it was necessary to systematically evaluate the performance of each function. uo is the cosine of the incidence angle, u is the cosine of the emission angle, and α is the phase angle:


Two 5 cm GSD DTMs were produced using shape 3 using McEwen (1991) and (1996). The imaging conditions followed the OSIRIS-REx prelaunch plan of two stations for each hemisphere with an approximately 45° emission angle.
In each case, a high-quality DTM was produced, and two metrics were used to measure their quality. The first measured the rms of the deviation between the truth DTM and the SPC-generated testing DTM. The unfavored version, which did not have the factor of 2, had an rms of 5.45 cm, while the favored version resulted in an rms of 5.72 cm. While there is a variation of 0.27 cm, this is well below the scale of the imagery (the image pixel size is a factor of 20 larger), and the deviation should be considered noise.
The other metric used normalized cross-correlation to assess how well the model matched nine images that covered a wide range of emission, incidence, and azimuth angles. The unfavored version had a score of 0.7872, and the favored version had a score of 0.7884, both showing strong agreement with the images. These results imply that the scalar factor correction does not represent a significant improvement in the DTM in the SPC context. So, although the two photometric functions generated a similar result, the key takeaway is the speed at which each formula converged. The favored version converged faster than the version missing the scalar factor of 2.
An obvious issue with this test is that the photometric function used by Freespace to generate the truth images was that of McEwen (1991). As such, the images were rendered with the same function that SPC removed. We believe that this does not invalidate any of the results of the SPC testing because these results match previous experience in generating DTMs on other objects. More specifically, as part of the overall testing to support NFT (Olds 2014; Olds et al. 2022), a simulated physical asteroid surface (3 × 3 m) was constructed, imaged under specific observational parameters, and measured using lidar (Craft et al. 2020). An SPC model of the surface generated using the images was compared to the lidar-derived surface. The results showed that even for a surface without regolith, imaged through an atmosphere, with an unknown photometric function, SPC's standard photometric function (McEwen 1991) performed exceptionally well in a real-world test.
3.2.2. Slope-to-height Parameters (F2-Test 6)
SPC has many runtime parameters and procedures that can be used to improve the DTM, some of which are summarized in Gaskell et al. (2008) and Palmer et al. (2022). These parameters allow tailoring to deal with difficult terrain, lack of data, an accounting of spacecraft error, and other factors. This test was conducted to identify which of these parameters significantly influences rms error.
As previously indicated, SPC's topography generation is an iterative process whereby information from multiple images is used to solve both albedo and height. During the steps of AES (Palmer et al. 2022), conditioning parameters can be adjusted to account for problems in the data in order to reduce error and bias. The typical procedures for the slope-to-height iteration are as follows.
- Fill with shape. If there are no image data, then use an existing low-resolution DTM to assign the height.
- Overlaps. Condition the heights of the current maplet with data from overlapping nearby maplets.
- Differential stereo. Use stereo calculations to derive additional height values for a fraction of the pixels (1%) for this maplet.
- Shadows. Exclude pixels with neighboring pixels with shadows to ensure partially shadowed pixels are not included in the solution. Shadows are denoted using a data number threshold.
To test the impact of these conditioning procedures, a DTM was built for a small region at 35 cm, and the rms results for the standard procedures listed above were compared with the DTM when different parameters were turned off. The imagery for this test contained only the imagery that was part of the prelaunch plan for the mission, which, in this case, consisted of three observing stations at 15 cm pixel size (Preliminary Survey) and two stations at 5 cm pixel size (Detailed Survey). This imagery set is much smaller than the optimum set developed later; see Palmer et al. (2024a).
The baseline suite of processing using the standard procedures generated topography with an rms of 6.6 cm. This set of procedures includes using existing data, stereo points, and neighboring maplets; employing the global DTM when there are no data; and excluding pixels that are partially shadowed.
When the terrain was generated with no options within the slope-to-height turned on, the model did not converge, creating terrain that did not match the images.
Adding stereo points did allow the model to converge, but it had an rms error of 10 cm, about twice that of the test when we used standard procedures. By itself, adding stereo points provided significant stability to the model, but adding other conditioning procedures continued to improve the solution.
One of the key conditioning procedures is including data from neighboring maplets. Using this option when the AES cycle is run, data from these overlapping maplets share information when determining the height, which results in both maplets converging on a solution. For this test, when neighboring maplets were included, the rms error was 7.4 cm, which is a mere 10% higher than the baseline solution. This option provides convergence stability for the model.
Other processing steps that have been used did not show much impact. These were updating the position and pointing of the images, updating the 3D position of each maplet after every AES process, and partially shadowed pixels. These automated routines are typically used a few times during processing, but the test showed that they did not make an important contribution to the quality of the model after the first few iterations.
3.3. Dependence on Latitude
Another seminal test evaluated the quality of the terrain as a function of latitude (or maximum subsolar point). For this test, images were generated so that the terrain was illuminated as if it were at different latitudes, every 10° from 0° down to −70°. To do this, we adjusted the position of the DTM so it was at its respective latitude and set its normal vector to match the truth DTM at that latitude. This test used images derived from shape 3 of simulated TAG site 1, whose original latitude was at −8°. These images were based upon the prelaunch imaging plan for the Detailed Survey Baseball Diamond flybys with four stations, two over each hemisphere.
Eight different scenarios were tested where the Sun vector was varied, and all images were regenerated based on that vector. The same number of images and the same relative spacecraft observing conditions were used for each test; only the effective latitude was changed, so that for effective latitudes closer to the poles, the images had longer shadows, and the terrain was more prominent than the albedo (Figure 3). The input imagery came from the expanded DRM, as depicted in Figure 2.

Figure 3. Two synthetic images rendered from shape 3 of the testing site. The left image depicts a typical image that would be taken from the original Baseball Diamond portion of the Detailed Survey mission phase. The latitude of the terrain is 0°. The right image is in the same location but illuminated as if it were at −70° latitude. One can see that the shadows are much longer, with many south-facing slopes no longer illuminated. The white box denotes the evaluation region that is depicted in Figure 4.
Download figure:
Standard image High-resolution imageThe resulting DTM quality was evaluated using both rms and cross-correlation. The rms between DTMs generated at these different illuminated latitudes were similar, averaging 6.2 cm, and demonstrated no trends with latitude (Table 7). Taken at face value, this result indicates that the latitude of the topography has little impact on the rms of the DTM. The variations in the rms are on the order of 1 cm, while the source imagery pixel scale is 5 cm, so those variations are not significant (i.e., in the noise). This finding would lead one to consider solar geometries of minor importance as long as reasonable stereo angles have been met.
Table 7. Performance Results of the Impact of Latitude on the rms Accuracy and Rendering Fidelity (Cross-correlation) for the Latitude Tests
| Lat. | Minimized rms (cm) | Cross-correlation Score |
|---|---|---|
| 0° | 6.7 | 0.80 |
| −8° a | 7.0 | 0.79 |
| −20° | 6.6 | 0.79 |
| −30° | 6.3 | 0.80 |
| −40° | 5.8 | 0.79 |
| −50° | 5.2 | 0.76 |
| −60° | 5.4 | 0.71 |
| −70° | 6.7 | 0.61 |
| Avg. | 6.2 | 0.76 |
Note.
a Latitude was varied by increments of 10°, but because the simulated TAG site was centered at −8°, that was used in lieu of shifting it by 2°.Download table as: ASCIITypeset image
But a visual inspection of the DTMs shows that the terrain was less well represented at higher effective latitudes (Figure 4). The south-facing portions of sloping terrain lacked details, crater bottoms were shallower and without features, large areas were without features (smooth), and the vertical relief of many structures was lower. This is a direct consequence of the increase in the number and extent of shadows at higher latitudes that reduced the amount of information available for terrain building.
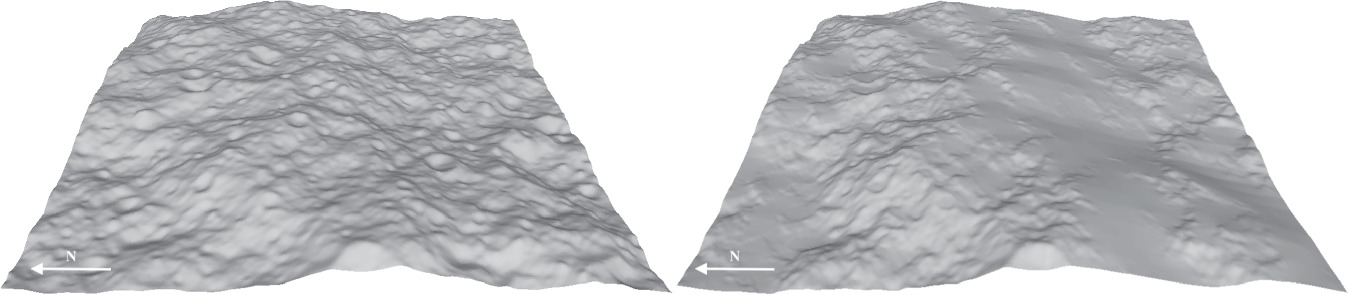
Figure 4. Results of the tests for 0° (left) and −70° (right) latitude. One can see in the −70° latitude image that the terrain is much smoother than in the 0° latitude image. These renderings use only topography and lack albedo. The point of view was rotated to make clear the loss of details in the DTM.
Download figure:
Standard image High-resolution imageAs part of this test, we used visual inspections of the DTMs that were generated at each latitude. As the latitudes increased, the quality visibly decreased. Using the normalized cross-correlation technique, one can see that as the latitude increases, the correlation between images and the terrain decreases (Table 7). The cross-correlation score for the equator to midlatitudes was high at 0.80 but decreased to 0.76 at −50° and became poor at −70° latitude, consistent with the aforementioned visual inspection. These results support a correlation score of 0.6 as a useful criterion to define a good versus poor rendering.
While rms is an effective tool for describing the agreement between two DTMs, as shown by this test, it struggles when the surface roughness is low compared to the pixel size. For products created by SPC, rms is capable of providing accurate results, typically down to the level of the image's pixel size, in this case approximately 5 cm. This is because a maplet's height error is a function of stereo's ability to identify the correct location in 3D space, which reflects how well images can be coregistered. Coregistering of images can typically be done to a pixel level, or a subpixel level if the terrain is smooth. The pixel size of the image becomes a limit of accuracy for rms; i.e., for SPC products, the rms will seldom be better than the image pixel size.
In this test, the surface roughness of the truth DTM was relatively smooth. The pixel size of the imagery was 5 cm, and the surface roughness was measured at length scales between 15 and 300 cm and was consistently 0.6 cm. As such, much of the topographic variation was smaller than the regional error. Small-scale features are lost to rms because those variations are dwarfed by the stereo error.
In the high-latitude tests, a significant amount of terrain is in shadow, providing no topographic information, and thus is assumed to be flat. In this scenario, the lack of terrain expression in the images does not have an impact on rms, making rms a less effective tool.
We find, therefore, that although rms can be useful in many instances, it should not always be applied alone. The use of additional assessments like visual inspection and the correlation score provide a measure of how closely an SPC DTM (which has both terrain and albedo) matches the original images.
4. Discussion
4.1. Average Error
One of the most important findings from these tests was establishing the typical accuracy (i.e., average error) of SPC. We determined that the average error of an SPC model is close in magnitude to the smallest pixel size of the source images for a reasonable data set. The suite of tests allowed numerous comparisons between truth DTMs and SPC-generated testing DTMs constructed with drastically different source images (Table 8). The table describes which mission phase it simulated and thus the GSD of the DTM, how extensive the coverage of the images was, and a subjective estimation of how robust the observation stations were. It also then denotes the accuracy (rms) of the global DTM and compares it to the pixel size (resolution) of the source imagery. If the ratio is above 1, then the DTM's accuracy was worse than the source imagery, whereas a ratio of 1 or lower supports the conclusion that, with a reasonable image set, the accuracy is close to the pixel size.
Table 8. Quality Results from the Suite of Testing Based upon Shape 3 and Shape 4 DTMs and Various Flight-like Imaging Profiles
| Test | Product GSD | Image Pixel Size (cm) | Quality a | Coverage | Nav. Error | rms (cm) | Ratio b |
|---|---|---|---|---|---|---|---|
| F1—Preliminary Survey | 75 cm | 55 and 15 c | Good | Moderate | None | 56 | 1.0 |
| F3—Preliminary Survey | 75 cm | 55 and 15 c | Good | Moderate | 1σ | 106 | 1.9 |
| F1—Detailed Survey | 5 cm | 5 | Poor | Incomplete | None | 18 | 3.6 |
| F1—Orbit B | 1 cm | 0.8 | Poor | Incomplete | None | 5.4 | 6.7 |
| F2—Orbit B Optimal d | 1 cm | 0.8 | Marginal | Excellent d | None | 1.5 | 1.9 |
| F2—Test11 | 5 cm | 2 | Excellent | Excellent | None | 0.5 | 0.25 |
| F4—Preliminary Survey | 75 cm | 55 and 15 | Good | Moderate | 1σ | 12.7 | 0.85 |
| F6—Detailed Survey | 35 cm | 5 | Good | Moderate | 1σ | 10.2 | 2 |
Notes.
a Quality in this context is a heuristic estimate of the diversity of unique observation stations. "Good" quality means at least three of the desired observing stations had an image pixel size that was similar to the GSD of the desired DTM. More discussion of the quality of observation stations can be found at Palmer et al. (2024a). "Coverage" is also a heuristic as to how much of the asteroid's surface was imaged with the needed number of viewing geometries. b Ratio of rms to image pixel size. c The observing campaign had some images with a 15 cm pixel scale, but the coverage was limited and did not impact the quality of the DTM sufficiently to be counted. d The F2 Orbit B Optimal test expanded the imaging during Orbit B to include almost all possible viewing geometries. However, this amount of imaging would have been a major burden to collect.Download table as: ASCIITypeset image
During the first several tests conducted to validate the SPC software, we discovered that the mission's imaging plan would not provide a sufficient variety of observation geometries. This resulted in the testing DTMs having a lower fidelity relative to the image pixel size than would be expected based on previous missions, such as Dawn's encounter with Vesta (Gaskell 2012) and Rosetta's encounter with 67P Churyumov–Gerasimenko (Jorda et al. 2016). Palmer et al. (2024a) provides more details about which observing stations resulted in the highest DTM accuracy. As the tests progressed, better constraints were developed for the observing conditions, which allowed testing with better data sets. In turn, this allowed measurement of the quality of SPC under both ideal and nonideal conditions.
Beyond the sensitivity testing, mission simulation testing determined the performance of SPC as it relates to imaging conditions (Table 8). If there is limited imagery for a region of terrain, then the rms is 3–6 times the source images' pixel size.
If there is a large suite of observing conditions (a condition typically met for most small-body missions that orbit the object), the rms error is 1–2 times the source images' pixel size. This was indicated during the testing; if there were sufficient images available (three perfect observing conditions or five to six more moderate observing conditions), then the SPC DTM would have an average rms on the order of the size of the image pixels for that terrain (Table 8). This quality is sufficient for many scientific tasks within planetary science and is on par with the results of stereophotogrammetry.
While most planetary science missions have no ability to determine ground truth, this testing with truth models showed that SPC's performance is very good, and the testing results can be extrapolated to provide the expected DTM performance on a mission.
4.2. Cross-correlation versus rms
While rms is a common technique for evaluating DTMs, our results show that it only provides part of the story. For most surfaces on a global scale, rms is an effective measurement of the quality of a DTM, but it is limited when it comes to high-resolution DTMs. As seen in the latitude dependence test (Section 3.3), the actual quality of an SPC model is not always reflected in a simple subtraction between the testing DTM and truth DTM even after using rms to translate and rotate the model to minimize the difference between the testing and model DTM. When the sampling of the model approaches the pixel size of the source images, the rms following this minimization approach does not show the improvement that should occur in any of the following scenarios: adding more images, adding higher-quality images, or performing more processing (Palmer et al. 2024a).
Indeed, we demonstrate that cross-correlation between truth images and rendered DTM images provides a clear and consistent evaluation of the quality of the model. Because it is not possible to have a truth model for an actual flight mission, images of the actual surface can be considered ground truth. Using cross-correlation between images and rendered DTM images allows a direct comparison during a mission. Additionally, although factors such as uncorrected lens distortion will impact the model, cross-correlation using multiple images will uncover these errors as a disagreement between the DTM and the images. This dramatically improves our ability to identify uncorrected issues in the source data and is discussed at length in the companion paper (Palmer et al. 2024a).
Our work suggests that most sets of images can be processed to reach a score above 0.6, but that a score of 0.7 is a much better goal. A score of 0.7 reflects a reasonably accurate model that can render images that are clearly representative of the source images. A score of 0.8 indicates an exceptional model representing the features very accurately. Scores above 0.9 are rare.
Finally, optical navigation uses cross-correlation to detect navigational features. Optical navigation requires a DTM to be generated beforehand so they can be matched in navigational imagery. This matching technique is completely dependent on cross-correlation. Therefore, while rms provides an exact measurement of accuracy, correlation scores provide an essential evaluation of the quality of the DTM, particularly in regard to optical navigation.
4.3. Boulders
Though this testing demonstrates what SPC can do well, it also has made clear one of SPC's largest limitations, namely, that it struggles with very steep slopes, such as the sides of boulders. Steep-sided boulders are frequently underrepresented by about half to one-third of their correct height. This is due to the inability to fully orthorectify every image, specifically removing the topography, without a correct DTM. As such, features on the boulder's slopes are not projected into the same x/y position of every orthorectified image.
This error can be seen using vertical profiles (Figure 5). Using a truth model, actual height deviation can be measured in profile view. The profile shows that the boulder only reaches a portion of its correct height in the SPC-generated DTM, but the surrounding terrain is well represented. If the slope is lower, then the boulder can be fully represented. Underrepresentation of boulder heights occurs when the boulder is steep. For imagery with a 5 cm pixel scale, one would typically build 5 cm GSD topography, and boulders smaller than the entire width of the maplet, 4.95 m, would not be well represented. Larger boulders will be better represented because there are more maplets contributing to their shape; thus, more stereo control points are calculated in 3D space rather than just the slope from photoclinometry.

Figure 5. Vertical profiles of the truth (green) and SPC-generated (purple) DTMs. In the SPC model, the height of the boulder is only about half of the truth height. The example DTM has a GSD of 5 cm pixel–1.
Download figure:
Standard image High-resolution imageAlthough a variety of techniques have been attempted to fix this error, none of them can remove it, because none of them are able to get a draft DTM that allows the images to be fully orthorectified. Typically, the height of the SPC-generated boulder is about 50% of the truth's height using the vertical profile technique. However, focused effort can bring the height discrepancy down to only 30%. This is done by placing one or more maplets specifically on the top of the boulder. This allows for the 3D position of the boulder's peak to be generated by an independent stereo solution. The maplet data for the top of the boulder are resampled along with the rest of the maplets, yielding a combined solution. More testing is needed to identify the critical slope at which SPC struggles, but that is beyond the scope of our work.
For flight missions, problems with an SPC-generated DTM can be detected in four ways. First, for large features, boulders can be visible on the limb of the asteroid (Figure 6). These composite views (red is the source image, and cyan is rendered from the SPC model) are frequently useful as a tool for quickly assessing the fidelity of the model when working on a global model, which by necessity requires a low-resolution image to capture the limb of the target. The second approach is to evaluate how well the DTM can render images of the surface that match the source images; this is the method quantified by cross-correlation. The third way is to measure shadows; underrepresented boulder heights will create shadows shorter than they should be. The final way is to compare the SPC-generated DTM with DTMs created using other data or techniques, such as lidar.
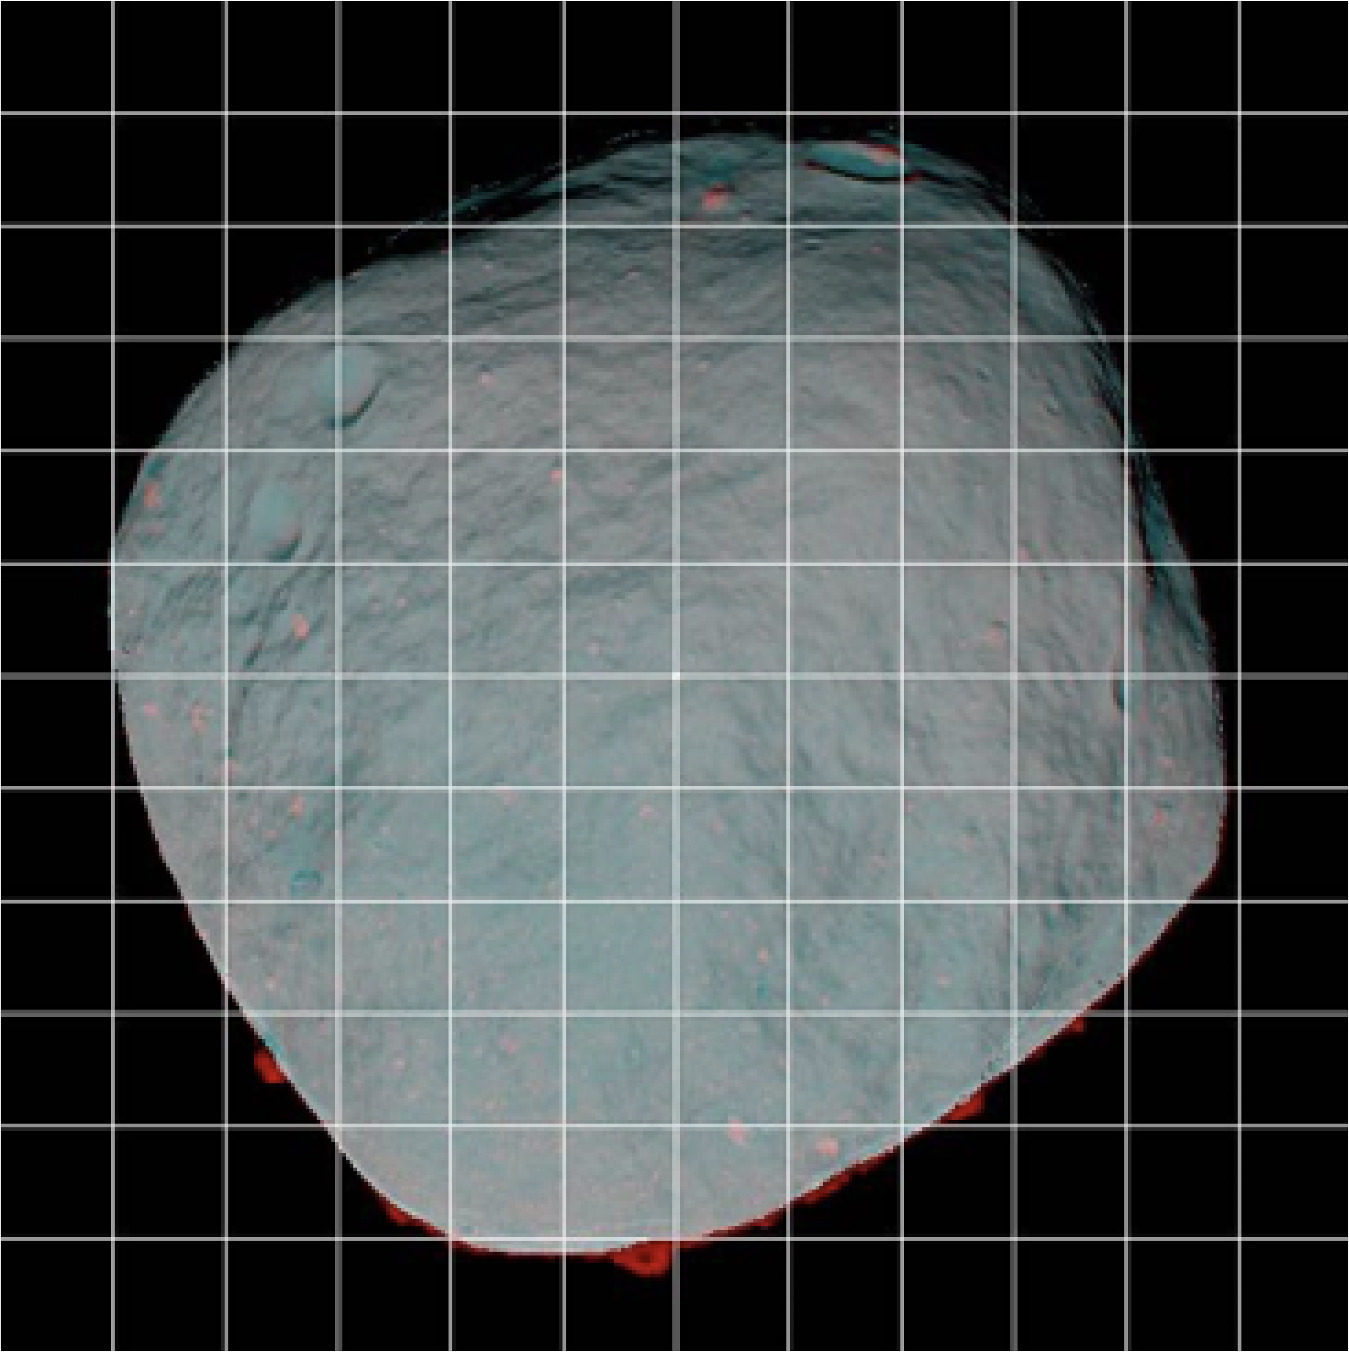
Figure 6. One can compare actual images to rendered images based upon the same observation geometries to identify and characterize how well SPC constructs boulders. This composite image is constructed by assigning the red channel to the truth image and the cyan channel to a synthetic image generated by the DTM. The terrain that matches is gray, while errors stand out as red or cyan. Here, the missing boulders are noticeable by the red on the asteroid's limb.
Download figure:
Standard image High-resolution image4.4. Albedo Channel
One of the benefits of SPC over traditional stereo topography generation is a consistent and scientifically usable albedo channel. Traditional stereo will generate a height map, but there will be no information about the surface's albedo. On the other hand, SPC will solve for an albedo solution over the entire surface. Because it uses multiple images and a photometric function to correct for phase, emission, and incidence angle at every pixel, the albedo channel of the DTM provides a highly accurate representation of the relative albedo of the surface. This albedo product has been used both for navigation (Olds et al. 2022; Adam et al. 2023) and as input for scientific analysis, e.g., for quantitative photometry (Domingue et al. 2018) and thermal modeling (Palmer & Sykes 2014).
Because cross-correlation was the key criterion for the OSIRIS-REx mission, detailed analysis of the albedo was not conducted. The companion paper, Palmer et al. (2024a), provides more analysis of cross-correlation, which measures the quality of a DTM that contains both topography and albedo. However, for quantitative and specific albedo evaluation, new tools and methodologies are required and are outside of scope of this study.
4.5. Scalability of SPC
Another finding is that SPC is scalable over the range of planetary science data. These tests demonstrate that SPC can utilize images at any resolution to make a corresponding topography resolution. Terrain from 6 m GSD down to 0.35 cm GSD was generated in our testing, a difference of 3 orders of magnitude. Figure 7 shows a sample of the results for the highest-resolution topography down to 0.35 cm.

Figure 7. DTMs that included very high-resolution images and maplets.
Download figure:
Standard image High-resolution image
SPC has been used for large objects such as Vesta (Gaskell 2012) and Ceres (Park et al. 2019). Considering that global topography was modeled for Vesta and Ceres at kilometer scales, SPC has demonstrated efficacy over an additional 3 orders of magnitude. In total, 6 orders of magnitude in topographic scale have been demonstrated by SPC, from 1 km down to the 0.5 cm terrain used for actual navigation at Bennu (Olds et al. 2022).
4.6. Sources of Error
From this suite of testing, we can provide some insight as to how SPC handles error. The fusion of stereo and photoclinometry makes it difficult to separate how error propagates because the final result is a single DTM that reflects the benefits of each technique. However, there are a few conclusions that can be drawn.
FormU offers a good indication of the effectiveness of the stereo component. To summarize, FormU averages the error between the maplet's center vector in 3D space and its pixel/line location of the image projected into 3D space (Weirich 2022). FormU provides an estimate of how well the spacecraft position/pointing has been corrected, indicating that the overall structure of the model's inputs are stable. Even though SPC updates the initial navigation solution, not all errors are removed. These errors can be seen in FormU. The better the data (as defined by range of observing conditions), the better SPC can reconstruct the flight trajectory and thus compute a stereo solution for the center vectors of the maplets.
Cross-correlation shows errors in the DTM that can be from either albedo or slopes. The albedo channel is the one most directly related to photoclinometry. We have noted that low-incidence-angle images frequently have some of the lowest cross-correlation scores because the digital number of these images is predominately a function of albedo. However, once the incidence angle is larger than 20°, the topographic signature from the slopes is stronger than the effect of albedo. As such, it is possible that errors in the photometric function could be detectable by the cross-correlation score of low-incidence-angle images.
On the other hand, the slopes, and thus the topography, come from a combination of the pixel-by-pixel calculation of photoclinometry and conditioned with stereo. During the nominal processing of SPC topography, a random 1% of a maplet's pixels will be constrained by stereo calculations. Overall, this processing works exceptionally well without significant error. With a good data set, we can attain cross-correlation scores of over 0.9, which is a very good representation of the surface.
However, SPC's ability to solve for the albedo and slope at each pixel breaks down with steep slopes because the largest source of error within SPC is due to orthorectification of the images to remove the topography. Orthorectification requires a DTM in order to remove the projection effects within an image; however, during DTM generation, the available DTM will be immature. As such, not all topographic features can be removed from the images. Thus, images taken from different viewing geometries have features rendered at different maplet x/y positions. Then, when photoclinometry is conducted, there is not a consistent solution for those x/y positions because they correspond to different features. SPC's difficulty in generating boulders is the clearest example of this. While additional processing of the DTM helps remove some of these effects, there are regions in which the images never have the topography fully removed, resulting in error shown by lower cross-correlation scores.
5. Conclusion
We described a series of tests to validate the SPC software for DTM generation and enable NASA Class B certification for its operational use on the OSIRIS-REx mission. The mission used the software not only for general navigation throughout the mission (Leonard et al. 2020; Adam et al. 2023) but also for autonomous navigation during the sample collection flight sequence (Norman et al. 2022; Olds et al. 2022).
These tests have allowed us to provide a systematic characterization of several aspects of SPC's performance and summarized below. Key takeaways:
- 1.Achievable accuracy is on the order of the source images' pixel size
- 2.Typical errors in the navigation solution do not have a significant impact
- 3.Equatorial latitudes are represented more accurately than polar latitudes, mostly due to poor illumination
- 4.Steep slopes tend to be underrepresented
- 5.With the right images, topography can be generated at any GSD
- 6.Cross-correlation can evaluate accuracy effectively during testing and flight
Using a synthetic truth model to produce simulated images provided an absolute ground truth so that the fidelity of the SPC-generated test DTMs could be quantified via rms differences. The accuracy of the DTM, assuming a reasonable image set, is on the order of the source images' pixel size; i.e., images with a 5 cm pixel size will have an accuracy of 5–10 cm.
The tests showed that moderate errors in reconstructed navigation solutions (knowledge error) have a minimal impact on the quality of SPC-generated DTMs, mostly because SPC can effectively update the spacecraft's poise. The accuracy of an SPC model is only moderately impacted by the navigation solution—by a factor of 2 for the OSIRIS-REx camera system. The tests also demonstrated that formal uncertainty can be used as a proxy for accuracy during flight operations when an exact rms is unavailable. The tests also showed that both versions of the photometric function (McEwen 1991, 1996) are effective, although the version published earlier converged faster. A more detailed analysis of different photometric functions would be a worthwhile area of future study.
Testing further showed that equatorial latitudes will have superior accuracy to polar latitudes because they can include more variation in solar illumination geometries. An additional issue with SPC was characterized by which boulders with steep slopes are frequently underrepresented.
Testing demonstrated that the standard processing produces the best DTM. This is not surprising, since these procedures have been developed over the years and used for many scientific products. The results of this study and the OSIRIS-REx mission extend the range of image GSDs over which SPC has been shown to produce useful DTMs to 6 orders of magnitude; i.e., SPC can generate topography at almost any GSD if provided with the appropriate imagery.
Cross-correlation has proven to be an effective and invaluable tool in measuring the quality of the model and is more important than rms (as implemented here) at fine scales. The cross-correlation technique is applicable not only in testing with a truth model but also in flight when there is no known truth.
One gap in our present knowledge is that none of the tests used here are sensitive to the errors of vertical scale for the relief within maplets that could result from using an inaccurate photometric model. Such errors do not affect navigation solutions or overall shape but may be important for geoscientific analyses. Internal consistency and image correlation are entirely blind to the effect. The rms (and FormU) statistics could detect these errors in principle but in practice cannot do so when the errors in local relief are smaller than the pixel-level errors in maplet positions. A potentially fruitful approach for quantifying such errors in the future would be to carry out simulations like those described here but to compute the rms difference between the truth model and individual maplets that have been coregistered to it to eliminate the maplet position errors. This approach would open the door to a more thorough examination of the impact of the photometric model on the fine details recovered by SPC. Lastly, the testing described here showed that the OSIRIS-REx DRM C did not have adequate imaging to meet mission requirements. As a result, the imaging campaign in the Detailed Survey phase of the mission was significantly augmented, as discussed in the companion paper (Palmer et al. 2024a).
Acknowledgments
This material is based upon work supported by NASA under contract NNM10AA11C issued through the New Frontiers Program and by the Canadian Space Agency. We are grateful to the entire OSIRIS-REx Team for making the encounter with Bennu possible. All data from the OSIRIS-REx mission are available via the Planetary Data System at https://sbn.psi.edu/pds/resource/orex/. These testing models are all archived in the Planetary Data System (Palmer et al. 2024b). The license of the PSI SPC software suite is available from the Planetary Science Institute at https://www.psi.edu. Please contact Eric Palmer (epalmer@psi.edu) for information on access, training, and the fee schedule. We owe many thanks to two anonymous reviewers whose suggestions greatly improved the paper.