Lineage-level species distribution model to assess the impact of climate change on the habitat suitability of Boleophthalmus pectinirostris
 Zengman Wu1
  Linlin Zhao
 Na Song
- 1Key Laboratory of Mariculture, Ministry of Education, Ocean University of China, Qingdao, China
- 2Key Laboratory of Marine Eco-Environmental Science and Technology, First Institute of Oceanography, Ministry of Natural Resources, Qingdao, China
Global climate change has profound impacts on the habitats of marine organisms, and predicting the habitat changes of species under climate change conditions is crucial for species sustainability. Boleophthalmus pectinirostris is an intertidal fish species that holds significant ecological and economic value. To better protect and manage its resources, this study aimed to predict its current potential distribution and habitat changes under different climate scenarios in the future. This study firstly quantified the hypervolume niches of the three lineages (AE1, AE2, and AES lineages) and compared the niche differentiation among them. Furthermore, this study constructed species-level and lineage-level species distribution models (SDMs) to assess the impact of climate change on the habitat suitability of B. pectinirostris. The result of the niche differentiation assessment showed that there was marked differentiation in niches among the three lineages. The responses of different lineages to environmental variables were different, suggesting that lineage-level models may provide more accurate prediction results. According to the model predictions, the AES may have greater resilience to climate change and may experience habitat expansion in the future, while the AE1 and the AE2 may face habitat loss in some regions. Climate change-driven shifts in oceanic conditions were anticipated to affect the distribution and community structure of marine organisms. This study assessed the impact of climate change on the suitable habitat range of three lineages of B. pectinirostris using SDMs. Consistent with previous studies, the results of our study indicated that lineage-level SDMs may be more reliable than species-level SDMs for species with population differentiation in terms of the accuracy of predictions. In addition, considering the vulnerability of the AE1 and AE2 lineages to climate change, conserving these two lineages should be given a higher priority. The results of this study will provide important information for the future management and conservation of this species.
1 Introduction
The global climate is undergoing continuous change, and anthropogenic activities are exacerbating this process. Abundant research has highlighted the profound impact of climate change on ecosystems worldwide (Zhang et al., 2021). The ocean, being the largest ecosystem in the biosphere, supports diverse biological resources and provides extensive habitat for organisms. The distribution of marine organisms is intricately associated with their physiological tolerance to environmental factors (Hastings et al., 2020; Blewett et al., 2022; Bosso et al., 2022). Climate change-driven shifts in oceanic conditions, such as increasing water temperatures, ocean acidification, and declining dissolved oxygen levels, are anticipated to affect the distribution and community structure of marine organisms (Cheung et al., 2013; Breitburg et al., 2018). Notably, mounting evidence indicates a spatial trend of increasing species abundance towards polar regions and decreasing abundance towards the equator in global oceans (Cheung et al., 2009; Xu et al., 2023). Thus, comprehending species distribution patterns and the underlying factors governing these patterns is crucial for effectively safeguarding and managing biological resources under the influence of climate change (Robinson et al., 2011; Di Febbraro et al., 2023).
Boleophthalmus pectinirostris, commonly known as the great blue-spotted mudskipper, is a warm-temperate and euryhaline fish species that inhabits intertidal mudflats near the shorelines. It is mainly distributed along the Western Pacific coast, including China, Japan, Korea, and Malaysia (Murdy, 1989; Takegaki, 2008; Polgar and Crosa, 2009; Polgar and Bartolino, 2010). As a fish with certain amphibious habits, B. pectinirostris has developed a number of morphological and physiological adaptations in response to the challenges posed by abiotic factors such as dramatic fluctuations in temperature and salinity and desiccation in the shoreline region (Zhang et al., 2012; You et al., 2014). B. pectinirostris is an herbivorous fish that mainly feeds on benthic diatoms and is characterized by the short food chain, low trophic level, and prompt responsiveness of its body indicators to changes in environmental indicators, so it has significant implications for monitoring coastal environments (Yang et al., 2003; Liu et al., 2006; Pan et al., 2022). Previous molecular phylogeographic studies have demonstrated that B. pectinirostris can be divided into two major lineages: the East Asian lineage (AE) and the Southeast Asian lineage (AES) (Chen, 2010; Chen et al., 2014c). This divergence, which occurred 2.73 million years ago, might be caused by the exposure of the Strait of Malacca during the Late Pliocene Sea Level Minimum (Chen et al., 2014c). Furthermore, the East Asian lineage can be further divided into two sub-lineages: the AE1 lineage (comprising most populations in Japan and South Korea) and the AE2 lineage (comprising most populations along the coast of China) (Chen, 2010; Chen et al., 2014a). Given the important ecological and economic value of B. pectinirostris, it is crucial to assess the impacts of climate change on the habitat of different geographic lineages in order to conserve and manage the biological resources of B. pectinirostris in the era of climate change (Pan et al., 2021).
Species Distribution Models (SDMs) are powerful tools for studying changes in species spatial distribution patterns under climate change, biodiversity assessment, and species conservation planning (Jones and Cheung, 2014; Melo-Merino et al., 2020; Rathore and Sharma, 2023). SDMs estimate the ecological niche and distribution probability of a species in a specific region using models constructed based on the correlation between species distribution data and spatial habitat data (Robinson et al., 2017; Salinas-Ramos et al., 2021; Baker et al., 2022). By projecting environment variables under different assumptions of representative concentration pathways (RCP) emissions scenarios, SDMs can also be used to forecast the future distribution range of species (Moss et al., 2010). However, the prolonged process of biological evolution leads to the gradual adaptation of different geographic lineages of the same species to their ecological environments, which may cause niche differentiation among lineages (Sun et al., 2022). For species that have undergone differentiation, species-level SDMs do not account for the local adaptability of different lineages, which may result in unreliable prediction outcomes (Pearman et al., 2010; D’Amen et al., 2013). This was because species-level species distribution models (SDMs) assumed that all populations within a species have the same ecological requirements and responses to environmental variables (Zhang et al., 2021). However, the environmental preferences of different lineages within a species were often imperfectly homogeneous, leading species-level SDMs to potentially predict species occurrence in areas where some lineages were not adapted to survive (Hu et al., 2021; Peñalver-Alcázar et al., 2021). Recent studies have shown that lineage-level models constructed for various geographic lineages of the same species can provide more accurate predictions of the potential distribution (Peñalver-Alcázar et al., 2021; Zhang et al., 2021; Sun et al., 2022).
Different species exhibit varying responses to climate change, with certain taxa reflecting both beneficial and adverse repercussions in the face of climate variations (Li et al., 2022; Maurya et al., 2023). In this study, B. pectinirostris was classified into three phylogenetic lineages, and the ecological niches of the different lineages were quantified and described. In order to understand the impact of climate change on its habitat, this study constructed species distribution models at both species and lineage levels to predict its potential distribution under current and future environmental conditions. We hypothesize: (1) there exists marked differentiation in niches among different lineages; (2) different lineages exhibit different responses to climate change; and (3) under future climate conditions, there is a trend for the distribution of B. pectinirostris to shift towards higher latitudes. The results of this study will provide valuable insights into the conservation, management, and utilization of B. pectinirostris resources.
2 Materials and methods
2.1 Study area and species distribution data
The study area for the research was the region along the Western Pacific coast, between 95°E-145°E longitude and -10°N-45°N latitude. The study range for the three lineages of B. pectinirostris, AE1, AE2, and AES, was restricted to 123°E-145°E, 15°N-45°N; 95°E-123°E, 15°N-45°N and 95°E-145°E; -10°N-15°N, respectively, based on molecular phylogeography results (Figure 1) (Chen, 2010; Chen et al., 2014a; Chen et al., 2014c). The occurrence records of B. pectinirostris were obtained from four sources, including the Ocean Biogeographic Information System (OBIS, http://www.obis.org), the Global Biodiversity Information Facility (GBIF, http://www.gbif.org), the iNaturalist website (http://www.inaturalist.org), and the records from the literatures (Supplementary Table 1). Then the occurrence records were spatially thinned by using the R package spThin to reduce sampling bias and set at a 9.2 km radius, consistent with the resolution of the environmental layers (Aiello-Lammens et al., 2015). A total of 128 occurrence records were retained, including 21, 92, and 15 occurrence records for the AE1, AE2, and AES lineages of B. pectinirostris, respectively.
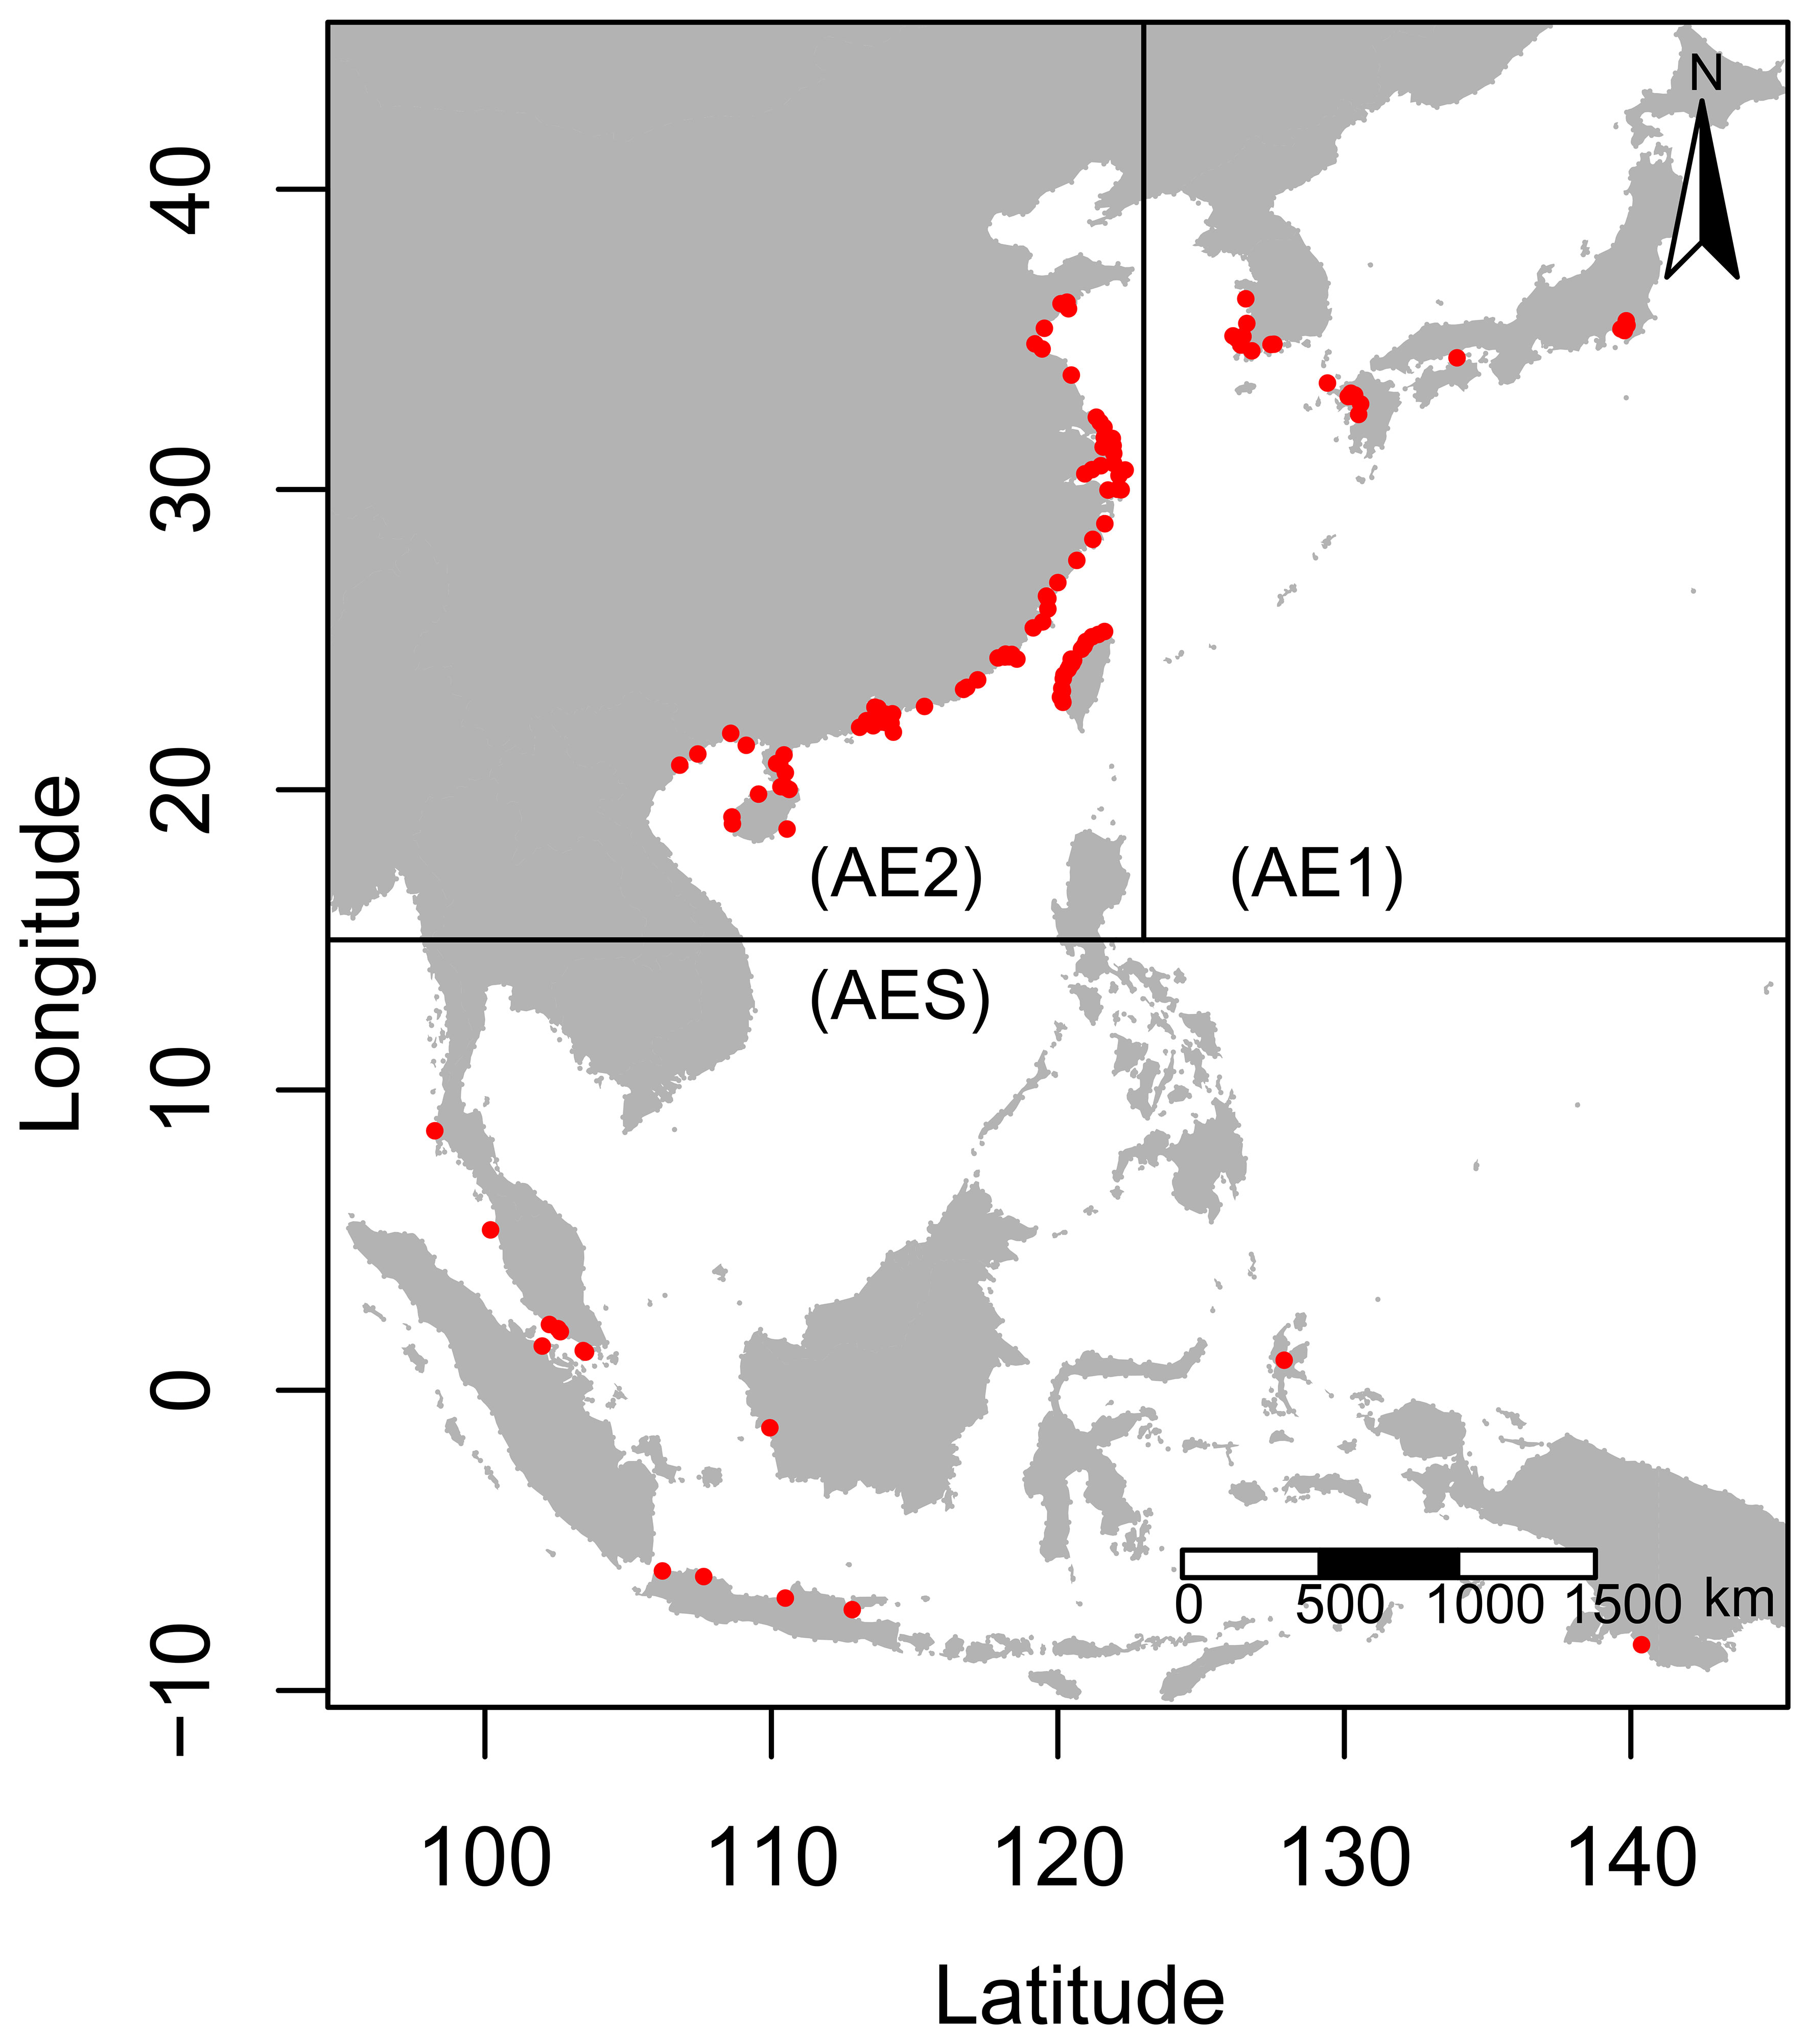
Figure 1 Division of the study area and occurrence records of B. pectinirostris. The red dots represented the occurrence records of B. pectinirostris.
2.2 Environmental variables
Given the availability of data and the correlation between species and environmental variables, we initially selected 10 environmental variables that could potentially impact the distribution of B. pectinirostris (Supplementary Table 2). Notably, environmental variables such as water temperature, current velocity, salinity, dissolved oxygen, and ocean depth are key variables that restrict the distribution of marine fish species (Sperling et al., 2016; Bosch et al., 2017; Goldsmit et al., 2018). B. pectinirostris is herbivorous species that primarily feeds on benthic diatoms, which are usually represented by chlorophyll in marine ecology (Yang et al., 2003; Huot et al., 2007). Additionally, as B. pectinirostris mainly inhabits tidal flats, distance to shore was incorporated as a predictor variable, offering an inferential measure of the tidal flat expanses.
With a spatial resolution of 5×5 arc minutes (i.e., 9.2×9.2 km), all environmental variables (Supplementary Table 2) were collected from the online database: Bio-ORACLE v2.1 (Assis et al., 2018) and the Global Marine Environment Datasets (Basher et al., 2018). The average values (monthly averages during the entire period) of environmental variables during 2000-2014 were taken to represent the present environmental conditions. The pairwise Pearson’s correlation coefficients between the 10 predictor variables were calculated in order to lessen the effect of collinearity on the evaluation of predictor variable importance (Supplementary Figure 1). One variable was removed from each pair with a Pearson’s correlation coefficient greater than |0.7| (Dormann et al., 2013). The Dshore (distance to shore), Tm (mean water temperature), Sal (mean salinity), CV (mean current velocity), DO (mean dissolved oxygen), and Chl (mean chlorophyll concentration) were the final six environmental variables kept for subsequent analysis.
In addition, Bio-ORACLE provided future environmental projections using three atmospheric-ocean general circulation models (AOGCMs) under four representative concentration pathway (RCP) emission scenarios (RCP 2.6, RCP 4.5, RCP 6.0, and RCP 8.5) (Assis et al., 2018). To decrease uncertainty, the average predictions of the three AOGCMs were used to represent future climatic conditions (Assis et al., 2018). RCP 2.6–RCP 8.5 represent the different scenarios of greenhouse gas emissions from low to high in the future (Moss et al., 2010). Considering the availability of future environmental data, only five environmental variables (Tm, Sal, CV, Chl, and Dshore) were used in this study for species distribution projection. And, in this study, two scenarios, RCP 2.6 and RCP 8.5, were selected to project the future distribution of B. pectinirostris in the different periods of the 2050s (2040–2050) and 2100s (2090–2100). In the future, the increase in greenhouse gas emissions will lead to a larger increase in water temperature as well as more significant decreases in salinity and chlorophyll concentration (Sun et al., 2022). Besides, this study assumed that the distance to shore would remain constant in the future (Zhang et al., 2021).
2.3 Niche differentiation assessment
Firstly, the R package FactoMineR was used to perform a principal component analysis (PCA) on six environmental predictive variables (Dshore, Tm, Sal, CV, Chl, and DO) to reduce the dimensionality of the niche space (Le et al., 2008). The first four principal components were retained, as they accounted for over 80% of the total variance (Supplementary Figure 2). Subsequently, we used the R package hypervolume to compute a four-dimensional hypervolume based on the retained principal components (Blonder et al., 2021). The size of the niche space occupied by a lineage can be indicated by the volume of the hypervolume. Finally, the hypervolumes of different lineages were overlapped using the R package BAT to assess niche differentiation among lineages (Cardoso et al., 2021). The total niche differentiation (βTotal) ranges from 0 to 1 and measures the degree of niche differentiation between two lineages (Carvalho and Cardoso, 2020; Mammola and Cardoso, 2020). Higher βTotal values indicated greater differentiation. And it consists of niche shift, which represents the replacement of space between the hypervolumes occupied by the populations, and niche contraction or expansion, which refers to the net differences in the spatial extent encompassed by each niche hypervolume (Carvalho and Cardoso, 2020; Mammola and Cardoso, 2020).
2.4 Species distribution modeling and prediction
This study used 10 modeling techniques in the Biomod 2 R package (Thuiller et al., 2021). Considering the scarcity of true absence records, this study simulated 2000 pseudo-absence points in the contrasting environment conditions where the available occurrence records were not present (Barbet-Massin et al., 2012). Five environmental predictor variables (Dshore, Tm, Sal, CV, and Chl) were used in this study for modeling predictions. Since the AE1 and AES lineages of B. pectinirostris have only 21 and 15 occurrence records, this may lead to overfitting of the model. To overcome this limitation, this study applied the ensemble of small models (ESMs) strategy using the R package ecospat, which is a modeling strategy specifically designed for species with limited occurrence records (Lomba et al., 2010; Breiner et al., 2015; Di Cola et al., 2017). According to this strategy, this study selected two of the five environmental predictor variables at a time to construct many bivariate models, and then the predictions of these bivariate models were weighted and averaged according to the model performance, thus obtained the predictions of the ensemble of small models (ESM) (Breiner et al., 2015, 2018). Finally, the predictions of the ESM based on different algorithms were assembled into the final ensemble of small model (ESMs) predictions based on model performance (Breiner et al., 2015, 2018). A fivefold cross-validation strategy was used to assess the performance of the models (Guisan et al., 2017). The performance of each bivariate model and ESM was evaluated using the area under the curve (AUC) values (Lomba et al., 2010). We then used Somers’ D [D = 2 × (AUC − 0.5)] as weights to integrate the ESM into the final ensemble model (Lomba et al., 2010). In this process, any models with a Somers’ D value less than 0 (i.e., the AUC value below 0.5) will be excluded from the final ensemble model. In addition, the performance of the final ensemble model was evaluated in this study using the true skill statistic (TSS) and the Boyce index (Boyce) (Allouche and Kadmon, 2006; Hirzel et al., 2006). Ensemble models were constructed at both the species-level (species model) and the lineage-level (AE1 model, AE2 model, and AES model).
The relative importance of each predictor variable for modeling the distribution of B. pectinirostris was assessed according to the methods of Di Cola et al. (2017). The potential distribution of B. pectinirostris under different climate scenarios (RCP 2.6 and RCP 8.5) for the present and future (2050s and 2100s) was predicted using ensemble models constructed at the species and lineage levels, respectively. Continuous habitat suitability maps were generated based on the direct output of the ensemble model. In order to facilitate the interpretation of habitat suitability, this study converted the continuous habitat suitability predictions into binary maps by maximizing the probability threshold of the true skill statistic (Liu et al., 2013).
2.5 The multivariate environmental similarity surface analysis
The multivariate environmental similarity surface (MESS) analysis was used to analyze the climate change in the study area in the future compared with the current time period and the key environmental factors driving climate change (Elith et al., 2010). First, we extracted the environmental data (Dshore, Tm, Sal, CV, and Chl) for the species distribution points (true habitat) in the current period as reference points. And we then used the R package ENMeval to calculate the environmental similarity (S) between all locations in the study area and the reference points for both the current period and the future period (taking the RCP8.5 scenario in the 2100s as an example) (Kass et al., 2021). The larger the S value, the higher the environmental similarity between the region and the reference points, indicating that the region may be a suitable habit for the species; when the S value is negative, it means that at least one environmental factor in the region is beyond the range of the reference set, indicating that the environment of the region and the reference point is more different, and it may be unsuitable for the survival of the species (Elith et al., 2010). Then the R package ENMeval was used to extract the key climate variable that contributes to the differences between each location within the study area during the future period and the reference set (Elith et al., 2010; Kass et al., 2021). This variable was referred to as the most dissimilar variable (MoD), which is the key environmental factor driving future climate change at a specific site (Elith et al., 2010). In addition to an overall analysis of climate change within the ranges of species, this study analyzed climate change within the respective ranges of the three lineages.
3 Results
3.1 Niche differentiation among three lineages
The four-dimensional hypervolumes for AE1, AE2, and AES were 693.34, 2201.73, and 627.18, respectively. Correlating with the size of their distribution ranges, the AE2 lineages with the largest distribution ranges had the largest hypervolume ecological niches. Comparison of the hypervolume results (βTotal) showed that there was marked differentiation in niches between the three lineages, and the differentiation in niches within the AE lineage was smaller than that between AE and AES (Table 1). The niche differentiation between AE2 and AE1 or AES was primarily due to niche contraction/expansion (>82.3%), while the contribution of niche shift was minor (<17.7%) (Table 1). The niche differentiation between AE1 and AES was mainly due to niche shift (>93.1%), while niche contraction/expansion only contributed less than 7.0% (Table 1). The overall niche comparison among the three lineages indicated that niche differentiation was mainly influenced by PC1, which was mainly explained by DO, Tm, and Sal (Figure 2 and Supplementary Figure 2). Pairwise niche comparisons showed that niche differentiation between AE1 and AE2 was mainly influenced by PC2, which was mainly explained by Dshore, CV, and Chl; niche differentiation between AE1 and AES was mainly influenced by PC1, which was mainly explained by Tm, Sal, and DO; niche differentiation between AE2 and AES was mainly influenced by PC1, which was mainly explained by DO, Tm, and Sal (Figure 2 and Supplementary Figure 2).
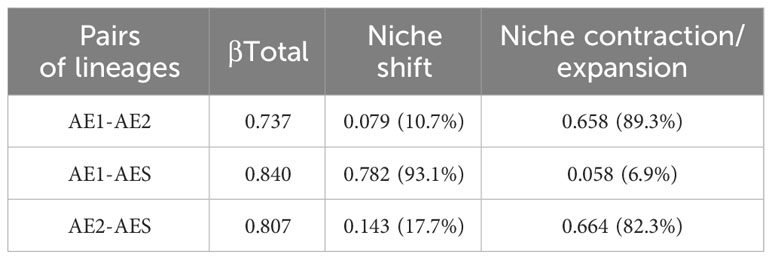
Table 1 Total niche differentiation (βTotal) between lineages and the proportion of niche shift and niche contraction/expansion.
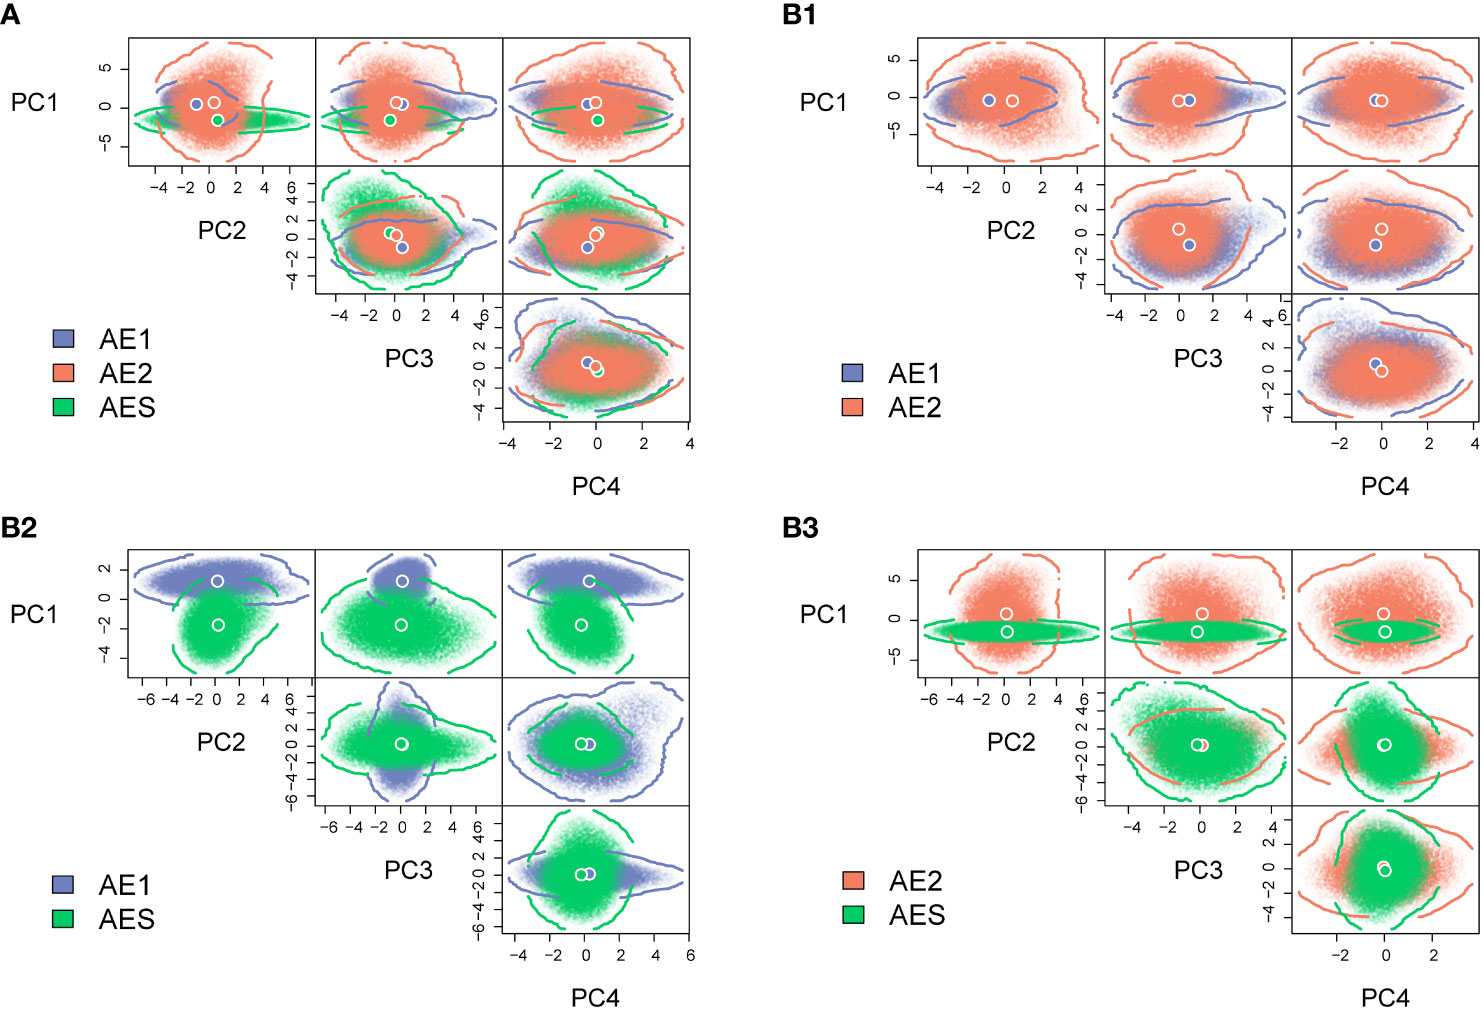
Figure 2 The realized niches for the three lineages of B. pectinirostris quantified via four-dimensional hypervolumes. The axes represent unitless values since the predictors were pre-standardized. Circles with white rims indicated hypervolume centroids. Boundaries and shapes of hypervolumes were delineated by 20,000 points randomly sampled within each hypervolume. Overlapping hypervolumes for the three lineages (A), AE1 and AE2 (B1), AE1 and AES (B2) and AE2 and AES (B3).
3.2 Model performance and importance of environmental variables
The results of the performance evaluation of the ensemble of small models (ESM) constructed based on different modeling techniques were shown in Figure 3. The results showed that the performance of these models exceeded the thresholds set in this study, and all these models will be used to construct weighted ensemble models (ESMs). The predictive performance of the four final ensemble models (ESMs) was shown in Table 2, which indicated that all performance metrics exceeded 0.8, demonstrating the good predictive performance of the final ensemble models. The results of the lineage-level models showed that different lineages had different responses to environmental variables. The distribution of AE1 and AES lineages was greatly influenced by Dshore and Tm, while Dshore and Chl were the most important environmental variables affecting the distribution of the AE2 lineage (Figure 4). In addition, the importance of Dshore exceeded the average importance of the five variables (i.e., 0.2) across all models.
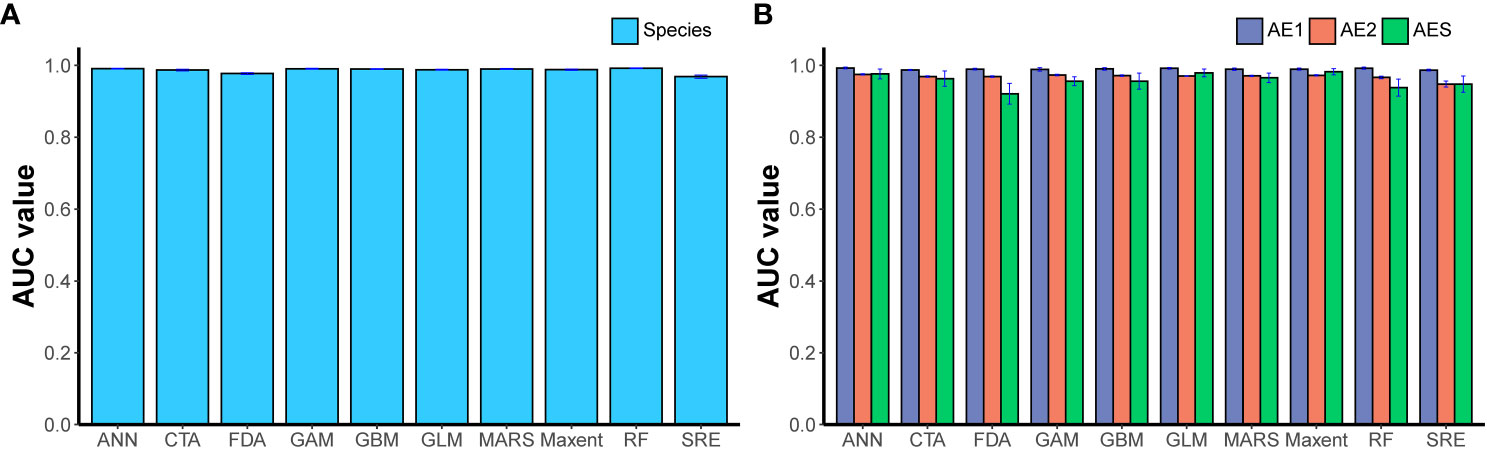
Figure 3 The performance evaluation of the ensemble of small models (ESM) constructed based on 10 modeling techniques. The model was built at the species level (A) and lineage level (B). Artificial neural network (ANN), classification tree analysis (CTA), flexible discriminant analysis (FDA), generalized additive model (GAM), generalized boosting models (GBM), generalized linear models (GLM), multiple adaptive regression splines (MARS), maximum property (Maxent), random forest (RF), surface envelope (SRE). Data were expressed as mean ± standard error.
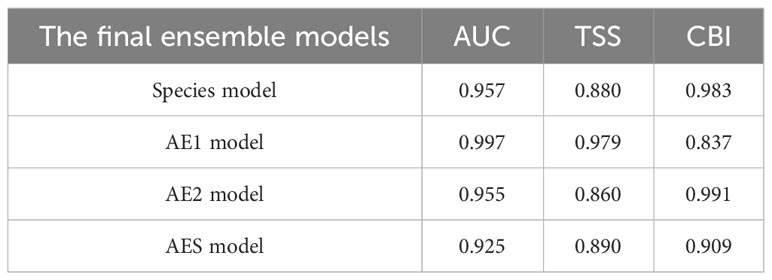
Table 2 Performance evaluation results for the four final ensemble models by using the area under the curve (AUC), the true skill statistic (TSS) and the Boyce index (Boyce).
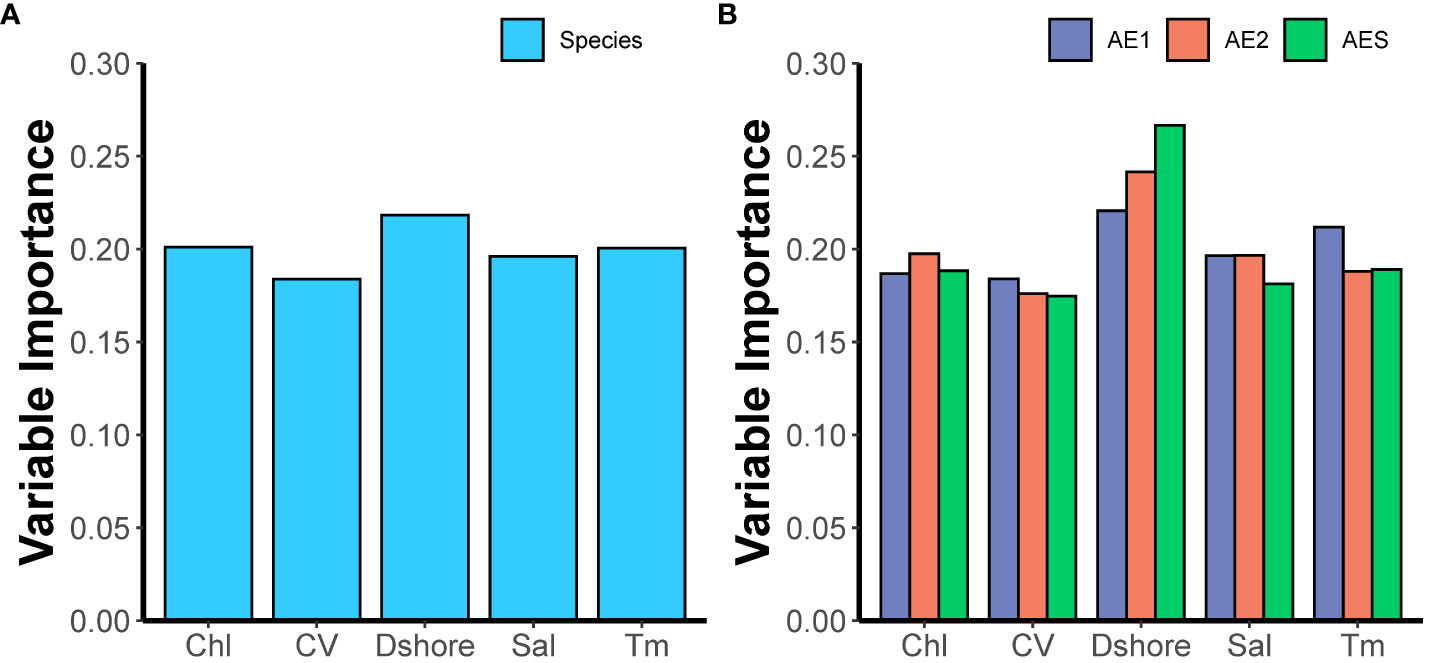
Figure 4 The relative importance of each environmental variable in constructing the species-level ensemble model (A) and the lineage-level ensemble model (B). Chl (mean chlorophyll concentration); CV (mean current velocity); Dshore (distance to shore); Sal (mean salinity); Tm (mean water temperature).
3.3 SDM prediction
3.3.1 Prediction of suitable habitat under current environmental conditions
Under current environmental conditions, all distribution data of B. pectinirostris were within the predicted suitable habitat range. The suitable habitat ranges predicted by the species-level and lineage-level models for B. pectinirostris were mostly similar (Figure 5). The suitable habitat range predicted by the AE1 model (575,498.9 km2) was smaller than that predicted by the species-level model (131,615.2 km2). Compared to the AE1 model, the species-level model predicted more potential habitat for B. pectinirostris along the coast of the Ryukyu Islands. The potential distribution range of AE2 predicted by the AE2 model (168,518.2 km2) extended from the southern waters of the Shandong Peninsula to the northern coastal waters of Vietnam. However, the species-level model predicted that the suitable habitat range of AE2 (176,559.0 km2) could extend northward to Laizhou Bay and Bohai Bay, while the southern boundary extended further south. In contrast to the first two lineages, the suitable habitat area predicted by the AES model (366,237.3 km2) was larger than that predicted by the species-level model (146,173.3 km2).
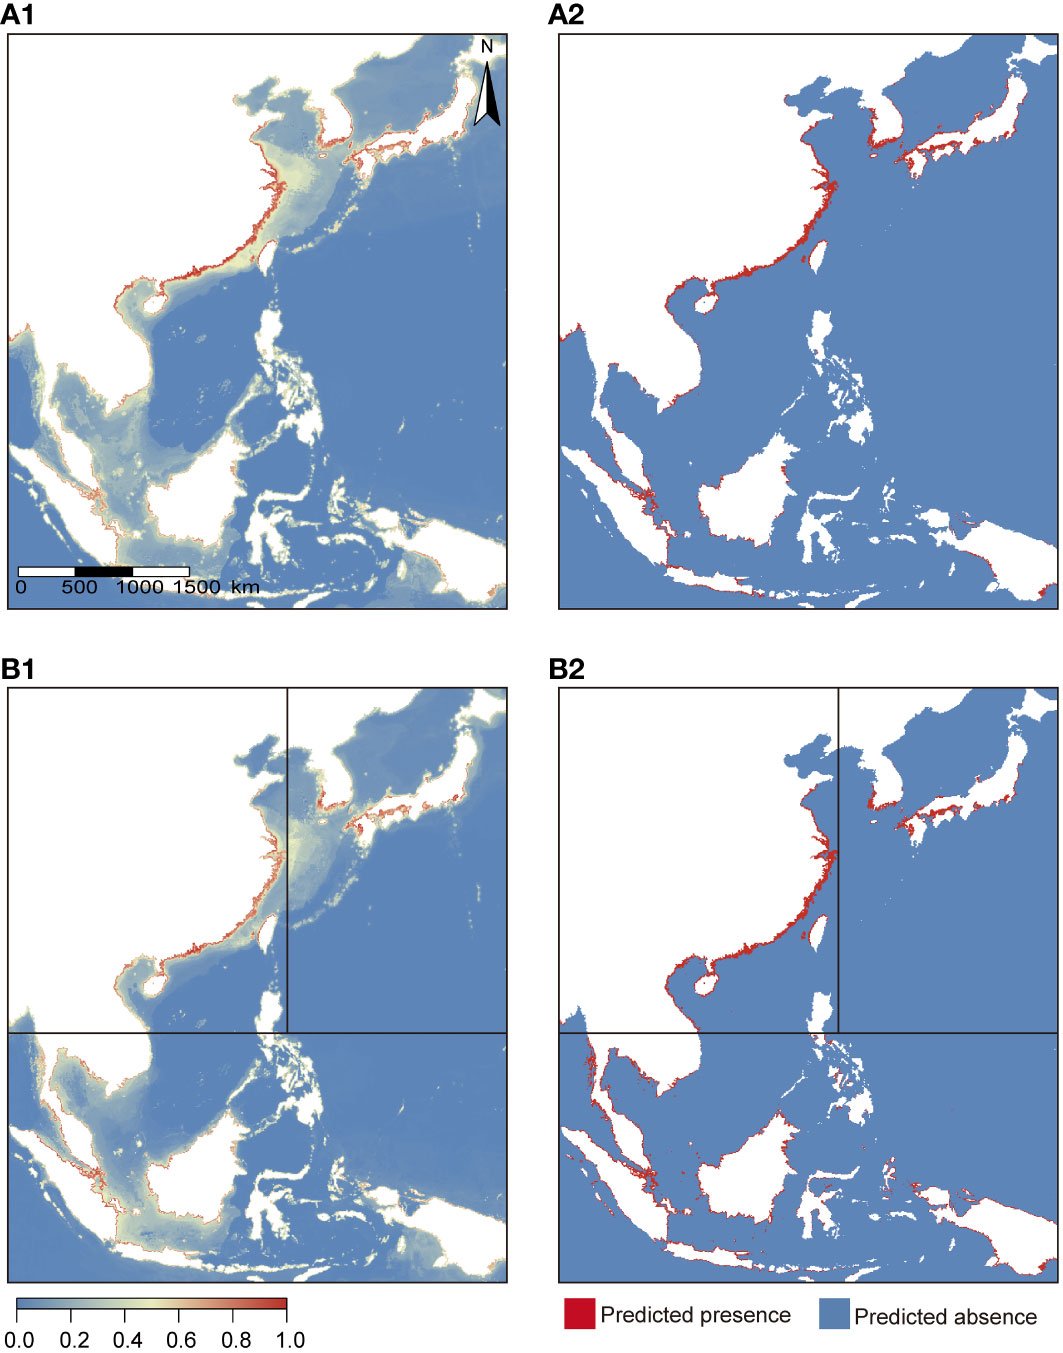
Figure 5 Potential distribution projections based on models constructed at the species-level (A1, A2) and lineage-level (B1, B2) under current environmental conditions. (A1, B1) were continuous maps; (A2, B2) were binary maps.
3.3.2 Changes of suitable habitat range under future climate scenarios
For the AE1 lineage, discrepancies were observed between species-level and lineage-level models in terms of their predictions (Table 3). The species-level model projected an expansion of suitable habitats for the AE1 lineage, whereas the lineage-level model predicted a contraction. As for the AE2 lineage, both species-level and linage-level models predicted that it may face a partial loss of habitat; however, the species-level model predicted a relatively lower extent of habitat loss compared to the lineage-level model (Table 3). In the case of the AES lineage, both species-level and lineage-level models projected an expansion in the extent of suitable habitat and the magnitude of expansion dependent on climate change scenarios (Table 3). The habitat changes predicted by the species and lineage level models for the three lineages in the 2100s under RCP 8.5 conditions were given for explanation (Figure 6). And the details of habitat changes under other climatic scenarios can be found in Supplementary Figures 3–5.

Table 3 Magnitude (%) of change in the range of the habitats predicted by lineage-level (species-level) models at representative concentration pathways (RCP) 2.6 and 8.5 in the 2050s and 2100s.
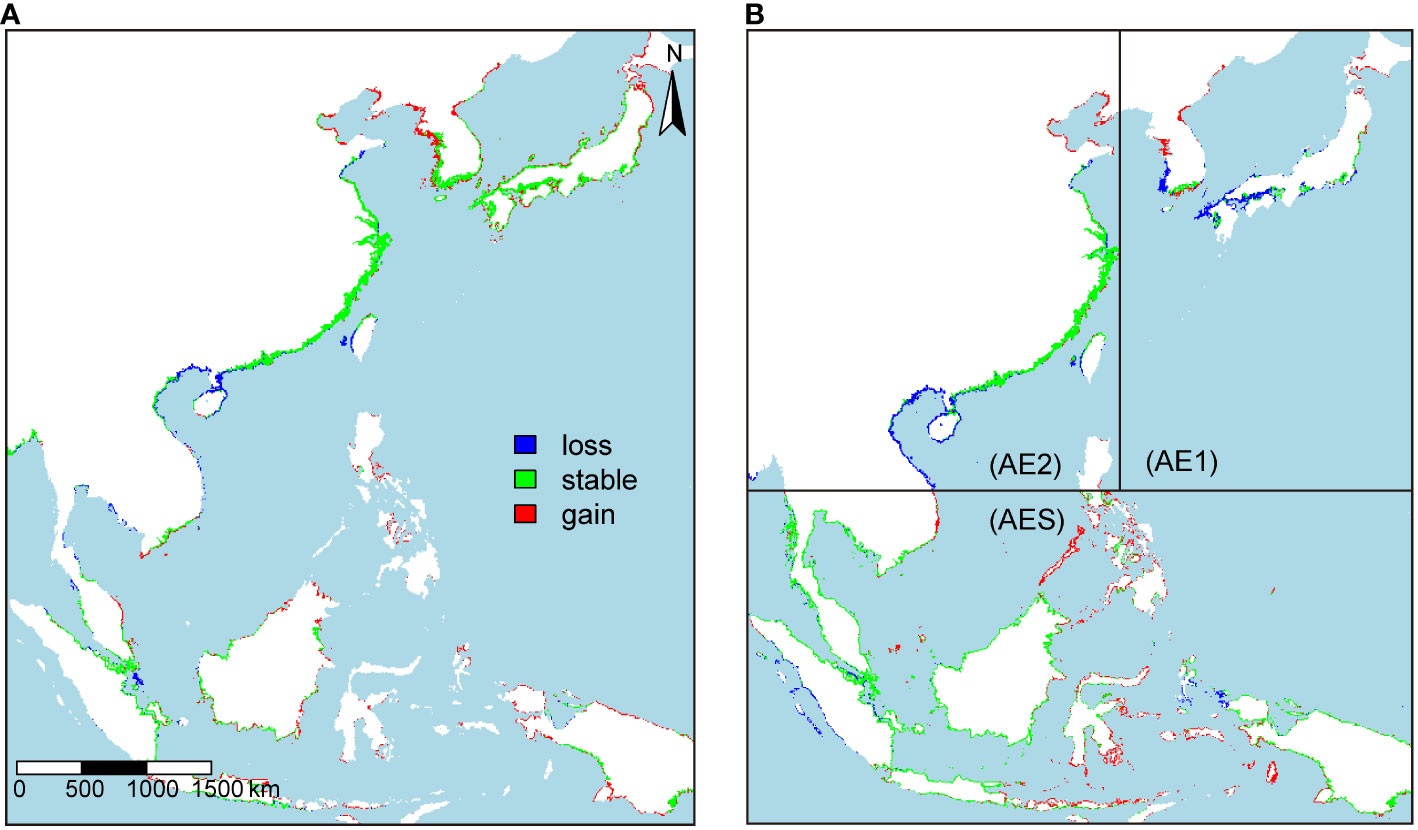
Figure 6 Changes in the suitable habitat of the three lineages were predicted by species-level models (A) and lineage-level models (B) under RCP 8.5 in the 2100s.
Both the species-level model and the AE1 model predicted that the AE1 lineage would expand its habitat range northward. The main difference between them was that the species-level model predicted that its current habitat would remain relatively stable, while the lineage-level model predicted a significant loss of habitat for it in the southern regions of the Korean Peninsula, Honshu Island, and the waters near Kyushu Island. The species-level model and AE2 model predicted that the AE2 lineage would gain a large amount of suitable habitat in the waters near Laizhou Bay, Bohai Bay, and Liaodong Bay while losing many habitats in the waters near the Gulf of Beibu, the northern South China Sea, and the southern part of the Shandong Peninsula. Compared to the AE2 model, the projection of the species-level model was more optimistic, with less loss of suitable habitat in the waters near the Gulf of Beibu and the northern South China Sea. The species-level model and the AES model both predicted that the suitable habitat range for the AES lineage would expand eastward, gaining a large area of habitat in the waters near eastern Indonesia and the Philippine Islands. However, the magnitude of the predicted expansion differed between the two-level models, with the AES model predicting a greater expansion than the species-level model.
3.3.3 The climate change in the study area and key factors affecting the distribution of B. pectinirostris
The environmental similarity between all sites and reference points in the study area for the current and future time periods was calculated by MESS analysis. By comparing the changes in environmental similarity (S values) between the future and current time periods, areas where climate change is likely to occur in the future could be identified. By extracting the most dissimilar variable (MoD), we can identify the key factors driving climate change in the future. In order to facilitate a comparison of the changes in environmental similarity between the two time periods, the S values were divided into four intervals: S ≤ 0, 0<S ≤ 25, 25<S ≤ 50, and S>50. This study focused on areas where there was a decrease in environmental similarity, indicating a potential loss of habitat.
From the entire study area of the distribution of B. pectinirostris, there was a decrease in environmental similarity in a large area in the northern South China Sea in the future compared to the current time period, and the main factors driving this climate change were temperature and chlorophyll concentration (Figure 7). This was consistent with the projection of the species-level model in this study, which suggested that the species may lose a large amount of habitat in the northern South China Sea region. Additionally, there were some areas near the southern coast of the Shandong Peninsula where there was also a decrease in environmental similarity, with chlorophyll concentration being the main factor driving this climate change (Figure 7). This was consistent with the species-level model predicting that it might lose some of its habitat in this neighborhood.

Figure 7 The environmental similarity (S) to the reference sites for all sites in the entire study area for current (A1) and future (A2) time periods. In figures (A1, A2), the different colors represent the ranges of environmental similarity (S) for each point in the graph: Light blue: S ≤ 0; Green: 0<S ≤ 25; Dark blue: 25<S ≤ 50; Red: S>50. Figure (A3) illustrated the most dissimilar variable (MoD) for each site in the future compared to the reference site. Chl (mean chlorophyll con-centration); CV (mean current velocity); Dshore (distance to shore); Sal (mean salinity); Tm (mean water temperature).
From the study area of the AE1 lineage, there was a decrease in environmental similarity in a large area in the southern part of the Korean Peninsula, the southern part of Honshu Island, Shikoku Island, and Kyushu Island in the future compared to the current time period, and the key factors that caused this change were temperature and chlorophyll concentration (Supplementary Figure 6). This was also consistent with the prediction of the AE1 model, which projected that the AE lineage may experience a contraction in its habitat range in this area. From the study area of the AE2 lineage, there was a decrease in environmental similarity in the waters near the northern South China Sea in the future, with temperature being the main factor driving this climate change. In addition, there was a small area near the southern coast of the Shandong Peninsula where there was a decrease in environmental similarity, with chlorophyll concentration being the key factor driving this climate change (Supplementary Figure 6). This corresponded to the prediction of the AE2 model, which suggested that the AE2 lineage might face habitat loss in these areas. Across the study area of the AES lineage, the environmental similarity had decreased in most of the areas within its distribution range, and the key factor causing this change was temperature (Supplementary Figure 6). This appeared to contradict the prediction of the AES model, which projected an expansion of the distribution range for the AES lineage. However, this study suggested that this might be due to the long-term adaptation of the AES lineage to higher temperatures in Southeast Asia, and thus it had a strong ability to adapt to high-temperature environments. The decrease in environmental similarity caused by a slight increase in temperature in the future might not have a significant effect on its distribution. Additionally, from the figures, it was evident that the regions with extremely low environmental similarity (S ≤ 0) to the reference point were primarily influenced by the environmental factor of distance to shore (Figure 7). Furthermore, based on the model predictions, these regions were deemed unsuitable for the survival of B. pectinirostris, indicating that distance to shore might serve as a critical environmental factor restricting the distribution of B. pectinirostris to nearshore marine areas.
4 Discussion
4.1 Niche differentiation among the three lineages
In this study, we quantified and compared the niches of three lineages of B. pectinirostris, and the results showed that the niche space of the AE2 lineage was more expansive than that of the AE1 and the AES lineages. The broader intertidal zone within the AE2 lineage’s distribution region, compared to the AE1 and AES lineages (Murray et al., 2019), coupled with the extensive latitudinal gradient of the dispersal range, allowed it to encompass a wider range of climatic spectrums (Zhang and Yan, 2014). Furthermore, the three lineages of B. pectinirostris distributed in different seas had already produced local adaptations and had marked niche differentiation. And the niche differentiation between these lineages was caused by different reasons (Table 1). The niche differentiation between the AE2 lineage and the other two lineages was mainly due to the expansion/contraction of the niche. Based on the previous description, this study speculated that the niche space of the AE2 lineage may include most of the niche space of the other two lineages. The AE1 lineage and the AES lineage were spatially distant from each other, and the environmental conditions of the regions where they were located differed considerably (Zhang and Yan, 2014). These different lineages had likely undergone evolutionary fine-tuning to their respective local conditions, thus settling in non-overlapping niche spaces. This divergence, predominantly attributed to niche shift dynamics, could potentially elucidate the niche differentiation observed between them.
The niche differentiation between the two lineages within the East Asian lineage was less pronounced than that between the East Asian lineage and the Southeast Asian lineage (Table 1). Furthermore, the differences between them may also be reflected in morphology and genetics (Savolainen et al., 2013). Previous molecular biology studies had shown that the East Asian and Southeast Asian lineages of B. pectinirostris had a relative distant genetic relationship, and the Southeast Asian B. pectinirostris may be a cryptic species (Chen et al., 2014c). In addition, Chen (2010) mentioned that the adult fish of B. pectinirostris in East Asia were smaller in size than those in Southeast Asia. The results of the present study also supported the conclusion that the East Asian lineage and the Southeast Asian lineage of B. pectinirostris were distantly related to some extent. It can be seen that species distribution models not only play an important role in predicting potential habitats and preventing biological invasions but can also help discover new species (Tyberghein et al., 2012).
4.2 Intraspecific variation in SDMs
Species-level SDMs were often constructed based on the assumption of “niche conservation,” disregarding local adaptation and intraspecific variation during the natural selection process (Hällfors et al., 2016; Chefaoui et al., 2018; Zhao et al., 2020). However, an increasing number of studies have indicated that incorporating intraspecific variation and local adaptation into SDMs may improve the accuracy of model predictions (Collart et al., 2021; Zhang et al., 2021; Sun et al., 2022). Previous molecular biology studies had demonstrated genetic differentiation among the three lineages of B. pectinirostris (Chen, 2010; Chen et al., 2014a; Chen et al., 2014c), while this study has shown niche differentiation among them. This highlighted the necessity of constructing lineage-level SDMs to explain the local adaptation of different lineages.
The results of the research indicated that both species-level and lineage-level models predicted a negative effect of climate change on the AE2 lineage, with the species-level model predicting more optimistic results than the AE2 model. Some researchers have argued that species-level models may underestimate the suitable habitat range for a species as they do not take into consideration the phenomenon of local adaptation (Oney et al., 2013; Ikeda et al., 2017; Zhang et al., 2021). Nevertheless, the present study suggested that the species-level model might have overestimated the potential distribution of the AE2 lineage due to the fact that it assumed the lineage could endure all the climatic conditions that the species as a whole can tolerate. This meant that genetic variation within the species did not always mitigate the effects of climate change on its habitat suitability (Cacciapaglia and van Woesik, 2018; Hu et al., 2021; Li et al., 2022). This situation seemed to be more apparent for the AE1 lineage, as the lineage-level model predicted a contracting trend in the suitable habit range of the AE1 lineage, while the species-level model predicted an expanding trend. For the AES lineage, both the species-level and AES models projected an obvious expansion of the habitat range. Compared with the species-level model, the AES model projected a larger expansion of the habitat range, which might be attributed to the positive impact of local adaptation on the response of the AES lineage to climate change (Zhang et al., 2021; Sun et al., 2022).
Although local adaptation and intraspecific variation had different impacts on different lineages, we still tended to believe that incorporating these factors into the model could improve its accuracy (Li et al., 2022). For example, in the present study, the species-level model showed that the distribution of AE2 lineage could extend northward to the waters near Laizhou Bay and Bohai Bay in the current environmental conditions, while the lineage-level model predicted that the distribution of AE2 lineage could only extend to the waters near the southern part of the Shandong Peninsula. However, by consulting literature related to the distribution of B. pectinirostris (Wu and Zhong, 2008; Zhao, 2022), it was discovered that, possibly due to the water temperature limitations under current environmental conditions, the northern boundary of the AE2 lineage was in the waters near the southern part of the Shandong Peninsula. Thus, it could be inferred that constructing lineage-level SDMs might help to reduce prediction uncertainty when there is clear genetic or niche evidence of intraspecific phylogenetic heterogeneity (Zhang et al., 2021).
Despite the crucial role of SDMs in assessing the impact of climate change on the habitat suitability of B. pectinirostris, the present models still have some limitations (Rathore and Sharma, 2023). Although occurrence records of B. pectinirostris were collected from various sources, there were relatively few records of the AES and AE1 lineages in relevant databases and literature, which resulted in limited data for the construction of lineage-level models. When constructing species distribution models, insufficient data may cause an incomplete capture of all the niche space of a species, resulting in overfitting or underfitting of the model, which can affect the accuracy and reliability of predictions (Heikkinen et al., 2006; Elith and Leathwick, 2009). To overcome this limitation, the ensemble of small models (ESMs) strategy was used in this study to minimize the impact of limited data availability for the AE1 and AES lineages on model construction (Lomba et al., 2010; Breiner et al., 2015). Of course, if there were more occurrence data available, it could potentially lead to more precise predictions (Elith and Leathwick, 2009).
4.3 Impact of climate change on B. pectinirostris
The three distinct lineages of B. pectinirostris exhibited geographic isolation across expansive oceanic expanses, resulting in their restricted genetic exchange (Chen, 2010; Chen et al., 2014a; Chen et al., 2014c). Long-term local adaptation may lead to niche differentiation among different lineages, and thus they respond differently to climate change (Sun et al., 2022). In terms of the degree of influence of environmental variables on the distribution of B. pectinirostris, both the results of the SDMs and the MESS analysis revealed that distance to shore was the most significant factor. This phenomenon elucidated that B. pectinirostris had exclusive confinement to the intertidal vicinity contiguous to coastal margins (Murdy, 1989; Takegaki, 2008; Polgar and Crosa, 2009; Polgar and Bartolino, 2010). In addition, water temperature and chlorophyll concentration were also identified as important factors influencing the distribution of B. pectinirostris.
The results of this study indicated that the continuous rise in water temperature might lead to habitat loss for the AE2 lineage in the waters near the Gulf of Beibu and the northern South China Sea because the base temperature in these waters was already relatively higher (Zhang and Yan, 2014). Furthermore, the decline in chlorophyll concentration in the waters near the southern part of the Shandong Peninsula might result in the loss of habitat for the AE2 lineage in this area (Hashioka and Yamanaka, 2007). For the AE1 lineage, the results of the two different level models predicted were different. The species-level model predicted a potential expansion of its habitat, while the lineage model predicted a potential loss of some of its habitat due to increased water temperatures. This study suggested that this may be attributed to the species-level model being influenced by the ecological niches of the other two lineages in its projection of the distribution of the AE1 lineage, thus overestimating the tolerance of the AE1 lineage to high temperatures. Therefore, the projections of the lineage-level model constructed solely based on the ecological niche of the AE1 lineage may be more accurate (Peñalver-Alcázar et al., 2021; Li et al., 2022). Notably, the AES lineage manifested a positive response to climate change. Building upon the results of this study, it was speculated that the AES lineage may have fostered heightened resilience to higher water temperatures due to its long-term adaptation to the high-temperature environment of Southeast Asia.
4.4 Implications for conservation and management
B. pectinirostris has important ecological and economic value, and its unique amphibious habits have also attracted considerable scholarly attention (Wu and Zhong, 2008; Aiello et al., 2023; Bian et al., 2023). During the 1970s and 1980s, the dramatic decline in resource abundance of the Japanese population of B. pectinirostris was primarily caused by habitat loss due to land reclamation and environmental pollution, coupled with the effects of overfishing (Takegaki, 2008). In the Ministry of the Environment Red List 2020 of Japan, its conservation status was listed as Endangered (EN) (http://www.env.go.jp). In China, the relatively wide distribution and abundance of resources of B. pectinirostris have resulted in less attention being paid to its conservation. Moreover, previous research on the conservation of B. pectinirostris had focused on the investigation of the genetic diversity of natural germplasm resources and the development and utilization of artificial propagation techniques, while relatively few studies had been conducted on the impacts of future climate change on the habitat of the mudskipper (Takegaki, 2008; Chen et al., 2014a; Chen et al., 2014b). Therefore, the results of this study will provide a new perspective for the conservation of B. pectinirostris. The results of this study suggested that the AES lineage might have greater resilience to climate change and might experience habitat expansion, whereas the AE1 and AE2 lineages might face habitat loss in certain regions. Considering the vulnerability of the AE1 and AE2 lineages to climate change, conserving these two lineages should be given a higher priority. In addition, the nearshore habitats of B. pectinirostris were also strongly affected by anthropogenic influences, which would exacerbate habitat loss and fragmentation and threaten its survival (Yoo et al., 2013; Murray et al., 2019; Chen et al., 2022). In conclusion, we recommended continuous monitoring of the distribution and population density of B. pectinirostris, as well as the development of more effective management measures, such as limiting fishing quotas and establishing marine protected areas, to ensure the long-term sustainability of this species.
5 Conclusions
This study quantified the niche differentiation among the three lineages of B. pectinirostris and found that there was significant differentiation in the niche among the three lineages. Notably, the differentiation within the East Asian lineage was smaller than that between the East Asian and Southeast Asian lineages. In addition, this study attempted to explore the response of B. pectinirostris to climate change, taking into account intraspecific genetic variation. The different responses of the three B. pectinirostris lineages to environmental variables indicated that lineage-level SDMs may be more reliable than species-level SDMs in terms of accuracy of predictions. According to the model predictions, the AES lineage may have greater resilience to climate change and may experience habitat expansion in the future, while the AE1 and AE2 lineages may face habitat loss in some regions. Overall, it was believed that B. pectinirostris had a certain adaptability to climate change, but we cannot be overly optimistic because its habitats were greatly affected by human activities. To effectively conserve and utilize the natural resources of B. pectinirostris, it was imperative to implement appropriate conservation measures, such as limiting fishing quotas and establishing marine protected areas.
Data availability statement
The original contributions presented in the study are included in the article/Supplementary Material. Further inquiries can be directed to the corresponding authors.
Ethics statement
Ethical approval was not required for the study involving animals in accordance with the local legislation and institutional requirements because this study did not involve experiments on live animals. The raw data used in this study were obtained from online databases.
Author contributions
ZW: Writing – review & editing, Writing – original draft, Visualization, Validation, Supervision, Software, Resources, Methodology, Investigation, Formal analysis, Data curation, Conceptualization. HD: Writing – review & editing, Validation, Resources, Project administration, Investigation. LL: Writing – review & editing, Validation, Resources, Project administration. LZ: Writing – review & editing, Supervision, Resources, Project administration, Investigation, Funding acquisition, Formal analysis, Conceptualization. NS: Writing – review & editing, Supervision, Project administration, Investigation, Formal analysis, Conceptualization.
Funding
The author(s) declare financial support was received for the research, authorship, and/or publication of this article. This research was funded by the National Key R&D Program of China (2022YFF0802204).
Conflict of interest
The authors declare that the research was conducted in the absence of any commercial or financial relationships that could be construed as a potential conflict of interest.
Publisher’s note
All claims expressed in this article are solely those of the authors and do not necessarily represent those of their affiliated organizations, or those of the publisher, the editors and the reviewers. Any product that may be evaluated in this article, or claim that may be made by its manufacturer, is not guaranteed or endorsed by the publisher.
Supplementary material
The Supplementary Material for this article can be found online at: https://www.frontiersin.org/articles/10.3389/fevo.2024.1364822/full#supplementary-material
References
Aiello B. R., Bhamla M. S., Gau J., Morris J. G., Bomar K., da Cunha S., et al. (2023). The origin of blinking in both mudskippers and tetrapods is linked to life on land. Proc. Natl. Acad. Sci. 120, e2220404120. doi: 10.1073/pnas.2220404120
Aiello-Lammens M. E., Boria R. A., Radosavljevic A., Vilela B., Anderson R. P. (2015). spThin: an R package for spatial thinning of species occurrence records for use in ecological niche models. Ecography 38, 541–545. doi: 10.1111/ecog.01132
Allouche O., Kadmon R. (2006). Assessing the accuracy of species distribution models: prevalence, kappa, and the true skill statistic (TSS). J. Appl. Ecol. 43, 1223–1232. doi: 10.2307/4123815
Assis J., Tyberghein L., Bosch S., Verbruggen H., Serrão E. A., De Clerck O. (2018). Bio-ORACLE v2. 0: Extending marine data layers for bioclimatic modelling. Glob. Ecol. Biogeogr. 27, 277–284. doi: 10.1111/geb.12693
Baker D. J., Maclean I. M., Goodall M., Gaston K. J. (2022). Correlations between spatial sampling biases and environmental niches affect species distribution models. Glob. Ecol. Biogeogr. 31, 1038–1050. doi: 10.1111/geb.13491
Barbet-Massin M., Jiguet F., Albert C. H., Thuiller W. (2012). Selecting pseudo-absences for species distribution models: how, where and how many? Methods Ecol. Evol. 3, 327–338. doi: 10.1111/j.2041-210x.2011.00172.x
Basher Z., Bowden D. A., Costello M. J. (2018). GMED: Global Marine Environment Datasets for environment visualisation and species distribution modelling. Earth Syst. Sci. Data Discuss. 2018, 1-62. doi: 10.5194/essd-2018-64
Bian C., Huang Y., Li R., Xu P., You X., Lv Y., et al. (2023). Genomics comparisons of three chromosome-level mudskipper genome assemblies reveal molecular clues for water-to-land evolution and adaptation. J. Adv. Res. 21, S2090–1232. doi: 10.1016/j.jare.2023.05.005
Blewett T. A., Binning S. A., Weinrauch A. M., Ivy C. M., Rossi G. S., Borowiec B. G., et al. (2022). Physiological and behavioural strategies of aquatic animals living in fluctuating environments. J. Exp. Biol. 225, jeb242503. doi: 10.1242/jeb.242503
Blonder B., Morrow C. B., Harris D. J., Brown S., Butruille G., Laini A., et al. (2021). Hypervolume: high dimensional geometry and set operations, projection, and inference using kernel density estimation, support vector machines, and convex hulls. r package version 3.0.0. Available at: https://CRAN.R-project.org/package=hypervolume.
Bosch S., Tyberghein L., Deneudt K., Hernandez F., De Clerck O. (2017). In search of relevant predictors for marine species distribution modelling using the Marine SPEED benchmark dataset. Divers. Distrib. 24, 144–157. doi: 10.1111/ddi.12668
Bosso L., Smeraldo S., Russo D., Chiusano M. L., Bertorelle G., Johannesson K., et al. (2022). The rise and fall of an alien: Why the successful colonizer Littorina saxatilis failed to invade the Mediterranean Sea. Biol. Invasions. 24, 3169–3187. doi: 10.1007/s10530-022-02838-y
Breiner F. T., Guisan A., Bergamini A., Nobis M. P. (2015). Overcoming limitations of modelling rare species by using ensembles of small models. Methods Ecol. Evol. 6, 1210–1218. doi: 10.1111/2041-210X.12403
Breiner F. T., Nobis M. P., Bergamini A., Guisan A. (2018). Optimizing ensembles of small models for predicting the distribution of species with few occurrences. Methods Ecol. Evol. 9, 802–808. doi: 10.1111/2041-210X.12957
Breitburg D., Levin L. A., Oschlies A., Grégoire M., Chavez F. P., Conley D. J., et al. (2018). Declining oxygen in the global ocean and coastal waters. Science 359, eaam7240. doi: 10.1126/science.aam7240
Cacciapaglia C., van Woesik R. (2018). Marine species distribution modelling and the effects of genetic isolation under climate change. J. Biogeogr. 45, 154–163. doi: 10.1111/jbi.13115
Cardoso P., Mammola S., Rigal F., Carvalho J. (2021). BAT: biodiversity assessment tools. r package version 2.7.1. Available at: https://CRAN.R-project.org/package=BAT.
Carvalho J. C., Cardoso P. (2020). Decomposing the causes for niche differentiation between species using hypervolumes. Front. Ecol. Evol. 8. doi: 10.3389/fevo.2020.00243
Chefaoui R. M., Duarte C. M., Serrão E. A. (2018). Dramatic loss of seagrass habitat under projected climate change in the Mediterranean Sea. Global Change Biol. 24, 4919–4928. doi: 10.1111/gcb.14401
Chen H. (2010). Phylogeography of Boleophthalmus pectinirostris (Teleostei: Gobiidae) in marginal seas of the northwestern Pacific. MA thesis. Fudan University, China.
Chen W., Hong W., Chen S., Wang Q., Zhang Q. (2014a). Population genetic structure and demographic history of the mud-skipper Boleophthalmus pectinirostris on the northwestern pacific coast. Environ. Biol. Fishes 98, 845–856. doi: 10.1007/s10641-014-0320-1
Chen W., Hong W., Chen S., Wang Q., Zhang Q. (2014b). AFLP analysis of genetic structure of Boleophthalmus pectinirostris populations from the coastal waters of Northwest Pacific. J. Fish. Sci. China 21, 1020–1028. doi: 10.3724/SP.J.1118.2014.01020
Chen Y., Li G., Cui L., Li L., He L., Ma P. (2022). The effects of tidal flat reclamation on the stability of the coastal area in the Jiangsu province, China, from the perspective of landscape structure. Land 11, 421. doi: 10.3390/land11030421
Chen H., Polgar G., Yin W., Fui C. (2014c). Cryptic species and evolutionary history of Boleophthalmus pectinirostris complex along the Northwesterh Pacific coast. Acta Hydrobiol. Sin. 38, 75–86. doi: 10.7541/2014.10
Cheung W. W. L., Lam V. W. Y., Sarmiento J. L., Kearney K., Watson R., Pauly D. (2009). Projecting global marine biodiversity impacts under climate change scenarios. Fish Fish. 10, 235–251. doi: 10.1111/j.1467-2979.2008.00315.x
Cheung W. W. L., Watson R., Pauly D. (2013). Signature of ocean warming in global fisheries catch. Nature 497, 365–368. doi: 10.1038/nature12156
Collart F., Hedenäs L., Broennimann O., Guisan A., Vanderpoorten A. (2021). Intraspecific differentiation: Implications for niche and distribution modelling. J. Biogeogr. 48, 415–426. doi: 10.1111/jbi.14009
D’Amen M., Zimmermann N. E., Pearman P. B. (2013). Conservation of phylogeographic lineages under climate change. Glob. Ecol. Biogeogr. 22, 93–104. doi: 10.1111/j.1466-8238.2012.00774.x
Di Cola V., Broennimann O., Petitpierre B., Breiner F. T., d’ Amen M., Randin C., et al. (2017). ecospat: an R package to support spatial analyses and modeling of species niches and distributions. Ecography 40, 774–787. doi: 10.1111/ecog.02671
Di Febbraro M., Bosso L., Fasola M., Santicchia F., Aloise G., Lioy S., et al. (2023). Different facets of the same niche: Integrating citizen science and scientific survey data to predict biological invasion risk under multiple global change drivers. Glob. Change Biol. 29, 5509–5523. doi: 10.1111/gcb.16901
Dormann C. F., Elith J., Bacher S., Buchmann C., Carl G., Carré G., et al. (2013). Collinearity: a review of methods to deal with it and a simulation study evaluating their performance. Ecography 36, 27–46. doi: 10.1111/j.1600-0587.2012.07348.x
Elith J., Kearney M., Phillips S. (2010). The art of modelling range-shifting species. Methods Ecol. Evol. 1, 330–342. doi: 10.1111/j.2041-210X.2010.00036.x
Elith J., Leathwick J. R. (2009). Species distribution models: ecological explanation and prediction across space and time. Annu. Rev. Ecol. Evol. Syst. 40, 677–697. doi: 10.1146/annurev.ecolsys.110308.120159
Goldsmit J., Archambault P., Chust G., Villarino E., Liu G., Lukovich J. V., et al. (2018). Projecting present and future habitat suitability of ship-mediated aquatic invasive species in the Canadian Arctic. Biol. Invasions 20, 501–517. doi: 10.1007/s10530-017-1553-7
Guisan A., Thuiller W., Zimmermann N. E. (2017). Habitat suitability and distribution models: With applications in R (United Kingdom: Cambridge University Press). doi: 10.1017/978113902827
Hällfors M. H., Liao J., Dzurisin J., Grundel R., Hyvärinen M., Towle K., et al. (2016). Addressing potential local adaptation in species distribution models: Implications for conservation under climate change. Ecol. Appl. 26, 1154–1169. doi: 10.1890/15-0926
Hashioka T., Yamanaka Y. (2007). Ecosystem change in the western North Pacific associated with global warming using 3D-NEMURO. Ecol. Model. 202, 95–104. doi: 10.1016/j.ecolmodel.2005.12.002
Hastings R. A., Rutterford L. A., Freer J. J., Collins R. A., Simpson S. D., Genner M. J. (2020). Climate change drives poleward increases and equatorward declines in marine species. Curr. Biol. 30, 1572–1577. doi: 10.1016/j.cub.2020.02.043
Heikkinen R. K., Luoto M., Araújo M. B., Virkkala R., Thuiller W., Sykes M. T. (2006). Methods and uncertainties in bioclimatic envelope modelling under climate change. Prog. Phys. Geogr. 30, 751–777. doi: 10.1177/0309133306071957
Hirzel A. H., Le Lay G., Helfer V., Randin C., Guisan A. (2006). Evaluating the ability of habitat suitability models to predict species presences. Ecol. Model. 199, 142–152. doi: 10.1016/j.ecolmodel.2006.05.017
Hu Z., Zhang Q., Zhang J., Kass J. M., Mammola S., Fresia P., et al. (2021). Intraspecific genetic variation matters when predicting seagrass distribution under climate change. Mol. Ecol. 30, 3840–3855. doi: 10.1111/mec.15996
Huot Y., Babin M., Bruyant F., Grob C., Twardowski M. S., Claustre H. (2007). Relationship between photosynthetic parameters and different proxies of phytoplankton biomass in the subtropical ocean. Biogeosciences 4, 853–868. doi: 10.5194/bg-4-853-2007
Ikeda D. H., Max T. L., Allan G. J., Lau M. K., Shuster S. M., Whitham T. G. (2017). Genetically informed ecological niche models improve climate change predictions. Global Change Biol. 23, 164–176. doi: 10.1111/gcb.13470
Jones M. C., Cheung W. W. L. (2014). Multi-model ensemble projections of climate change effects on global marine biodiversity. ICES J. Mar. Sci. 72, 741–752. doi: 10.1093/icesjms/fsu172
Kass J. M., Muscarella R., Galante P. J., Bohl C. L., Pinilla-Buitrago G. E., Boria R. A., et al. (2021). ENMeval 2.0: Redesigned for customizable and reproducible modeling of species’ niches and distributions. Methods Ecol. Evol. 12, 1602–1608. doi: 10.1111/2041-210X.13628
Le S., Josse J., Husson F. (2008). FactoMineR: an R package for multivariate analysis. J. Stat. Software 25, 1–18. doi: 10.18637/jss.v025.i01
Li L., Zhao L., Fu J., Sun B., Liu C. (2022). Predicting the habitat suitability for populations of Pacific cod under different climate change scenarios considering intraspecific genetic variation. Ecol. Indic. 142, 109248. doi: 10.1016/j.ecolind.2022.109248
Liu W., Li M., Huang F., Zhu J., Cui Y. (2006). Cadmium-induced changes to the activity of xanthine oxidase in liver of Boleophthalmus pectinirostris. Mar. Fisheries Res. 27, 21–25.
Liu C., White M., Newell G. (2013). Selecting thresholds for the prediction of species occurrence with presence-only data. J. Biogeogr. 40, 778–789. doi: 10.1111/jbi.12058
Lomba A., Pellissier L., Randin C., Vicente J., Moreira F., Honrado J., et al. (2010). Overcoming the rare species model-ling paradox: A novel hierarchical framework applied to an Iberian endemic plant. Biol. Conserv. 143, 2647–2657. doi: 10.1016/j.biocon.2010.07.007
Mammola S., Cardoso P. (2020). Functional diversity metrics using kernel density n-dimensional hypervolumes. Methods Ecol. Evol. 11, 986–995. doi: 10.1111/2041-210x.13424
Maurya A., Semwal M., Mishra B. P., Mohan R., Rana T. S., Nair N. K. (2023). Distribution modeling for predicting habitat suitability for citron (Citrus medica L.) under climate change scenarios. Flora 304, 152298. doi: 10.1016/j.flora.2023.152298
Melo-Merino S. M., Reyes-Bonilla H., Lira-Noriega A. (2020). Ecological niche models and species distribution models in marine environments: A literature review and spatial analysis of evidence. Ecol. Model. 415, 108837. doi: 10.1016/j.ecolmodel.2019.108837
Moss R. H., Edmonds J. A., Hibbard K. A., Manning M. R., Rose S. K., Van Vuuren D. P., et al. (2010). The next generation of scenarios for climate change research and assessment. Nature 463, 747–756. doi: 10.1038/nature08823
Murdy E. O. (1989). A taxonomic revision and cladistic analysis of the oxudercine gobies (Gobiidae: Oxudercinae). Rec. Aust. Mus. Suppl. 11, 1–93. doi: 10.3853/j.0812-7387.11.1989.93
Murray N. J., Phinn S. R., DeWitt M., Ferrari R., Johnston R., Lyons M. B., et al. (2019). The global distribution and trajectory of tidal flats. Nature 565, 222–225. doi: 10.1038/s41586-018-0805-8
Oney B., Reineking B., O’Neill G., Kreyling J. (2013). Intraspecific variation buffers projected climate change impacts on Pinus contorta. Ecol. Evol. 3, 437–449. doi: 10.1002/ece3.426
Pan Y., Tian L., Zhao Q., Tao Z., Yang J., Zhou Y., et al. (2022). Evaluation of the acute toxic effects of crude oil on intertidal mudskipper (Boleophthalmus pectinirostris) based on antioxidant enzyme activity and the integrated biomarker response. Environ. pollut. 292, 118341. doi: 10.1016/j.envpol.2021.118341
Pan C., Xiao S., Chen X., Yang C., Zeng D., Feng P., et al. (2021). The complete mitochondrial genome of the mudskipper, Boleophthalmus pectinirostris (Gobiiformes, Oxudercidae) from Beibu Bay. Mitochondrial DNA B. 6, 1337–1338. doi: 10.1080/23802359.2021.1909433
Pearman P. B., D’Amen M., Graham C. H., Thuiller W., Zimmermann N. E.. (2010). Within-taxon niche structure: niche conservatism, divergence and predicted effects of climate change. Ecography 33, 990–1003. doi: 10.1111/j.1600-0587.2010.06443.x
Peñalver-Alcázar M., Jiménez-Valverde A., Aragón P. (2021). Niche differentiation between deeply divergent phylogenetic lineages of an endemic newt: implications for Species Distribution Models. Zool. 144, 125852. doi: 10.1016/j.zool.2020.125852
Polgar G., Bartolino V. (2010). Size variation of six species of oxudercine gobies along the intertidal zone in a Malayan coastal swamp. Mar. Ecol. Prog. Ser. 409, 199–212. doi: 10.3354/meps08597
Polgar G., Crosa G. (2009). Multivariate characterisation of the habitats of seven species of Malayan mudskippers (Gobiidae: Oxudercinae). Mar. Biol. 156, 1475–1486. doi: 10.1007/s00227-009-1187-0
Rathore M. K., Sharma L. K. (2023). Efficacy of species distribution models (SDMs) for ecological realms to ascertain biological conservation and practices. Biodivers. Conserv. 32, 3053–3087. doi: 10.1007/s10531-023-02648-1
Robinson L. M., Elith J., Hobday A. J., Pearson R. G., Kendall B. E., Possingham H. P., et al. (2011). Pushing the limits in marine species distribution modelling: lessons from the land present challenges and opportunities. Global Ecol. Biogeogr. 20, 789–802. doi: 10.1111/j.1466-8238.2010.00636.x
Robinson N. M., Nelson W. A., Costello M. J., Sutherland J. E., Lundquist C. J. (2017). A systematic review of marine-based species distribution models (SDMs) with recommendations for best practice. Front. Mar. Sci. 4. doi: 10.3389/fmars.2017.00421
Salinas-Ramos V. B., Ancillotto L., Cistrone L., Nastasi C., Bosso L., Smeraldo S., et al. (2021). Artificial illumination influences niche segregation in bats. Environ. pollut. 284, 117187. doi: 10.1016/j.envpol.2021.117187
Savolainen O., Lascoux M., Merilä J. (2013). Ecological genomics of local adaptation. Nat. Rev. Genet. 14, 807–820. doi: 10.1038/nrg3522
Sperling E. A., Frieder C. A., Levin L. A. (2016). Biodiversity response to natural gradients of multiple stressors on continental margins. Proc. R. Soc B 283, 20160637. doi: 10.1098/rspb.2016.0637
Sun B., Zhao L., Shao F., Lu Z., Tian J., Liu C. (2022). Estimating the impacts of climate change on the habitat suitability of common minke whales integrating local adaptation. Front. Mar. Sci. 9. doi: 10.3389/fmars.2022.923205
Takegaki T. (2008). Threatened fishes of the world: Boleophthalmus pectinirostris (Linnaeus 1758) (Gobiidae). Environ. Biol. Fishes 81, 373–374. doi: 10.1007/s10641-007-9226-5
Thuiller W., Georges D., Gueguen M., Engler R., Breiner F. (2021). biomod2: ensemble platform for species distribution modeling. r package version 3.5.1. Available at: https://CRAN.R-project.org/package=biomod2.
Tyberghein L., Verbruggen H., Pauly K., Troupin C., Mineur F., De Clerck O. (2012). Bio-ORACLE: A global environmental dataset for marine species distribution modelling. Global Ecol. Biogeogr. 21, 272–281. doi: 10.1111/j.1466-8238.2011.00656.x
Wu H., Zhong J. (2008). Fauna sinica: ostichthyes. Perciformes. Gobioidei. V (China: Science Press).
Xu Y., Ma L., Sui J., Li X., Wang H., Zhang B. (2023). Potential impacts of climate change on the distribution of echinoderms in the Yellow Sea and East China Sea. Mar. pollut. Bull. 194, 115246. doi: 10.1016/j.marpolbul.2023.115246
Yang K. Y., Williams G. A., Lee S. Y. (2003). Selective feeding by the mudskipper (Boleophthalmus pectinirostris) on the microalgal assemblage of a tropical mudflat. Mar. Biol. 143, 245–256. doi: 10.1007/s00227-003-1067-y
Yoo J. W., Lee Y. W., Lee C. G., Kim C. S. (2013). Effective prediction of biodiversity in tidal flat habitats using an artificial neural network. Mar. Environ. Res. 83, 1–9. doi: 10.1016/j.marenvres.2012.10.001
You X., Bian C., Zan Q., Xu X., Liu X., Chen J., et al. (2014). Mudskipper genomes provide insights into the terrestrial adaptation of amphibious fishes. Nat. Commun. 5, 5594. doi: 10.1038/ncomms6594
Zhang G., Fang X., Guo X., Li L. I., Luo R., Xu F., et al. (2012). The oyster genome reveals stress adaptation and complexity of shell formation. Nature 490, 49–54. doi: 10.1038/nature11413
Zhang Z., Kass J. M., Mammola S., Koizumi I., Li X., Tanaka K., et al. (2021). Lineage-level distribution models lead to more realistic climate change predictions for a threatened crayfish. Divers. Distrib. 27, 684–695. doi: 10.1111/ddi.13225
Zhang X., Yan X. (2014). Spatiotemporal change in geographical distribution of global climate types in the context of climate warming. Climate Dyn. 43, 595–605. doi: 10.1007/s00382-013-2019-y
Zhao S. (2022). Study on the Phylogeography and Adaptive Differentiation of Boleophthalmus pectinirostris along the Coast of China. MA thesis. Zhejiang Ocean University, China.
Keywords: Boleophthalmus pectinirostris, climate change, local adaptation, niche differentiation, SDMs
Citation: Wu Z, Dong H, Li L, Zhao L and Song N (2024) Lineage-level species distribution model to assess the impact of climate change on the habitat suitability of Boleophthalmus pectinirostris. Front. Ecol. Evol. 12:1364822. doi: 10.3389/fevo.2024.1364822
Received: 08 January 2024; Accepted: 22 February 2024;
Published: 06 March 2024.
Edited by:
Hui Zhang, Chinese Academy of Sciences (CAS), ChinaReviewed by:
Jianguo Du, State Oceanic Administration, ChinaCui Liang, Chinese Academy of Sciences (CAS), China
Copyright © 2024 Wu, Dong, Li, Zhao and Song. This is an open-access article distributed under the terms of the Creative Commons Attribution License (CC BY). The use, distribution or reproduction in other forums is permitted, provided the original author(s) and the copyright owner(s) are credited and that the original publication in this journal is cited, in accordance with accepted academic practice. No use, distribution or reproduction is permitted which does not comply with these terms.
*Correspondence: Linlin Zhao, zhaolinlin@fio.org.cn; Na Song, songna624@163.com