
Abstract
The aims of this study are to predict the stock price trend in the stock market in an emerging economy. Using the Long Short Term Memory (LSTM) algorithm, and the corresponding technical analysis indicators for each stock code include: simple moving average (SMA), convergence divergence moving average (MACD), and relative strength index (RSI); and the secondary data from VN-Index and VN-30 stocks, the research results showed that the forecasting model has a high accuracy of 93% for most of the stock data used, demonstrating the appropriateness of the LSTM model and the test set data is used to evaluate the model’s performance. The research results showed that the forecasting model has a high accuracy of 93% for most of the stock data used, demonstrating the appropriateness of the LSTM model in analyzing and forecasting stock price movements on the machine learning platform.
Introduction
Predicting the future direction of stock prices has been an interest sector of researchers and investors. The factors and sources of information to be considered are varied and wide. This makes it very difficult to predict future stock market price behavior. It is evident that stock prices cannot be accurately predicted. There is quite a bit of research that seeks to address that challenge, offering a variety of approaches to achieving the goal (Appel, 2005; Brown et al., 1998; El-Nagar et al., 2022; and Fromlet, 2001).
Follow experimental research this approach, there were studied of Sen and Chaudhuri (2016) and Sen (2017) using time series decomposition to forecast stock prices and gives results with a potential accuracy. In addition, forecasting stock prices in the short term by applying machine learning and deep learning algorithms also show very high results (Sen and Chaudhuri, 2016; Sen & Datta Chaudhuri, 2018). Besides, Mehtab and Sen (2019) confirmed the strong and reliable stock price prediction ability of machine learning models, both regression and classification. Together with data from analyzing user’s emotions on social networks, using self-organizing fuzzy neural network (SOFNN) algorithm, the authors demonstrated a high degree of accuracy in predictive values of NIFTY index. In addition, the authors used an compound neural network (CNN) algorithm in forecasting for time series data, and achieved high-accuracy prediction results (Mehtab and Sen, 2020).
With recent research trends, a popular approach is to apply machine learning algorithms to learn from historical price data, thereby being able to predict future prices. The scale demonstrates predictive power on historical stock price data that outperforms other methods due to its suitability for this data type. Regressive neural networks have short-term memory and the hypothesis to be explored here is that this feature can be beneficial in terms of results when compared with more traditional methods (Nelson et al. 2017).
In particular, the LSTM algorithm (Long Short- Term Memory) confirms the stability and efficiency in short-term stock price forecasting. This is a regressive neural algorithm with suitable properties thanks to its ability to distinguish and synthesize the effects of short-term and long-term factors, by giving different weights to each parameter while skipping the memory it considers irrelevant to predict the next output. That way, the LSTM algorithm is capable of handling longer input sequences when compared to other repeating neural networks that can only memorize short sequences (Pahwa et al. 2017). LSTM is one of the most successful RNNs algorithms. LSTM introduces the memory cell, a unit of computation that replaces traditional artificial neurons in the hidden layer of the network. In addition, networks can efficiently link memories and input just-in-time, thus making it suitable for capturing time-flexible data structures with high predictability (Chen et al. 2015).
With the nature of short-term predictive analysis based on time series data, the combination of machine learning and technical analysis in forecasting stock prices in the short term is widely applied. Further, a few studies suggest stock price technical analysis patterns where the goal is to detect stock volatility patterns that lead to returns for investors. For this purpose, different stock price and technical analysis indicators have been proposed, such as Bollinger Band, moving average convergence divergence (MACD), relative strength index (RSI)), moving average (MA), stochastic momentum (MS), meta sine wave (MSW). In addition to these indicators, some well-known patterns in stock price movements, such as head and shoulders, triangle, flag, Fibonacci fan, Andrew’s pitchfork, etc., are also considered as one of the important indicators for investing in the stock market (Nelson et al. 2017; Borovkova and Tsiamas, 2019). These approaches provide more effectiveness for potential investors in making investment decisions.
Another possibility, a time-series can be studied by many techniques, possibly using the DID (difference in difference) method as discussed in the study of Trinh et al. (2021), or you can use other methods such as the non-linear autoregressive distributed lag of Le et al. (2022). However, LSTM model is more appropriate in short-term stock price forecasting in the field of machine learning. In addition, this method has not been widely used in the Vietnamese market. Furthermore, Vietnam’s stock market was established in 2000, but it has developed rapidly and has a market capitalization of 82.15% of GDP. Of which, the number of accounts is up to 6.98 million for domestic investors, and 38,897 for foreign investors (Hoang, 2023). Therefore, predicting stock prices is the goal and need of investors to help them have a more effective investment portfolio. Moreover, according to the author’s review of previous studies, there are currently no studies testing the effectiveness of the LSTM model in combination with technical analysis indicators in the Vietnamese market. Therefore, the objective of this study is to evaluate the applicability of cyclic neural networks, especially LSTM networks combined with technical analysis indicators, to the problem of price volatility prediction stocks on the market. Evaluate their performance in terms of accuracy and other metrics through tests on VNindex data and VN30 stock group.
The remainder of the study can be divided as follows: Section “Theoretical basis” discusses the theoretical basis, while Section “Data collection and research Methodology” is for Data collection and research Methodology. In addition, Section “Research results and discussions” discusses the research results and discussions. Finally, Section “Conclusions” depicts the conclusions.
Theoretical basis
Foundation theory
When discussing the stock market, with its inherent and complexity, the predictability of stock returns has always been a subject of debate that attracts much research. Fama (1970) postulates the efficient market hypothesis that determines that the current price of an asset always reflects all prior information available to it immediately. In addition, the random walk hypothesis states that a stock’s price changes independently of its history, in other words, tomorrow’s price will depend only on tomorrow’s information regardless of today’s price (Burton, 2018). These two hypotheses establish that there is no means of accurately predicting stock prices.
On the other hand, there are other authors who argue that, in fact, stock prices can be predicted at least to some extent. And a variety of methods for predicting and modeling stock behavior have been the subject of research in many different disciplines, such as economics, statistics, physics, and computer science (Lo and MacKinlay, 1999).
Technical analysis indicator
A popular method for modeling and predicting the stock market is technical analysis, which is a method based on historical data from the market, primarily price and volume. Quantity. Technical analysis follows several assumptions: (1) prices are determined exclusively by supply and demand relationships; (2) prices change with the trend; (3) changes in supply and demand cause the trend to reverse; (4) changes in supply and demand can be identified on the chart; And (5) the patterns on the chart tend to repeat. In other words, technical analysis does not take into account any external factors such as political, social or macroeconomic (Kirkpatrick & Dahlquist, 2010). Research by Biondo et al. (2013) shows that short-term trading strategies based on technical analysis indicators can work better than some traditional methods, such as the moving average convergence divergence (MACD) and the relative strength index (RSI).
Technical analysis is a well method of forecasting future market trends by generating buy or sell signals based on specific information obtained from those prices. The popularity and continued application of technical analysis has become widely recognized with techniques for uncovering any hidden pattern ranging from the very rudimentary analysis of the moving averages to the recognition of rather complex time series patterns. Brock et al. (1992) show that simple trading rules based on the movement of short-term and long-term moving average returns have significant predictive power with daily data for more than a century on the Dow Jones Industrial Average. Fifield et al. (2005) went on to investigate the predictive power of the ‘filter’ rule and the ‘moving average oscillator’ rule in 11 European stock markets, including covering the period from January 1991 to December 2000. Their key findings indicate that four emerging markets: Greece, Hungary, Portugal and Turkey, are information inefficient, compared with seven more advanced other markets. Past empirical results support technical analysis (Fifield et al. 2005); however, such evidence can be criticized because of data bias (Brock et al. 1992).
Long short term memory LSTM algorithm
Elman (1990) proposed a Recurrent Neural Network (RNN). Basically, RNN solves the problem of processing sequence data, such as text, voice, and video. There is a sequential relationship between samples of this data type and each sample is associated with its previous sample. For example, in text, a word is related to the word that precedes it. In meteorological data, the temperature of one day is combined with the temperature of the previous few days. A set of observations is defined as a sequence from which multiple sequences can be observed. This feature of the RNN algorithm is very suitable for the properties of time series data in stock analysis as the Fig. 1:

Source: Lai et al. (2019).
Figure 1 shows the structure of an RNN, in which the output of the hidden layer is stored in memory. Memory can be thought of as another input. The main reason for the difficulty of RNN training is the passing of the hidden layer parameter ω. Since the error propagation on the RNN is not handled, the value of ω multiplies during both forward and reverse propagation. (1) The problem of Gradient Vanishing is that when the gradient is small, increasing exponentially, it has almost no effect on the output. (2) Gradient Exploding problem: conversely, if the gradient is large, multiplying exponentially leads to gradient explosion. Of course, this problem exists in any deep neural network, but it is especially evident due to the recursive structure of the RNN. Further, RNNs differ from traditional relay networks in that they not only have neural connections in one direction, in other words, neurons can transmit data to a previous layer or same class. Not storing information in a single direction, this is a practical feature of the existence of short-term memory, in addition to the long-term memory that neural networks have acquired through training.
The Long Short Term Memory (LSTM) algorithm introduced by the research of Hochreiter and Schmidhuber (1997) aims to provide better performance by solving the Gradient Vanishing problem that repeated networks will suffer when dealing with long strings of data. In LSTM, each neuron is a “memory cell” that connects previous information to the current task. An LSTM network is a special type of RNN. The LSTM can capture the error, so that it can be moved back through the layers over time. LSTM keeps the error at a certain maximum constant, so the LSTM network can take a long time to train, and opens the door to setting the correction of parameters in the algorithm (Liu et al. 2018). The LSTM is a special network topology with three “gateway” structures (shown in Fig. 2). Three ports are placed in an LSTM unit, which are called input, forget, and output ports. While the information enters the network of the LSTM, it can be selected according to the rules. Only information that matches the algorithm will be forwarded, and information that does not match will be forgotten through the forget gate.
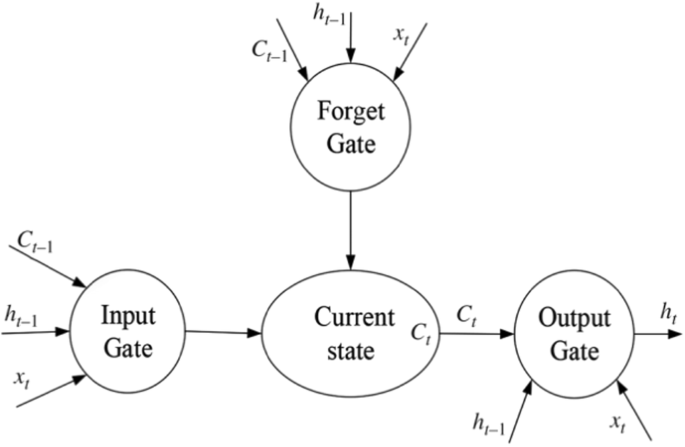
Source: Ding et al. (2015).
This gate-based architecture allows information to be selectively forwarded to the next unit based on the principle of the activation function of the LSTM network. LSTM networks are widely used and achieved some positive results when compared with other methods (Graves, 2012), especially in terms of Natural Language Processing, and especially for handwriting recognition (Graves et al. 2008). The LSTM algorithm has branched out into a number of variations, but when compared to the original they do not seem to have made any significant improvements to date (Greff et al. 2016).
Experimental study
Data on the stock market is very large and non-linear in nature. To model this type of data, it is necessary to use models that can analyze the patterns on the chart. Deep learning algorithms are capable of identifying and exploiting information hidden within data through the process of self-learning. Unlike other algorithms, deep learning models can model this type of data efficiently (Agrawal et al. 2019).
The research studies analyzing financial time series data using neural network models using many different types of input variables to predict stock returns. In some studies, the input data used to build the model includes only a single time series (Jia, 2016). Some other studies include both indicators showing market information and macroeconomic variables (White, 1988). In addition, there are many different variations in the application of neural network models to time series data analysis: Ding et al. (2015) combine financial time series analysis and processing natural language data, Roman and Jameel (1996) and Heaton et al. (2016) use deep learning architecture to model multivariable financial time series. The study of Chan et al. (2000) introduces a neural network model using technical analysis variables that has been performed to predict the Shanghai stock market, compared the performance of two algorithms and two different weight initialization methods. The results show that the efficiency of back-propagation can be increased by learning the conjugate gradient with multiple linear regression weight initializations.
With the suitable and high-performance nature of the regression neural network (RNN) model, a lot of research has been done on the application of RNN in the field of stock analysis and forecasting. Roman and Jameel (1996) used back-to-back models and RNNs to predict stock indexes for five different stock markets. Saad, Prokhorov, and Wunsch (1998) apply delay time, recurrence, and probability neural network models to predict stock data by day. Hegazy et al. (2014) applied machine learning algorithms such as PSO and LS-SVM to forecast the S&P 500 stock market. With the advent of LSTM, data analysis became dependent on time becomes more efficient. The LSTM algorithm has the ability to store historical information and is widely used in stock price prediction (Heaton et al. 2016).
For stock price prediction, LSTM network performance has been greatly appreciated when combined with NLP, which uses news text data as input to predict price trends. In addition, there are also a number of studies that use price data to predict price movements (Chen et al. 2015), using historical price data in addition to stock indices to predict whether stock prices will increase, decrease or stay the same during the day (Di Persio and Honchar, 2016), or compare the performance of the LSTM with its own proposed method based on a combination of different algorithms (Pahwa et al. 2017).
Zhuge et al. (2017) combine LSTM with Naiev Bayes method to extract market emotional factors to improve predictive performance. This method can be used to predict financial markets on completely different time scales from other variables. The sentiment analysis model is integrated with the LSTM time series model to predict the stock’s opening price and the results show that this model can improve the prediction accuracy.
Jia (2016) discussed the effectiveness of LSTM in stock price prediction research and showed that LSTM is an effective method to predict stock returns. The real-time wavelet transform was combined with the LSTM network to predict the East Asian stock index, which corrected some logic defects in previous studies. Compared with the model using only LSTM, the combined model can greatly improve the prediction degree and the regression error is small. In addition, Gülmez (2023) believed that the LSTM model is suitable for time series data on financial markets in the context of stock prices established on supply and demand relationships. Researching on the Down Jones stock index, which is a market for stocks, bonds and other securities in USA, the authors also did the stock forecasts for the period 2019 to 2023. Another research by Usmani Shamsi (2023) on Pakistan stock market research on general market, industry and stock related news categories and its influence on stock price forecast. This confirms that the LSTM model is being used more widely in stock price forecasting recently.
Data collection and research methodology
Data collection
The research apply LSTM algorithm and technical analysis indicators to forecast price trends on the Vietnamese stock market. To accomplish the above research objective, the authors used research data, including price history of VN-Index and stocks in group VN-30, collected from secondary data sources at website vietstock.vn. The specific list of stocks to be collected is as follows:
Table 1 shows that the study selected 31 enterprises and all are currently large enterprises, mainly in the VN-30 group. On the Vietnamese stock market, VN-30 is a group of 30 securities with large market capitalization and high liquidity, and is a typical representative of the stock market (here representing VN-Index). In addition, the time to collect historical price data starts from the time the shares are listed on the stock exchange to April 1, 2021. This period is closely related to the impact of the pandemic, so this study conducts a forecast assessment in the impact of the pandemic. Further, the price history data length of the stocks will be different because these stocks have different listing start dates. The classification method is used according to the GICS classification system standard.
Data is initially collected below, including the following indexes: closing price, opening price, highest price, lowest price and trading volume corresponding to each trading session of the stocks in the list. This historical price data is processed through the following specific steps:
-
Step 1: check the data, handle the defects of the data such as: empty data, data deviation. Instances with defective data will be checked and supplemented.
-
Step 2: Calculate the corresponding technical analysis indicators for each stock, including: simple moving average (SMA), convergence divergence moving average (MACD), and relative strength index (RSI).
-
Step 3: Historical price data is aggregated with the corresponding technical analysis indicator, observations that lack data due to differences in the calculation process of technical analysis indicators will be eliminated.
-
Step 4: Aggregate data including price history and technical analysis indicators are used as input data for the Long Short Term Memory (LSTM) model to make stock price forecasts.
The author uses Microsoft Office Excel software and Python language to calculate technical analysis indicators, process and analyze data. The Long Short Term Memory (LSTM) model is built on the basis of the Sklearn, Keras and Tensorflow support libraries.
Research methodology
This study uses the Model of Long Short Term Memory (LSTM). In addition, the data is divided into two separate sets: training and testing. The training set includes data from the listing start date to December 31, 2020, the test set includes data from January 1, 2021 to April 1, 2021. The training set data is used to LSTM model and the test set data is used to evaluate the model’s performance. The data in the training and testing sets are completely independent, to ensure objectivity in the process of evaluating the performance of the model.
The advantage of the LSTM method can be confirmed that this method is processed on daily data, so it is possible to measure daily stock price fluctuations, and at the same time study can control the accuracy of analysis through the accuracy of the model’s prediction.
Authors used the step coefficient of the LSTM model as 60. That is, the LSTM model will use the data of the previous 60 days to forecast the stock price at the next day. Accordingly, the LSTM model is built with a structure of 4 layers including the following specific coefficients:
-
Layer 1: units = 30, activation = ‘relu’, Dropout(0.1), input shape corresponding to the specific data size of each stock code
-
Layer 2: units = 40, activation = ‘relu’, Dropout(0.1)
-
Layer 3: units = 50, activation = ‘relu’, Dropout(0.1)
-
Layer 4: units = 60, activation = ‘relu’, Dropout(0.1)
The model is built on the specific Python language platform in the Fig. 3 as follows:

Source: The authors’ analysis.
Figure 3 indicates that the model is compiled with the following specific coefficients: optimizer = ‘adam’, loss = ‘mean_squared_error’. Next, fit the model with the following coefficients: epochs = 1000, batch_size = 32. That is, the model will loop 1000 times to correct the coefficient of fit. However, in order to reduce computational complexity and ensure feasibility in model building, the author uses EarlyStopping with the following coefficients: monitor = ‘loss’, patience = 8, restore_best_weights = True.
After building the LSTM model with the training set data, the LSTM model will forecast stock prices for the corresponding observations of the test set, that is, the trading sessions from January 1, 2021 until April 1, 2021. The stock price forecasted from the model will be compared with the actual stock price of the respective trading session. The accuracy of the model’s prediction is evaluated based on the following formula:
Where: Aj: the accuracy of the model’s forecast for share j; Vij: actual closing price of share j at the ith trading session in the test set; Pij: forecast result for the price of stock j at the ith trading session in the test set; n: number of sessions in the test set.
The prediction accuracy of the LSTM model will be compared with the baseline value of 93%. According to the trading regulations on the Ho Chi Minh City Stock Exchange, Vietnam, the maximum fluctuation range of stock prices in one trading session is 7%. Thus, if making a stock price forecast by the simplest method that today’s price will be equal to yesterday’s price (i.e., there is no change in stock price), then the degree of error is 7%. Thus, the baseline value of forecast accuracy is 93%. If the model’s accuracy level is below 93%, the model is not efficient.
Research results and discussions
When apply LSTM algorithm and technical analysis indicators to forecast price trends on the Vietnamese stock market. In this section, authors will present the results of the data after performing the analysis according to the research process and method, as well as make comments and discuss the research results.
Figure 4 shows the list of stocks in the VN-30 group has mainly in the industry groups: finance, construction and manufacturing. Figure 4 indicates that companies in these industry groups have high corporate capitalization, which is why many companies in these industry groups appear in the list of stocks selected for the study.

Source: The authors’ analysis.
The LSTM model predicts stock prices corresponding to the trading sessions in the test set. The test set data length includes observations from January 1, 2021 to April 1, 2021. Thus, there are all 78 trading sessions observed in the test set. For each different stock ticker, the forecast performance of the built model is also different. Figure 5 shows the forecast results of the LSTM model for the VN-Index on the data set.

Source: The authors’ analysis.
It can be seen that the price forecast from the LSTM model tends to be very similar to the variation trend of the actual price on the data of the test set. In addition, the difference between the forecast price and the actual price is not significant. Note that for each data of different stocks, the accuracy of the LSTM model’s forecast will have a difference, a specific comparison chart between the forecast price and the actual price of all stocks. Stock codes carried out in the study are presented in the appendix.
Figure 6 shows the level of accuracy in stock price forecast on the test set of the LSTM model corresponding to each stock in the research list. The red horizontal line represents the baseline at 93%. It can be seen that the LSTM model achieves a forecast accuracy higher than 93% for most of the stocks used in the study.

Source: The authors’ analysis.
In which, stock ticker PNJ achieved the highest forecast accuracy at 97.7% (see Fig. 7), followed by stocks like MSN and TPB also reaching approximately 97% as shown in Fig. 8, and Fig. 9. The results of other stocks as BID (see Fig. 10), BVH (see Fig. 11), CTG (see Fig. 12), GAS (see Fig. 13), HDB (see Fig. 14), HPG (see Fig. 15), KDH (see Fig. 16), MBB (see Fig. 17), MWG (see Fig. 18), PDR (see Fig. 19), REE (see Fig. 20) SBT (see Fig. 21), SSI (see Fig. 22), STB (see Fig. 23), TCB (see Fig. 24), VIC (see Fig. 25), VJC (see Fig. 26), VNM (see Fig. 27), VCB (see Fig. 28), VHM (see Fig. 29) achieved the lower forecast accuracy. To illustrate more clearly the case with the highest accurate forecast of PNJ, let’s look at the comparison chart between the forecast price of the LSTM model and the actual price of PNJ on the data of the test set in Fig. 7 as follows:

Source: The authors’ analysis.

Source: The authors’ analysis.

Source: The authors’ analysis.

Source: The authors’ analysis.

Source: The authors’ analysis.

Source: The authors’ analysis.

Source: The authors’ analysis.

Source: The authors’ analysis.

Source: The authors’ analysis.

Source: The authors’ analysis.

Source: The authors’ analysis.

Source: The authors’ analysis.

Source: The authors’ analysis.

Source: The authors’ analysis.

Source: The authors’ analysis.

Source: The authors’ analysis.

Source: The authors’ analysis.

Source: The authors’ analysis.

Source: The authors’ analysis.

Source: The authors’ analysis.

Source: The authors’ analysis.

Source: The authors’ analysis.

Source: The authors’ analysis.
The forecast results of the LSTM model with the stock ticker data of PNJ have a very high similarity between the forecast price and the actual price on the test set, with almost no difference. This explains the very high coefficient of predictive accuracy of the LSTM model for PNJ.
However, the LSTM model still gave forecast results with an accuracy not as high as 78.9% for NVL, 86.8% for TCH and approximately 89% for FPT, PLX, POW, VPB and VRE (see Figs. 30–36). A closer look at the case of achieving the lowest forecast result at 78.9% for NVL in Fig. 30 is as follows:

Source: The authors’ analysis.

Source: The authors’ analysis.

Source: The authors’ analysis.

Source: The authors’ analysis.

Source: The authors’ analysis.

Source: The authors’ analysis.

Source: The authors’ analysis.
The prediction results of the LSTM model for the NVL code have relatively uniform results in the first period (about the first 20 observations) of the test set. However, at the next stage, there is a significant difference between the forecast results and the actual data in the test set. This leads to the result that the summary prediction for NVL code on the test set is not good. Similar results for a number of other not-so-high forecast codes such as TCH, FPT, PLX, POW, VPB and VRE. The chart comparing forecast and actual prices of these stocks is presented in detail in Fig. 31–36.
The high predictive accuracy for most of the stock data used demonstrates the suitability of the LSTM model in analyzing and forecasting stock price movements. This conclusion is consistent with the studies of Sen and Chaudhuri (2016), Sen (2017), Sen and Chaudhuri (2016) and Mehtab and Sen (2019). In addition, the study uses a combination of price history and technical analysis indicators to build an LSTM model. This also confirms the potential of technical analysis indicators in forecasting stock price movements. At the same time, it shows the compatibility and mutual support when combining technical analysis and financial data analysis models on a machine learning platform, specifically the LSTM algorithm in this study.
LSTM algorithm and technical analysis indicators to forecast price trends in Vietnam’s stock market, adding conclusions about forecasting performance and application level of LSTM. LSTM model for analyzing and forecasting stock price trends in Vietnam’s stock market in terms of both academic and practical applications. Further studies can use the conclusions from this study to reference and compare, evaluate the results, and supplement the robustness of the academic conclusions. Moreover, the research and application of real and updated stock market data has high practical applicability. The conclusions from this study can be widely applied by investors, financial institutions, and government market regulators.
Conclusions
Research with the aim of evaluating the application of LSTM algorithm and technical analysis indicators to forecast price trends on the Vietnamese stock market, using historical price data of the VN-Index and stocks of VN-30 group, combined with technical analysis indicators to build a Long Short Term Memory model. The forecast results of the LSTM model show a good predictive level for most data of the stocks studied. With the characteristics of the structure and analytical method, the LSTM model is evaluated and highly suitable for time series data such as stock price history. Therefore, the application of the LSTM algorithm to analyze and forecast stock prices is considered appropriate, the results of this study are also consistent with the above conclusions. However, the machine learning algorithms that have been developed strongly in recent times have many applications in the financial field, specifically a few popular algorithms applied in the financial field such as Random Forest, Support Vector Machine. These algorithms also have great potential for application to the topic of stock price analysis and forecasting. Further studies on this topic may consider using other machine learning algorithms in analysis and research.
A common trend in the application of machine learning algorithms to economic (or more specifically financial) problems is to combine many different machine learning algorithms to create a model with a degree of higher complexity but potentially higher performance. Combining various machine learning algorithms can complement and enhance the predictive performance of the model. This study only applies a single machine learning algorithm (that is, the LSTM algorithm). However, the extended research direction of this topic can consider combining many machine learning algorithms to improve the predictive performance of the model.
In addition, the data used in the study included only structured, arithmetical data types. With the trend of applying data analysis methods in the direction of machine learning, unstructured data such as data in the form of text, audio, images, etc., demonstrate the feasibility of analytical applications in Vietnam. This is also a potential source of data for in-depth financial analysis that has not been used so far. Extensive research directions on the topic of stock price assessment and forecasting by applying machine learning algorithms can consider using unstructured data types to explore this potential data area. However, due to the influence of objective limitations, this study still has certain limitations. The data used in the study is limited to the stock market of Ho Chi Minh City (VN-Index). Therefore, the research still has some limitations that make forecasting difficult, especially in the case of strong fluctuations in stock prices. The reason is originally from the internal issues in the stock market. Specifically, the shares are still small, so stock prices do not really follow the relationship between supply and demand. Recently, Vietnam has also encountered some problems about market manipulation and legal risks in the stock market. Further studies may expand the database, using data from other stock exchanges in Vietnam to enhance the certainty of the model’s performance evaluation and forecast.
Data availability
The datasets used and/or analyzed are available from the author upon reasonable request. All data are available on the https://zenodo.org/uploads/10418013.
References
Agrawal M, Khan AU, Shukla PK (2019) Stock price prediction using technical indicators: A predictive model using optimal deep learning. Int J Recent Technol Eng 8(2):2297–2305
Appel, G (2005) Technical analysis: power tools for active investors: FT Press
Biondo AE, Pluchino A, Rapisarda A, Helbing D (2013) Are random trading strategies more successful than technical ones? PloS one 8(7):e68344
Borovkova S, Tsiamas I (2019) An ensemble of LSTM neural networks for high-frequency stock market classification. J Forecast 38(6):600–619
Brock W, Lakonishok J, LeBaron B (1992) Simple technical trading rules and the stochastic properties of stock returns. J Financ 47(5):1731–1764
Brown SJ, Goetzmann WN, Kumar A (1998) The Dow theory: William Peter Hamilton’s track record reconsidered. J Financ 53(4):1311–1333
Burton, N (2018.) An Analysis of Burton G. Malkiel’s A Random Walk Down Wall Street, 1st edition, ISBN 9781912128822, routledge. Available at https://www.routledge.com/An-Analysis-of-Burton-G-Malkiels-A-Random-Walk-Down-Wall-Street/Burton/p/book/9781912128822, accessed on 30th Oct, 2023
Chan, MC, Wong, CC, & Lam, CC (2000) Financial time series forecasting by neural network using conjugate gradient learning algorithm and multiple linear regression weight initialization. Available at https://citeseerx.ist.psu.edu/document?repid=rep1&type=pdf&doi=5853eb9035a62449c39f213768a60603352bcf05, accessed on 30th Oct, 2023
Chen, K, Zhou, Y, & Dai, F (2015) A LSTM-based method for stock returns prediction: A case study of China stock market. 2015 IEEE International Conference on Big Data (Big Data), 2823–2824. https://doi.org/10.1109/BigData.2015.7364089
Di Persio L, Honchar O (2016) Artificial neural networks approach to the forecast of stock market price movements. Int J Econ Manag Syst 1:158–162
Ding, X, Zhang, Y, Liu, T, & Duan, J (2015) Deep learning for event-driven stock prediction. Proceedings of the Twenty-Fourth International Joint Conference on Artificial Intelligence (IJCAI 2015), 2327- 2333. Available at https://www.ijcai.org/Proceedings/15/Papers/329.pdf, accessed on 30th Oct, 2023
Elman JL (1990) Finding structures in time. Cogn Sci 14(2):179–211
El-Nagar AM, Zaki AM, Soliman FAS, El-Bardini M (2022) Hybrid deep learning diagonal recurrent neural network controller for nonlinear systems. Neural Comput Appl 34(24):22367–22386. https://doi.org/10.1007/s00521-022-07673-9
Fama EF (1970) Efficient Capital Markets: A Review of Theory and Empirical Work. J Financ 25(2):383–417. https://doi.org/10.2307/2325486
Fifield SG, Power DM, Donald Sinclair C (2005) An analysis of trading strategies in eleven European stock markets. Eur J Financ 11(6):531–548
Fromlet, H (2001) Behavioral finance-theory and practical application: Systematic analysis of departures from the homo oeconomicus paradigm are essential for realistic financial research and analysis. Business Economics, 63–69
Graves A, Liwicki M, Fernández S, Bertolami R, Bunke H, Schmidhuber J (2008) A novel connectionist system for unconstrained handwriting recognition. IEEE Trans pattern Anal Mach Intell 31(5):855–868
Graves, A (2012) Supervised sequence labeling. In Supervised sequence labeling with recurrent neural networks (pp. 5-13): Springer
Greff K, Srivastava RK, Koutník J, Steunebrink BR, Schmidhuber J (2016) LSTM: A search space odyssey. IEEE Trans neural Netw Learn Syst 28(10):2222–2232
Gülmez B (2023) Stock price prediction with optimized deep LSTM network with artificial rabbits optimization algorithm. Expert Syst Appl 227:120346. https://doi.org/10.1016/j.eswa.2023.120346
Heaton JB, Polson N, Witte J (2016) Deep Learning for Finance: Deep Portfolios. Appl Stoch Models Bus Ind 33(1):3–12
Hegazy O, Soliman OS, Salam MA (2014) A machine learning model for stock market prediction. Int J Comput Sci Telecommun 4(12):17–23
Hoang, M (2023) Vietnam’s stock market capitalization is equivalent to 82% of GDP. Available at https://tapchitaichinh.vn/von-hoa-thi-truong-chung-khoan-viet-nam-tuong-duong-82-gdp.html, accessed on 30th Oct, 2023
Hochreiter S, Schmidhuber J (1997) Long Short-Term Memory. Neural Comput 9:1735–1780. https://doi.org/10.1162/neco.1997.9.8.1735
Jia, H (2016) Investigation into the effectiveness of long short term memory networks for stock price prediction. Retrieved from https://ui.adsabs.harvard.edu/abs/2016arXiv160307893J/abstract, accessed on 1st Nov 2023
Kirkpatrick CD, Dahlquist JR (2010) Technical Analysis: The Complete Resource for Financial Market Technicians. 2 Edn, FT Press, 2010
Lai, CY, Chen, RC, & Caraka, RE (2019) Prediction Stock Price Based on Different Index Factors Using LSTM. 2019 International Conference on Machine Learning and Cybernetics (ICMLC), 1-6
Le TTH, Nguyen VC, Phan THN (2022) Foreign Direct Investment, Environmental Pollution and Economic Growth—An Insight from Non-Linear ARDL Co-Integration Approach. Sustainability 14(13):8146. https://doi.org/10.3390/su14138146. Retrieved from
Liu S, Graham SL, Schulz A, Kalloniatis M, Zangerl B, Cai W, Gao Y, Chua B, Arvind H, Grigg J, Chu D, Klistorner A, You Y (2018) A Deep Learning-Based Algorithm Identifies Glaucomatous Discs Using Monoscopic Fundus Photographs. Ophthalmol Glaucoma 1(1):15–22
Lo, AW, & MacKinlay, AC (1999) A Non-Random Walk Down Wall Street. Princeton University Press. http://www.jstor.org/stable/j.ctt7tccx
Mehtab S, Sen J (2020) Stock Price Prediction Using Convolutional Neural Networks on a Multivariate Time Series. Proceedings of the 3rd National Conference on Machine Learning and Artificial Intelligence. New Delhi, INDIA, https://ssrn.com/abstract=3665363
Mehtab, S, Sen, J (2019) A Robust Predictive Model for Stock Price Prediction Using Deep Learning and Natural Language Processing. Available at SSRN: https://ssrn.com/abstract=3502624
Nelson, DM, Pereira, AC, & de Oliveira, RA (2017) Stock market’s price movement prediction with LSTM neural networks. Paper presented at the 2017 International joint conference on neural networks (IJCNN)
Pahwa N, Khalfay N, Soni V, Vora D (2017) Stock prediction using machine learning a review paper. Int J Computer Appl 163(5):36–43
Roman J, Jameel A (1996) Backpropagation and recurrent neural networks in financial analysis of multiple stock market returns. Proc HICSS-29: 29th Hawaii Int Conf Syst Sci 2:454–460 vol.2. https://doi.org/10.1109/HICSS.1996.495431
Saad E, Prokhorov E, Wunsch D (1998) Comparative Study of Stock Trend Prediction Using Time Delay, Recurrent and Probabilistic Neural Networks. IEEE Trans Neural Netw 9:1456–1470. https://doi.org/10.1109/72.728395
Sen J (2017) A Robust Analysis and Forecasting Framework for the Indian Mid Cap Sector Using Times Series Decomposition Approach. J Insurance Financ Manag 3(4):1–32
Sen J, Datta Chaudhuri D (2018) Understanding the sectors of Indian economy for portfolio choice. Int J Bus Forecast Market Intel 4(2):178–222.https://doi.org/10.1504/IJBFMI.2018.090914
Sen J, Chaudhuri TD (2016) An alternative framework for time series decomposition and forecasting and its relevance for portfolio choice: a comparative study of the Indian consumer durable and small cap sectors. J Econ Libr 3(2):303–326
Trinh HH, Nguyen CP, Hao W, Wongchoti U (2021) Does stock liquidity affect bankruptcy risk? DID analysis from Vietnam. Pac-Basin Financ J 69:101634. https://doi.org/10.1016/j.pacfin.2021.101634
Usmani S, Shamsi JA (2023) LSTM based stock prediction using weighted and categorized financial news. PLoS ONE 18(3):e0282234
White (1988) Economic prediction using neural networks: the case of IBM daily stock returns. IEEE 1988 Int Conf Neural Netw 2:451–458. https://doi.org/10.1109/ICNN.1988.23959
Zhuge Q, Xu L, Zhang G (2017) LSTM Neural Network with Emotional Analysis for prediction of stock price. Eng Lett 25(2):25–32
Author information
Authors and Affiliations
Contributions
Conceptualization: TP, PTKA, PHT, NCV; Methodology: TP, PTK.A, PHT, NCV; Format analysis and investigation: TP, PTK.A, PHT, NCV; Writing- review and editing: TP, P.T.K.A, PHT, NCV; Resources: TP; Supervision: NCV.
Corresponding author
Ethics declarations
Competing interests
The authors declare no competing interests
Ethical approval
Ethical approval is not required by our universities. Ethical approval was therefore not provided.
Informed consent
This article does not contain any studies with human participants performed by any of the authors.
Additional information
Publisher’s note Springer Nature remains neutral with regard to jurisdictional claims in published maps and institutional affiliations.
Rights and permissions
Open Access This article is licensed under a Creative Commons Attribution 4.0 International License, which permits use, sharing, adaptation, distribution and reproduction in any medium or format, as long as you give appropriate credit to the original author(s) and the source, provide a link to the Creative Commons licence, and indicate if changes were made. The images or other third party material in this article are included in the article’s Creative Commons licence, unless indicated otherwise in a credit line to the material. If material is not included in the article’s Creative Commons licence and your intended use is not permitted by statutory regulation or exceeds the permitted use, you will need to obtain permission directly from the copyright holder. To view a copy of this licence, visit http://creativecommons.org/licenses/by/4.0/.
About this article

Cite this article
Phuoc, T., Anh, P.T.K., Tam, P.H. et al. Applying machine learning algorithms to predict the stock price trend in the stock market – The case of Vietnam. Humanit Soc Sci Commun 11, 393 (2024). https://doi.org/10.1057/s41599-024-02807-x
Received:
Accepted:
Published:
DOI: https://doi.org/10.1057/s41599-024-02807-x
