Evaluation of ecological carrying capacity and construction of ecological security pattern in West Liaohe River Basin of China
 Ying Zheng
 Pengcheng Tang1,2
  Lei Dong
 Zhenyu Yao
- 1Yinshanbeilu Grassland Eco-hydrology National Observation and Research Station, China Institute of Water Resources and Hydropower Research, Beijing, China
- 2Department of Water Resources for Pastoral Areas, China Institute of Water Resources and Hydropower Research, Hohhot, China
The West Liaohe River Basin (WRLB) is a typical agro-pastoral interlaced zone in Northeast China where excessive economic development activities brought great pressure on the ecosystem and caused a series of ecological problems, having a negative effect on regional ecological carrying capacity (ECC). The rational construction of ecological security pattern (ESP) is an effective way to improve regional ECC and alleviate the contradiction between ecological protection and economic development. In this study, taking the WLRB as an example, spatiotemporal changes of ECC in the WLRB from 2000 to 2020 were explored by using spatial principal component analysis (SPCA). Furthermore, ecological sources were determined by coupling ECC evaluation results with important ecological patches such as natural protected areas, and the minimum cumulative resistance (MCR) model combined with the circuit theory method were employed to identify ecological security zoning, ecological corridors and key ecological nodes. Then a comprehensive ESP of the basin was constructed. The results show as follows: 1) The ECC of the overall WLRB was at medium carrying level, yet was spatially differentiated, which decreased from the periphery to the center of the basin in general. ECC showed a fluctuating upward trend from 2000 to 2020. 2) The ecological source area of the WLRB was 21926.91 km², accounting for 17.33% of the total study area. The ecological sources were seriously fragmentated and mainly distributed in the mountain area. The area of ecological conservation zone, optimized buffer zone, ecological transition zone, ecological prevention and control zone were 55672.69 km², 32662.24 km², 23862.84 km² and 12021.04 km², accounting for 44.82%, 26.29%, 19.21% and 9.68%, respectively. We also extracted 95 ecological corridors (with a total length of 3130.97 km), 49 ecological pinch points (with a total area of 200.33 km²) and 30 ecological barrier points (with a total area of 318.30 km²), constituting a “points-lines-planes” comprehensive ecological security pattern. This research can provide scientific reference for the protection and restoration of ecological environment and regional sustainable development.
1 Introduction
The negative impact of high-intensity economic development on the ecological environment continues to intensify, the carrying capacity of ecosystems in many regions has even exceeded the limits of affordability (Kowe et al., 2020; Chen et al., 2021). A variety of ecological problems has subsequently occurred, such as landscape fragmentation, soil erosion, forest and grass degradation, and biodiversity decline, which seriously threaten regional ecological security and sustainable development (Wang et al., 2018, 2021; Wang et al., 2022). At present, restoring and protecting the damaged ecosystems, achieving a dynamic balance between socio-economic development demand and ecological protection have become an international consensus (Qiu et al., 2021; Lyu et al., 2022). Ecological carrying capacity (ECC) reflects the ability of social and economic sustainable development under the condition of ensuring reasonable exploitation of natural resources and virtuous circulation of ecological environment in essence (Wei et al., 2020; Wang et al., 2022). Scientific evaluation of ECC plays an important role in improving carrying capacity of ecosystems and coordinating the relationship between protection and development (Yang et al., 2022). The construct ecological security pattern (ESP) construction is a specific measure taken to achieve various ecological protection goal, which provides an efficient spatial planning approach to improve ecological carrying capacity and alleviate the contradiction between ecological protection and economic development (Cao et al., 2022; Ding et al., 2022). Therefore, it is necessary to construct ESP based on ECC assessment, which is of great significance for restoring and protecting the ecosystem, improving regional ECC, and promoting regional sustainable and healthy development of social-economic-ecological complex systems (Fu et al., 2020; Qiao et al., 2023).
ECC is defined as the self-maintenance and self-regulation abilities of a specific ecosystem, the ability of resource supply and environment accommodation and the socio-economic pressures that can be supported (Gao, 2001). The research of ECC has experienced the expansion from single factor carrying capacity in the early stage to multi-level and multi-factor including resources, environment, society and economy. The common evaluation methods for ECC include human net primary productivity estimation method (Sjafrie et al., 2018), ecological footprint (Świąder et al., 2020), state space method (Tang et al., 2016), system model method (Fang et al., 2021), and spatial evaluation method (Zhu et al., 2022). Among them, the spatial evaluation method is to apply remote sensing (RS) and geographic information systems (GIS) technologies to realize the quantification and spatial visualization of regional ECC, which has become the main trend of current research. In addition, although relevant researches on ECC at the spatial scale of country, province, city and basin have been conducted in accordance with the comprehensive evaluation index, the current ECC evaluation is difficult to form a unified index system (Peng et al., 2016; Tang et al., 2022). It is necessary to establish a scientific and complete evaluation index system according to the actual conditions with respect to the geographical environment and development characteristics of different regions.
ESP refers to a spatial pattern consisted of many landscape elements, spatial locations and their interrelationships (Zhang et al., 2023). The research on theory and method of ESP began in the 1990s (Yu, 1998), and has been basically formed a common ESP construction paradigm of “ecological source identification - resistance surface construction - corridor extraction” (Ding et al., 2022; Fan et al., 2022a). Among them, source identification is an important basic link in regional ESP construction (Peng et al., 2018). The traditional source identification is usually achieved by directly selecting nature reserves or large-scale ecological land patches (Wang and Pan, 2019). Some studies also take multi-perspective evaluation of ecological sensitivity, importance of ecosystem services or landscape connectivity, and morphological spatial pattern analysis as the entry point to identify ecological sources (Wei et al., 2022; Fan et al., 2022b; Lin et al., 2023). However, previous studies rarely applied ECC assessment in the identification of ecological sources. As a result, the ECC assessment is lack of guidance in the practical application of regional ESP planning, making it difficult to support the regional ecological protection decision which takes improving ecological carrying capacity as the sustainable development goal. Moreover, previous studies usually identify from a static perspective, rather than considering the long-term development status of sources, so that the obtained source patches are prone to lack stability. In terms of corridor extraction, the minimum cumulative resistance (MCR) model is one of the most widely used technical methods (Peng and Zhou, 2019; Gao et al., 2023). However, the MCR model is difficult to identify key ecological nodes in the corridors. Circuit theory can simulate species migration in complex ecological networks by means of comparing the ecological flow to the current in physics, which has the advantage of accurately identifying ecological nodes (Wang et al., 2020; Gao et al., 2021; Qiao et al., 2023). Therefore, MCR model and circuit theory tend to be combined to determine areas that need to be protected and restored in the ecological corridors. In addition, many studies regard ecological sources and corridors as the main components of ESP construction, however, the delineation of ecological security zones is rarely reported.
The West Liaohe River Basin (WLRB) is located in Northeast China, which is the sub-basin of the Liao River Basin that is one of China’s seven major river basins. The WLRB is the major agricultural and animal husbandry production region, as well as the important energy and coal chemical industry base. As the important part of ecological security barrier in northern China, the basin has a full range of ecological elements of “mountain, water, forest, field, lake, grass and sand”. In the past decades, with the over-exploitation and irrational utilization of natural resources, the basin occurs a series of ecological problems such as grassland degradation, land desertification and salinization, groundwater table decline, and shrinkage of water area, having brought serious challenges to regional ecological carrying capacity, ecological security and sustainable development (Hu et al., 2023; Xu et al., 2023). As the typical ecologically fragile area in the agro-pastoral zone of Northern China, the WLRB has been the main implementation area of ecological projects since 2000s, such as the Grain for Green Program, the Three-North Shelterbelt Program, and the Beijing–Tianjin Sandstorm Source Control Project (Tian et al., 2015; Jiang et al., 2020). At present, the WLRB urgently needs to continuously improve regional ECC and effectively alleviate the contradiction between ecological protection and socio-economic development through constructing ecological security pattern based on ECC assessment. Therefore, this research takes the WLRB as the study area, explores spatiotemporal evolution characteristics of ECC, identifies ecological sources according to multi-phase assessment results of ECC in combined with important ecological patches, and divides ecological security pattern zoning, extracts ecological corridor, pinch points and barrier points by applying MCR model and circuit theory, so as to form a comprehensive ESP of WLRB with “points-lines-planes” spatial pattern. The results are expected to provide scientific reference related to ecological protection and restoration strategies, and healthy and sustainable development of the basin.
2 Materials and methods
2.1 Study area
The WLRB is located in the southeastern Inner Mongolia Autonomous Region, belonging to the agro-pastoral interlaced zone of Northeast China (116°36’E to 123°39’E, 41°17’ N to 45°13’N) (Figure 1A), containing 3 cities and 20 counties, with a total area of approximately 1.26×10⁵ km2. The basin is far away from the ocean and belongs to the transition zone from semi-humid to semi-arid climate, with typical temperate continental monsoon climate characteristics. The annual mean temperature is 5.0°C-6.5°C, and the annual precipitation ranges from 310mm in the west to 600mm in the east. The overall topography of the basin gradually decreases from west to east, with an elevation in the range of 89-2022m (Figure 1B). The basin comprises a variety of ecological elements of “mountain, water, forest, field, lake, grass and sand”. Forests are mainly distributed on the western and southern mountains, the mountain-plain transitional area is mainly covered by grasslands, cultivated lands and grasslands are major land use types in the eastern plain, the Horqin Sandy Land is in the central bare area of the basin, and the major constructed lands are Chifeng City and Tongliao City (Figure 1C).
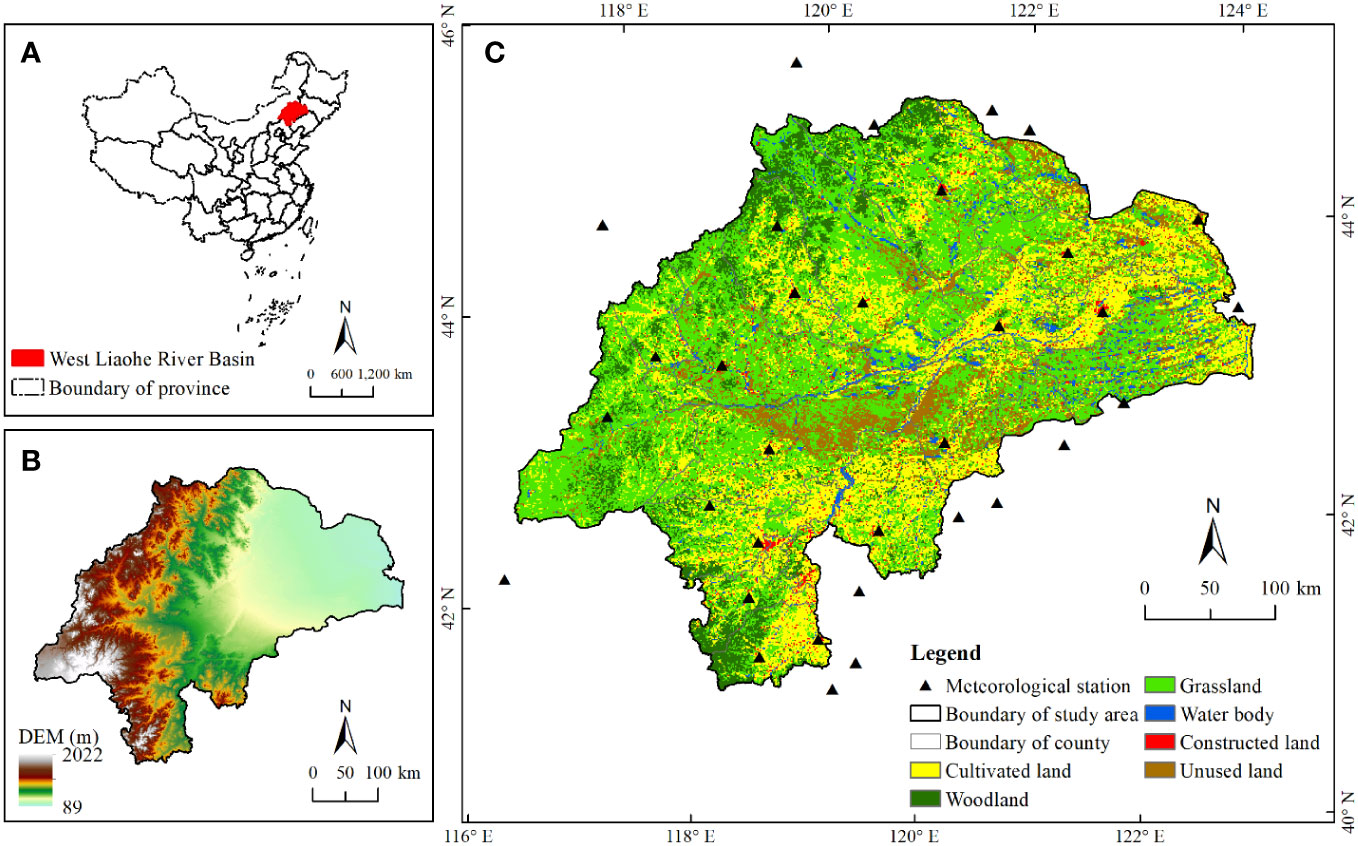
Figure 1 (A) Geographical location, (B) Topography, and (C) Land use of the West Liaohe River Basin.
2.2 Data source and pre-processing
The data used in this study include land use and land cover, Normalized Difference Vegetation Index (NDVI), Digital Elevation Model (DEM), soil type, vegetation type, river network, road, precipitation, social and economic statistical data (Table 1). Slope data was calculated based on DEM. Distances from river and road were calculated using Euclidean distance tool in ArcGIS software based on river network and road vector data. All the above data were processed into 1km spatial resolution grid format and unified as Geodetic Coordinate System with the help of ArcGIS 10.8 platform. The time series of dynamic data are 2000, 2005, 2010, 2015 and 2020.
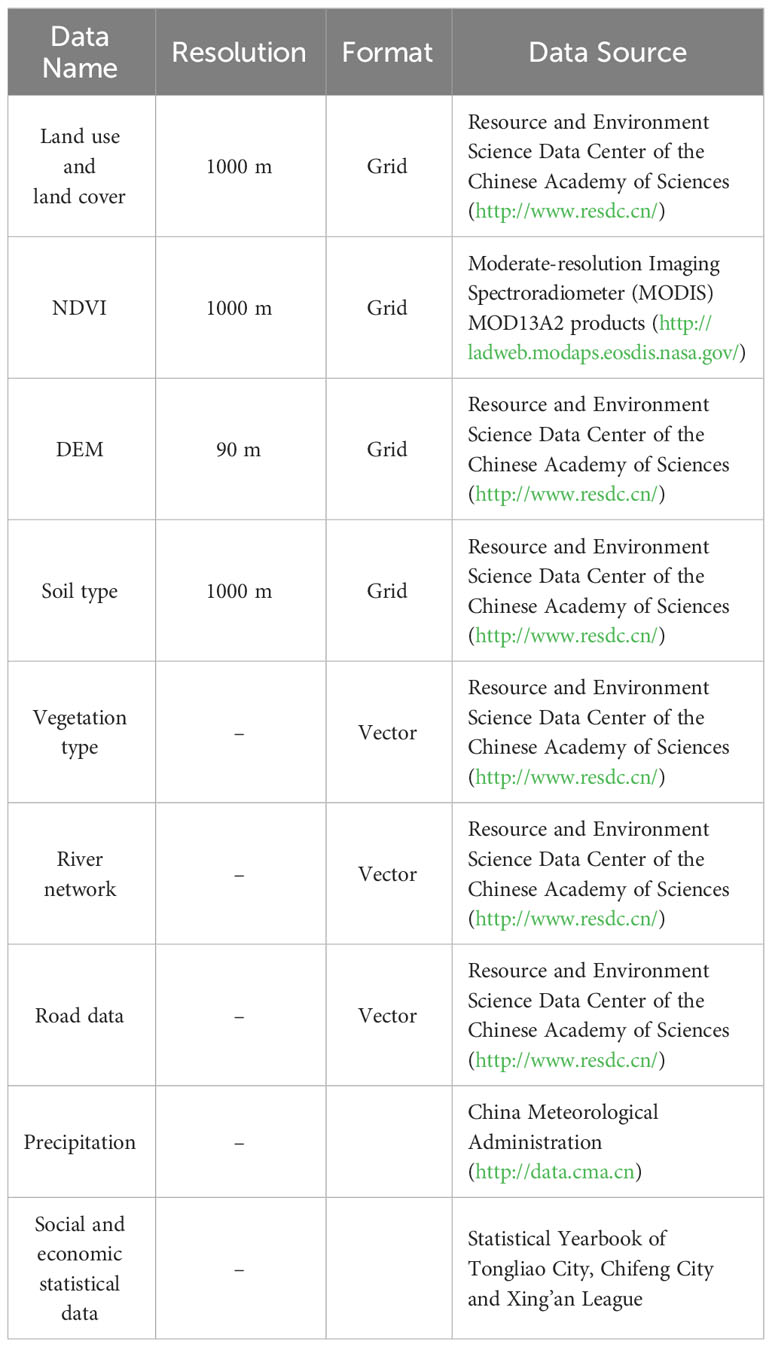
Table 1 The detailed information of research data.
2.3 Methodology
2.3.1 Ecological carrying capacity assessment
2.3.1.1 Construction of evaluation index system
In this study, three layers of ecological elasticity, resource supply and environment accommodation, social and economic pressure were used to set up a comprehensive evaluation system of ECC. Ecological elasticity was utilized to characterize the background conditions that support natural environment and social development in the WLRB, and vegetation, climate, water resources were mainly considered in the selection of indicators (Xiong et al., 2022). Resource supply and environment accommodation reflect the degree of coordination between resources, environment and human society (Cao et al., 2022), so we chose indicators that could represent the per capita resource holding and economic development level. Social and economic pressures directly reflect the impact of social and economic development on natural environment (Gao, 2001), so we collected population and economy materials as indicators. Eventually, 18 indicators were selected to construct the evaluation index system for ECC, as shown in Table 2.
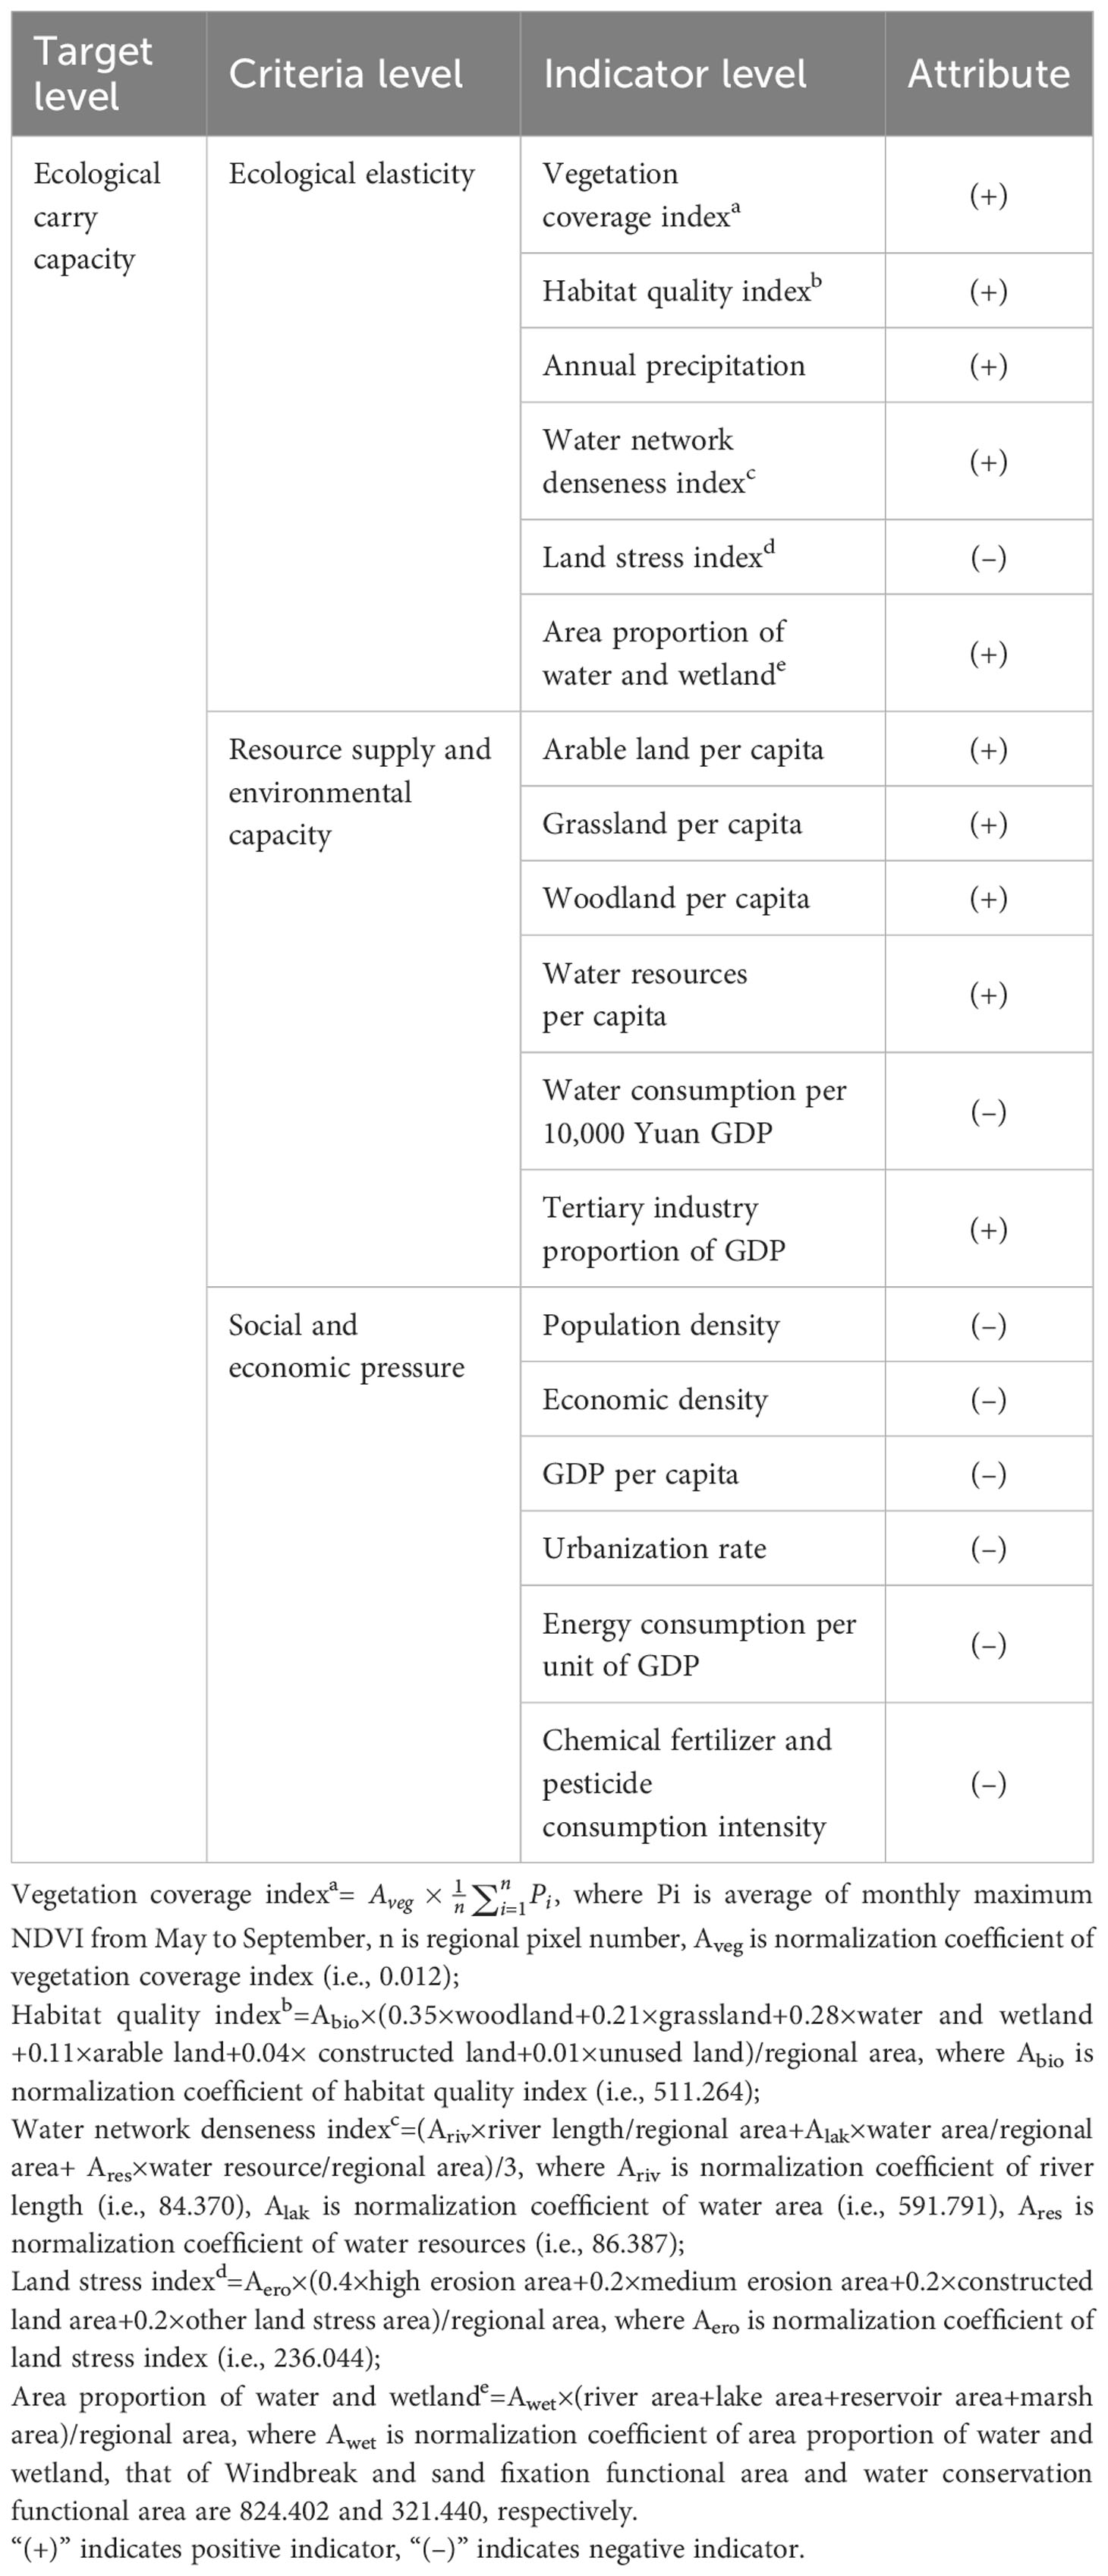
Table 2 Evaluation index system for ecological carrying capacity in West Liaohe River Basin.
In the evaluation index system, the calculation methods of vegetation coverage index, habitat quality index, water network denseness index, land stress index, area proportion of water and wetland were referred to Technical Criterion for Ecosystem Status Evaluation (HJ/T192-2015) (Ministry of ecology and environment of the people’s republic of China, 2015).
2.3.1.2 Standardized processing of indicators
In order to eliminate the dimensional influence between the indicators, the original data was necessary to be standardized using the range normalization method. The formula is as shown in Equations 1 and 2:
where Ri and Xi represent the standardization and original values for the indicator i, respectively; Xmin and Xmax are the minimum and maximum values for the indicator i, respectively.
2.3.1.3 Quantitative evaluation method of ecological carrying capacity
In this study, we applied spatial principal component analysis (SPCA) to quantitatively assess the ECC of the WLRB. This method is based on the principle of multi-dimensional spatial algorithm. Redundancy information is removed by analyzing the correlation between various indicators; finally, the original data are converted into several comprehensive layers. Mathematical statistics is used to calculate without subjective scoring; therefore, the evaluation result is strongly objective (Chang et al., 2019). Bartlett test of sphericity needs to be performed to judge whether SPCA is applicable. Results showed that the evaluation indexes of each phase passed the Bartlett test of sphericity with significance value p<0.05. The SPCA was subsequently carried out to obtain the eigenvalue, contribution rate and cumulative contribution rate based on ArcGIS 10.8 software platform. The number of principal components was determined by the number of principal component factors with a cumulative contribution rate of more than 85%. The contribution rate of principal components was taken as the weight of each principal component, and then the value of ECC of each phase was calculated by linear weighting. The formula is as shown in Equation 3:
where ECCi is the ecological carrying capacity index of the i year; Fi indicates the ith principal component; ai indicates the contribution rate of the ith principal component.
ECCi needed to be standardized in order to facilitate comparative analysis of changes in ECC index in different periods. The formula is as shown in Equation 4:
where SIECC is the standardized value of ecological carrying capacity, ranging from 0 to 1; ECCi is the actual ECC value; ECCmin and ECCmax are the minimum and maximum ECC values, respectively.
Then, the equal interval breakpoint method of ArcGIS platform was used to classify the ECC into five levels, low carrying capacity [0, 0.2), middle-low carrying capacity [0.2, 0.4), middle carrying capacity [0.4, 0.6), middle-high carrying capacity [0.6, 0.8) and high carrying capacity (0.8, 1].
2.3.2 Construction of ecological security pattern
In this study, the ESP construction in the WLRB included the following steps: (1) ecological sources identification; (2) resistance surface construction; (3) ecological security zones delineation; and (4) ecological corridors/nodes extraction”. The ecological elements of the above steps were further overlayed to establish a comprehensive ESP with “points-lines-planes” spatial pattern.
2.3.2.1 Identification of ecological sources
Ecological sources are the source of species dispersal and migration that play an important role in regional ecological environment and sustainable development (Kang et al., 2021; Wang et al., 2022). In this paper, based on the ECC assessment results, the top 20% of ECC pixels in different phase were respectively selected as the ecological dominant patches, and the ecological dominant areas were further obtained by intersecting the ecological dominant patches. Then the important ecological patches including natural protection areas (nature reserves, wetland parks, forest parks, etc.), water area, forest were further merged with ecological dominant area to comprehensively identify ecological sources. In order to reduce the fragmentation degree of ecological source, the patches with an area less than 10 km² were removed, and the contiguous distribution area was selected as the final ecological sources.
2.3.2.2 Construction of resistance surface
Ecological resistance factors are prerequisite for ecological sources expansion, reflecting the effect of the heterogeneity of landscape on ecological processes flow (Fan et al., 2021). Based on the natural geographical characteristics and human interference with the actual situation of the WLRB, land cover type, elevation, slope, NDVI, distance from river, vegetation type, soil type and distance from road were selected as resistance factors. According to natural attributes or natural breakpoint method, the resistance factors are classified into five levels and assigned values (Table 3). The weight of each resistance factor was determined by means of analytic hierarchy process (AHP). The comprehensive resistance surface for the basin was further calculated by weighted summation of the single resistance factor.
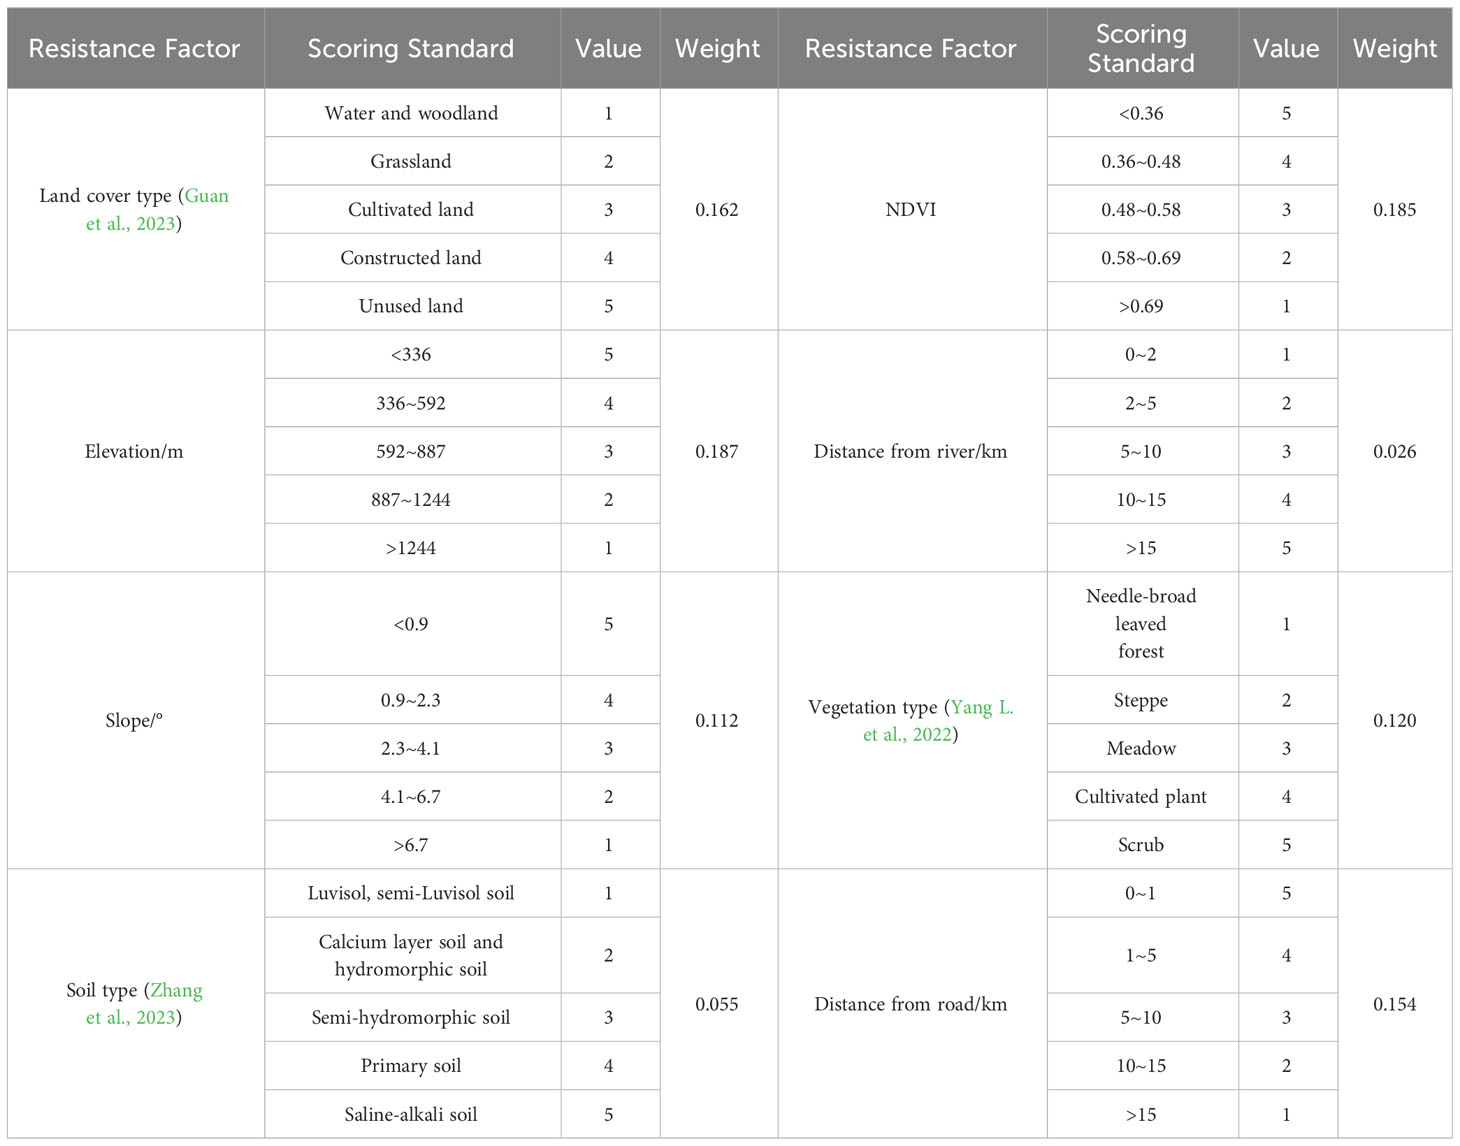
Table 3 The classification and weight of each resistance factor.
2.3.2.3 Ecological security zoning
The MCR model was used to calculate the minimum cumulative resistance value of source expansion to a certain landscape based on the cost distance tool in ArcGIS 10.8 platform. The calculation formula of the MCR model is as shown in Equation 5:
where MCR represents the minimum cumulative resistance value, f is the positive correlation between the minimum cumulative resistance and the ecological process, Dij is the spatial distance from ecological source i to landscape unit j, and Ri is the resistance of ecological source i in the expansion process.
Then, the natural breakpoint method was used to classify the minimum cumulative resistance value, and the basin was set into four classes ecological security pattern: ecological conservation zone, optimized buffer zone, ecological transition zone, ecological prevention and control zone.
2.3.2.4 Extraction of ecological corridors
Ecological corridors are important channels for material circulation and energy flow between ecological source sites, which is of great significance for maintaining ecological processes and landscape connectivity (Zhang et al., 2023). In the present study, we extracted ecological corridors by using MCR model and circuit theory. Based on the comprehensive resistance surface, combined with the ecological sources, the ArcGIS 10.8 software and Linkage Mapper 3.0 plug-in were utilized to generate the minimum cumulative cost path from the sources to targets as the ecological corridors.
2.3.2.5 Identification of ecological pinch point and barrier point
The crucial strategy nodes in the corridors including ecological pinch point and barrier point were identified using the Pinchpoint Mapper Tool and Barrier Mapper Tool of the Circuitscape plug-in in the ArcGIS platform. In circuit theory, ecological pinch points are the areas with high current density in corridors, which indicates that the degradation and loss of habitats may cut off the connectivity between sources. Therefore, the ecological pinch points should be considered as priority of ecological protection (Ran et al., 2022). We applied the “all-to-one” mode of Pinchpoint Mapper Tool to calculate current density, and areas with the highest current density level were identified as ecological pinch points. Ecological barrier points are the areas that impeding species migration between sources, and removement of these areas can effectively improve the connectivity between sources, which should be treated as key area for ecological restoration (Ran et al., 2022). We used Barrier Mapper Tool to identify ecological barrier points by calculating improvement scores after removing the barrier points. The areas with higher improvement scores were selected as the high barrier node areas, the restoration of these areas could effectively improve the landscape connectivity.
3 Results
3.1 Characteristics of ecological carrying capacity and its spatiotemporal evolution
The ECC for 2000-2020 was calculated by applying spatial principal component analysis (Figure 2). Figure 2 shows that the WLRB was dominated by medium carrying capacity grade, and its area accounted for more than 50% in the entire basin. The areas with high and middle-high carrying capacity were mainly distributed in the Greater Xing’an Mountain range in the northwest, Qilaotu Mountain and Daheishan Mountain (the branch of Yanshan Mountain range) in the south, and the eastern plain area. However, the hinterland of Horqin Sandy Land in the central part and the Hunshandak Sandy Land in the southwest had low and middle-low carrying capacity level.
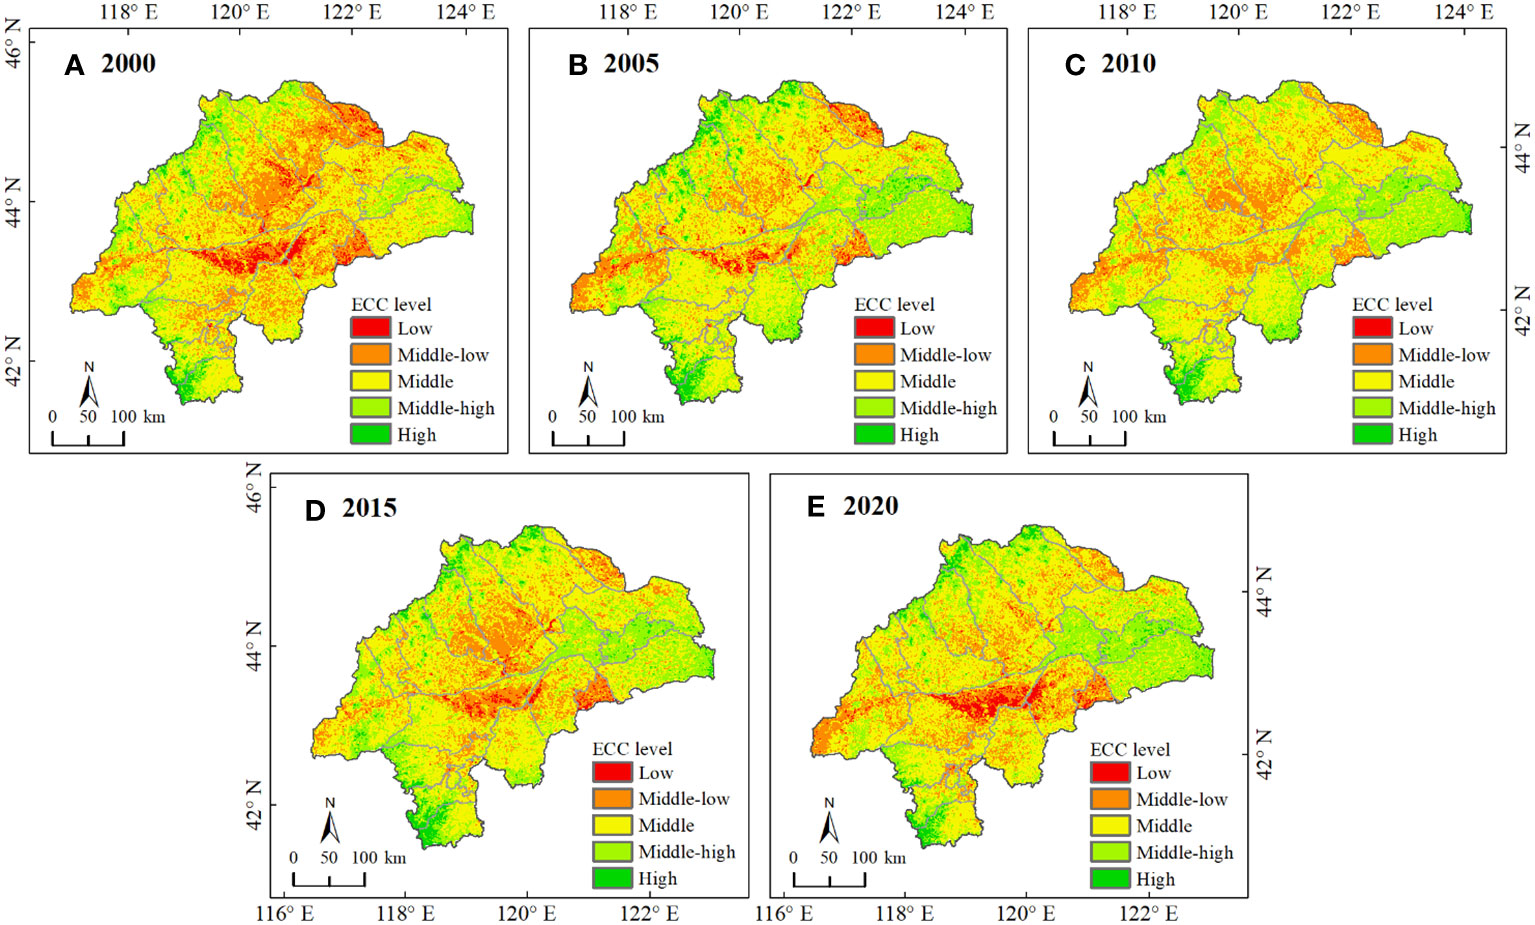
Figure 2 Spatial distribution of ecological carrying capacity in West Liaohe River Basin in (A) 2000, (B) 2005, (C) 2010, (D) 2015 and (E) 2020.
During the study period, the ECC of the overall basin showed a gradual increasing trend, with the mean value of ECC in the WLRB increasing from 0.469 in 2000 to 0.523 in 2020. The areas with low and middle-low ECC levels decreased by 0.87% and 10.33%, respectively, whereas those with middle-high and high ECC levels increased by 10.01% and 1.78%, respectively (Figure 3). Woodlands and grasslands were the dominant types of ECC enhancement. According to the changes of ECC and the implementation time nodes of ecological construction projects (various ecological construction projects has implemented since 2000), the evolution process of ECC could be divided into three phases: the early stage of implementation - rapid recovery period (2000-2005), the middle stage of implementation - recovery stagnation period (2005-2010) and the late stage of implementation – steady improvement period (2010-2020). From 2000 to 2005, the ECC of the basin was rapidly rising. In 2005, the ECC reached its maximum value of 0.527, and the area with high and middle-high carrying capacity increased by 10.27% and 2.44%, respectively. From 2005 to 2010, the optimal state of ECC did not continue, showing a slight decline (i.e., from 0.527 to 0.514). Large area with high ECC degraded to the middle ECC level, the area with high and middle-high carrying capacity decreased by 1.51% and 2.25%, respectively. From 2010 to 2020, although the ECC of the overall basin exhibited a steadily improved trend (i.e., from 0.514 to 0.523) compared with the previous phase and a large proportion of middle-low ECC level raised to middle level, it is worth noting that the ECC in considerable areas of Horqin Sandy Land experienced a degradation process from middle-low to low ECC in this phase (Figure 2).
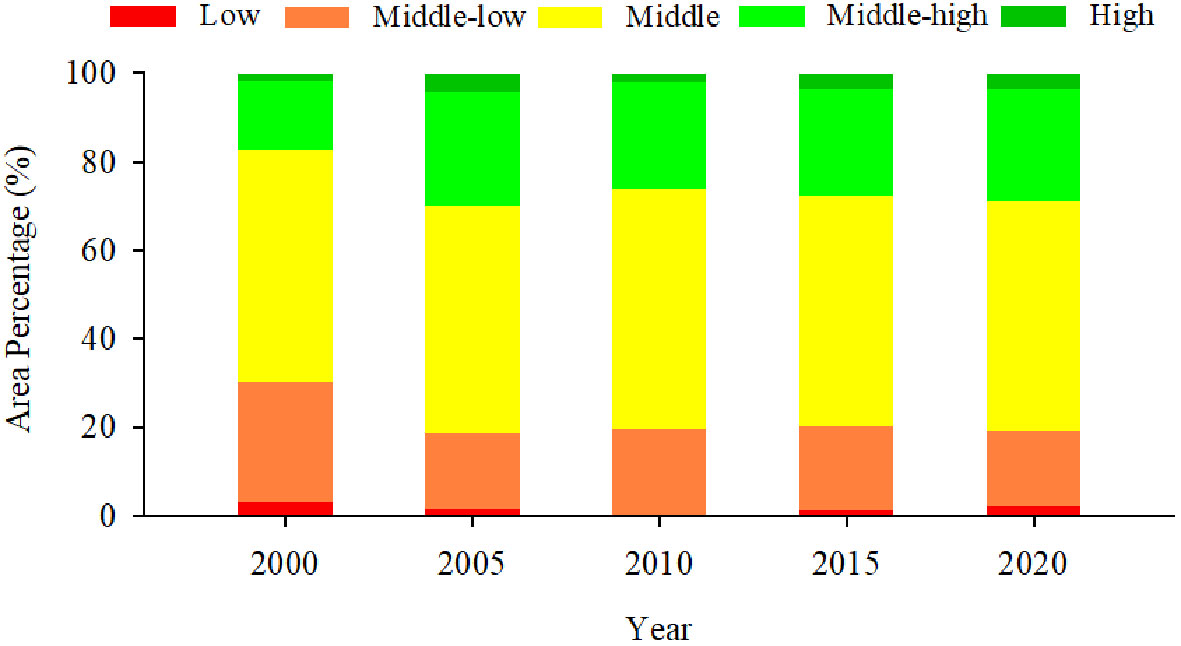
Figure 3 Changes in area of different levels of ecological carrying capacity in West Liaohe River Basin from 2000 to 2020.
3.2 Construction of ecological security pattern
3.2.1 Identification of ecological sources
The top 20% ECC pixels of each phase were intersected to obtain the ecological dominant area (Figure 4A). Combing with nature protected area, woodland, water area, and removing the fragmented and small patches (with an area less than 10 km²), we obtained the ecological sources of the WLRB (Figure 4B). As a result, 41 patches were identified as ecological sources, with a total area of 21926.91 km², covering 17.33% of the total study area. On the whole, the ecological sources showed a scattered and fragmented distribution, the large-scale source patches were more concentrated around the Greater Xing’an Mountains and the surrounding areas of Qilaotu Mountain, the overall ecological sources in central WLRB were relatively fragmented.
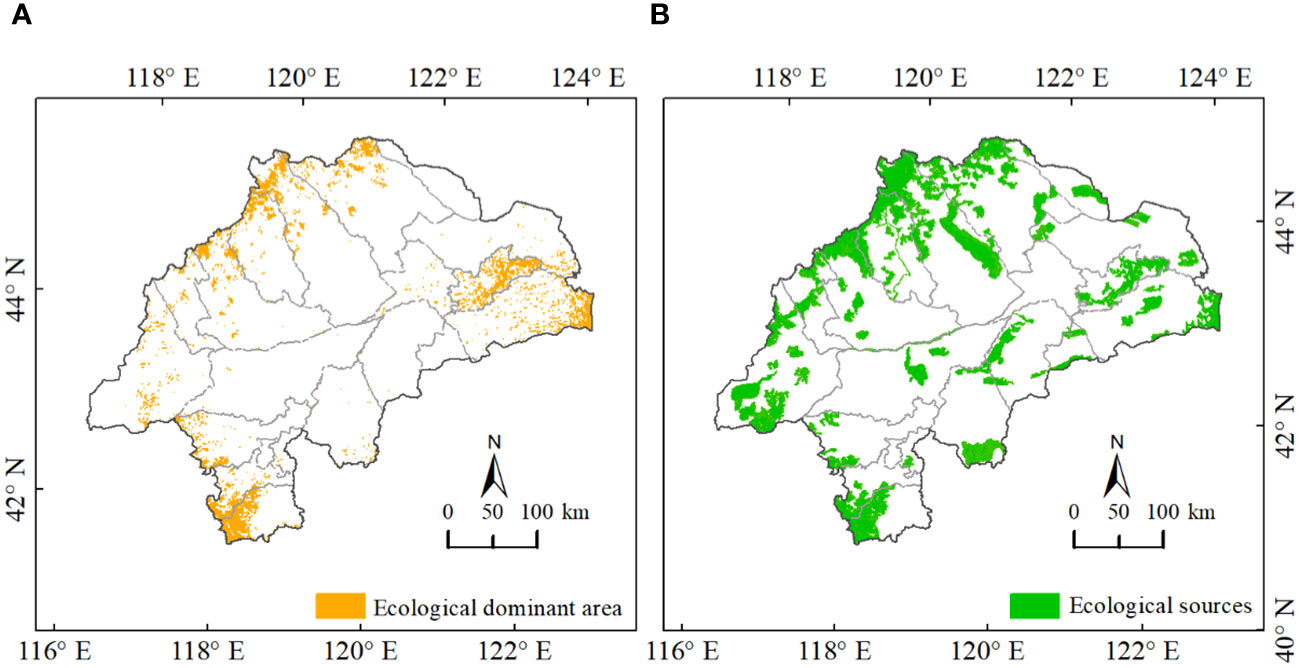
Figure 4 Spatial distribution of (A) ecological dominant area and (B) ecological sources in West Liaohe River Basin.
3.2.2 Construction of resistance surface
According to the value and weight of the single resistance factor in Table 3, the comprehensive resistance surface for the basin was obtained. As shown in Figure 5, the resistance values of ecological sources expansion in the WLRB ranged from 1.16 to 4.78. In general, the ecological resistance value increased from west to east. The low resistance value areas were mainly distributed in the western mountains with complex terrain, dense vegetation cover and low human activity intensity. The high value areas were mainly located in the central part of the basin, where largely covered by sandy land. These regions had the fragile ecological environment and sensitive habitat and were prone to human activities interference, which hindered the flow of ecological materials to a large extent and increased the difficulty of expanding the ecological source in these regions.
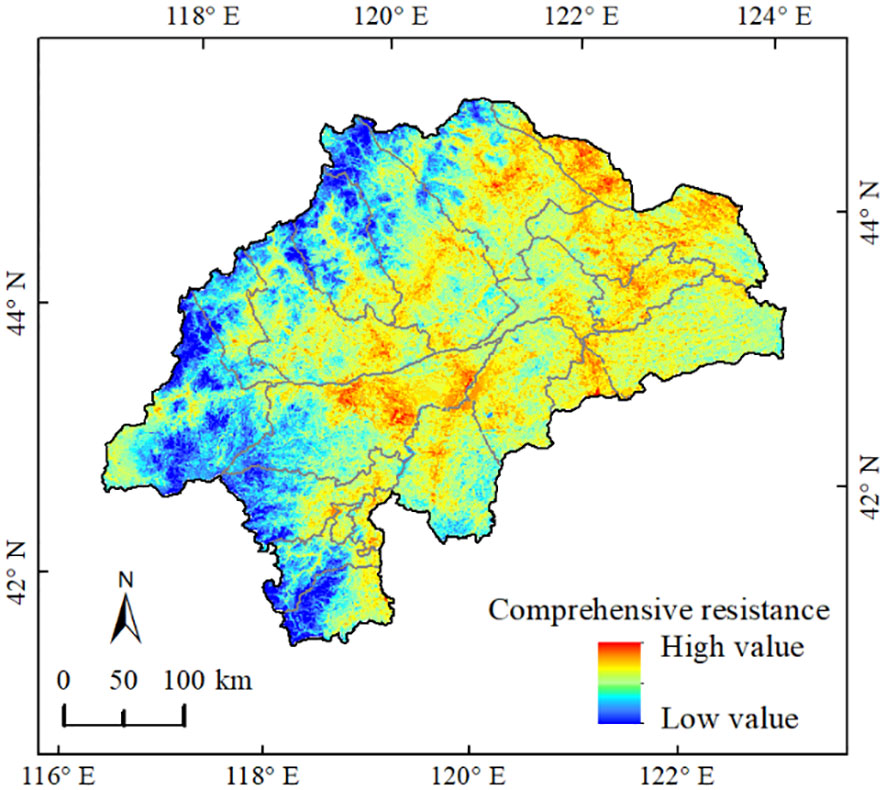
Figure 5 Spatial distribution of comprehensive resistance surface in West Liaohe River Basin.
3.2.3 Ecological security zoning
Using the MCR model, the minimum cumulative resistance surface for ecological source expansion was calculated. Then the basin was divided into four different levels of ecological security zones according to minimum cumulative resistance values (Figure 6). According to statistical results, ecological conservation zone occupied the largest part of the area, which was 55672.69 km², accounting for 44.82% of the total area of the basin. This area was the core to maintain the ecological security of the basin, which should be preferentially protected and restrictively developed. The optimized buffer zone and ecological transition zone were 32662.24 km² and 23862.84 km², accounting for 26.29% and 19.21%, respectively. The land use type of these zone was mainly grassland and cultivated land. Under the premise of stabilizing the permanent basic farmland area, the project of returning farmland to forest and grassland should be reasonably carried out, the management of degraded grassland (i.e., grass-livestock balance) should be further strengthened. The area of ecological prevention and control zone was 12021.04 km², accounting for 9.68%. The proportion of unused land such as sandy land and bare land in this zone was relatively high, and it was the key area for ecological construction and environmental protection in the basin. Ecological construction should be continuously strengthened, and the control of wind-blown sand should be carried out to gradually improve the regional ecological environment.
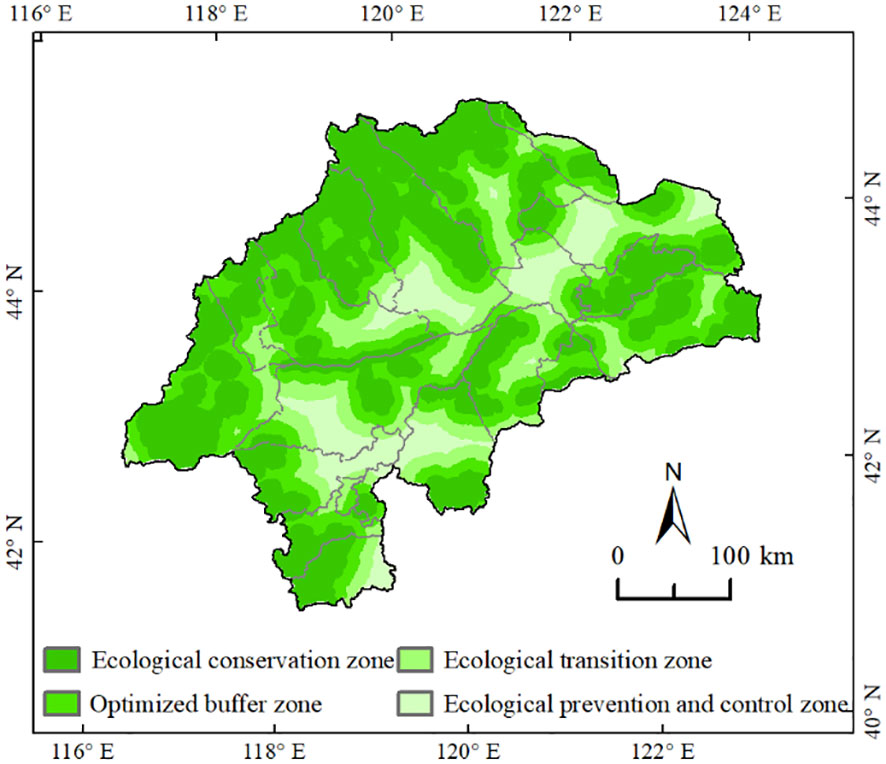
Figure 6 Ecological security pattern zone of West Liaohe River Basin.
3.2.4 Identification of ecological corridors, pinch points and barrier points
The distribution of ecological corridors was identified based on the ecological sources and resistance surface. As shown in Figure 7A, 95 ecological corridors were extracted in this study, ranging in length from 2.02 to 95.04 km, with a total length of 3,130.97 km and an average length of 32.96 km. Owing to the large area and relatively close distribution of ecological sources in the northwest of the basin, ecological corridors were generally short in this area, which was conducive to the connectivity of different ecological elements, and needed to take key protection. Due to the higher resistance value, the corridors in the central of the basin were more sparsely distributed.
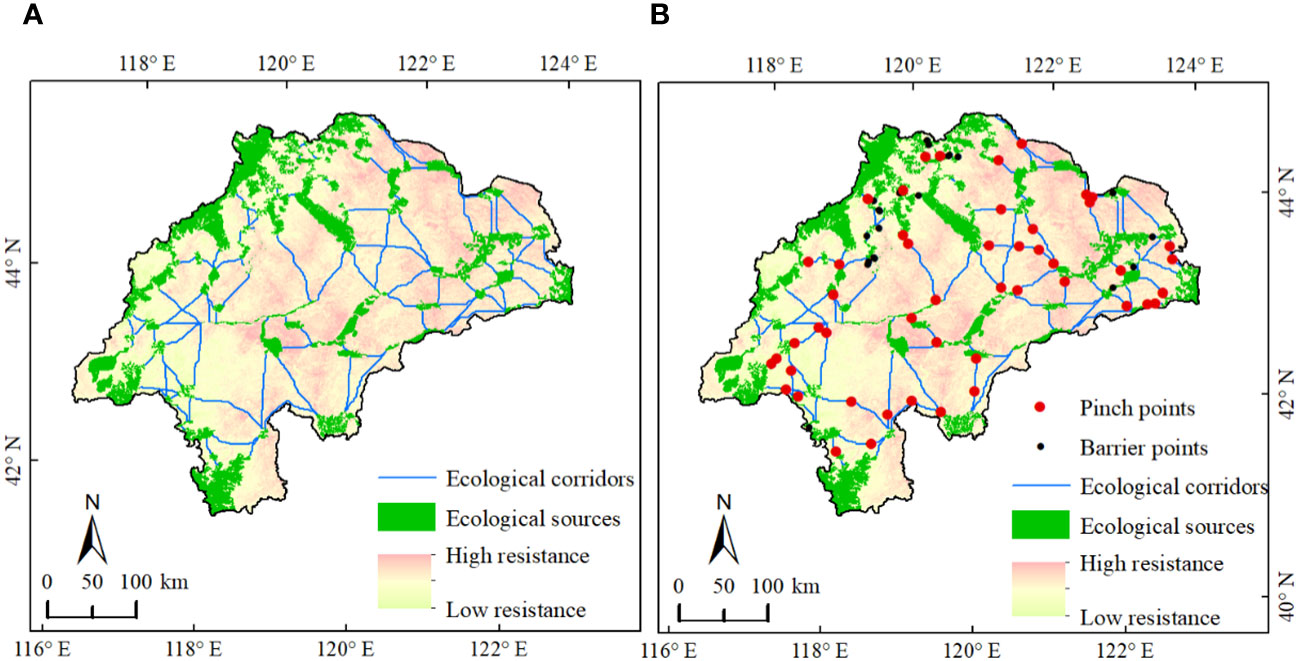
Figure 7 Spatial distribution of (A) ecological corridors and (B) ecological pinch and barrier points in West Liaohe River Basin.
Ecological pinch points identification results are shown in Figure 7B. There were 49 ecological pinch points in the basin, with a total area of 200.33 km², among which the largest pinch point was 25.59 km² and the smallest was only 0.70 km². The overlay of land use data showed that grassland was the main land use type of pinch points and accounted for the largest proportion of 47.58%, followed by cultivated land (25.24%), unused land (11.16%), woodland (8.74%), water body (5.34%) and constructed land (1.94%).
The basin identified 30 ecological barrier points with a total area of about 318.30 km², the largest barrier point was 70.81 km², the smallest was 0.70 km² (Figure 7B). From the perspective of spatial distribution, the number of barrier points in the Greater Xing’an Mountains area in the northwest was the largest. Grassland occupied for the largest proportion (55.80%) of barrier points, followed by cultivated land (22.26%), woodland (10.66%), unused land (6.58%), water body (3.14%) and constructed land (1.57%).
4 Discussions
4.1 Ecological carrying capacity and its spatiotemporal evolution
In this study, we utilized RS combined with GIS technologies to evaluate ECC in the WLRB and explore its spatio-temporal evolution. We confirmed obvious spatiotemporal heterogeneity of ECC in the WLRB from 2000 to 2020. In terms of spatial heterogeneity, the areas with high carrying capacity were concentrated in the Greater Xing’an Mountain range in the northwest, Qilaotu Mountain and Daheishan Mountain in the south, and the eastern plain area, where the land use type was dominated by grassland and woodland with relatively high vegetation coverage, and the ecological environment was relatively more favorable than other areas in the WRLB. However, the ECC in hinterland of Horqin Sandy Land in the central part and the Hunshandak Sandy Land in the southwest was at low and middle-low level, where the ecological environment was fragile with serious desertification and relatively sparse vegetation coverage.
From the perspective of temporal heterogeneity, the distribution patterns of ECC from 2000 to 2020 were approximately the same, however, the ECC level of the whole basin showed a fluctuating increasing trend. Human activities are believed to exert an important role in the evolution process of ECC (Ma et al., 2017; Wu and Hu, 2020; Zhu et al., 2022). The changes in ECC are closely related to a series of ecological restoration programs that continuously promoted in the WLRB. In order to alleviate the ecological damage and over-exploitation and utilization of natural resources induced by excessive socioeconomic development in the past decades, various ecological restoration programs including “Grain for Green Program” and “Three-North Shelterbelt Program” have been launched in the WLRB since 2000s (Jiang et al., 2020; Zhu et al., 2023). Our results showed that the ECC of the overall basin substantially increased in the early stage (i.e., from 2000 to 2005) of ecological programs implementation, which was benefit from the large-scale vegetation restoration and eco-environment improvement, relieving the stress caused by socioeconomic development on ecosystem to a certain extent (Xu et al., 2020). However, adverse consequence has also occurred in the process of ecological restoration. Previous studies have demonstrated that the initial implementation of some ecological programs was not suitable to local environmental conditions, which might have negative effect on the sustainability of ecological restoration (Cao et al., 2011). For example, many cultivated lands within WLRB were retired for tree plantations, but these introduced trees were often inappropriate for areas that likely were more suitable for grasses or shrubs (Chen et al., 2018). These trees consumed more water and aggravated regional water deficit (Xu et al., 2023), which damaged long-term vegetation growth (Cao et al., 2011; Yang et al., 2014; Su and Shangguan, 2019). This may explain the decline in ECC during 2005-2010. Fortunately, with the optimization of the suitability of ecological restoration programs, the quality of eco-environment in the WLRB has been steadily improved, leading to an increasing trend in the ECC in the late stage of ecological programs implementation.
4.2 Construction of ecological security pattern coupled with ecological carrying capacity
The scientific and accurate ecological source assessment is the important goal for construction of ESP. As a scientific concept and effective tool to measure the relationship between social and economic activities, resource and environment background, and ecosystem elasticity in a certain region, ECC is an important foundation and reliable basis for constructing ESP and promoting ecological civilization construction (Lu et al., 2020). Furthermore, ESP construction is the efficient way to improve the regional ecological carrying capacity (Zhang et al., 2023). However, few previous studies have incorporated ECC into the construction of ESP, which restricts the practical application of ECC evaluation results. In this study, we coupled the ECC evaluation results with important ecological patches including natural protected areas, woodland and water body, which could compensate for the deficiency of previous studies that directly using nature reserves or large-scale ecological land patches and lacking of theoretical support, providing a sufficient scientific basis for accurate spatial positioning of ecological sources. In addition, the current studies on regional ESP identify ecological sources mainly from a static perspective rather than from a dynamic perspective. However, with the continuous change and rapid development of regional ecological environment and socio-economy, the relevant elements are in a situation of dynamic change. This study considered the dynamic development of the sources and integrated multi-phase evaluation results of ECC to identify ecological sources, which improved the stability of ecological sources, and could provide a reference for determining ecological sources from a dynamic perspective to construct regional ESP.
However, ECC is a complex system, and the comprehensive and scientific selection of evaluation indicators directly determines the accuracy of ECC evaluation results, thus affecting the accurate identification of ecological sources and ESP establishment. Although we used 18 indicators including natural factors such as vegetation, climate and hydrology, as well as population and socio-economic development characteristics to assess ECC, this study still faced challenges in data collection due to the extensive study area, significant regional differences and insufficient historical materials, leading to the evaluation indicators were not comprehensive enough. The refinement and improvement of evaluation indicator system should be strengthened in the future research.
4.3 Suggestions on ecological protection and management
Constructing ESP consisted of “points-lines-planes” configuration and implementing targeted ecological countermeasures to protect and restore regional ecosystem in corresponding spatial areas, is an effectively means to improve regional ECC and promote sustainable development of regional ecology, economy and society (Li et al., 2021; Pan et al., 2022; Zhang et al., 2023). In recent years, along with the implementation of various ecological projects, although the ecological environment in Northern China has gradually improved and the ECC has been enhanced, it still has not reached the ideal state. Results in this study found that the WLRB still faced the actual situation that the ecological sources had uneven spatial distribution and relatively small area, and the source patches were fragmented, which was not conductive to the continuity of ecological processes and the flow of ecological energy. Especially in the central sandy area and eastern plain area, where the ecological sources are susceptible to interference from wind-blown sand and human activities, leading to the fragmented ecological sources and restricted ecological element flows. Therefore, it is necessary to strengthen the protection of the existing ecological sources, establish buffer zone around the sources to prevent from human activities. For cultivated lands with severe wind erosion and desertification that are unsuitable for cultivation, it should be put more effort on implementing “Grain for Green” national policy to return cultivated land to woodland or grassland thus increasing the area of ecological sources. In addition, the comprehensive control of wind-blown sand should be strengthened, and the vegetation construction projects should be carried out to appropriately increase vegetation coverage under the constraint of water resources carrying capacity in sandy area (Jie, 2021).
Ecological corridors and ecological strategy nodes are of great important to solve ecological problems and maintain the stability of ecological network (Omer et al., 2021), which should be taken as priority areas for protection and restoration. Through the construction of ecological corridors, an interconnected spatial network can be formed between the ecological sources in the basin. However, there is a large area of sandy land in the basin with large resistance, resulting in sparse distribution and poor connectivity in the existing corridors. Therefore, it is necessary to strengthen the construction of corridors, set buffer zones around the corridors to protect natural corridors, and pay more attention to corridors with more ecological nodes and long distance. Ecological pinch points and barrier points in the WLRB were both dominated by grassland and cultivated land, which were significantly affected by human activities interference. In future ecological restoration, on one hand, grass-livestock balance management measures should be fully implemented and grazing intensity should be reasonably controlled to reduce grassland pressure, the restoration of degraded and desertified grasslands should be strengthened. On the other hand, more attention should be paid to management of cultivated land, and the low-quality cultivated land should be converted into woodland and grassland (Lin et al., 2023). In a word, it will be necessary to implement appropriate ecological restoration measures to strengthen ecological protection of pinch point areas and solve the existing ecological problems of barrier point areas.
5 Conclusions
In this study, we systematically assessed the spatiotemporal evolution of ECC in the WLRB from 2000 to 2020. Furthermore, we incorporated ECC evaluation results into the construction of ESP, according to the framework of “ecological sources identification–resistance surface construction–ecological security zoning–ecological corridors/nodes extraction”, the comprehensive ESP of the basin was constructed. The main conclusions are as follows:
(1) The ECC of the WLRB was mainly at medium carrying level and was spatially heterogeneous, generally showing a decreasing trend from the periphery to the center of the basin. Overall, the ECC showed a gradual upward trend during the period from 2000 to 2020.
(2) A total of 41 ecological source patches were determined in the WLRB, covering an area of 21,926.91 km² and accounting for only 17.33% of the total area of the basin, which was low in general. The spatial distribution of ecological sources was uneven, which was more concentrated in the mountain area and scattered in the central area. The ecological security zoning in the basin could be divided into four classes: ecological conservation zone, optimized buffer zone, ecological transition zone, ecological prevention and control zone, with area of 55672.69 km², 32662.24 km², 23862.84 km² and 12021.04 km², accounting for 44.82%, 26.29%, 19.21% and 9.68%, respectively. A total of 95 ecological corridors (with a total length of 3,130.97 km), 49 ecological pinch points (with a total area of 200.33 km²) and 30 ecological barrier points (with a total area of 318.30 km²) were extracted from the basin.
To sum up, in the WLRB, ecological restoration measures should be taken to increase ecological source patches in the central region, protect natural ecological corridors and ecological pinch points, eliminate the impacts of ecological barrier points, so as to enhance the ecological flow, improve the regional ECC and promote regional sustainable development.
Data availability statement
The original contributions presented in the study are included in the article/Supplementary Material. Further inquiries can be directed to the corresponding author.
Author contributions
YZ: Conceptualization, Formal analysis, Methodology, Software, Writing – original draft. PT: Visualization, Writing – review & editing. LD: Data curation, Writing – review & editing. ZY: Data curation, Writing – review & editing. JG: Funding acquisition, Supervision, Writing – review & editing.
Funding
The author(s) declare that financial support was received for the research, authorship, and/or publication of this article. This research was funded by the Key Science and Technology Special Program of Inner Mongolia Autonomous Region (Grant No. 2021ZD0015), the Special Project of Basic Scientific Research Business Expenses of China Institute of Water Resources and Hydropower Research (Grant No. MK2021J13), the IWHR Research & Development Support Program (Grant No. MK0145B022021), and the Science and Technology Project of Inner Mongolia Autonomous Region (Grant No. 2022YFHH0063).
Conflict of interest
The authors declare that the research was conducted in the absence of any commercial or financial relationships that could be construed as a potential conflict of interest.
Publisher’s note
All claims expressed in this article are solely those of the authors and do not necessarily represent those of their affiliated organizations, or those of the publisher, the editors and the reviewers. Any product that may be evaluated in this article, or claim that may be made by its manufacturer, is not guaranteed or endorsed by the publisher.
References
Cao S., Chen L., Shankman D., Wang C., Wang X., Zhang H. (2011). Excessive reliance on afforestation in China’s arid and semi-arid regions: lessons in ecological restoration. Earth Sci. Rev. 104, 240–245. doi: 10.1016/j.earscirev.2010.11.002
Cao X., Jiao J., Liu X., Zhu W., Wang H., Hao H., et al. (2022). Establishment of an ecological security pattern under arid conditions based on ecological carrying capacity: A case study of arid area in Northwest China. Sustainability 14, 15799. doi: 10.3390/su142315799
Chang Y., Hou K., Wu Y., Li X., Zhang J. (2019). A conceptual framework for establishing the index system of ecological environment evaluation–A case study of the upper Hanjiang River, China. Ecol. Indic. 107, 105568. doi: 10.1016/j.ecolind.2019.105568
Chen J., John R., Sun G., Fan P., Henebry G. M., Fernández-Giménez M. E., et al. (2018). Prospects for the sustainability of social-ecological systems (SES) on the Mongolian plateau: five critical issues. Environ. Res. Lett. 13, 123004. doi: 10.1088/1748-9326/aaf27b
Chen Y., Tian W., Zhou Q., Shi T. (2021). Spatiotemporal and driving forces of Ecological Carrying Capacity for high-quality development of 286 cities in China. J. Cleaner Production 293, 126186. doi: 10.1016/j.jclepro.2021.126186
Ding M., Liu W., Xiao L., Zhong F., Lu N., Zhang J., et al. (2022). Construction and optimization strategy of ecological security pattern in a rapidly urbanizing region: A case study in central-south China. Ecol. Indic. 136, 108604. doi: 10.1016/j.ecolind.2022.108604
Fan X., Cheng Y., Tan F., Zhao T. (2022a). Construction and optimization of the ecological security pattern in Liyang, China. Land 11, 1641. doi: 10.3390/land11101641
Fan X., Rong Y., Tian C., Ou S., Li J., Shi H., et al. (2022b). Construction of an ecological security pattern in an urban–lake symbiosis area: A case study of hefei metropolitan area. Remote Sens. 14, 2498. doi: 10.3390/rs14102498
Fan Y., Wang H., Yang S., Liu Q., Heng J., Gao Y. (2021). Identification of ecological protection crucial areas in Altay Prefecture based on habitat quality and ecological security pattern. Acta Ecol. Sin. 41, 7614–7626.
Fang Y.-P., Zhu F.-B., Yi S.-H., Qiu X.-P., Ding Y.-J. (2021). Ecological carrying capacity of alpine grassland in the Qinghai–Tibet Plateau based on the structural dynamics method. Environ. Dev. Sustain. 23, 12550–12578. doi: 10.1007/s10668-020-01182-2
Fu Y., Shi X., He J., Yuan Y., Qu L. (2020). Identification and optimization strategy of county ecological security pattern: A case study in the Loess Plateau, China. Ecol. Indic. 112, 106030. doi: 10.1016/j.ecolind.2019.106030
Gao J. (2001). Discussion on Sustainable Development Theory: Ecological Carrying Capacity Theory, Method and Application (Beijing, China: China Environmental Science Press).
Gao J., Du F., Zuo L., Jiang Y. (2021). Integrating ecosystem services and rocky desertification into identification of karst ecological security pattern. Landscape Ecol. 36, 2113–2133. doi: 10.1007/s10980-020-01100-x
Gao C., Luo Y., Li P. (2023). Does the regional ecological security pattern benefit eco-environmental protection? A case study of Yangtze River Delta. Ecosyst. Health Sustain. 9, 0017. doi: 10.34133/ehs.0017
Guan H., Bai Y., Zhang C., Zou J. (2023). Spatial identification and optimization of ecological network in desert-oasis area of Yellow River Basin, China. Ecol. Indic. 147, 109999. doi: 10.1016/j.ecolind.2023.109999
Hu Y., Gong J., Li X., Song L., Zhang Z., Zhang S., et al. (2023). Ecological security assessment and ecological management zoning based on ecosystem services in the West Liao River Basin. Ecol. Eng. 192, 106973. doi: 10.1016/j.ecoleng.2023.106973
Jiang H., Xu X., Guan M., Wang L., Huang Y., Jiang Y. (2020). Determining the contributions of climate change and human activities to vegetation dynamics in agro-pastural transitional zone of northern China from 2000 to 2015. Sci. Total Environ. 718, 134871. doi: 10.1016/j.scitotenv.2019.134871
Jie L. (2021). A simulation approach to optimizing the vegetation covers under the water constraint in the Yellow River Basin. For. Policy Econ. 123, 102377. doi: 10.1016/j.forpol.2020.102377
Kang J., Zhang X., Zhu X., Zhang B. (2021). Ecological security pattern: A new idea for balancing regional development and ecological protection. A case study of the Jiaodong Peninsula, China. Global Ecol. Conserv. 26, e01472. doi: 10.1016/j.gecco.2021.e01472
Kowe P., Mutanga O., Odindi J., Dube T. (2020). A quantitative framework for analysing long term spatial clustering and vegetation fragmentation in an urban landscape using multi-temporal landsat data. Int. J. Appl. Earth Observ. Geoinform. 88, 102057. doi: 10.1016/j.jag.2020.102057
Li S., Zhao Y., Xiao W., Yue W., Wu T. (2021). Optimizing ecological security pattern in the coal resource-based city: A case study in Shuozhou City, China. Ecol. Indic. 130, 108026. doi: 10.1016/j.ecolind.2021.108026
Lin L., Wei X., Luo P., Wang S., Kong D., Yang J. (2023). Ecological security patterns at different spatial scales on the Loess Plateau. Remote Sens. 15, 1011. doi: 10.3390/rs15041011
Lu S., Tang X., Guan X., Qin F., Liu X., Zhang D. (2020). The assessment of forest ecological security and its determining indicators: A case study of the Yangtze River Economic Belt in China. J. Environ. Manage. 258, 110048. doi: 10.1016/j.jenvman.2019.110048
Lyu X., Li X., Wang K., Cao W., Gong J., Wang H., et al. (2022). Linking regional sustainable development goals with ecosystem services to identify ecological security patterns. Land Degrad. Dev. 33, 3841–3854. doi: 10.1002/ldr.4427
Ma P., Ye G., Peng X., Liu J., Qi J., Jia S. (2017). Development of an index system for evaluation of ecological carrying capacity of marine ecosystems. Ocean Coast. Manage. 144, 23–30. doi: 10.1016/j.ocecoaman.2017.04.012
Ministry of ecology and environment of the people’s republic of China (2015). Technical Criterion for Ecosystem Status Evaluation (HJ 192–2015) (Beijing, China: China Environmental Science Press).
Omer A., Zhuguo M., Yuan X., Zheng Z., Saleem F. (2021). A hydrological perspective on drought risk-assessment in the Yellow River Basin under future anthropogenic activities. J. Environ. Manage. 289, 112429. doi: 10.1016/j.jenvman.2021.112429
Pan N., Du Q., Guan Q., Tan Z., Sun Y., Wang Q. (2022). Ecological security assessment and pattern construction in arid and semi-arid areas: A case study of the Hexi Region, NW China. Ecol. Indic. 138, 108797. doi: 10.1016/j.ecolind.2022.108797
Peng J., Du Y., Liu Y., Hu X. (2016). How to assess urban development potential in mountain areas? An approach of ecological carrying capacity in the view of coupled human and natural systems. Ecol. Indic. 60, 1017–1030. doi: 10.1016/j.ecolind.2015.09.008
Peng J., Yang Y., Liu Y., Du Y., Meersmans J., Qiu S. (2018). Linking ecosystem services and circuit theory to identify ecological security patterns. Sci. Total Environ. 644, 781–790. doi: 10.1016/j.scitotenv.2018.06.292
Peng W., Zhou J. (2019). Development of land resources in transitional zones based on ecological security pattern: A case study in China. Natural Resour. Res. 28, 43–60. doi: 10.1007/s11053-018-9401-8
Qiao Q., Zhen Z., Liu L., Luo P. (2023). The construction of ecological security pattern under rapid urbanization in the loess plateau: A case study of Taiyuan City. Remote Sens. 15, 1523. doi: 10.3390/rs15061523
Qiu H., Hu B., Zhang Z. (2021). Impacts of land use change on ecosystem service value based on SDGs report–Taking Guangxi as an example. Ecol. Indic. 133, 108366. doi: 10.1016/j.ecolind.2021.108366
Ran Y., Lei D., Li J., Gao L., Mo J., Liu X. (2022). Identification of crucial areas of territorial ecological restoration based on ecological security pattern: A case study of the central Yunnan urban agglomeration, China. Ecol. Indic. 143, 109318. doi: 10.1016/j.ecolind.2022.109318
Sjafrie N. D. M., Adrianto L., Damar A., Boer M. (2018). Human appropriation of net primary production (HANPP) in seagrass ecosystem: an example from the east coast of Bintan Regency, Kepulauan Riau Province, Indonesia. Environ. Dev. Sustain. 20, 865–881. doi: 10.1007/s10668-017-9914-z
Świąder M., Lin D., Szewrański S., Kazak J. K., Iha K., van Hoof J., et al. (2020). The application of ecological footprint and biocapacity for environmental carrying capacity assessment: A new approach for European cities. Environ. Sci. Policy 105, 56–74. doi: 10.1016/j.envsci.2019.12.010
Su B., Shangguan Z. (2019). Decline in soil moisture due to vegetation restoration on the Loess Plateau of China. Land Degrad. Dev. 30, 290–299. doi: 10.1002/ldr.3223
Tang B., Hu Y., Li H., Yang D., Liu J. (2016). Research on comprehensive carrying capacity of Beijing–Tianjin–Hebei region based on state-space method. Natural Hazards 84, 113–128. doi: 10.1007/s11069-015-1891-7
Tang Y., Wang M., Liu Q., Hu Z., Zhang J., Shi T., et al. (2022). Ecological carrying capacity and sustainability assessment for coastal zones: A novel framework based on spatial scene and three-dimensional ecological footprint model. Ecol. Model. 466, 109881. doi: 10.1016/j.ecolmodel.2022.109881
Tian H., Cao C., Chen W., Bao S., Yang B., Myneni R. B. (2015). Response of vegetation activity dynamic to climatic change and ecological restoration programs in Inner Mongolia from 2000 to 2012. Ecol. Eng. 82, 276–289. doi: 10.1016/j.ecoleng.2015.04.098
Wang Y., Ding X., Ma Y., Yan B. (2021). System dynamics simulation for the coordinative development of socio-economy and environment in the Weihe River Basin, China. Water Policy 23, 718–736. doi: 10.2166/wp.2021.218
Wang A., Liao X., Tong Z., Du W., Zhang J., Liu X., et al. (2022). Spatiotemporal variation of ecological carrying capacity in Dongliao River Basin, China. Ecol. Indic. 135, 108548. doi: 10.1016/j.ecolind.2022.108548
Wang Y., Pan J. (2019). Building ecological security patterns based on ecosystem services value reconstruction in an arid inland basin: A case study in Ganzhou District, NW China. J. Clean. Prod. 241, 118337. doi: 10.1016/j.jclepro.2019.118337
Wang J., Wei X., Guo Q. (2018). A three-dimensional evaluation model for regional carrying capacity of ecological environment to social economic development: Model development and a case study in China. Ecol. Indic. 89, 348–355. doi: 10.1016/j.ecolind.2018.02.005
Wang C., Yu C., Chen T., Feng Z., Hu Y., Wu K. (2020). Can the establishment of ecological security patterns improve ecological protection? An example of Nanchang, China. Sci. Total Environ. 740, 140051. doi: 10.1016/j.scitotenv.2020.140051
Wang Y., Yu X., Zhao B., Xiong X., Li Y., Zhang M. (2022). Evaluation of ecological carrying capacity in Yangtze River Economic Belt and analysis of its spatial pattern evolution. Ecol. Indic. 144, 109535. doi: 10.1016/j.ecolind.2022.109535
Wang F., Yuan X., Zhou L., Zhang M. (2022). Integrating ecosystem services and landscape connectivity to construct and optimize ecological security patterns: a case study in the central urban area Chongqing municipality, China. Environ. Sci. pollut. Res. 29, 43138–43154. doi: 10.1007/s11356-021-16281-4
Wei Q., Halike A., Yao K., Chen L., Balati M. (2022). Construction and optimization of ecological security pattern in Ebinur Lake Basin based on MSPA-MCR models. Ecol. Indic. 138, 108857. doi: 10.1016/j.ecolind.2022.108857
Wei X., Shen L., Liu Z., Luo L., Wang J., Chen Y. (2020). Comparative analysis on the evolution of ecological carrying capacity between provinces during urbanization process in China. Ecol. Indic. 112, 106179. doi: 10.1016/j.ecolind.2020.106179
Wu X., Hu F. (2020). Analysis of ecological carrying capacity using a fuzzy comprehensive evaluation method. Ecol. Indic. 113, 106243. doi: 10.1016/j.ecolind.2020.106243
Xiong J., Wang X., Zhao D., Zhao Y. (2022). Spatiotemporal pattern and driving forces of ecological carrying capacity during urbanization process in the Dongting Lake area, China. Ecol. Indic. 144, 109486. doi: 10.1016/j.ecolind.2022.109486
Xu Y., Yang D., Tang L., Qiao Z., Ma L., Chen M. (2023). Exploring the impact of grain-for-green program on trade-offs and synergies among ecosystem services in West Liao River Basin, China. Remote Sens. 15, 2490. doi: 10.3390/rs15102490
Xu X., Zhang D., Zhang Y., Yao S., Zhang J. (2020). Evaluating the vegetation restoration potential achievement of ecological projects: a case study of Yan’an, China. Land Use Policy 90, 104293. doi: 10.1016/j.landusepol.2019.104293
Yang Y., Lu H., Liang D., Chen Y., Tian P., Xia J., et al. (2022). Ecological sustainability and its driving factor of urban agglomerations in the Yangtze River Economic Belt based on three-dimensional ecological footprint analysis. J. Clean. Prod. 330, 129802. doi: 10.1016/j.jclepro.2021.129802
Yang L., Niu T., Yu Q., Zhang X., Wu H. (2022). Relationship between topological structure and ecosystem services of forest grass ecospatial network in China. Remote Sens. 14, 4700. doi: 10.3390/rs14194700
Yang L., Wei W., Chen L., Chen W., Wang J. (2014). Response of temporal variation of soil moisture to vegetation restoration in semi-arid Loess Plateau, China. Catena 115, 123–133. doi: 10.1016/j.catena.2013.12.005
Yu K. (1998). Ecologically strategic points in landscape and surface model. Acta Geographica Sin. S1), 11–20.
Zhang Z., Hu B., Jiang W., Qiu H. (2023). Construction of ecological security pattern based on ecological carrying capacity assessment 1990–2040: A case study of the Southwest Guangxi Karst-Beibu Gulf. Ecol. Model. 479, 110322. doi: 10.1016/j.ecolmodel.2023.110322
Zhu Z., Mei Z., Li S., Ren G., Feng Y. (2022). Evaluation of ecological carrying capacity and identification of its influencing factors based on remote sensing and geographic information system: A case study of the Yellow River Basin in Shaanxi. Land 11, 1080. doi: 10.3390/land11071080
Keywords: ecological carrying capacity, spatiotemporal evolution, ecological security pattern, ecological restoration, West Liaohe River Basin
Citation: Zheng Y, Tang P, Dong L, Yao Z and Guo J (2024) Evaluation of ecological carrying capacity and construction of ecological security pattern in West Liaohe River Basin of China. Front. Ecol. Evol. 12:1335671. doi: 10.3389/fevo.2024.1335671
Received: 09 November 2023; Accepted: 26 February 2024;
Published: 15 March 2024.
Edited by:
Changchun Huang, Nanjing Normal University, ChinaReviewed by:
Yulong Guo, Henan Agricultural University, ChinaHuiqing Han, Guizhou Institute of Technology, China
Copyright © 2024 Zheng, Tang, Dong, Yao and Guo. This is an open-access article distributed under the terms of the Creative Commons Attribution License (CC BY). The use, distribution or reproduction in other forums is permitted, provided the original author(s) and the copyright owner(s) are credited and that the original publication in this journal is cited, in accordance with accepted academic practice. No use, distribution or reproduction is permitted which does not comply with these terms.
*Correspondence: Jianying Guo, guojy@iwhr.com