Driving factors analysis and scenario prediction of CO2 emissions in power industries of key provinces along the Yellow River based on LMDI and BP neural network
 Chuanbao Wu
 Shuang Sun
 Yingying Cui
 - College of Economics and Management, Shandong University of Science and Technology, Qingdao, China
Introduction: Power industry is one of the largest sources of CO2 emissions in China. The Yellow River Basin plays a supportive role in guaranteeing the effective supply of electricity nationwide, with numerous power generation bases. Understanding the drivers and peak of CO2 emissions of power industry in the Yellow River Basin is vital for China to fulfill its commitment to reach carbon emissions peak by 2030.
Methods: The Logarithmic Mean Divisia Index (LMDI) model was employed to explore the drivers to the change of CO2 emissions in power industries of three study areas, including Inner Mongolia Autonomous Regions, Shanxi Province, and Shandong Province in the Yellow River Basin. And Back Propagation (BP) neural network was combined with scenario analysis to empirically predict the trend of the amount of CO2 emitted by power industry (CEPI) from provincial perspective.
Results: CEPI in Inner Mongolia under the scenarios of a low degree of CO2 emissions promotion with a medium degree of CO2 emissions inhibition (LM) and a low degree of CO2 emissions promotion with a high degree of CO2 emissions inhibition (LH) scenario can reach a peak as early as 2030, with the peak value of 628.32 and 638.12 million tonnes, respectively. Moreover, in Shanxi, only CEPI under a low degree of CO2 emissions promotion scenarios (LL, LM, LH) can achieve the peak in 2025 ahead of schedule, with amounts of 319.32, 308.07, and 292.45 million tonnes. Regarding Shandong, CEPI under scenarios of a low degree of CO2 emissions promotion with a high degree of CO2 emissions inhibition (LH) and a medium degree of CO2 emissions promotion with a high degree of CO2 emissions inhibition (MH) could achieve the earliest peak time in 2025, with a peak of 434.6 and 439.36 million tonnes, respectively.
Discussion: The earliest peak time of CEPI in Shandong Province and Shanxi Province is 2025, but the peak of CEPI in Shanxi is smaller than that of Shandong. The peak time of CEPI in Inner Mongolia is relatively late, in 2030, and the peak is larger than that of the other two provinces. The per capita GDP is the most positive driving factor that contributes to the CEPI. Shandong has a strong economy, and its per capita GDP is much higher than Shanxi’s. Therefore, even under the same peak time, the CEPI in Shandong is much higher than that of Shanxi. Inner Mongolia is extensive and sparsely populated, which makes its per capita GDP rank among the top in China. In addition, Inner Mongolia’s coal-based power generation structure and high power generation also contribute to its late CO2 peak time and large CO2 peak.
1 Introduction
The negative impact of CO2 emissions from human activities on the environment is becoming increasingly evident. As the largest emitter of CO2 emissions in the world, China made a mandatory commitment to the world in 2020 to peak its CO2 emissions by 2030. Not only the birthplace of Chinese civilization and an essential ecological region in China, the Yellow River Basin, but also is home to many important energy, chemical, and basic industrial bases, with more than half of China’s coal reserves (Wu et al., 2023). In 2019, the total consumption of fossil energy and total CO2 emissions of nine provinces in the Yellow River Basin accounted for 35.1% and 40.5% of China, respectively (Zhao et al., 2022). Therefore, there is no doubt that CO2 emissions reduction effect of the Yellow River Basin is directly related to the successful achievement of China’s CO2 emission peak target. With the introduction of the significant national development strategy of ecological protection and high-quality development in the Yellow River Basin, accelerating the green and low-carbon development of high-carbon emissions industries in the Yellow River Basin and effectively has become the key to cracking the environmental dilemma and the inevitable way to achieve the goal of CO2 emissions peaking in the Yellow River Basin. The Yellow River Basin has many coal, wind and photovoltaic power generation bases, which play a supportive role in guaranteeing the effective supply of electricity nationwide (Ma and Zhang, 2020). According to the Statistics of China Electricity Council, as of the end of 2021, the installed power generation capacity of major power companies in the Yellow River Basin is about 180 GW. Among them, the installed capacity of thermal power is 140 GW, accounting for the highest percentage about 77.7%. The installed capacity of hydropower is 14.72 GW, accounting for 8.1%. The installed capacity of wind power is 17.04 GW, accounting for 9.4%. And the installed capacity of solar power is 8.67 GW, accounting for 4.8% (Xia et al., 2022). It is apparently that the large demand for electricity and the electricity production being dominated by coal-fired power generation are the main drivers for the increasing CO2 emissions in power industry of the Yellow River Basin. Hence, whether or not CO2 emissions in power industry can peak by 2030 will directly affect the time of total CO2 emissions peaking in the Yellow River Basin. Meanwhile, considering the significant differences in economic development, resource endowment, fossil energy structure, and power industry development among the provinces in the Yellow River Basin, CO2 emissions reduction pathways of power industry should be formulated according to diverse situations of different regions.
Numerous institutions and scholars have studied on total CO2 emissions at national, provincial, and city levels. For example, Ahmed et al. (2022) applied the long short-term method to examine the degree of impact of various factors on CO2 emissions and predict CO2 emissions trend in China and India. It concluded that energy consumption has the greatest effect and renewable energy has the smallest impact on CO2 emissions in both countries. Su and Lee (2020) proposed a cost- effectiveness theoretical model to explore the optimal carbon emissions trajectory and introduced an extended STIRPAT model to predict carbon emissions. The findings showed that China’s carbon emissions are likely to peak at an estimated 117.7 MtCO2e by 2028. Li et al. (2023b) used the random forest model to choose seven predictors from 26 CO2 emissions influencing indicators and constructed a BP neural network to predict CO2 emissions under five scenarios. It concluded that China can achieve its carbon peaking on time, reaching 10,434.082 Mt CO2 emissions in 2030 under the 14th Five-Year Plan scenario. Wang et al. (2022) identified the main influencing carbon factors with the help of Redundancy analysis and Monte Carlo permutation tests and developed a method for determining the status of carbon emissions at provincial level based on score evaluation. The 30 provinces were assigned to four stages, including those with significant reductions, marginal reductions, marginal increases, and significant increases based on the progress toward carbon emissions peak. Lin et al. (2023) combined the SOM (Self-organizing map) neural network method, the decoupling coefficient method and Mann-Kendall test to conduct a cluster analysis and peak carbon trend assessment of cities in underdeveloped western regions of China. The results suggested that western cities are classified into resource-dependent cities, low-carbon buffer cities, economic priority cities, and low-carbon transition cities. Dong and Li (2022) proposed the STIRPAT-IGWO-SVR model to forecast the carbon emissions of Jiangsu Provinces under five scenarios. Zhang et al. (2021) predicted the urban block carbon emissions of a city in China based on the BP neural network method.
In addition to the above, there are some researches focusing on CO2 emissions at industry level. Some scholars analyzed the main factors affecting CO2 emissions of different industries in China, including power industry, transportation industry, logistics industry (Quan et al., 2020; Liu et al., 2021; He et al., 2022). Many researches evaluated the peak situation of CO2 emissions of different sectors in China, including building, transporting, industrial, agricultural and so forth (Chen et al., 2020; Huo et al., 2021; Li et al., 2023a). For instance, Lu et al. (2020) employed an improved PSO (Particle swarm optimization) algorithm optimized BP neural network model to predict carbon emissions for heavy chemical industry and its sub-sectors from 2017 to 2035. The findings indicates that the carbon emissions in heavy chemical industry will reach peak earlier in 2021 and later in 2026 and the peaking value is in the interval of 9.3-9.5 billion tons. Fang et al. (2022) investigated the Environmental Kuznets Curve hypothesis for eight sectors in China by using regression analysis and Monte Carlo simulation. The results show that CO2 emissions from agriculture, construction, manufacturing, other industries, and transportation are highly likely to peak by 2030, while emissions from electricity and mining are likely to peak after 2030. Bakay and Agbulut (2021) forecasted the greenhouse emissions of power sector in Turkey using deep learning, support vector machine, and artificial neural network algorithms. Tang et al. (2018) established a National Energy Technology-Power model to assess the impact of advanced technology promotion and fossil energy structure shift on energy consumption and CO2 emissions in China’s power sector from a regional perspective. The result indicated that with the promotion of advanced technology and the development of renewable energy, China’s power sector would reach a peak of 3717.99 Mt CO2 in 2023. Cai et al. (2022) took a power generation enterprise as research subject and explored the pathway for power sector to achieve carbon emissions peak and carbon neutrality under five scenarios, with the help of the LEAP (Low Emission Analysis Platform) model. The results suggest that the carbon emissions in the enterprise is expected to reach a peak in 2023 under the low carbon scenarios and CCUS is the key technology to achieve carbon emissions reduction.
In summary, despite numerous studies on the influencing factors, peak and reduction pathways of CO2 emissions in various industries, the previous studies focused on CO2 emissions in power industry mostly at national level, and only a few researches shed light on power industry at provincial or regional level. Consequently, it may be more realistic to explore when and how CO2 emissions peaks in power industry from the regional perspective, which could provide targeted CO2 emissions reduction recommendations for policymakers to make decisions.
This paper took power industries in Inner Mongolia Autonomous Region, Shanxi Province, and Shandong Province as research objects, respectively, and measured CO2 emissions of power industry in each province from 2005 to 2019 based on statistical data. After that, a LMDI decomposition model was used to quantify the contribution of each influencing factor to the change of CO2 emissions in power industry. Additionally, the accuracy in predicting CO2 emissions of BP neural network and SVR model was compared with the help of evaluation indexes, and a better model was employed to combine with scenario analysis to predict future CO2 emissions of power industries in the above three provinces. The main contributions of this work include: 1) CO2 emissions of power industries in Inner Mongolia Autonomous Region, Shanxi Province, and Shandong Province from 2005 to 2019 are calculated. 2) We use the LMDI method to decompose CO2 emissions of the power industry and analyze driving factors affecting CO2 emissions in terms of power generation and power consumption. 3) We compare the prediction accuracy of BP neural network and SVR model regarding CO2 emissions with the help of evaluation indexes. 4) We set up nine scenarios and apply the trained BP neural network to predict CEPI in three provinces from 2021 to 2035 and analyze their peaking trends.
The structure of this paper is organized as follows. Section 2 introduces the current status of research subjects. Section 3 displayed the methodology and data. The results and related discussions are interpreted in Section 4. Finally, conclusions and policy implications are summarized in Section 5.
2 Case study
Inner Mongolia Autonomous Region, thanks to high-quality coal and wind energy resources endowment, in 2020, the power generation was 581.10 TWh, ranking No.2 in China, and the installed power capacity of the region was 146 GW, including the Wind power installed capacity is 37.85 GW, strongly supporting the National Action Plan for Air Pollution Prevention and Control and clean energy development in China. Furthermore, Inner Mongolia’s outgoing electricity was 208.20 TWh in 2020, ranking first among provinces in China, which ensures national energy security and enhances stable energy supply effectively (IMEB, 2022).
Shanxi Province owns three ten million kilowatts of large coal power bases(Northern Shanxi, Central Shanxi, Eastern Shanxi) that are China’s focus on the construction (GOSC, 2014). In addition, Shanxi Province ranked among the top ten in China, with a power generation of 339.50 TWh and thermal power generation of 303.25 TWh in 2020 (SXEA, 2023). Therefore, as a traditional energy province, Shanxi Province has large total CO2 emissions, high CO2 emissions intensity, and high per capita CO2 emissions, causing it challenging to accomplish the target of carbon peaking and carbon neutralization.
As one of the “Five Poles” in the development pattern of the Yellow River Basin, Shandong Province has outstanding advantages in economic development and comprehensive strength, contributing to promoting the high quality of central cities and urban clusters along the Yellow River. At the same time, according to the data from the National Bureau of Statistics, in the past decade, Shandong Province has been the largest thermal power generation province in China, which means that the power industry in Shandong Province should be assigned major responsibility for low-carbon transformation and should play a demonstration and leading role in achieving CO2 emissions reduction of the Yellow River Basin.
In short, these three provinces, as the major thermal power provinces in the Yellow River basin, are the key areas of CO2 emissions. The CO2 peaking process of their power industry directly affects the realization of the CO2 peaking target of the whole basin. Therefore, we choose these three provinces as the research objects of this paper. And the geographical location and elevation of the study area is shown in Figure 1.
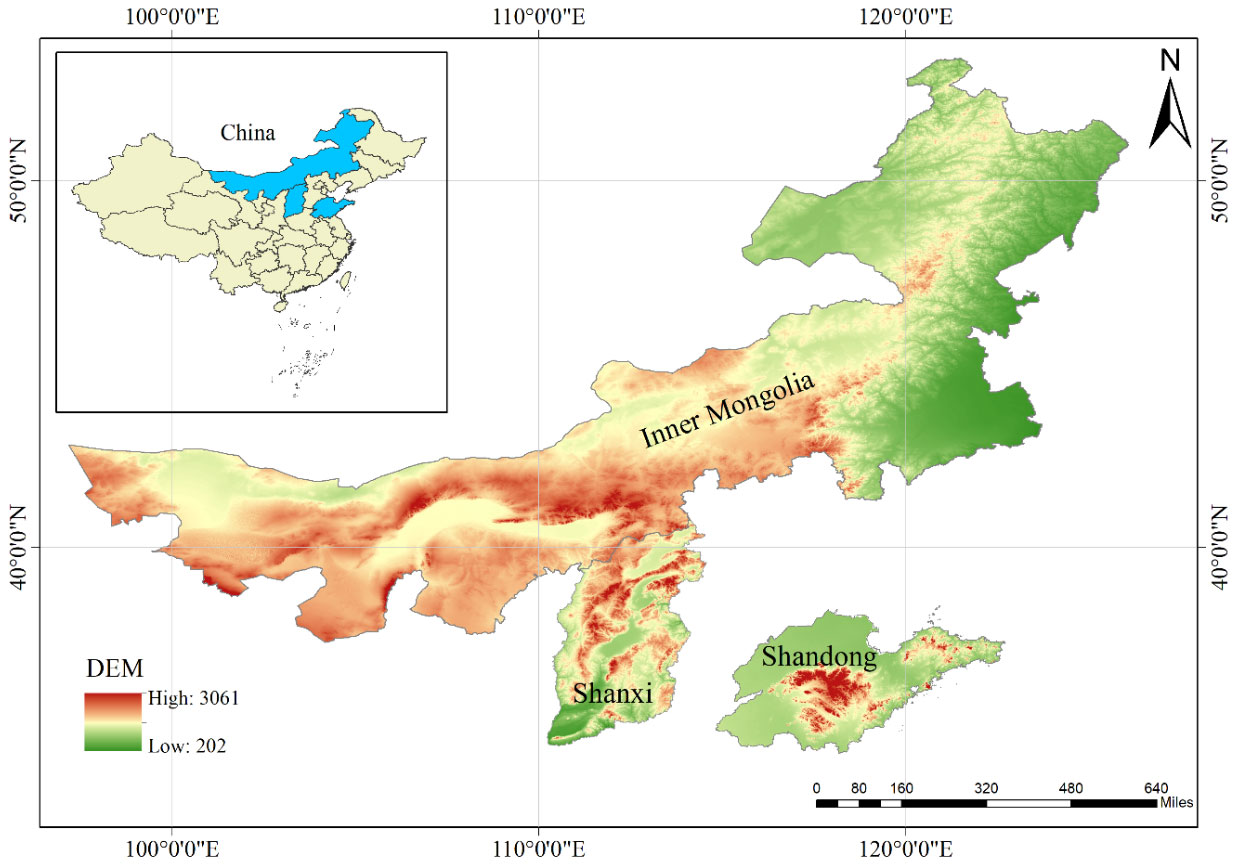
Figure 1 Geographical location and elevation of the study area.
3 Methodology and data
3.1 CO2 emissions measurement
Since it is generally believed that CO2 emissions from non-fossil energy sources are zero, the amount of CO2 emitted by power industry (CEPI) calculated in this paper are that from fossil energy sources in the process of thermal power generation. This paper refers to the method provided by the IPCC in 2006 (IPCC, 2006), which is currently more common internationally, to measure CO2 emissions. As a result of different types of major energy consumption in power industry of each province, the energy types covered in the calculation of CEPI vary from province to province, as shown in Table 1. The specific calculation formulas are shown in Equations 1 and 2:
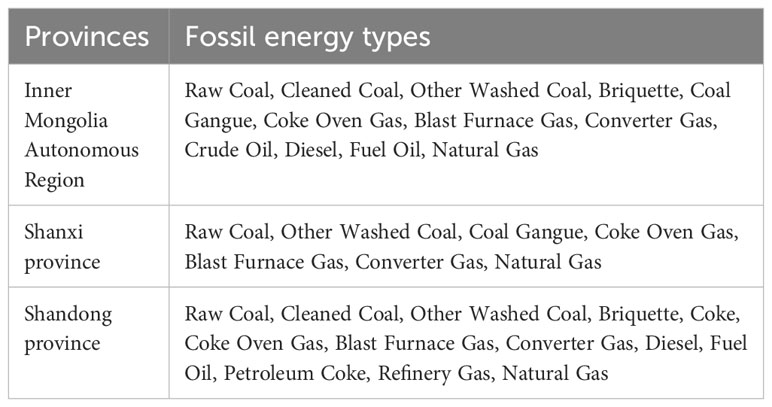
Table 1 The main types of energy consumption of power industries in three provinces.
where refers to CEPI, refers to energy type used in thermal power generation; refers to the consumption of energy type ; refers to the average low calorific value of energy type ; refers to the carbon content per unit calorific value of energy type ; refers to the carbon oxidation rate of energy type ; 44/12 refers to the ratio of carbon dioxide to the carbon molecular weight; refers to CO2 emissions per unit of electricity; refers to the thermal power generation. The specific values are shown in Table 2.
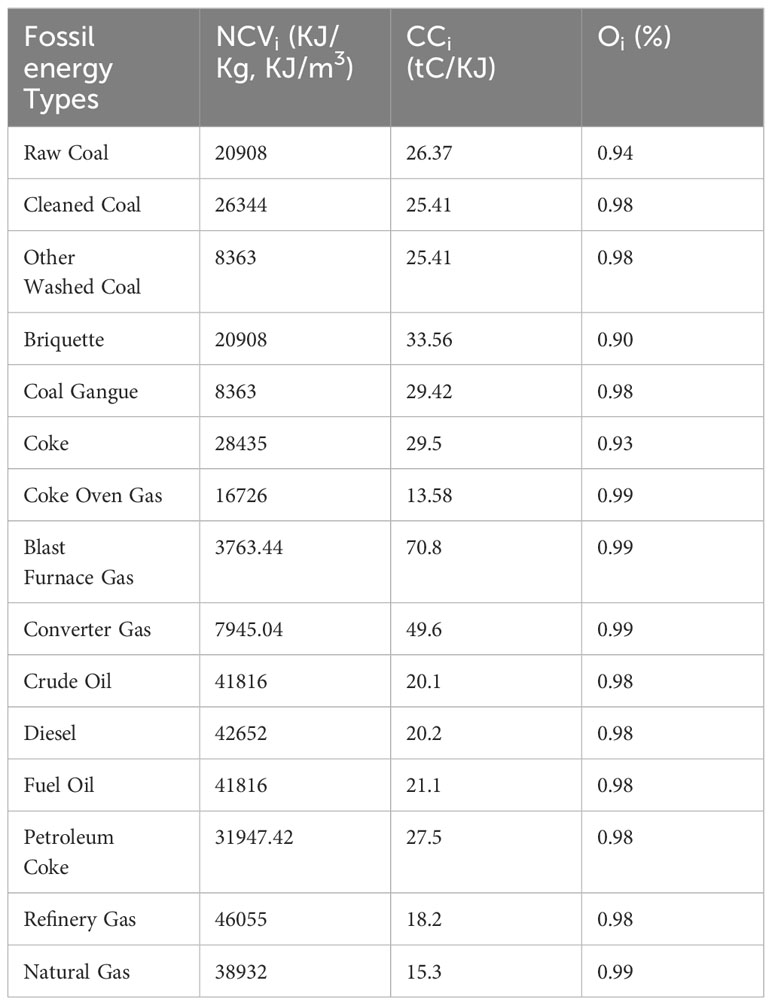
Table 2 The value of the coefficient.
3.2 Analysis of influencing factors of CEPI based on the LMDI model
The method of factor decomposition analysis can effectively reflect the degree of contribution of each influencing factor to the change of the target variable at any time. Ang (2004) proposed the LMDI method in 2004, which is widely used in factor decomposition because its advantage of complete decomposition, no residual term, and can handle zero value issues (Luo et al., 2023; Zhang et al., 2023). Accordingly, this paper decomposes the driving forces of CEPI into eight factors: carbon emission coefficient, fossil energy structure, coal consumption for power generation, power generation structure, inter-regional transfer of power, power consumption intensity, GDP per capita, and population to obtain the effect of each factor to the change of CEPI, adopting the extended LMDI method. Specifically, the related equation is as follows:
The implications of all the variables in Equation 3 are shown in Table 3.
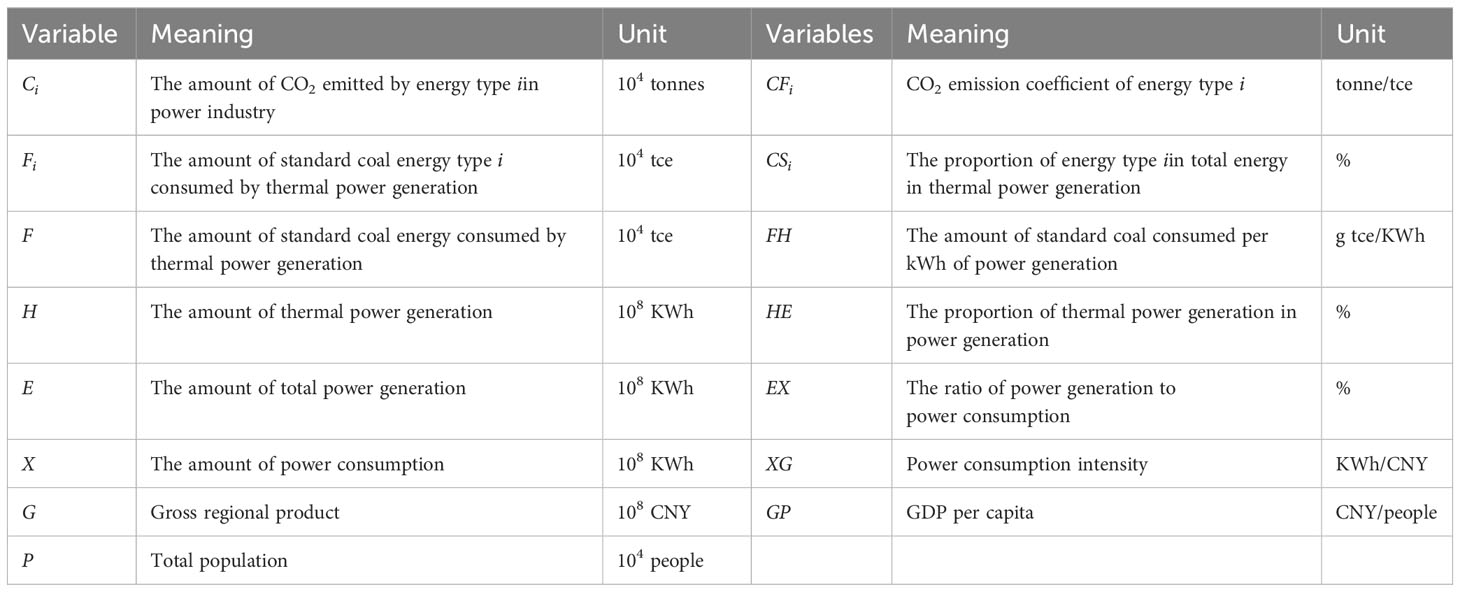
Table 3 Symbolism of each variable in LMDI model.
According to the LMDI model, the change in regional CO2 emissions from period 0 (base period) to period T (target period) can be decomposed as the sum of the contributions of each driving factor. Since the paper assumed that carbon emission coefficient of each energy type does not change over the time span studied, carbon emission coefficient effect is considered to be zero. The decomposition expressions for the other seven factors are shown in Equations 4–11:
3.3 Comparison of BP neural network and SVR model
To obtain the most accurate prediction results of CEPI, this paper adopted BP neural network and SVR model to train and analyze power industry data of each province from 2005 to 2019, respectively. Then, in order to evaluate the prediction ability and accuracy of models intuitively, the Root Mean Square Error (RMSE), Mean Absolute Error (MAE), and Mean Absolute Percentage Error (MAPE) are chosen as evaluation indicators to compare the prediction results of two models. The smaller the error indicators, the higher the prediction accuracy and the better the effect of the model. The related equations are shown in Equations 12–14:
where is the real value, is the predicted value, and is the number of samples.
3.3.1 BP neural network
BP neural network is a multi-layer feed-forward neural network with backward propagation of error, consisting of three parts: input layer, implicit layer, and output layer (Sun and Huang, 2020). BP neural network is a nonlinear complicated network model with solid stability and autonomy, often used for regression and prediction. It has at least one hidden layer, but it is challenging to determine its node counts. As a result, the ideal node figures are largely determined by experiments while building a neural network. The hidden layer’s node numbers typically clearly affect the output solutions to actual issues. Figure 2 shows the structure of a three-layer BP neural network model. The principle is as follows. Suppose there is a set of training samples , where, is the input value of the sample, is the real value. At the same time, it is assumed that the number of nodes in the input layer is , the number of nodes in the hidden layer is , the number of nodes in the output layer is , the weight and bias of the node of the input layer to the node of the hidden layer are , ,respectively, and the weight and bias of the node of the hidden layer to node of the output layer are , . The output of the hidden layer and output layer are shown in Equations 15 and 16.
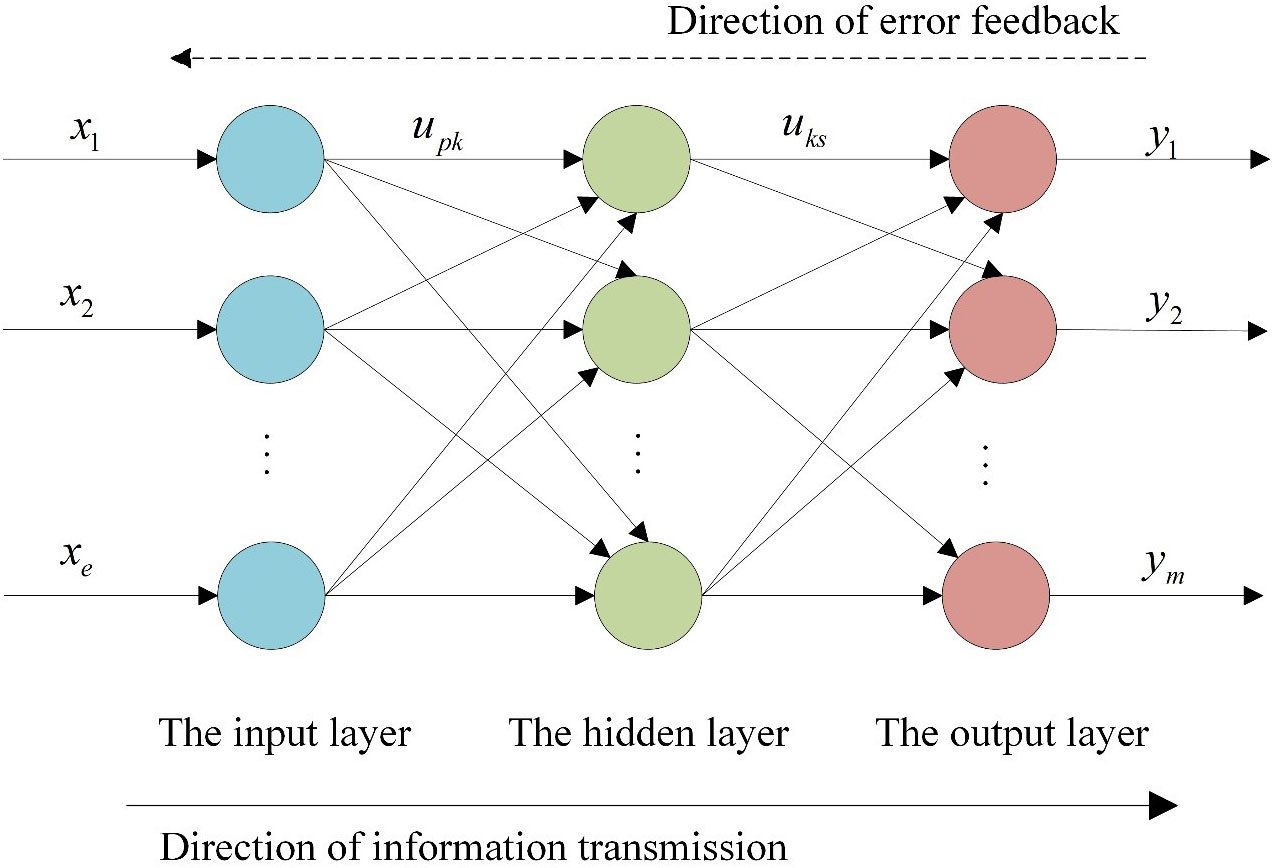
Figure 2 Schematic diagram of BP neural network.
where is the output of the hidden layer, is the output of the output layer, and is the transfer function. The error calculation is defined as Equation 17.
If is less than the expected accuracy , the accuracy requirement is satisfied. Otherwise, error back propagation is required and the calculation process is repeated until the error is within the allowed range or the maximum number of iterations is reached.
In this study, according to BP neural network construction steps, firstly, the data from fifteen samples of each province from 2005 to 2019 are normalized and pre-processed. Secondly, the four selected influencing factors are input variables of the model, and CEPI are output variable. Then, nine samples are randomly selected as training samples, the remaining six samples are chosen as test samples. Simultaneously, “tansig” and “purelin” are selected as the transfer functions of the implicit layer and output layer, respectively, and “trainlm” for the training function. Finally, the model is constructed by the training samples, the accuracy of the model is determined by the test samples, and the number of nodes in the implicit layer is determined by multiple training adjustments, so as to obtain the optimal BP neural network structure.
3.3.2 SVR model
Support vector machine (SVM) is a machine learning method that performs binary data classification in a supervised learning approach. Support vector regression (SVR) is a vital application branch of SVM, which has many strengths, such as solving nonlinear high-dimensional problems with small data size, obtaining the global optimum point in theory, and the computational complexity is independent of the number of sample dimensions, so it is widely used in function approximation and regression prediction. But it is sensitive to outliers and requires careful choice of kernel functions and parameters (Zhang et al., 2022). Its principle is to obtain a regression model on the known sample set to make and as close as possible (shown in Figure 3). The sample is shown in Equation 18 and the characteristic function of SVR model is defined as Equation 19:
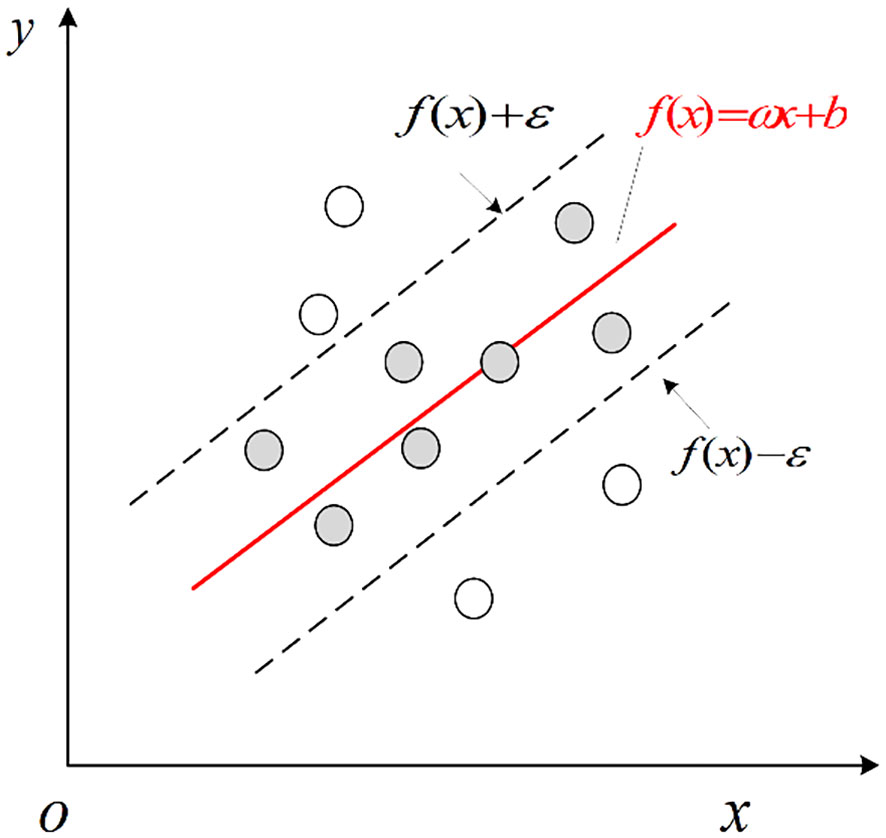
Figure 3 Schematic diagram of SVR model.
where is the input value of sample , is the output value of sample , and is the number of samples, is the weight, is the bias. Unlike the general linear model, the SVR model defines the interval on both sides of the hyperplane and calculates the loss when and only when the absolute value of the gap between and is greater than , while no loss is calculated if it is within the interval band.
The function estimation problem can be transformed into the optimization problem of Equation 20:
where is the penalty function, is the penalty factor, and is the -insensitive loss function.
In practical tasks, it is often difficult to directly determine the appropriate so that most points are within the interval band, so the relaxation variable , are introduced thereby relaxing the interval requirement of the function and allowing some training samples to fall outside the interval. Therefore, Equation 20 can be transformed into Equation 21:
By introducing the Lagrange factors , constructing the Lagrange function, and introducing the kernal function, the above optimization problem is transformed into a dual problem, and the decision function is obtained, as shown in Equations 22 and 23:
where is the kernal function, is the input value of the sample, and is the kernal function parameter.
This paper follows the steps of first normalizing the data of power industry in each province, randomly selecting nine training samples and six test samples. Secondly, the radial basis function was selected as the kernel function to process training samples and construct the -SVR model. Thirdly, we determine the penalty coefficients and kernel parameters applying the method of grid search and cross-validation and simulate the training sample data to obtain the optimal solution of the model. Fourth, the training samples and test samples were substituted into the model to output the fitted values. Finally, we judge the learning and promotion ability of the model by the relevant evaluation indexes, and repeatedly train until the optimal model is obtained.
3.4 Scenario design
According to the decomposition results of the LMDI model, it can be seen that GDP growth is the major factor in increasing CO2 emissions in all three provinces. Balancing the relationship between economic development and CO2 emission reduction and integrating the path of achieving CO2 emissions peak into the overall economic and social development is an important issue facing the realization of green and high-quality economic development. In order to more comprehensively understand the changes in CO2 emissions under different development rates and emission reduction rates of the power industry in each province, this paper divides the four variables that have a strong influence on CEPI in each province into two types of variables: CO2 emissions promotion and CO2 emissions inhibition. Furthermore, three modes of change were set for the two types of variables, respectively, including high degree, medium degree, and low degree. Then, we designed nine different development scenarios of power industry by arranging and combining six modes and set the change rate of relevant influencing factors for a planning period of five years, combining the existing data of the change rate of each influencing factor in previous years. What’s more, we regarded the medium degree of CO2 emissions promotion scenario as the baseline scenario which refers to the development scenario of the power industry in accordance with the existing planning and policies, and set the change rates of low-speed and high-speed accordingly. The CO2 emissions inhibition scenarios are set in the same way. The definition of nine scenarios of three provinces are shown in Supplementary Tables S1–3, and the specific indicators of three provinces in different scenarios are explained in Supplementary Tables S4–6.
3.5 Data source
In this study, various fossil energy consumption data are collected from the Energy Balance Sheet of Inner Mongolia, the Energy Balance Sheet of Shanxi, and the Energy Balance Sheet of Shandong in the China Energy Statistical Yearbook (NBSC, 2005–2019) from 2005 to 2019. The data on the average low calorific value of the fossil energy are from Appendix 4 in the China Energy Statistics Yearbook. Moreover, the data of carbon content per unit calorific value and carbon oxidation rate of fuels are given by Guidelines for the Preparation of Provincial Greenhouse Gas Inventories (NDRC, 2011). The National Bureau of Statistics of China (NBSC, 2019) is the source for the data related to power generation, thermal power generation, and social electricity consumption of the three provinces, and the regional GDP and population data are collected from Inner Mongolia Autonomous Region Statistical Yearbook, Shanxi Statistical Yearbook and Shandong Statistical Yearbook from 2005 to 2019 (IMBS, 2005–2019; SXBS, 2005–2019; SDBS, 2005–2019). At the same time, to eliminate the influence of the price index, we selected 2005 as the base period to calculate China’s GDP data.
4 Results and analysis
4.1 CO2 emission measurement results
CO2 emissions and CO2 emissions intensity in power industries from three provinces were measured based on Equations 1 and 2, and the results are shown in Figure 4. It can be seen that CEPI in all three provinces showed a growth trend during 2005-2019, in which CEPI in Inner Mongolia Autonomous Region grew from 119.34 to 518.20 million tonnes, with a rapid annual growth rate of 22.28%, and CEPI in Shanxi province rose from 122.56 to 263.61 million tonnes at an average annual growth rate of 7.67%. CEPI in Shandong Province increased from 199.89 to 434.87 million tonnes with the annual growth rate of 7.84%. Contrary to the increasing trend of CO2 emissions, CO2 emissions intensity presented a declining trend in the past fifteen years. From 2005 to 2019, CO2 emissions intensity of power industry in Inner Mongolia Autonomous Region fluctuated but decreased from 1145.05 to 1128.94 g/KWh. For Shanxi Province, the power industry had a decline from 948.86 to 934.05 g/KWh in CO2 emissions intensity. Moreover, CO2 emissions intensity of power industry in Shandong Provinces was down to 787.12 g/KWh in 2019, a decrease of 24.81% compared with that in 2005.
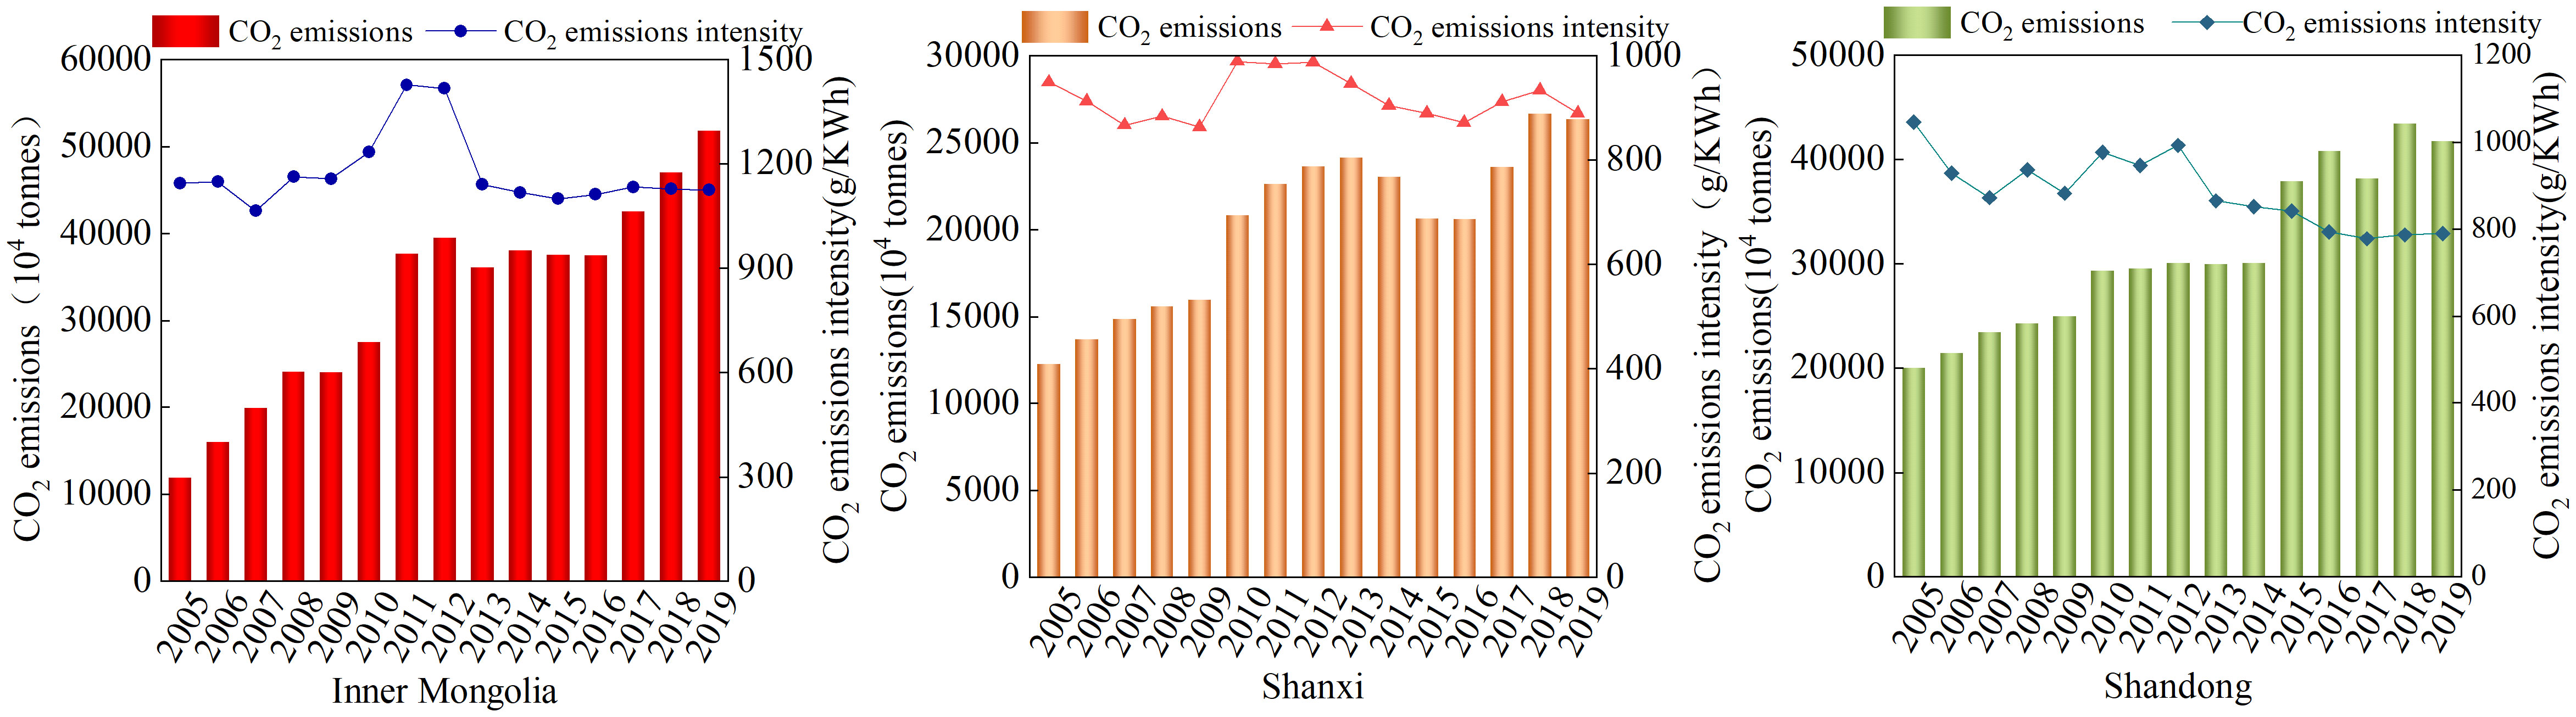
Figure 4 CO2 emissions and CO2 emissions intensity of power industry in three provinces.
4.2 LMDI decomposition results of CO2 emissions
The annual contribution value of each factor to CEPI in each province were calculated, as displayed in Supplementary Tables S7–9. And then they were summed to obtain the cumulative contribution rate of each factor, as shown in Figure 5. CEPI in Inner Mongolia increased by 398.86 million tonnes from 2005 to 2019. During this period, the GDP per capita of Inner Mongolia increased at an average rate of 21.13%, which caused 414.59 million tonnes growth in CEPI. This was the major positive driving force, contributing to 103.95% of CO2 growth. The power consumption intensity increased from 1895.74 to 2473.20 gtce/KWh, thus exhibiting a positive effect ( = 83.76 million tonnes) on CEPI. The change of fossil energy structure has accounted for an increase of 3.93 million tonnes on the growth of CEPI. Also indicated, was that the power generation structure effect was the main negative effect ( = −46.78 million tonnes) on change of CEPI, followed by inter-regional transfer of power effect ( = −27.98 million tonnes). The proportion of thermal power generation in total power generation decreased from 98.64% to 83.86% in the past years. Correspondingly, the power generation structure effect reflected a significant negative effect that suppressed 11.72% of CEPI. The coal consumption for thermal power generation has a negative effect ( = −25.14 million tonnes), and the population had no obvious effect ( = −3.52 million tonnes) on the change of CEPI.
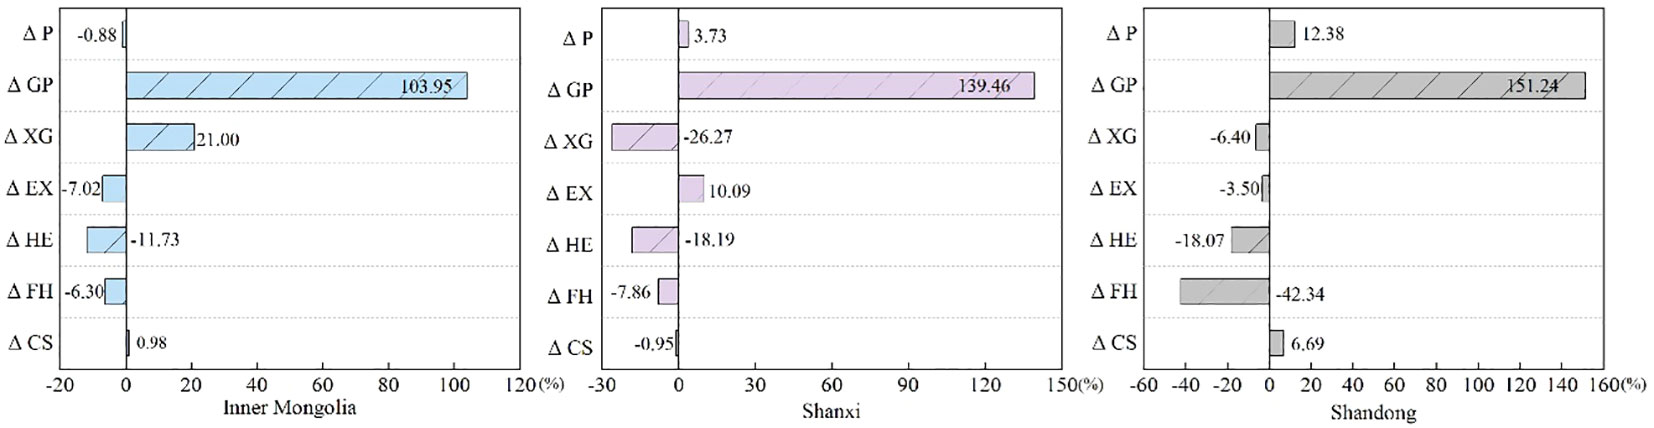
Figure 5 Cumulative contribution rate of each factor of CEPI change from 2005 to 2019 in three provinces.
By calculation, it can be clearly seen that CEPI of Shanxi Province increased by 2.15 times, with a total increase of 141.05 million tonnes. During the whole study period, economic effect, inter-regional transfer of power effect, and population effect collectively drove the increase of CEPI by 216.20 million tonnes (196.71, 14.23 and 5.26 million tonnes, respectively). On the other hand, the change of power consumption intensity, power generation structure, coal consumption for power generation, and fossil energy structure jointly offset 75.15 million tonnes of CEPI growths (−37.05, −25.67, −11.09, and −1.35 million tonnes, respectively). Obviously, from Figure 5, the GDP per capita growth from 12158.34 CNY to 32683.10 CNY was the most dominant factor in the increment of CEPI, leading to 139.46% growth in CEPI. As the ratio of power generation to power consumption growing from 1.39 to 1.49, the effect of inter-regional transfer of power became the other key cause of CEPI increase, pulling 10.09% of CEPI growth. The contribution rate of the population effect was patently weaker than the other two factors, with only 3.73%. In respect to the power consumption intensity effect, in the whole period, it reduced from 2318.98 to 1979.29 KWh/CNY, thus showing inhibitory effects on CEPI, with −26.27% of the . In the meantime, because of the decline in the ratio of thermal power generation to power generation, 18.19% of CEPI growth was inhibited. The coal consumption for power generation exhibited a negative effect on CEPI that explains −7.86% of the total change of CEPI, and the fossil energy structure had a subtle effect on CEPI, with a contribution rate of −0.95%.
With regard to Shandong Province, the whole growth of CEPI in 2019 enlarged by 1.09 times (217.98 million tonnes) compared with that in 2005. As depicted in Figure 5, the changes of CEPI were mainly influenced by four factors, which are economic effect, population effect, coal consumption for power generation effect, and power generation structure effect. Among them, the growth of GDP per capita from 15947.51 to 53412.05 CNY played a particularly prominent role in driving the increase of CEPI (329.67 million tonnes), equaling to 151.24% of throughout the study period in total. And the rise of population promoted 26.98 million tonnes CEPI increase, accounting for 12.38% of . In the matter of coal consumption for power generation, in the entire period, it decreased from 393.40 to 269.04 gtce/KWh, bringing about a reduction of 92.30 million tonnes in CEPI, amounting to −42.34% of . The power generation structure was conducive to CO2 emissions reduction owing to the decrease of the ratio of thermal power generation to power generation, thus avoiding 39.39 million tonnes of CEPI. Apart from the above factors, the change of fossil energy structure also became a positive driving force resulting in a total increase of 14.58 million tonnes CEPI, amounting to 6.69% of . The decline of power consumption intensity and inter-regional transfer of power collectively reduced CEPI by 21.57 million tonnes, with the equivalent to −6.40%, −3.50% of , respectively.
4.3 Selection result of the prediction model
Based on the preliminarily analyze in Section 4.2, four factors that have a greater impact on CEPI were selected as input variables for models in this paper, among which the factors selected for Inner Mongolia Autonomous Region are power generation structure, inter-regional transfer of power, power consumption intensity and GDP per capita, for Shanxi Province are power generation structure, inter-regional transfer of power, power consumption intensity and GDP per capita, and for Shandong Province are coal consumption for power generation, power generation structure, GDP per capita and population. Meantime, CEPI of each province are taken as the output variable. According to the above, we perform a fitting experiment comparison between BP neural network and SVR model, of which 60% of the samples are used for training and 40% are used for testing.
The optimal computational results of BP neural network and SVR model are selected for comparative analysis, as shown in Table 4 and Figure 6. Apparently, for Inner Mongolia Autonomous Region, although the accuracy of SVR model in the training period is slightly higher than that of BP neural network, the error indicators in the testing period is much larger than BP neural network. In a comprehensive view, BP neural network is more suitable than SVR model. Nonetheless, for Shanxi Province and Shandong Province, the error indicators of BP neural network are obviously smaller than that of SVR model. In addition, the prediction accuracy of SVR model is closely related to the selection of parameters. Parameter adjustment requires constant trial and error to complete, which leads to a lot of work and is prone to overfitting or poor prediction. In contrast, BP neural network can update the rules and continuously adjust the weight and threshold parameters in the neural network according to the preset parameters. In short, compared with SVR model, BP neural network in this paper has higher accuracy and superiority which can better predict the arrival of CO2 emissions peak in power industries of three provinces.
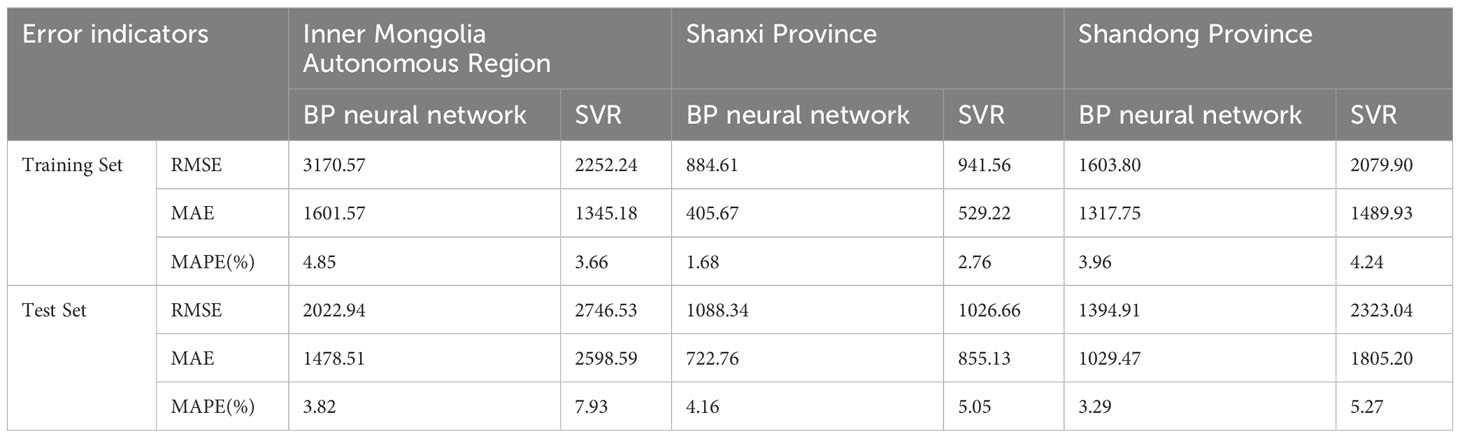
Table 4 Comparison of CEPI prediction error indicators between BP neural network and SVR model.
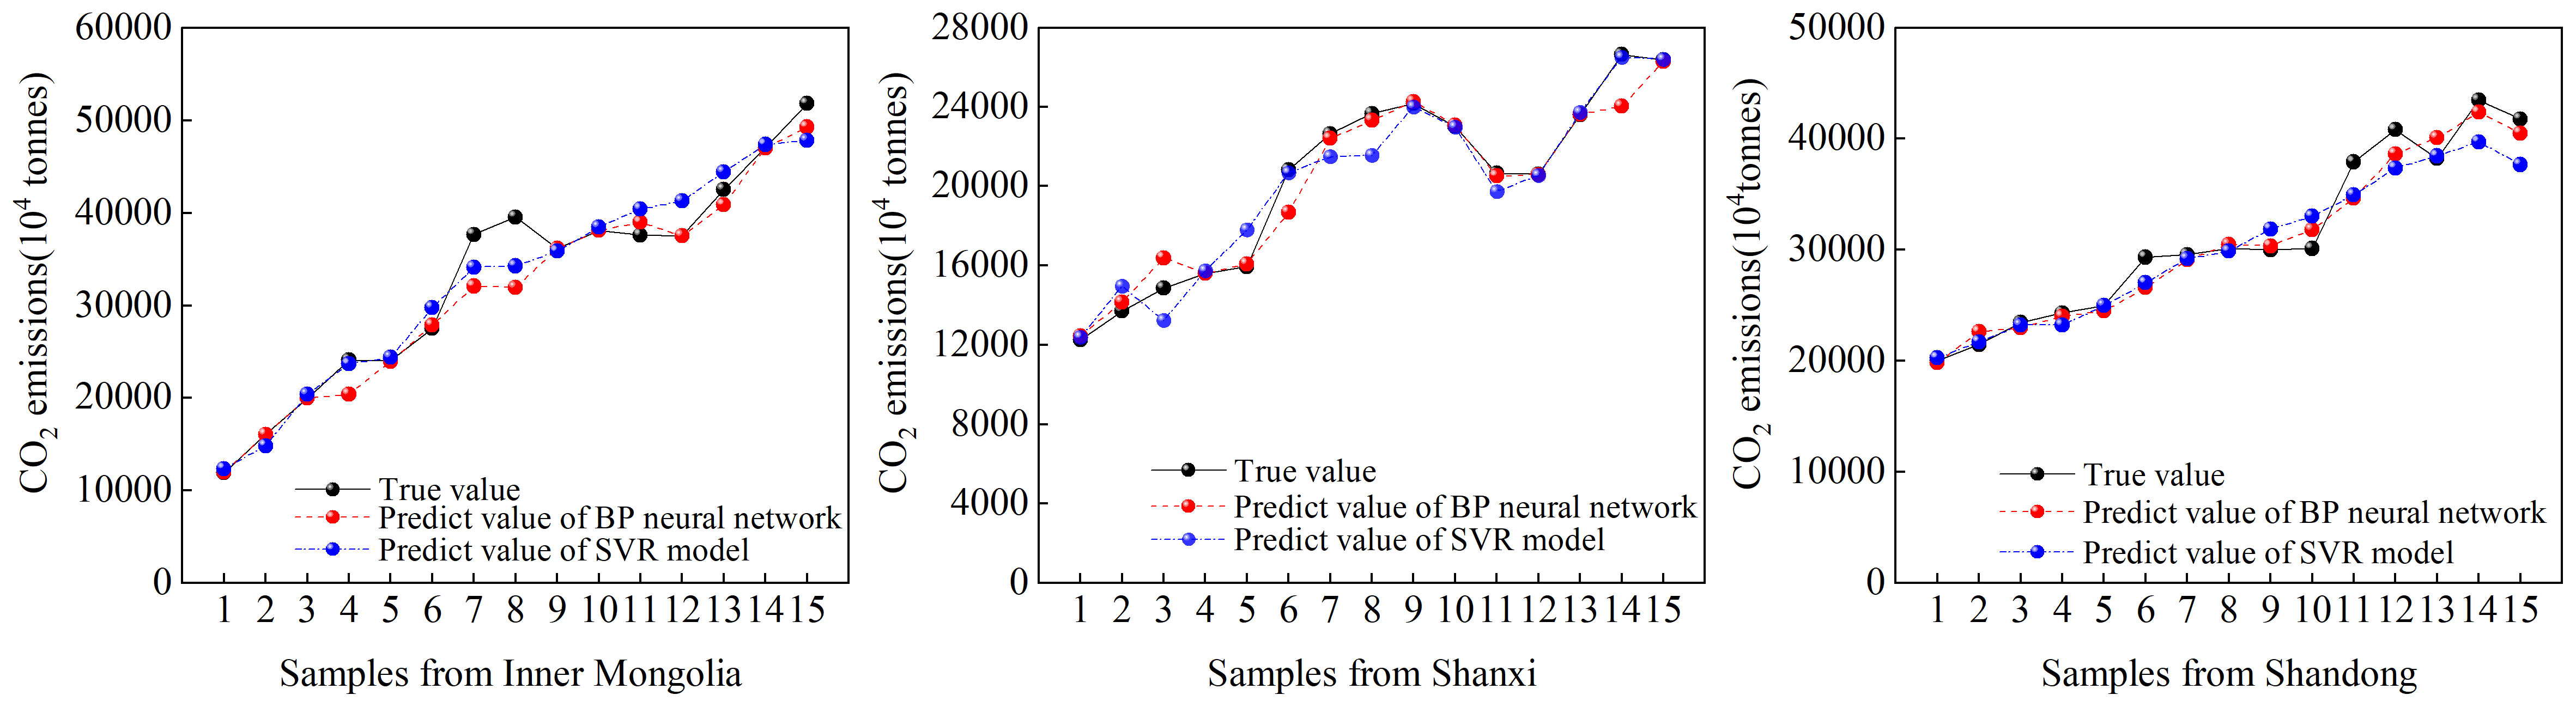
Figure 6 Comparison of BP neural network and SVR model prediction results in three provinces.
4.4 CO2 peak prediction results
By putting the normalized influencing factors data from different scenarios into the trained BP neural network for prediction, CEPI change trend of each province from 2021 to 2035 under the nine scenarios was obtained. The predicted results are displayed in Figure 7. It can be seen from the predicted results that there is a significant difference in the trend of CEPI in each province from 2021 to 2035 under nine scenarios.
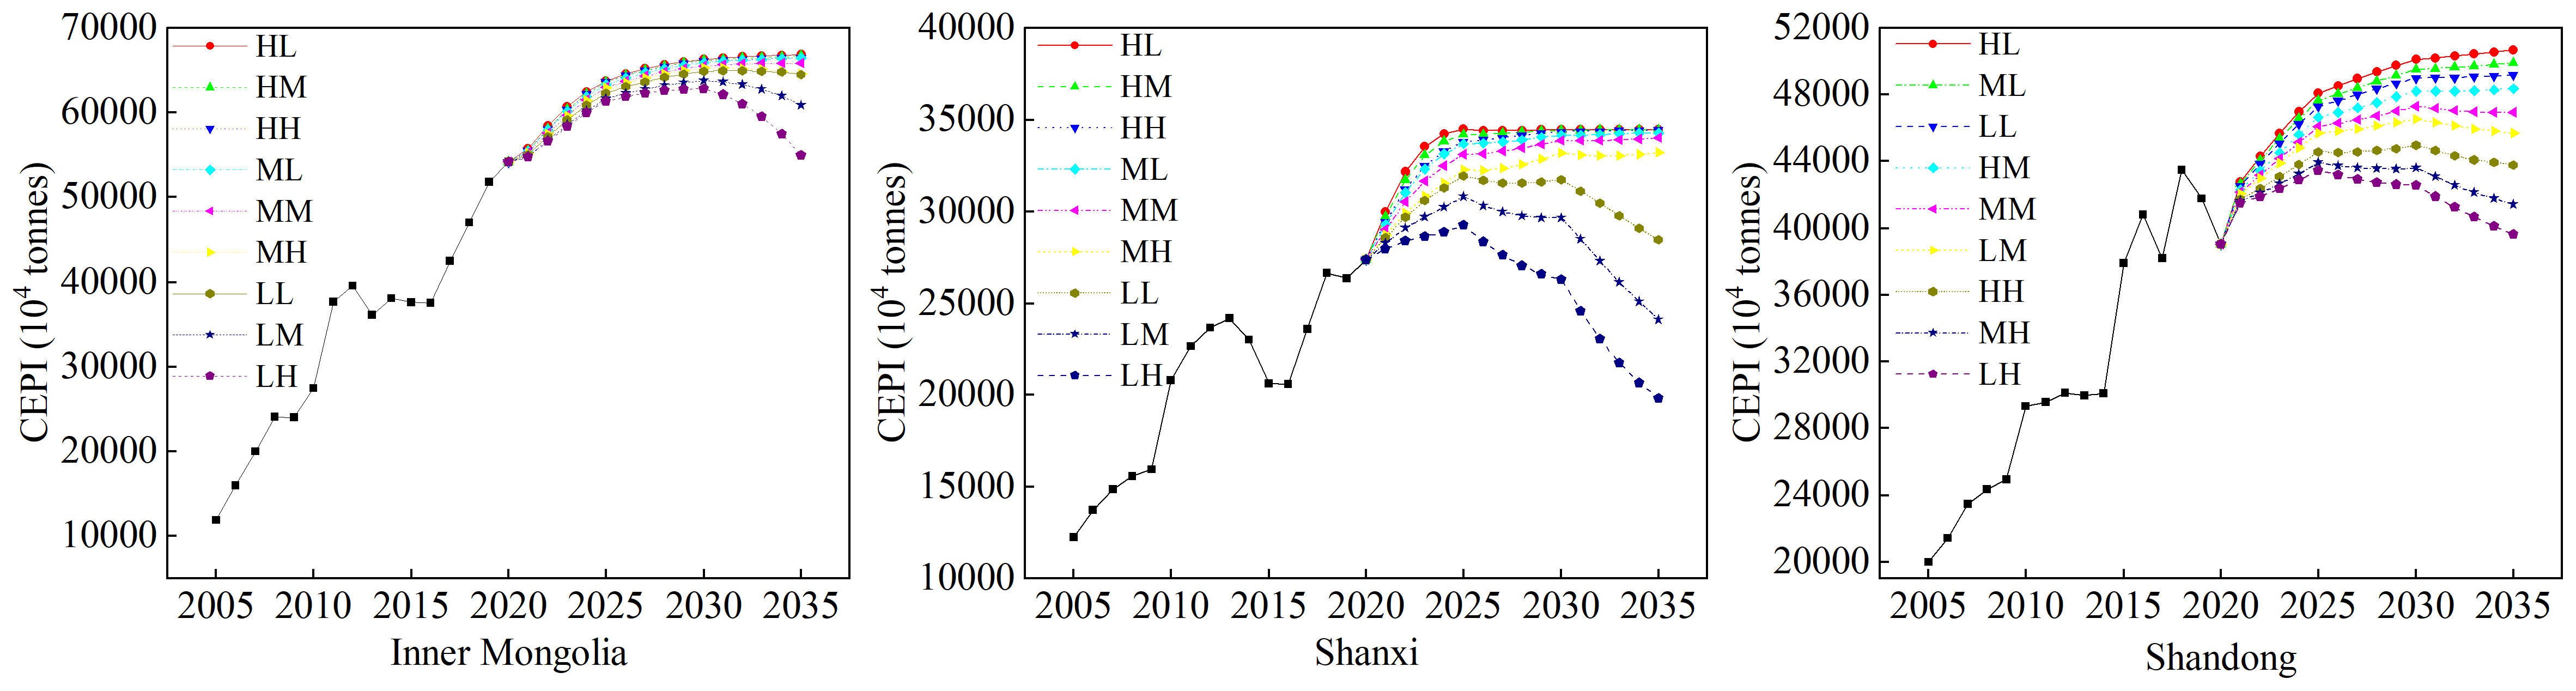
Figure 7 Prediction of CEPI in three provinces under nine scenarios.
As indicated in Figure 7 and Table 5, the total CEPI of Inner Mongolia Autonomous Region under nine scenarios, in descending order, are HL > HM > HH > ML > MM > MH > LL> LM > LH. Among them, CEPI under LM and LH scenarios will peak earliest, reaching its peak in 2030 and equaling to 638.12 and 628.32 million tonnes, respectively. Then, under MH scenario, CEPI will achieve a peak at 652.81million tonnes in 2031. After that, CEPI will peak in 2032 under LL scenario, with an amount of 649.63 million tonnes. Finally, in the MM scenario, CEPI will peak in 2034, with a peak of 658.23 million tonnes, while CEPI in the three CO2 emissions inhibition scenarios with high-speed growth of CO2 emissions promotion factors (HL, HM and HH) and ML scenario show an upward trend in CO2 emissions, none of which peak before 2035. And in 2035, CEPI under them will reach 668.28, 666.82, 664.61, and 664.47 million tonnes, respectively.
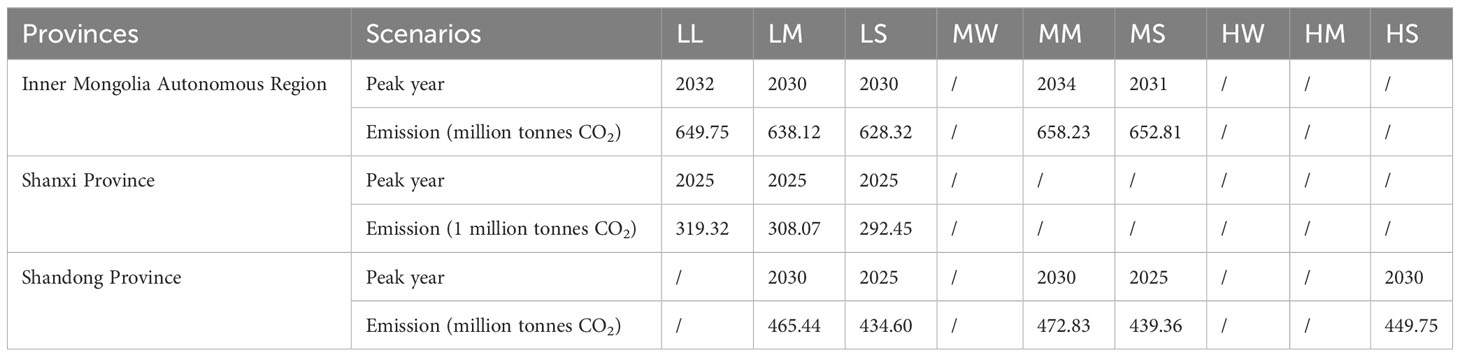
Table 5 The peak year and level of CEPI of three provinces in different scenarios.
In respect of Shanxi Province, the total CEPI under nine scenarios, in descending order, are HL > HM > HH > ML > MM > MH > LL> LM> LH. Under the three scenarios with low-speed growth (LL, LM, LH), CEPI will peak in 2025, with a peak of 319.32, 308.07, and 292.45 million tonnes, respectively, which will realize the goal of China’s total CO2 peak in 2030 ahead of schedule. Nevertheless, CEPI under other six scenarios (HL, HM, HH, ML, MM, MH) will not peak and exhibit an increasing trend year by year, accounting for 344.52, 344.49, 344.39, 342.86, 340.71, 332.03 million tonnes of CEPI in 2035.
Unlike two provinces mentioned above, Figure 7 reveals that CEPI of Shandong Provinces under different scenarios, in descending order, are HL > ML > LL > HM > MM > LM > HH > MH > LH. CEPI under LH scenario and MH scenario will achieve its peak in 2025, followed by CEPI under HH, LM, and MM scenarios which will reach a peak in 2030, with a peak of 434.60, 439.3, 448.75, 465.44, and 472.83 million tonnes, respectively. However, under the three emissions growth scenarios with low degree of CO2 emissions inhibition (HL, ML, LL) and HM scenario, by 2035, the total CEPI shows a continuous growth trend and does not peak. Among them, the fastest growth in CO2 emissions is HL scenario, followed by ML, LL, and HM scenarios, with CEPI of 506.98, 499.0, 492.08, and 483.85 million tonnes by 2035, respectively.
The decomposition result of the LMDI model proves that the growth of GDP per capita and power consumption intensity are the main reasons for the increase of CEPI of Inner Mongolia Autonomous Region. Nowadays, Inner Mongolia’s economy is in the stage of high-speed development, with a wide area and abundant resources, which leads to the high GDP per capita. At the same time, due to the heavy industrial structure, industry, especially high energy-consuming fossil energy extraction industry accounts for a relatively large share of power consumption structure. Besides, the backward technology of industrial capacity gives rise to the low efficiency of power consumption in the production process, resulting in the waste of electricity resources, thus causing high power consumption intensity and promoting the growth of CEPI. For another, the factors that inhibit CEPI are mainly power generation structure and inter-regional transfer of power. As a substantial national energy base, Inner Mongolia Autonomous Region is gradually intensifying the transformation of energy supply to green and low-carbon under the premise of doing a good job in supplying traditional fossil energy, and striving to take a lead in building a new power system with new energy as the mainstay, so that the proportion of thermal power generation in total power generation is decreasing year by year. Inter-regional transfer of power represents the regional shift of power. As a significant province of power generation, Inner Mongolia Autonomous Region’s demand for its power consumption side is increasing while it is delivering electricity to other provinces. And the trend of clean end-use energy consumption is accelerating, thus curbing the increase of CEPI. The prediction results of CEPI in Inner Mongolia visually suggest that when such factors as power consumption intensity and GDP per capita increases at a high rate, no matter how to optimize CO2 emissions inhibition factors such as power production structure and inter-regional transfer of power, the peak of CEPI cannot be achieved in 2035. Besides, when the CO2 emissions promotion factors increase at a medium rate, and the future power generation structure continues to achieve certain optimizations and adjustments to reach a medium or high reduction rate of decline, CEPI can reach the peak by 2035, but cannot by 2030. When the economy and power consumption intensity in a certain range of low-speed growth, only the CO2 emissions inhibition degree of thermal power share and inter-regional transfer of power to medium or high can ensure that CEPI in Inner Mongolia can complete the goal of peaking in 2030.
For Shanxi Province, the main factors leading to the increase in CEPI are the growing economic development level and inter-regional transfer of power, among which the growth of GDP per capita is the biggest driver of CEPI because the accelerated industrialization and urbanization will undoubtedly be accompanied by large consumption of energy and CO2 emissions. Being considered as a national coal base, power transmission base, and hub for west-east and north-south power transmission, Shanxi Province’s outbound power supply is growing year by year. Although it has secured the national energy and power supply, Shanxi Province pay the price of generating more CO2 emissions in the process of power generation. What is more, reducing the intensity of electricity consumption and the share of thermal power generation in total power generation is an effective way to diminish CEPI. Though thermal power generation is still the main power source in Shanxi Province, with the in-depth implementation of development strategies such as technological reform and energy revolution, the capacity of new energy generation will gradually appear in the future and the efficiency of electricity consumption will also be further improved. Similar to Inner Mongolia, the impact of CO2 emissions promotion factors on CEPI is stronger than that of CO2 emissions inhibition factors in Shanxi Province. When CO2 emissions promotion factors grow at medium or high rates, even through a series of initiatives such as increasing the adjustment of power supply structure on the power generation side, enlarging the installed capacity of new energy generation to ensure that the share of thermal power generation decreases at a higher rate, and improving the efficiency of end-use electricity on the demand side, CEPI remains in a growth trend year by year without peaking by 2035. Whereas, when the growth rate of CO2 emissions promotion factors is low, CEPI under all three CO2 emissions inhibition scenarios in Shanxi Province will be able to achieve carbon peaking in 2025.
The leading factors affecting CEPI in Shandong province are coal consumption for power generation, power generation structure, GDP per capita, and population. Similar to the above two provinces, GDP per capita is the factor that contributes most to CEPI. The difference is that the yearly increase in the number of populations, with considerably stimulating demand for abundant materials and energy, has become the second major factor in the increase of CEPI. Despite the fact that the population growth rate in Shandong Province in recent years is slow and the aging problem is relatively severe, the population will be stimulated to grow and continue to play a critical part in CEPI in the future, considering the supporting measures related to “three children policy” will be further improved. Concerning the CO2 emissions inhibition factors, establishing the coal power units clean and efficient to reduce coal consumption for power generation can significantly suppress the increase of CEPI, followed by the optimization of the power generation structure.
In addition, CEPI in Shandong Province is generally higher under low degree of CO2 emissions inhibition scenarios, followed by the differences in CEPI caused by economic development and population growth factors, which indicates that the inhibiting effect of CO2 emissions inhibition factors on CEPI is stronger than the driving effect of CO2 emissions promotion factors in the future period. It is noteworthy that this is not consistent with the conclusion that the GDP per capita has the most significant impact on CEPI obtained with the LMDI model above. It may attribute to the fact that as the economic development of Shandong Province enters a new normal stage, the government departments pay much more attention to energy conservation and CO2 emissions reduction, thus promoting the upgrading and transformation of power generation structure and the continuous research and development of low-carbon technologies for power. Hence, the economic growth and CO2 emissions are gradually decoupled, which represents that economic growth is no longer at the cost of resource consumption and environmental damage and the relationship between economic growth and CO2 emissions increase is no longer close (Li et al., 2022).
In terms of the low degree of CO2 emissions inhibition, if the power generation structure is adjusted slightly and the use of fossil energy cannot achieve clean and efficient enough resulting in the CO2 emissions reduction is less, it is hard to achieve the peak target by 2035 even by controlling the population and economic growth rate. Under the medium degree of CO2 emissions inhibition scenarios, the proportion of thermal power generation in the total power generation decreases at a faster rate and the effective improvement of fossil fuel power generation can remarkably suppress CEPI when the population and economy in the low and medium-speed growth rate, with the peak of CEPI reaching at 2030. In addition, it is observed that CEPI under the high degree of CO2 emissions inhibition scenarios can peak at 2030 regardless of the growth rate of the economy and population, which means that although economic growth has the greatest impact on CEPI, it will be able to peak earlier if CO2 emissions reduction technologies achieve breakthroughs on the existing basis.
In general, the earliest peak time of CEPI in Shandong Province and Shanxi Province is 2025, but the peak of CEPI in Shanxi is smaller than that of Shandong. The peak time of CEPI in Inner Mongolia is relatively late, in 2030, and the peak is larger than that of the other two provinces. Shandong has a strong economy, and its per capita GDP is much higher than Shanxi’s. Therefore, as the main factor for the increase in CO2 emissions, even under the same peak time, the CEPI in Shandong is much higher than that of Shanxi. Inner Mongolia is extensive and sparsely populated, which makes its per capita GDP rank among the top in China. In addition, Inner Mongolia’s coal-based power generation structure and high power generation also contribute to its late CO2 peak time and large CO2 peak.
5 Conclusions and policy implications
5.1 Conclusions
This paper selected Inner Mongolia Autonomous Region, Shandong Province, and Shanxi Province as representative provinces of Yellow River Basin, respectively, and measured CEPI of three provinces separately using relevant data on energy consumption of power industry from 2005 to 2019. Then an extended LMDI model was utilized to decompose different effects to understand the contribution value of each factor to CEPI in three provinces. Additionally, this study selected BP neural network with higher accuracy to make muti-scenario forecasts for CEPI peaking of three provinces from 2021 to 2035 after comparing with SVR model. Finally, we draw the following conclusions.
Firstly, according to the extended LMDI model results in all three provinces, GDP per capita is the most positive driving factor that contributes to CEPI. Furthermore, the main factor that leads to CEPI growth in Inner Mongolia Autonomous Region is power consumption intensity, and fossil energy structure has a more negligible positive effect. The factors that inhibit CEPI are, in order of magnitude, the power generation structure, the inter-regional transfer of power, coal consumption for power generation, and population. For Shanxi Province, apart from GDP per capita, the key factors that result in the increment of CEPI are inter-regional transfer of power and population. Besides, power consumption intensity and power generation structure have a negative effect on the increase of CEPI. In contrast, coal consumption for power generation and fossil energy structure play a less inhibiting role. In Shandong province’s power industry, the population is second only to GDP per capita in promoting CO2 emissions, and fossil energy structure also positively influenced it. On the other hand, the coal consumption for power generation is the primary factor inhibiting the increase of CEPI, followed by the power generation structure effect. And the effects of power consumption intensity and inter-regional transfer of power on suppressing CEPI are dramatically weaker than other factors.
Secondly, the prediction results under nine different scenarios reveal that for the power industries in Inner Mongolia Autonomous Region and Shanxi Province, CO2 emissions are generally higher under the high degree of CO2 emissions promotion scenarios, followed by the difference due to the rate change of emission inhibition factors. Only CEPI under LM and LH scenarios in Inner Mongolia Autonomous Region can meet the requirement of peaking in 2030. CEPI in Shanxi Province under the low degree of CO2 emissions promotion scenarios can peak in 2025, while the rest of the scenarios do not peak. CEPI in Shandong Province under the low degree of CO2 emissions inhibition scenarios are generally higher, followed by differences in CEPI caused by the fast or slow growth rate of GDP per capita and population. Meanwhile, under MM, HH, and LM scenarios, CEPI can peak in 2030, while in the LH and MH scenarios, the power industry can achieve CO2 emissions peak carbon in 2025 early.
5.2 Policy implications
In view of CEPI influencing factors and CEPI prediction results of three provinces provided in this paper, combined with the development of three provinces and the Yellow River Basin, this paper proposes the following policy recommendations.
Firstly, optimize the power generation structure. The decrease in the proportion of thermal power generation in total power generation is the main factor inhibiting the growth of CEPI in all three provinces, so it is indispensable for CO2 emission reduction in power industry to optimize and adjust the power generation structure dominated by thermal power generation. Inner Mongolia Autonomous Region can rely on its rich renewable energy sources, such as photovoltaic and wind energy, to increase the installed capacity of new energy sources. At the same time, enhance the capacity of renewable energy consumption by actively improving transmission and distribution pricing policies and boosting market-oriented transactions thus reducing the occurrence of wind abandonment as much as possible. Shanxi Province can promote the development of renewable energy power generation by steadily accomplishing the construction of ten million kilowatt level wind power base and photovoltaic runner bases in coal mining subsidence areas. As for Shandong province, it can give full play to its advantages of the sea and actively accelerate to build offshore wind power bases. Meanwhile, building land-based wind power and other renewable energy per local conditions is equally significant. Besides, the “other provincial electricity into Shandong Province” strategy should continue implementing to strengthen power cooperation with energy-rich areas. For example, it can actively strive for the “electricity from Gansu Province into Shandong Province” new channel construction to increase renewable energy delivery.
Secondly, reduce the intensity of electricity consumption and enhance the efficiency of electricity consumption. For one thing, industrial electricity consumption is still the main driving force behind total electricity consumption. In 2019, the industrial electricity consumption of each province accounted for more than 70% of the total electricity consumption in the whole society, respectively. Accordingly, the electricity utilization efficiency of key electricity-consuming industries needs to be urgently improved. Given the fact above, government departments should establish incentive and restraint mechanisms to reflect electricity trading and CO2 emissions reduction costs in the composition of electricity prices, with price instruments used comprehensively. Moreover, it is essential for authorities to strictly forbid the implementation of electricity price preferences for high energy-consuming and high-emission industries to promote energy saving and efficiency of enterprises, thus reducing CO2 emissions. For another thing, with the improvement of living standards, the proportion of residential household electricity consumption in total electricity consumption is also increasing yearly. Consequently, the provinces can take measures to continue improving the residential tier electricity price policy and actively increase the publicity of energy saving and electricity saving so that the awareness of low carbon and energy saving is deeply rooted in the people.
Last but not least, lower the energy consumption intensity of coal power and facilitate the clean and efficient utilization of coal. The empirical results demonstrate that the coal consumption for power supply is the most important factor that inhibits the increase of CEPI of Shandong Province, so it should further promote the “three changes” to unite, including transformation of coal power energy saving and carbon reduction, flexibility transformation and heat supply transformation. Furthermore, it deserves more attention that eliminating and shutting down unprofitable and backward coal power generation steadily to promote the cleanliness of coal power, with investment in the development of CCS technology and its infrastructure construction simultaneously. The government should also increase financial and monetary policy support to solve the problem of high costs and lack of effective return mechanisms for unit transformation and flexibility investment to enterprises. In the end, it is vital to recognize that coal power is still the first major support power source of the power system in a period of time, which means energy-saving transformation should not be eager for quick success and instant benefit. We need to promote the clean and efficient use of coal and advance the energy revolution reasonably under the premise of safeguarding economic development.
Although this study analyzes the main influencing factors of CO2 emissions from the power sector in the three provinces of the Yellow River Basin and simulates CO2 emission scenarios in the future, it still has some limitations. In this paper, only the main influencing factors of CO2 emissions in the power industry are selected for the prediction of CO2 peaking, and other minor influencing factors are not included, which may cause some deviations in the results. Furthermore, the study area of this paper only includes three typical provinces in the Yellow River basin, and the CO2 emissions of the power industry in the other six provinces are also worthy of further study.
Data availability statement
The original contributions presented in the study are included in the article/Supplementary Material. Further inquiries can be directed to the corresponding author.
Author contributions
CW: Writing – review & editing, Methodology, Validation. SS: Writing – original draft. YC: Methodology, Writing – review & editing. SX: Validation, Writing – review & editing.
Funding
The author(s) declare that financial support was received for the research, authorship, and/or publication of this article. This research was supported by the National Natural Science Foundation of China (No. 72272089), Natural Science Foundation of Shandong Province (ZR2019BG003) and Youth Innovation Technology Project of Higher School in Shandong Province (Grant No. 2021RW030).
Acknowledgments
The authors are extremely grateful to the editor and the reviewers for their insightful comments and suggestion.
Conflict of interest
The authors declare that the research was conducted in the absence of any commercial or financial relationships that could be construed as a potential conflict of interest.
Publisher’s note
All claims expressed in this article are solely those of the authors and do not necessarily represent those of their affiliated organizations, or those of the publisher, the editors and the reviewers. Any product that may be evaluated in this article, or claim that may be made by its manufacturer, is not guaranteed or endorsed by the publisher.
Supplementary material
The Supplementary Material for this article can be found online at: https://www.frontiersin.org/articles/10.3389/fevo.2024.1362541/full#supplementary-material
References
Ahmed M., Shuai C., Ahmed M. (2022). Influencing factors of carbon emissions and their trends in China and India: a machine learning method. Environ. Sci. pollut. Res. 29, 48424–48437. doi: 10.1007/s11356-022-18711-3
Ang B. W. (2004). Decomposition analysis for policymaking in energy: which is the preferred method? Energy Pol 32, 1131–1139. doi: 10.1016/S0301-4215(03)00076-4
Bakay M. S., Agbulut Ü. (2021). Electricity production based forecasting of greenhouse gas emissions in Turkey with deep learning, support vector machine and artificial neural network algorithms. J. Cleaner Production 285, 125324. doi: 10.1016/j.jclepro.2020.125324
Cai L., Duan J., Lu X., Luo J., Yi B., Wang Y., et al. (2022). Pathways for electric power industry to achieve carbon emissions peak and carbon neutrality based on LEAP model: A case study of state-owned power generation enterprise in China. Comput. Ind. Eng. 170, 108334. doi: 10.1016/j.cie.2022.108334
Chen X., Shuai C., Wu Y., Zhang Y. (2020). Analysis on the carbon emission peaks of China’s industrial, building, transport, and agricultural sectors. Sci. Total Environ. 709, 135768. doi: 10.1016/j.scitotenv.2019.135768
Dong J., Li C. (2022). Scenario prediction and decoupling analysis of carbon emission in Jiangsu Province, China. Technological Forecasting Soc. Change 185, 122074. doi: 10.1016/j.techfore.2022.122074
Fang K., Li C., Tang Y., He J., Song J. (2022). China’s pathways to peak carbon emissions: New insights from various industrial sectors. Appl. Energy 306, 118039. doi: 10.1016/j.apenergy.2021.118039
GOSC (2014) Strategic action plan for energy developmen-2020)General office of the state council of the people’s republic of China. Available online at: http://www.gov.cn/zhengce/content/2014-11/19/content_9222.htm (Accessed 20 April 2023).
He Y., Xing Y., Zeng X., Ji Y., Hou H., Zhang Y., et al. (2022). Factors influencing carbon emissions from China’s electricity industry: Analysis using the combination of LMDI and K-means clustering. Environ. Impact Assess. Rev. 93, 106724. doi: 10.1016/j.eiar.2021.106724
Huo T., Xu L., Feng W., Cai W., Liu B. (2021). Dynamic scenario simulations of carbon emission peak in China’s city-scale urban residential building sector through 2050. Energy Policy 159, 112612. doi: 10.1016/j.enpol.2021.112612
IMBS. (2005–2019). Inner Mongolia statistical yearbook. Inner Mongolia autonomous region bureau of statistics. Available online at: http://tj.nmg.gov.cn/datashow/index.htm (Accessed 20 April 2023).
IMEB. (2022). The 14th five-year plan for electricity development of inner Mongolia autonomous region (Inner Mongolia Autonomous Region Energy Bureau). Available online at: https://nyj.nmg.gov.cn/zwgk/zfxxgkzl/fdzdgknr/tzgg_16482/tz_16483/202203/t20220329_2024977.html (Accessed 20 April 2023).
IPCC. (2006). 2006 IPCC guidelines for national greenhouse gas inventories (The Intergovernmental Panel on Climate Change). Available online at: https://www.ipcc-nggip.iges.or.jp/public/2006gl/index.html (Accessed 20 April 2023).
Li R., Chen Z., Xiang J. (2022). A region-scale decoupling effort analysis of carbon dioxide emissions from the perspective of electric power industry: A case study of China. Environment Dev. Sustainability 25, 4007–4032. doi: 10.1007/s10668-022-02232-7
Li R., Yu Y., Cai W., Liu Q., Liu Y., Zhou H. (2023a). Interprovincial differences in the historical peak situation of building carbon emissions in China: Causes and enlightenments. J. Environ. Manage. 332, 117347. doi: 10.1016/j.jenvman.2023.117347
Li Y., Huang S., Miao L., Zheng W. (2023b). Simulation analysis of carbon peak path in China from a multi-scenario perspective: evidence from random forest and back propagation neural network models. Environ. Sci. Pollut. Res. 30, 46711–46726. doi: 10.1007/s11356-023-25544-1
Lin H., Zhou Z., Chen S., Jiang P. (2023). Clustering and assessing carbon peak statuses of typical cities in underdeveloped Western China. Appl. Energy 329, 120299. doi: 10.1016/j.apenergy.2022.120299
Liu M., Zhang X., Zhang M., Feng Y., Liu Y., Wen J., et al. (2021). Influencing factors of carbon emissions in transportation industry based on CD function and LMDI decomposition model: China as an example. Environ. Impact Assess. Rev. 90, 106623. doi: 10.1016/j.eiar.2021.106623
Lu C., Li W., Gao S. (2020). Driving determinants and prospective prediction simulations on carbon emissions peak for China’s heavy chemical industry. J. Cleaner Production 251, 119642. doi: 10.1016/j.jclepro.2019.119642
Luo X., Liu C., Zhao H. (2023). Driving factors and emission reduction scenarios analysis of CO2 emissions in Guangdong-Hong Kong-Macao Greater Bay Area and surrounding cities based on LMDI and system dynamics. Sci. Total Environ. 870, 161966. doi: 10.1016/j.scitotenv.2023.161966
Ma S., Zhang W. Z. (2020). Spatial and temporal development pattern and environmentally-friendly development path of electricity industry in the yellow river basin. China Acad. J. Electronic Publishing House 35, 86–98. doi: 10.16418/j.issn.1000-3045.20200107002
NBSC. (2005–2019). China energy statistical yearbook (National Bureau of Statistics of China). Available online at: http://www.stats.gov.cn/sj/ndsj/ (Accessed 20 April 2023).
NBSC. (2019). Annual data by province in 2019 (National Bureau of Statistics of China). Available online at: https://data.stats.gov.cn/easyquery.htm?cn=E0103 (Accessed 20 April 2023).
NDRC. (2011). Guidelines for the preparation of provincial greenhouse gas inventories (Climate Change Department of the National Development and Reform Commission). Available online at: https://www.ndrc.gov.cn/ (Accessed 20 April 2023).
Quan C., Cheng X., Yu S., Ye Y. (2020). Analysis on the influencing factors of carbon emission in China’s logistics industry based on LMDI method. Sci. Total Environ. 734, 138473. doi: 10.1016/j.scitotenv.2020.138473
SDBS. (2005–2019). Shandong statistical yearbook (Shandong Province Bureau of Statistics). Available online at: http://tjj.shandong.gov.cn/col/col6279/index.html (Accessed 20 April 2023).
Su K., Lee C. M. (2020). When will China achieve its carbon emission peak? A scenario analysis based on optimal control and the STIRPAT model. Ecol. Indic. 112, 106138. doi: 10.1016/j.ecolind.2020.106138
Sun W., Huang C. (2020). A carbon price prediction model based on secondary decomposition algorithm and optimized back propagation neural network. J. Cleaner Production 243, 118671. doi: 10.1016/j.jclepro.2019.118671
SXBS. (2005–2019). Shanxi statistical yearbook (Shanxi Province Bureau of Statistics). Available online at: http://tjj.shanxi.gov.cn/tjjsj/tjsj/tjnj/ (Accessed 20 April 2023).
SXEA. (2023). The 14th five-year plan for electricity development of shanxi provinceShanxi Provincial Energy Administration. Available online at: https://nyj.shanxi.gov.cn/zfxxgk/fdzdgknr/ghjh/202303/t20230302_8076246.html (Accessed 20 April 2023).
Tang B., Li R., Yu B., An R., Wei Y. (2018). How to peak carbon emissions in China’s power sector: a regional perspective. Energy Policy 120, 365–381. doi: 10.1016/j.enpol.2018.04.067
Wang M., Wang P., Wu L., Yang R., Feng X., Zhao M., et al. (2022). Criteria for assessing carbon emissions peaks at provincial level in China. Adv. Climate Change Res. 13, 131–137. doi: 10.1016/j.accre.2021.11.006
Wu H., Yang Y., Li W. (2023). Analysis of spatiotemporal evolution characteristics and peak forecast of provincial carbon emissions under the dual carbon goal: Considering nine provinces in the Yellow River basin of China as an example. Atmospheric pollut. Res. 14, 101828. doi: 10.1016/j.apr.2023.101828
Xia Z., Pan L., Yang F. (2022). Analysis on eco-environmental protection effect and problems of electric power enterprises in Yellow River Basin. China Power Enterprise Manage. 34, 34–38.
Zhang Y., Liu Y., Wang J., Zhang T. (2022). State-of-health estimation for lithium-ion batteries by combining model-based incremental capacity analysis with support vector regression. Energy 239, 121986. doi: 10.1016/j.energy.2021.121986
Zhang J., Yan Z., Bi W., Ni P., Lei F., Yao S., et al. (2023). Prediction and scenario simulation of the carbon emissions of public buildings in the operation stage based on an energy audit in Xi’an, China. Energy Policy 173, 113396. doi: 10.1016/j.enpol.2022.113396
Zhang X., Yan F., Liu H., Qiao Z. (2021). Towards low carbon cities: A machine learning method for predicting urban blocks carbon emissions (UBCE) based on built environment factors (BEF) in Changxing City, China. Sustain. Cities Soc. 69, 102875. doi: 10.1016/j.scs.2021.102875
Keywords: provincial power industry along the Yellow River, CO2 emissions peak, Logarithmic Mean Divisia Index, back propagation neural network, scenario prediction
Citation: Wu C, Sun S, Cui Y and Xing S (2024) Driving factors analysis and scenario prediction of CO2 emissions in power industries of key provinces along the Yellow River based on LMDI and BP neural network. Front. Ecol. Evol. 12:1362541. doi: 10.3389/fevo.2024.1362541
Received: 28 December 2023; Accepted: 29 February 2024;
Published: 15 March 2024.
Edited by:
Wei Sun, Sun Yat-Sen University, ChinaReviewed by:
Cong Chen, University of Science and Technology Beijing, ChinaYing Zhu, Xi’an University of Architecture and Technology, China
Xiaowei Sun, China Waterborne Transport Research Institute, China
Copyright © 2024 Wu, Sun, Cui and Xing. This is an open-access article distributed under the terms of the Creative Commons Attribution License (CC BY). The use, distribution or reproduction in other forums is permitted, provided the original author(s) and the copyright owner(s) are credited and that the original publication in this journal is cited, in accordance with accepted academic practice. No use, distribution or reproduction is permitted which does not comply with these terms.
*Correspondence: Chuanbao Wu, wucb@sdust.edu.cn