Article

Predicting Risk of and Motives behind Fraud in Financial Statements of Jordanian Industrial Firms Using Hexagon Theory

by
Ahmad Ahed Bader
1,*,
Yousef A. Abu Hajar
1,
Sulaiman Raji Sulaiman Weshah
2 and
Bisan Khalil Almasri
3
1
Department of Financial and Administrative Sciences, Aqaba University College, Al-Balqa Applied University, Aqaba 77110, Jordan
2
Department of Accounting and Accounting Information System, Amman University College for Financial Administrative Sciences, Al-Balqa Applied University, Amman 11831, Jordan
3
Accounting Department, Business School, Applied Science Private University, Abu Nussair, Amman 11937, Jordan
*
Author to whom correspondence should be addressed.
J. Risk Financial Manag. 2024, 17(3), 120; https://doi.org/10.3390/jrfm17030120
Submission received: 28 January 2024 / Revised: 1 March 2024 / Accepted: 10 March 2024 / Published: 15 March 2024
(This article belongs to the Special Issue Risk Planning and Management in Companies)

Abstract

:
This study intends to identify the motives that lead to increasing or fighting the fraud risk in the Financial Statements (FSs) of industrial companies whose shares are traded in regulated and unregulated markets at the Amman Stock Exchange (ASE) based on the Hexagon theory, which divides the motives for fraud into six factors. The study relied on secondary data to collect and measure the study variables by extracting them from the annual reports that were published by those companies on the website of the ASE during the period of 2012–2017. The collected data were analyzed using the logistic regression model on the SPSS program. The results confirmed that the return on assets (ROA), percentage of independent members in audit committees, and tone-related party transactions had a statistically significant relationship with predicted fraudulent FSs, where these three variables belong to pressure, opportunity, and collusion fraud motives, respectively. Thus, it is worth mentioning that this study is distinguished from previous studies that examined the issue of fraud in Jordanian companies by detecting the motives of fraud according to the Fraud Hexagon theory. Moreover, some of the fraud motives were measured using new variables such as a change in inventory, the age of auditing committee’s members, and tone-related party transactions.

1. Introduction

Accounting, as a profession, has witnessed significant development, facilitated by international accounting organizations. Entities like the International Accounting Standards Board (IASB) issue standards to regulate the profession, providing a foundation for the work of accountants and ensuring the reliability of Financial Statements (FSs). The adoption of these standards, known as International Financial Reporting Standards (IFRS), by many countries has contributed to their high reliability with financial market officials, often mandating listed companies to adhere to IFRS for FSs preparation. Despite these advancements, the accounting and auditing profession still grapples with global accounting fraud, leading to substantial annual losses for companies and eroding investor confidence.
The annual loss ratio incurred by companies stands at 5% of their revenues, with fraudulent cases costing more than USD 3.6 billion (ACFE 2022, p. 8), underscoring the substantial impact of fraud. This not only results in financial losses but also undermines investor confidence, as seen in the case of Enron (Bao et al. 2020). ACFE reports indicate a 49% increase in corporate fraud incidents from 2014 to 2022 (ACFE 2014, 2022). To effectively combat fraud, understanding its characteristics, strengthening internal control systems, and diffusing an integrity culture into companies are essential. This study aims to contribute to this understanding, particularly in the context of Jordan’s Amman Stock Exchange (ASE), a developing market that is susceptible to financial fraud.
Previous studies examining fraud among companies that are listed on the ASE have confirmed the use of fraudulent methods, including income smoothing, earnings management, and FS fraud (Saleh et al. 2021; Al-Natsheh and Al-Okdeh 2020; Alrjoub et al. 2021; Al-Daoud et al. 2023). The existence of such studies sheds light on the motives behind fraudulent practices and aids in efforts to combat and mitigate them effectively.
Based on governance rules and international auditing standards, the preparation of FSs that are free of fundamental errors is the responsibility of accountants and management within companies. Hence, it is imperative for companies to establish robust internal control systems that are capable of effectively and efficiently managing the risk of fraud. Auditing standards emphasize not only the importance of internal controls but also underscore the role of external auditors in formulating plans and assessing the risk of fraud to reasonably ensure the absence of fraud or misrepresentation in FSs during the auditing process (DeZoort and Harrison 2018).
However, a pertinent question arises: are these guarantees and measures sufficient to curb the phenomenon of fraud? This question gains significance in light of ongoing financial fraud incidents within international companies, such as the case of Nisan, who uncovered accounting errors perpetrated by the company’s chairman. These errors involved the concealment of his actual income, totaling JPY 5 billion, which was not disclosed in the company’s FSs (Shimamura 2023, p. 116).
The fraud in FSs underscores the importance of ongoing research in accounting studies. Accountants, auditors, and financial managers bear the responsibility of managing the risks associated with fraud detection (Tang and Karim 2019). However, the dynamic nature of fraud tools and methods necessitates continuous skill development and vigilance (Tang and Karim 2019). While international auditing standards address fraud in FSs, challenges persist, especially in non-financial information, due to variations in auditors’ interpretation and implementation of standards (Tang and Karim 2019). Therefore, auditors should exploit the challenges that face fraud studies and turn them into achievable opportunities in order to combat the fraud scourge of FSs (Amiram et al. 2018).
Numerous theories and models have been developed to explain the phenomenon of financial fraud and identify its underlying causes. Some prominent examples include the fraud triangle theory proposed by Cressey (1950), the fraud diamond theory introduced by Wolfe and Hermanson (2004), the fraud pentagon theory presented by Marks (2012), and the S.C.O.R.E Model outlined by Vousinas (2019), which extends to the S.C.C.O.R.E. model. It is worth noting that the S.C.C.O.R.E model, by incorporating the collusion motive, results in what is commonly referred to as the Fraud Hexagon theory, which encompasses six motives for fraud.
Various theories, such as Fraud Hexagon and Crow’s fraud pentagon, aim to explain financial fraud and the motives behind it. Despite their potential, the utilization of these theories remains limited (Pamungkas et al. 2018). To address this, researchers have developed predictive models like the M-score (Beneish 1999) and F-score (Dechow et al. 2011) to detect and predict FSs fraud. This study adopts the F-score to predict FSs with expected fraud, employing Fraud Hexagon theory to identify underlying motives.
It is noteworthy that the F-score model comprises a series of questions, the outcome of which is derived by inputting certain figures that are extracted from the FSs of the target company to predict the likelihood of fraud. If the result of this model equals or falls below 1, it suggests a prediction of no fraud. Conversely, if the result surpasses 1, it implies a prediction of potential fraud in the FSs of the company under examination. For further elaboration, please refer to Section 3.2.
Conducted on a sample of listed and Over-The-Counter industrial companies in the ASE from 2012 to 2017, this study holds significant implications for a developing country like Jordan (Abdullahi and Mansor 2018). Understanding fraud characteristics and motives is crucial for decision-makers and market regulators, as it assists in reducing fraud occurrences and enhancing investor confidence. Reurink (2018) emphasized the importance of identifying the impact of financial fraud and its methods on financial markets in developing countries, examining regulatory and legal gaps that may increase the likelihood of fraud and conducting further studies on financial fraud.
Reviewing previous studies on fraud motives reveals significant disparities in the measurement and outcomes of these motives. This highlights a challenge in generalizing the results of prior studies on fraud motives to all countries, given the distinct economic, legal, and cultural conditions in each nation. Consequently, these variations among countries serve as an impetus for researchers to delve into the motives behind fraud, contributing valuable insights to update laws and procedures that are aimed at combating fraudulent activities.
Moreover, the motives for companies engaging in fraud within the same sector are subject to change over different periods. This becomes evident when comparing the results of three studies that investigated fraud motives using the Hexagon Fraud theory for industrial companies that were listed on the Indonesian Stock Exchange. For instance, the study conducted by Tarjo and Sakti (2021) analyzed fraud motives from 2010 to 2018, revealing statistically significant relationships between fraud and the pressure motive (measured by the return on assets (ROA), leverage, and change in assets ratios), opportunity motive (measured by the change in the account receivables ratio), and arrogance motive (measured by CEO duality).
Similarly, Alfarago et al. (2023) examined fraud motives from 2015 to 2019, with results indicating that only the pressure motive (measured by the change in total assets ratio) had a statistically significant association with fraudulent FSs. Ultimately, Sikarini and Kurniawati’s (Sikarini and Kurniawati 2023) study suggests that the rationalization motive (measured by audit opinion) and pressure motive (measured by the change in total assets ratio) were the predominant motives for industrial companies engaging in fraudulent FSs from 2019 to 2021.
The current study is exploratory in nature, aiming to uncover the motives behind fraudulent practices among listed and Over-the-Counter industrial companies on the ASE during the period from 2012 to 2017. Achieving this objective contributes to understanding the motives for fraud for researchers, decision-makers, users of FSs, and auditors. This understanding enables them to manage the risk of fraud more effectively, particularly given the limited research in this area that has been applied to industrial companies listed on the ASE.
Moreover, a review of previous studies applied to Jordanian companies reveals that these studies primarily relied on the triangle theory to uncover fraud motives, rather than utilizing the Hexagon theory. In contrast, studies that were conducted in countries other than Jordan to uncover fraud motives according to the Hexagon theory show variations in results due to differences in the variables that were used to measure these motives. Therefore, this study incorporates additional variables to measure fraud motives, such as changes in the inventory, the age of auditing committee members, and the tone of related party transactions. By including these variables, the study aims to broaden researchers’ perspectives to capture fraud motives more comprehensively, particularly given the existing contradictions in the results of prior studies.
The study findings revealed that ROA (pressure motive), the percentage of independent members in audit committees (opportunity), and tone-related party transactions (collusion) exhibited statistically significant relationships with predicted fraudulent FSs. This outcome bears significant implications for decision-makers, investors, and auditors alike.
For instance, auditors should broaden the scope of sample points and the depth of evidence related to ROA components including revenues, expenses, and assets. They should meticulously scrutinize agreements and contracts that are entered into by companies with related parties, exercising a high degree of professional skepticism and reasonableness. Additionally, auditors should reduce the accepted level of risk for accounts of this nature.
Moreover, the study’s results equip investors with enhanced analytical capabilities, empowering them to utilize the F-score model to forecast fraud in a company’s financial reports and incorporate it into their risk assessment for investment decisions. Furthermore, decision-makers are advised to consider amendments to governance regulations and elevate the proportion of independent members within companies’ audit committees based on these findings.
In conclusion, the scourge of fraud persists, resulting in substantial losses for companies and investors, thereby negatively impacting national economies and investor confidence. This underscores the need for heightened efforts by stakeholders to mitigate and combat fraud effectively. Moreover, there is a pressing need for further research on fraud in financial reporting to deepen stakeholders’ understanding of this pervasive issue. By expanding knowledge and awareness, stakeholders can better address the challenges that are posed by fraud and work towards building more resilient and transparent financial systems.
This paper is structured into six sections—an introduction, literature review, research materials, results, discussion, and conclusion—and suggestions for future studies.

2. Literature Review and Hypothesis Development

Numerous studies and theories have emerged to comprehend fraud, its various types, and the motivations driving individuals to engage in fraudulent activities. An enhanced understanding of the fraud phenomenon empowers lawmakers and decision-makers, facilitating more effective anti-fraud measures and contributing to the overall economic well-being of nations.
Fraud in FSs manifests through manipulations of accounting figures, omissions of financial processes, or incorrect applications of accounting principles, leading to errors or misrepresentations in FSs (Pramana et al. 2019). Given that FSs are crucial products influencing investor decisions, any manipulation or fraud by accountants and financial managers harms investor interests, erodes confidence, and deters investments in capital markets upon discovery (Md Nasir et al. 2018). Despite regulatory and market participants’ efforts to detect and prevent fraud in FSs, it remains a challenging task (Li and Yang 2019).
The prosperity of financial markets hinges on the transparency and reliability of companies’ FSs. While auditors’ opinions contribute to enhancing FSs’ reliability, fraud persists, emphasizing the need for auditors to play a more proactive role in reducing fraud (Kizil and Kasbasi 2018). External auditors, who are responsible for ensuring fair presentation of FSs, have a limited role in fraud detection, as evidenced by the 4% discovery rate of fraud cases (ACFE 2022; Rustiarini et al. 2021). Relying solely on external auditors for fraud detection is insufficient, necessitating additional methods to bolster anti-fraud procedures.
Understanding the motives behind fraud in companies is essential for developing effective anti-fraud measures. Scholars have proposed various theories to grasp the fraud phenomenon. Cressey’s fraud triangle theory from the 1950s identified three motives: pressure (financial obligation), opportunities, and justification (rationalizations) (Cressey 1950). Wolfe and Hermanson (2004) expanded on this with the diamond fraud theory, introducing a fourth element, ability. Marks (2012) added efficiency and arrogance to create the fraud pentagon theory. Vousinas (2019) further extended this with the Fraud Hexagon theory, introducing collusion as the sixth element.
In the previous paragraph, the evaluation of fraud theories related to motives was discussed, highlighting the Hexagon theory that was developed by Vousinas in 2019, which comprises six motives. In this paragraph, the meanings of these motives will be briefly elucidated, along with how they contribute to incidents of fraud in companies.
The pressure motive arises when companies or individuals face circumstances that compel them to commit fraud such as financial constraints or the need to meet expectations that are placed upon them. Drawing on the case of fraud perpetrated by Enron, we observe that the company manipulated its profits to maintain a favorable financial performance, meeting the shareholders’ expectations (Tebogo 2011). Consequently, investors’ aspirations and their anticipations of positive outcomes from the company exerted pressure on its management to engage in fraudulent activities.
Regarding the motive opportunity, the absence of effective oversight and its inherent weakness create opportunities for individuals and companies to engage in fraudulent behavior. When a person inclined toward fraud recognizes an opportunity in the absence of moral constraints, they are likely to exploit it for personal gain without regard for others. For instance, in the case of Worldcom, which collapsed due to financial scandals, one of the contributing factors was the inadequate oversight by the board of directors over the company’s CEO. This lack of oversight provided the CEO with an opportunity to perpetrate fraud and manipulate the company’s accounts (Çakali 2022).
The motive of collusion arises from the involvement of a group of individuals in deceiving and defrauding others, often through coordinated agreements that are aimed at deceit. Transactions involving related parties can sometimes be deceptive agreements that undermine the interests of stakeholders. In the case Worldcom, it is evident that the company’s CEO borrowed USD 400 million at a low competitive interest rate to finance personal interests and settle personal debts, further exacerbating the company’s list of financial scandals and manipulations (Çakali 2022). Consequently, this transaction deprived the company’s shareholders of potential revenue that could have been generated if the funds had been invested in the company’s operations.
Competence motivation arises when individuals possess the capability to commit fraud due to their skills, knowledge, and values, which enable them to engage in fraudulent activities. In the case of the fraud incident at Tyco, two executives within the company perpetrated the fraud by leveraging their authority, abilities, and expertise to exploit the company’s resources for fraudulent purposes (Therese and Jakobsen 2008, p. 17).
The motive of arrogance arises when an individual, endowed with power and authority, feels above the laws and procedures that have been established by the company, prompting them to engage in fraudulent, manipulative, and exploitative behavior. In the case of the fraud incident at Tyco, investigators revealed that the company’s CEO purchased homes for his personal use through the company’s loan program, subsequently selling these homes to some of the company’s subsidiaries at prices three times higher than their market value (Therese and Jakobsen 2008, p. 18) This highlights how the authority vested in the CEO of Tyco and the exploitation of his position contributed to fraudulent activities being carried out within the company.
The motive of rationalization emerges when a fraudulent individual justifies to themselves why they committed fraud, believing that they deserve the gains that were obtained through fraudulent means due to their rationalization. This was evident in the case of the fraudsters at Adelphia, where the company faced challenging financial conditions, leading to the distortion of FSs to portray the company as performing well. This manipulation was rationalized by asserting that it would be rectified once the company emerged from its financial crises (Therese and Jakobsen 2008, p. 29).
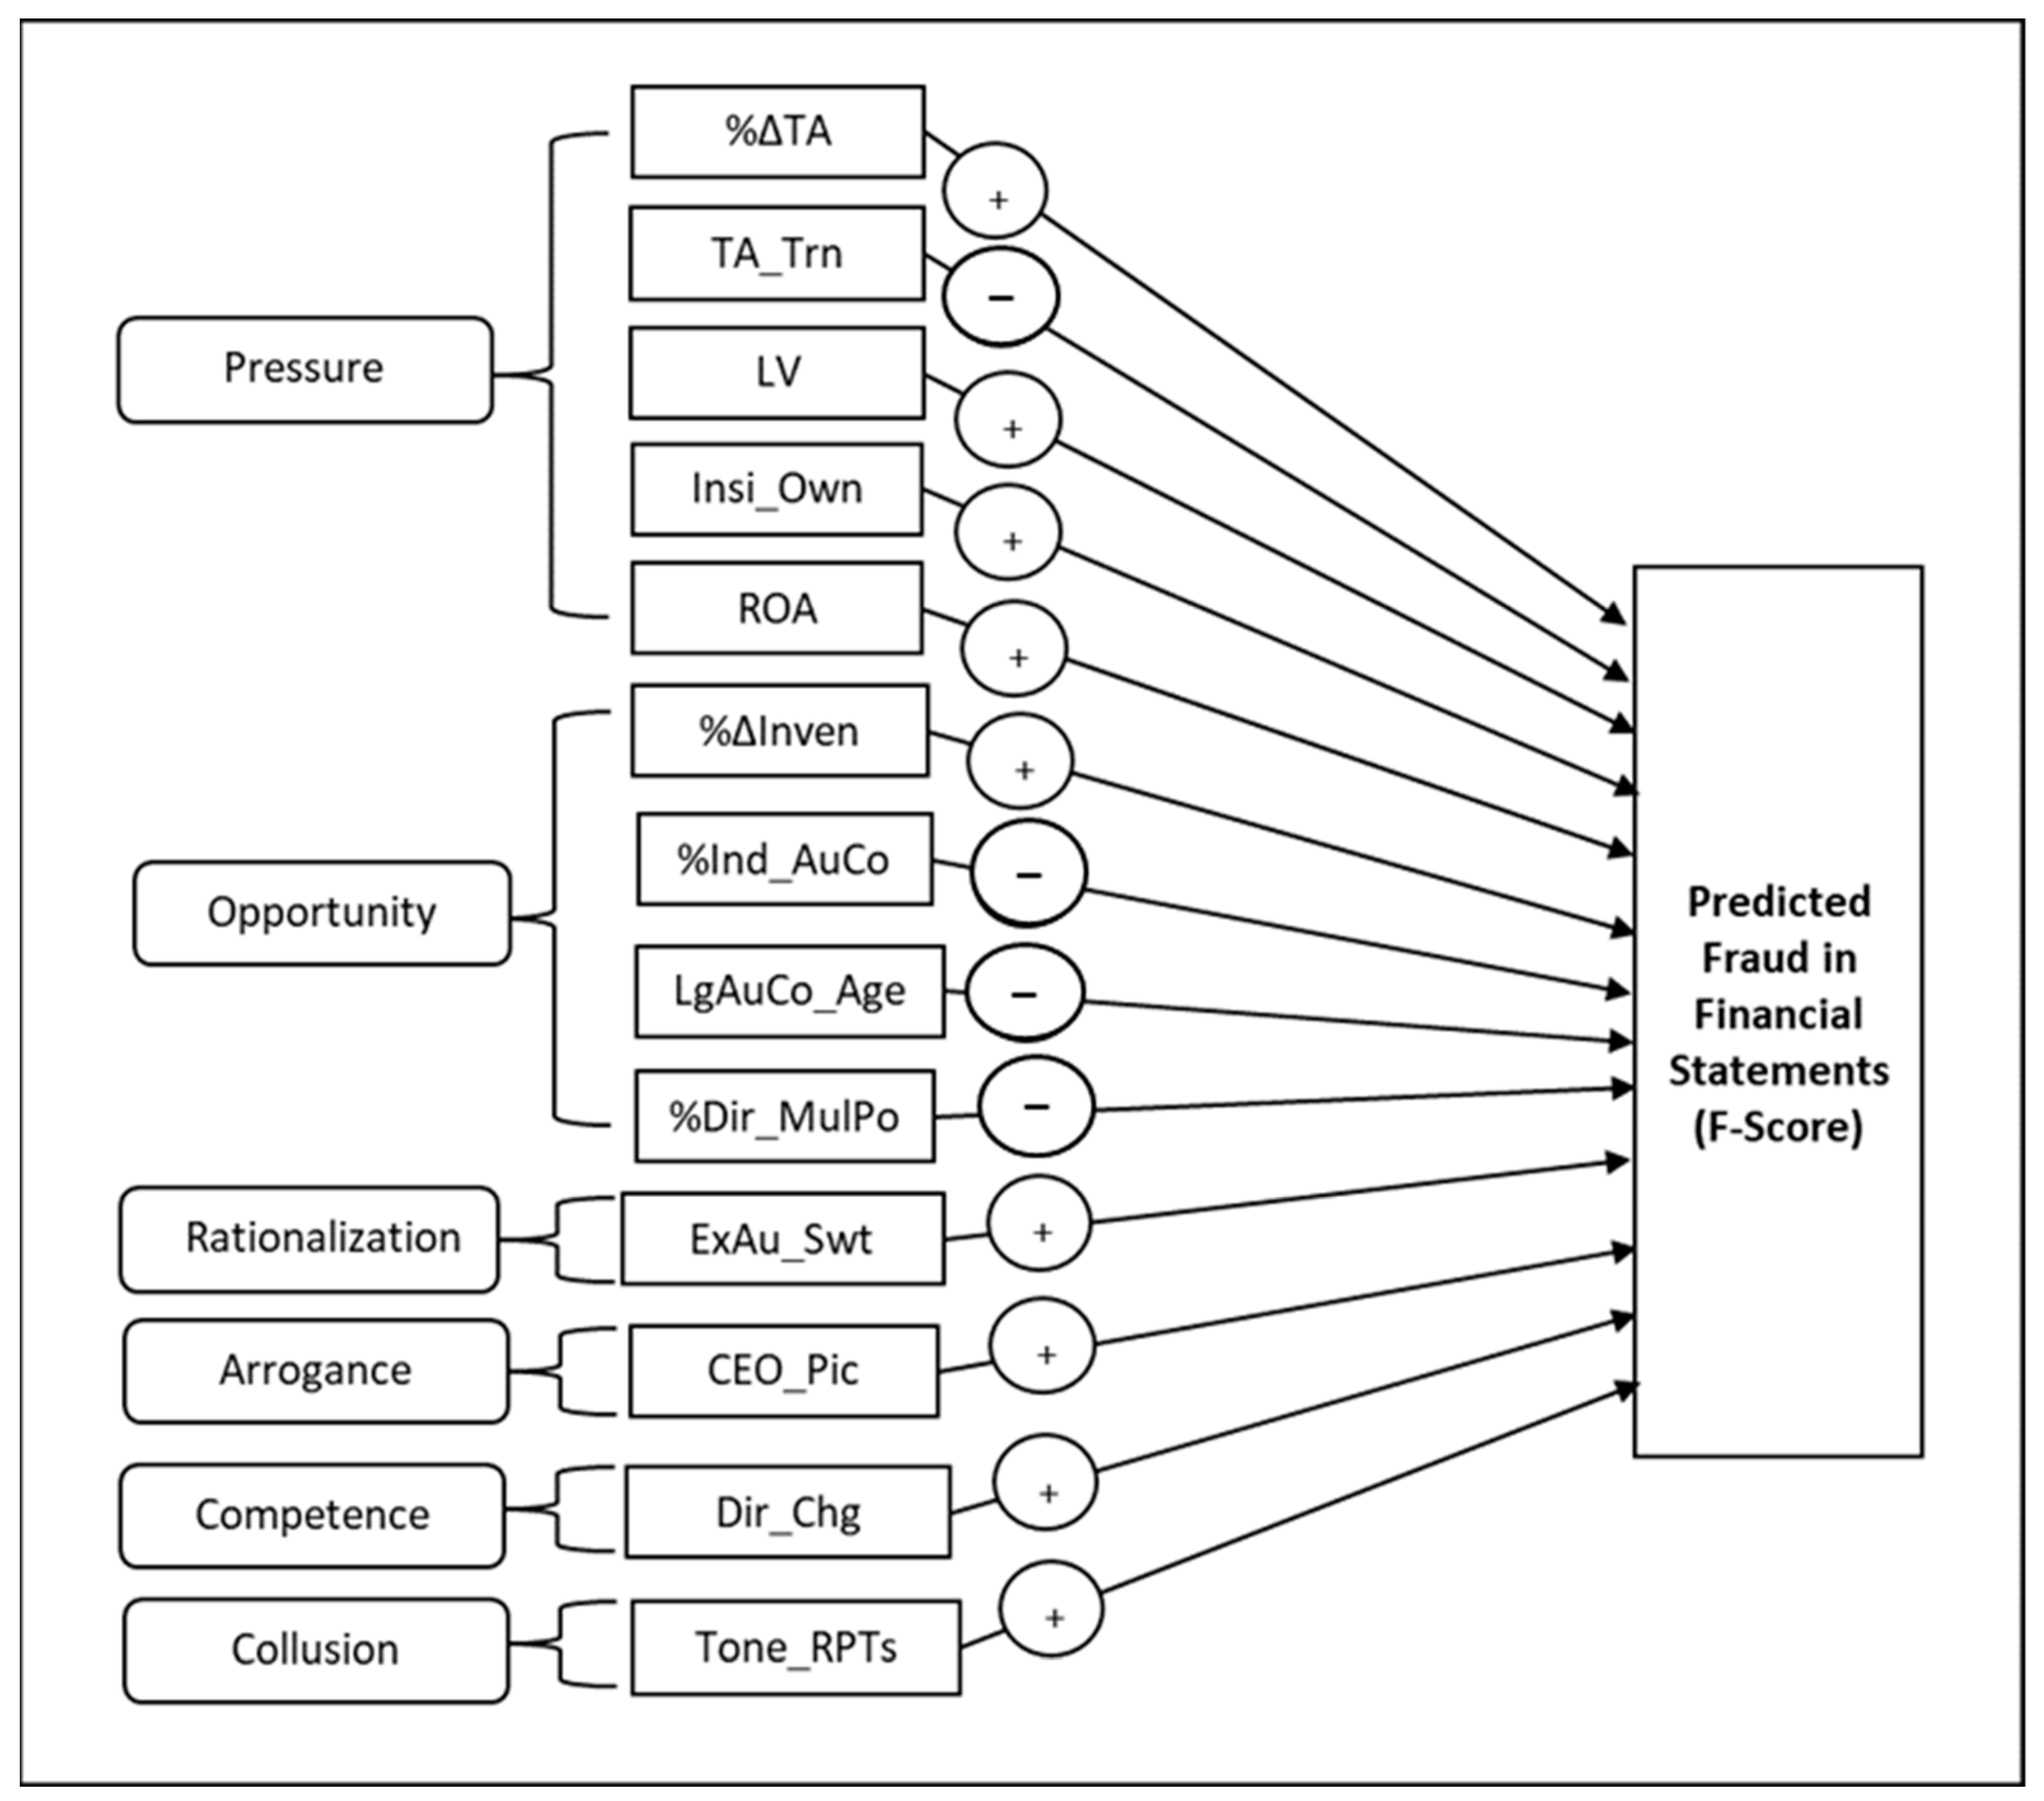
As previously mentioned, the motives according to the Fraud Hexagon theory include pressure, opportunity, rationalization, arrogance, competence, and collusion. Thus, the following sub-section presents the study hypotheses that aligned with these six elements as follows: Hypotheses 1–5 with pressure, 6–9 with opportunity, 10 with rationalization, 11 with arrogance, 12 with competence, and 13 with collusion.

2.1. Pressure

The size of a company’s assets holds significant importance for investors and lenders, often serving as a key factor in their decision-making process. A larger asset size is generally perceived as an indicator of financial stability (Rengganis et al. 2019; Alfarago et al. 2023). Moreover, companies with substantial asset sizes are subject to higher expectations from investors and creditors anticipating these to yield substantial returns (Puspitha and Yasa 2018). The robust financial standing and the stakeholders’ anticipation of favorable returns from companies with significant assets exert considerable pressure on the management of such companies. This pressure, in turn, may drive company mangers to engage in fraudulent activities, manipulating asset sizes to align with the anticipated expectations of investors and creditors (Novira and Kurnia 2018; Puspitha and Yasa 2018; Rengganis et al. 2019).
Therefore, the aforementioned insights can be justified by recognizing that the magnitude of assets within companies poses significant considerations for decision-makers. These considerations create pressure on the company to uphold the size of its assets and potentially inflate them through fraudulent means, utilizing asset valuation tools inappropriately. In light of these considerations and justifications, researchers have suggested that an uptick in the rate of change in a company’s total assets intensifies the pressure on the company’s management to engage in manipulation and fraudulent practices in FSs. Consequently, the first hypothesis is formulated as follows:
Hypothesis 1. 
The change ratio in the total amount of assets (%∆TA) has a positive effect on FSs being predicted to be fraudulent.
As previously highlighted, the financial stability of companies is identified as one of the factors that may drive company managers to engage in fraudulent activities in FSs. In this study, researchers aim to gauge financial stability using an additional indicator: the asset turnover rate. The chosen indicator assesses a company’s efficiency in utilizing its assets to generate revenues (Puspitha and Yasa 2018). When users of FSs compare the asset turnover rates of competing companies, a lower turnover rate prompts pressure on the firm’s management to enhance this metric, potentially leading to manipulations in FSs (Putra 2015).
The utilization of this indicator can be justified owing to its significance to investors, as it provides insight into the company assets’ capacity to generate revenue. A higher turnover rate typically makes the company more able to generate revenue, potentially leading to fraudulent activities.
In summary, a decrease in the asset turnover rate of companies is anticipated to heighten the pressure on these companies and elevate the likelihood of manipulations in FSs. Therefore, the second hypothesis is formulated as follows:
Hypothesis 2. 
The total asset turnover (TA_Trn) has a negative impact on the FSs being predicted to be fraudulent.
Organizations secure their capital from either shareholders’ funds or lenders to support their operational activities. Consequently, an augmentation in the debt component within a company’s capital structure is associated with an increase in the credit risk that is borne by the company (Puspitha and Yasa 2018; Achmad et al. 2022). An elevated corporate credit risk diminishes the company’s borrowing capacity (Sunardi and Amin 2018). Consequently, companies facing a heightened credit risk and aspiring to secure additional financing to bolster their competitiveness may experience intensified pressure. This pressure compels the management of such companies to potentially manipulate their FSs to present a favorable financial performance that is capable of meeting obligations to creditors (Situngkir and Triyanto 2020).
In light of the aforementioned dynamics, any escalation in a company’s financial leverage is posited to augment the pressure on the company’s management to engage in fraudulent activities in FSs. Therefore, the third hypothesis is formulated as follows:
Hypothesis 3. 
The leverage ratio (LV) has a positive impact on the FSs being predicted to be fraudulent.
Agency theory proposes that involving managers in the ownership of a company can mitigate conflicts of interest. However, granting them a stake in the company’s ownership may also expose them to allegations of insider trading. This dilemma becomes particularly pronounced when managers require personal financing, creating a situation that places pressure on them and may increase the likelihood of fraudulent activities in FSs (Rukmana 2018). The significant ownership stake that is held by managers in the company’s shares becomes a substantial asset, influenced by the company’s performance. In time of financial need, this situation may incentivize managers to engage in fraudulent activities in the FSs, aiming to enhance the value of the shares that they possess in the company (Alhebri and Al-Duais 2020; Amiram et al. 2018; Puspitha and Yasa 2018; Putra 2015).
This is what happened at Qwest Communications in 2001, when the company’s FSs were manipulated, and its revenues were inflated. In the same year, the company’s financial director and CEO carried out insider trading operations and sold the company’s shares, achieving huge sums of money as a result of this operation (Stanwick and Stanwick 2009).
Consequently, it can be inferred that any increase in the managers’ ownership ratio in the company is likely to correlate with an increase in the fraud ratio in the company’s FSs. Therefore, the formulation of the fourth hypothesis, which pertains to the pressure variable, is as follows:
Hypothesis 4. 
The size of the insider ownership ratio (Insi_Own) has a positive impact on the FSs being predicted to be fraudulent.
Companies consistently strive to attain financial objectives which serve as a focal point for numerous users of FSs, including investors, creditors, and other stakeholders who evaluate the success of these enterprises. The management is inherently vested in realizing these financial goals, as they are typically tied to the value of incentives and rewards accruing to managers within the company (Pramana et al. 2019). Consequently, managers face significant pressure to achieve the financial goals of their companies to maximize the benefits that they receive, encompassing both incentives and rewards (Pamungkas et al. 2018). This heightened pressure on management to meet financial objectives may, in turn, create circumstances wherein managers are tempted to manipulate and engage in fraudulent activities in the FSs (Sunardi and Amin 2018).
Various indicators are employed to gauge financial goals, with the ROA ratio standing out as one of the most prominent indicators for assessing management’s efficiency in leveraging assets to generate a return (Hung et al. 2017; Sikarini and Kurniawati 2023). Numerous studies have affirmed that an escalation in the ROA corresponds to an uptick in fraudulent activities in FSs. This phenomenon is attributed to the heightened pressure on managers to manipulate FSs and enhance the ROA ratio (Dechow et al. 2011; Devi et al. 2021; Manurung and Hadian 2013; Rukmana 2018).
Ultimately, committing fraud in companies can be justified because their financial indicators, such as the ROA, are the focus of many stakeholders’ attention, and therefore, the management of companies may manipulate the accounts that make up the ROA to appear attractive to investors and within their expectations. In light of the previous studies and justifications, it can be deduced that any increase in the ROA is likely to be associated with fraud and manipulation of the company’s FSs. Therefore, the fifth hypothesis is formulated as follows:
Hypothesis 5. 
The return on assets ratio (ROA) has a positive impact on the FSs being predicted to be fraudulent.

2.2. Opportunity

When discussing the industrial nature of companies, it signifies the optimal conditions within the industrial environment, providing company management with the opportunity to exercise personal judgments concerning accounts such as receivables and inventories (Hidayah and Saptarini 2019; Putra 2015; Sikarini and Kurniawati 2023). As a result, the industry’s nature contributes to an increase in the fraud rate in FSs (Hidayah and Saptarini 2019; Novira and Kurnia 2018; Puspitha and Yasa 2018; Rengganis et al. 2019; Rukmana 2018; Situngkir and Triyanto 2020). Researchers have employed variables associated with inventories to measure the industry’s nature.
Many studies have predominantly focused on utilizing the change in receivables-to-sales size as a measure of the industry’s nature in comparison to the variable associated with the inventory size. Puspitha and Yasa’s study (Puspitha and Yasa 2018) highlighted the significance of considering the change in inventory size as a measure of the industry’s nature, demonstrating its positive impact on FS fraud. The challenge with the inventory account lies in the fact that management must rely on personal estimates to evaluate it, especially when dealing with a decrease in the inventory value. This situation provides management with an opportunity to manipulate the estimated value of the inventory, particularly in cases of goods accumulation and a subsequent decrease in their value (Putra 2015). Therefore, a higher growth rate of a company’s inventory size with a lower inventory turnover rate increases the likelihood of fraud and manipulation of FSs (Hidayah and Saptarini 2019; Putra 2015; Sikarini and Kurniawati 2023). Based on the above, the sixth hypothesis is formulated as follows:
Hypothesis 6. 
The change growth in the inventory account (%∆Inven) has a positive impact on the FSs being predicted to be fraudulent.
Fraud in FSs seizes opportunities whenever there is a weakness in a company’s internal control system; managers may exploit these weaknesses to engage in fraudulent activities in FSs (Situngkir and Triyanto 2020). To mitigate the likelihood of fraud in companies, regulations and laws pertaining to corporate governance have begun to issue procedures and requirements that aim at enhancing the reliability of FSs. One such requirement is the establishment of an audit committee composed of members of the board of directors. This committee serves to oversee financial operations and ensure that FSs remain free of accounting fraud (Dewi and Anisykurlillah 2021; Larune et al. 2021). It is crucial to note that the effectiveness of the control by the audit committee depends on the independence of its members, a factor that significantly contributes to enhancing the reliability and integrity of companies’ FSs (Situngkir and Triyanto 2020). As the independent member in an audit committee is more free and impartial in the event that fraud is discovered, he will apply the laws and take the necessary actions to combat fraud without bias if it is discovered in the company. In contrast, the non-independent members have relationships with and interests in the company that may lead them to cover up fraud if it occurs.
Therefore, a higher percentage of independent members in the audit committee corresponds to an increased effectiveness in controlling operations and procedures related to the operation of FSs. This ultimately results in a reduction in the likelihood of fraud in companies’ FSs. Thus, the relationship between the percentage of independent members in the audit committee and fraud in FSs is negative (Md Nasir et al. 2019; Pramana et al. 2019; Rengganis et al. 2019). Accordingly, the seventh hypothesis is formulated as follows:
Hypothesis 7. 
The percentage of independent members in an auditing committee (%Ind_AuCo) has a negative effect on FSs being predicted to be fraudulent.
As was explained previously, the weakness of the internal control system in itself constitutes an opportunity that may be exploited by fraudulent people, and the internal control system may sometimes be linked to the age of the members of the audit committees, as will be explained in the following paragraphs. There is also a scarcity of research applied to developing countries regarding the age of audit committee members and the efficiency of their performance (Hasnan et al. 2022).
The age variable is considered a factor that leads to changes in the personal qualities of individuals. Pålsson (1996) pointed out that as people get older, they become more sensitive to risks. This implies that older members of an auditing committee will have greater sensitivity to risks, particularly in maintaining retirement income and safeguarding their reputation, as their future job opportunities may decrease with age (Qi and Tian 2012; Sultana et al. 2019). Consequently, older members of an auditing committee are likely to adopt a conservative approach in the selection process of an external auditor and in making decisions that enhance the transparency and integrity of financial reports (Qi and Tian 2012; Sultana et al. 2019).
Age also plays a role in increasing the amount of accumulated experience among auditing committee members. This experience enables them to address deficiencies in the company’s internal control system (Qi and Tian 2012). Therefore, it is reasonable to conclude that an increase in the age of auditing committee members will lead to greater effectiveness in the control with and integrity of financial reports, thereby reducing the chance of manipulation in FSs. Accordingly, the eighth hypothesis is formulated as follows:
Hypothesis 8. 
The age of auditing committee members (LgAuCo_Age) has a negative impact on the FSs being predicted to be fraudulent.
A company with members of the board of directors holding multiple positions on other companies’ boards is considered an indication of their good reputation in the professional environment. Additionally, this reflects their extensive experience in strategic plans and procedures that are carried out by the managers who are members of their boards of directors (Puspitha and Yasa 2018; Zachro and Utama 2021). Consequently, members of the board of directors with numerous memberships in other companies’ boards are expected to demonstrate greater efficiency and effectiveness in controlling and supervising companies’ mangers. This heightened oversight reduces the opportunity for managers to engage in fraudulent activities when preparing FSs (Premananda et al. 2019; Puspitha and Yasa 2018; Zachro and Utama 2021).
From the above, it is reasonable to conclude that any increase in the percentage of members on a company’s board of directors who hold multiple positions on other companies’ boards will diminish the chances of fraud in FSs. Therefore, the ninth hypothesis is formulated as follows:
Hypothesis 9. 
The percentage of members in the board of directors who have multiple positions in boards of directors of others companies (%Dir_MulPo) has a negative impact on the FSs being predicted to be fraudulent.

2.3. Rationalization

Justification is considered one of the motives for fraud and manipulation in FSs, which is manifested when management rationalizes fraudulent or deceptive practices in FSs (Hidayah and Saptarini 2019; Situngkir and Triyanto 2020). The process of preparing a company’s financial reports falls under the responsibility of the company’s management, which presents the business results to the users of FSs. Here, the role of the auditor is crucial in instilling confidence and reasonableness regarding the financial reports that are prepared by management and in detecting any fundamental errors resulting from fraud or deception (Pramana et al. 2019).
Developments in business at the global level, in addition to financial deregulation, have added more challenges for external auditors (Campa et al. 2023). Despite the importance of the auditor’s role in detecting fraud, there are some restrictions that may limit his ability to detect fraud or tolerate it, such as the fear of losing the company that he is assigned to audit, the lack of data, and his lack of sufficient experience regarding the nature of the business that is carried out by the company (Shwetha et al. 2023).
The failure of an auditor to detect fraud, deception, or manipulation in FSs serves as a justification for management to engage in manipulation. This was evident in the collapse of Enron, where the external auditor’s auditing process failed to uncover the manipulation that was orchestrated by Enron’s management (Sunardi and Amin 2018). Manipulative management may create a justification to frequently change external auditors, aiming to reduce the chances of a new auditor detecting any manipulation and fraud (Hidayah and Saptarini 2019; Pramana et al. 2019; Situngkir and Triyanto 2020). Consequently, companies with high turnover rates in their external auditors are likely to experience an increase in fraud in their FSs (Pamungkas et al. 2018). Based on the above, the tenth hypothesis can be formulated as follows:
Hypothesis 10. 
The change of external auditor (ExAu_Swt) has a positive impact on the FSs being predicted to be fraudulent.

2.4. Arrogance

The arrogance of Chief Executive Officers (CEOs) is considered a variable that contributes to fraud, as arrogant CEOs may perceive themselves to be above the law and other authorities (Hidayah and Saptarini 2019; Pamungkas et al. 2018; Sikarini and Kurniawati 2023). Consequently, the privileged position of arrogant CEOs fosters a sense of superiority over the company’s internal control system, exempting them from accountabilities that apply to others (Situngkir and Triyanto 2020). The power that is held by arrogant CEOs propels them to engage in fraud and manipulation of FSs, as they believe themselves to be beyond the reach of the law and internal control systems, thereby avoiding accountability.
Several studies, including by Rukmana (2018), Hidayah and Saptarini (2019), and Alfarago et al. (2023) posit that the presence of multiple images of CEOs in annual financial reports serves as an indication of CEO arrogance. Based on this, it can be concluded that any increase in the number of CEOs pictures in a company’s financial reports will lead to heightened CEO arrogance, serving as an indicator of potential fraud in the financial reports. Therefore, the eleventh hypothesis is formulated as follows:
Hypothesis 11. 
The frequency number of CEO images (CEO_Pic) has a positive impact on FSs being predicted to be fraudulent.

2.5. Competence

Competency is identified as another motive that contributes to fraud, signifying individuals’ abilities to circumvent company rules, mechanisms, and procedures that have been established to ensure the integrity of FSs. Additionally, individuals with high competency possess the capability to devise strategies aimed at concealing fraud and deception, leveraging their positions within the company for personal gain (Pamungkas et al. 2018; Sunardi and Amin 2018; Sikarini and Kurniawati 2023). Auditing Standard Number Ninety–Nine highlights that high turnover rates in senior positions within companies such as members of the board of directors may indicate fraud and manipulation within the company (Rukmana 2018).
When members of the board of directors utilize their positions to influence others and facilitate fraudulent activities, companies tend to undergo changes in board membership as a response to the ongoing fraud and manipulation (Situngkir and Triyanto 2020; Sunardi and Amin 2018). The period during which a company undergoes changes in its board of directors’ composition is considered critical in terms of increasing the likelihood of fraud by senior management, as new members require more time to comprehend the company’s internal operations (Pamungkas et al. 2018). Moreover, it may be that companies change their directors as result of the failure of these directors to detect fraud if it occurs in the company (Alfarago et al. 2023).
Based on the above, it is possible to conclude that the process of changing members of the board of directors may serve as an indication of the existence of fraud and manipulation. Therefore, the twelfth hypothesis is formulated as follows:
Hypothesis 12. 
Changing directors (Dir_Chg) has a positive impact on the FSs being predicted to be fraudulent.

2.6. Collusion

Company management may engage in collusion with other parties to manipulate and defraud FSs for personal interests. In recent years, numerous cases of FS fraud have resulted in significant losses for companies due to management collusion (Handoko and Tandean 2021). Collusion occurs when a group of individuals agree to undertake actions and processes that deceive others and harm their interests, all while securing personal benefits for those involved (Handoko and Tandean 2021). The standard AU-C-Section 550 on related parties, issued by the Auditing Standards Committee, indicates that the existence of transactions with related parties in companies increases the likelihood of collusion and manipulation in FSs by the company’s management (Auditing Standards Board 2021).
Numerous prior studies have highlighted that the presence of transactions involving related parties increases the risk of manipulation and fraud. External auditors must meticulously assess these transactions to ensure the absence of collusion and manipulation in FSs by companies’ management (Jeppesen 2019; Kakati and Goswami 2019). Pozzoli and Venuti (2014) clarified that transactions with related parties may either be based on a commercial basis to serve the interests of the companies or rely on the exploitation of companies’ economic resources, potentially causing harm to the companies’ interests. This implies that not all transactions with related parties necessarily indicate fraud. Kohlbeck and Mayhew (2017) affirmed this point by categorizing transactions with related parties into the main groups of business-related party transactions and tone-related party transactions. Their study revealed a relationship between tone-related party transactions and fraud, unlike the business-related party group, which did not show a correlation with fraud. In light of the above, it can be concluded that the presence of tone-related party transactions increases the chances of collusion in companies’ FSs. Therefore, the thirteenth hypothesis is formulated as follows:
Hypothesis 13. 
Tone-related party transactions (Tone_RPTs) have a positive effect on the FSs being predicted to be fraudulent.
In conclusion, the hypotheses developed in this study aimed to encompass a wide range of variables under each motive that could potentially be linked to fraud. The study considered variables that have commonly been used by researchers in previous studies, as well as variables proposed by them. For instance, in the second and sixth hypotheses, the study incorporated variables recommended by researchers for future investigations. Additionally, the study sought to incorporate variables related to the characteristics of companies’ audit committees, such as age, which had been overlooked in many previous studies.
Meanwhile previous studies have employed various variables to measure the motive for collusion relationships within the company involving government entities or joint projects. The current study introduced a new variable, tone-related party transactions, to measure this motive, broadening its applicability beyond collusion with government agencies. This expansion is crucial, especially considering that real cases of collusion are not solely confined to transactions with government parties. For instance, in the fraud case at Worldcom, the CEO borrowed funds from the company at a competitive interest rate, which falls under tone-related party transactions and is indicative of financial fraud.
By incorporating multiple variables to measure certain fraud motives, including those recommended in previous studies, and integrating variables that were demonstrated in real fraud cases, the study contributes to a deeper understanding of the phenomenon of fraud and aids in efforts to combat it effectively.
According to the literature review and constructed research hypotheses, the research model of the current study is presented in Figure 1. Thus, it is worth noting that the (+) symbol in Figure 1 assumes a positive relationship between the independent variable and the dependent variable, whereas the (−) symbol proposes a negative relationship.

3. Research Materials and Methods

3.1. Sample and Data Collection

The study sample consists of listed and non-listed (Over-The-Counter) industrial companies on the ASE market during the years of 2012–2017. The rationale behind selecting industrial companies stems from reports by the Association of Certified Fraud Examiners (ACFE), which indicated that the industrial sector exhibited the highest percentage of fraud cases in FSs compared to other sectors in most of the years spanning from 2011 to 2021 (ACFE 2012, 2014, 2016, 2018, 2020, 2022). Additionally, ACFE reports highlighted a relatively high number of fraud cases in Jordan during the study period. Specifically, there were 15 fraud cases reported during the years of 2013–2017, whereas the number decreased to 8 cases during the subsequent years of 2018–2021 (ACFE 2014, 2016, 2018, 2020, 2022).
Furthermore, in 2017, the Jordan Securities Commission implemented new directives pertaining to corporate governance, supplanting the governance regulations manual introduced in 2009. Compliance with these regulations became mandatory for companies, necessitating the rectification of their status in accordance with the updated guidelines throughout 2018. Additionally, in the same year, the Jordanian government introduced modifications to the income and sales tax legislation. Among the notable amendments was the progressive reduction in the income tax rate that is applicable to industrial enterprises over a span of five consecutive years. Specifically, the income tax rates for select companies were adjusted to 15%, 16%, 17%, 18%, and 19%, respectively. Notably, the amendment is anticipated to impact variables such as ROA and the F-score. Consequently, the timeframe for the study sample was carefully chosen to mitigate any potential influence stemming from alterations in governance regulations and the income tax rate on the study variables.
The introduction of the study underscored the correlation between fraud causing financial loss and their reflection in a company’s net income. Consequently, an examination of the overall net income of the industrial sector spanning the years of 2008 to 2021 was conducted. Figure 2 illustrates the findings, revealing a noticeable downturn in the industrial sector’s aggregate net income from 2012 to 2017 compared to proceeding years. While this decline cannot be solely attributed to fraud, it serves as a compelling cause for exploring this specific timeframe further. Significantly, the period from 2012 to 2017 witnessed a surge in reported fraud cases, as evidenced in the ACFE report.
The rationale for selecting the industrial sector is further substantiated by indications of a decline in its cumulative net income compared to other sectors, particularly the financial and services sectors. Utilizing cumulative net income data from the ASE website for the three sectors (services, financial, and industrial), the average percentage change in net income during the years of 2012–2017 was calculated for each sector. The results underscore the significance of the industrial sector, revealing average percentage changes in cumulative net income of 10.73% for the service sector, 11.06% for the financial sector, and −10% for the industrial sector. Furthermore, findings from the research conducted by Dorgham et al. (2014) revealed a deficiency in the internal control system within industrial companies in Jordan. Additionally, their study highlighted subpar performances among managers in industrial firms concerning fraud prevention measures. Consequently, their findings provide further substantiation that industrial companies in Jordan may face heightened susceptibility to fraudulent activities compared to other sectors. This underscores the imperative of directing attention towards the industrial sector to elucidate potential motives behind fraudulent behavior.
The total population comprised both listed and non-listed (Over-The-Counter) companies, totaling 65 during the study period. The study sample consisted of 63 companies, with 2 companies excluded due to the non-publication of their annual reports. This sample represents 96.92% of the industrial firm’s population. Secondary data from annual reports published on the ASE website from 2012 to 2017 were utilized to collect FS data for the study sample. The researchers ensured data quality and completeness by extracting information from audited annual reports that included corporate governance disclosures. The total annual reports for the industrial companies’ population amounted to 367, of which 349 were included in the sample, representing 95.1% of the total annual report population. Notably, 10 annual reports were excluded from the sample due to a lack of necessary FSs and corporate governance data for variable calculation. Throughout the data collection process, the current study encountered limitations associated with the study sample. These limitations are comprehensively explained in Section 6.
The collected secondary data underwent analysis utilizing the logistic regression model within the SPSS program. This statistical model, also known as the logit model, is commonly employed for categorization and predictive analytics. Logistic regression utilizes a dataset of independent variables to estimate the likelihood of a specific event occurring, such as voting or non-voting. Given that the outcome is a probability, the independent variable typically ranges from 0 to 1.
In logistic regression, a logit transformation is applied to the odds, which represent the likelihood of success relative to the probability of failure. This transformation is often referred to as the natural logarithm of odds or simply the log odds.
The methodology adopted in this study is the cross-sectional approach. The principal advantage of employing the cross-sectional approach lies in its potential for generalizability, provided that the sample adequately represents the study population. However, a notable disadvantage of this approach is its limitation in capturing the relationship between variables at a single point in time.
Despite the inherent limitations of the cross-sectional approach, it was deemed suitable for this study’s objectives, which seek to offer insights into the motives underlying fraud during the specified study period.

3.2. Dependent Variable Measurement

The dependent variable in this study is represented by FSs being predicted to be fraudulent. We measured this variable based on the model developed by Dechow et al. (2011). The selection of this model was motivated by its superior predictive capabilities for fraud compared to other models (Aghghaleh et al. 2016). Several previous studies investigating fraud motives utilized the F-score model as a proxy for financial fraud (Devi et al. 2021; Handoko and Tandean 2021; Hidayah and Saptarini 2019; Premananda et al. 2019; Rengganis et al. 2019; Situngkir and Triyanto 2020).
The numbers generated by the Dechow model are continuous, and the decision rule is based on the F-score value. Therefore, an FS with an F-score value greater than (1) suggests that the model predicts the existence of financial fraud, while an FS with an F-score value equal to (1) or less indicates that the model predicts the absence of fraud.
For analytical purposes, dummy variables were used to measure the prediction of fraud in FSs. If the F-score value for an FS in a particular year was equal to one or less, it was assigned the value zero, signifying the prediction of no fraud. If the F-score value was greater than 1, it was assigned the value (1) indicating the prediction of fraud.
To calculate the F-score as a dependent variable, the study utilized the formula for F-score developed in the Dechow et al. (2011) study. The following formulas illustrate the calculation of the F-score according to Dechow’s model:
F Score = Pro . 0.0037 ,
where the 0.0037 is unconditional pro.
Pro . = e P . V 1 + e P . V ,
where e = 2.71828183.
P.V = −7.893 + (0.790 × A) + (2.518 × B) + (1.191 × C) + (1.979 × D) + (0.171 × E) + (−0.932 × F) + (1.029 × G)
where
A = Δ AA + Δ AB + Δ AC Average   total   assets
AA = [Current Assets − Cash and Short-term Investments] − [Current Liabilities − Debt in Current Liabilities]
AB = [Total Assets − Current Assets − Investments and Advances] − [Total Liabilities − Current Liabilities − Long-term Debt]
AC = [Short-term Investments + Long-term Investments] − [Long-term Debt + Debt in Current Liabilities + Preferred Stock]
B = Δ Accounts   Receivable Average   total   assets
C = Inventory   Average   total   assets
D = [ Total   Assets property ,   plant   and   equipment Cash   and   Cash   Equivalent ] Total   Assets
E = [ Sales t Δ Accounts   Receivables t ] [ Sales t 1 Δ Accounts   Receivables t 1   ] [ Sales t 1 Δ Accounts   Receivables t 1 ]
F = [ Earnings t Average   total   assets t ] [ Earnings t 1 Average   total   assets t 1 ]
G is a dummy variable coded as 1 if the firm issued securities during year t, and if not, it is coded as 0.

3.3. Independent Variable Measurement

The Hexagon theory categorizes fraud elements into six motives: pressure, opportunity, arrogance, rationalization, competence, and collusion. This study seeks to measure these motives through a set of independent variables and identify which of them contribute to or mitigate fraud in the FSs that are predicted to be fraudulent. The measurements and definitions of all independent variables that were examined in the current study are summarized in Table 1. The logistic model employed in the study is presented below:
F-Score = α + β1%∆TA + β2TA_Trn + β3 LV + β4Insi_Own + β5 ROA + β6%∆Inven + β7%Ind_AuCo + β8LgAuCo_Age + β9%Dir_MulPo + β10ExAu_Swt + β11CEO_Pic + β12Dir_Chg + β13Tone_RPTs + ε

4. Results

4.1. Descriptive Statistics, Testing Outliers, Linearity, and Multicollinearity

Table 2 presents the descriptive statistics for the dependent variable (F-score) and independent variables (%∆TA, TA_Trn, LV, Insi_Own, ROA, %∆Inven, %Ind_AuCo, LgAuCo_Age, %Dir_MulPo, ExAu_Swt, CEO_Pic, Dir_Chg, Tone_RPTs). However, the most notable statistic from Table 2 is the mean (6.88%) of the dependent variable (F-score), which means that the number of FSs that are predicted to be fraudulent is 24.
Prior to conducting the logistic regression test, the assumptions associated with the test were assessed. These assumptions include the presence of outliers, which may exert a notable influence on the study outcomes, as well as considerations of linearity and multicollinearity.
Upon examination, the test results revealed the identification of 9 outliers within the sample of 349. It is important to underscore that the measurement of variables pertaining to outliers was conducted meticulously, and the values obtained are deemed to be realistic, as they were derived from companies’ FSs. Ultimately, it can be inferred that the presence of outliers did not exert a significant impact on the study results.
After conducting the outlier test, the next step involved testing the linearity assumption to ensure a linear relationship between the log odds of the dependent variable (F-score) and the continuous independent variables. These variables include %∆TA, TA_Trn, LV, Insi_Own, ROA, %∆Inven, %Ind_AuCo, LgAuCo_Age, %Dir_MulPo, and CEO_Pic. The linearity test results indicated that all the continuous independent variables had a significance that was greater than 0.05. This implies that none of the continuous independent variables violated the linearity principle, confirming the suitability of these variables for the logistic regression analysis.
Before proceeding with the logistic regression analysis, a multicollinearity test was conducted to ensure that there were no high correlations between the independent variables in the study. Table 3 presents the variance inflation factor (VIF) for each independent variable in the model. It is evident from the table that none of the VIF values for the independent variables exceed 5.
Furthermore, Table 4 displays the correlation matrix for the independent variables, revealing that the correlation coefficients between the variables do not surpass 0.5. Consequently, the absence of multicollinearity issues in the logistic regression model is underscored by Table 3 and Table 4, thereby affirming the reliability of the obtained results.
However, it is imperative to acknowledge that while the assumptions of logistic regression testing have been validated, these results presuppose the appropriateness of employing this test within the context of the study to the extent of plausibility.

4.2. Measuring Goodness of Fit

The goodness of fit for the study model is assessed using the Hosmer and Lemeshow test. The result, as shown in Table 5, indicates a significant p-value of 0.776, which is greater than 0.05. Moreover, in Table 6, the result of the omnibus tests of the model coefficients presents a significance of less than 5%. These tests suggest that the logistic regression model is suitable for analysis, as it determines the ability to forecast the values of its observations and fit.
After assessing the goodness of fit for the study model, the feasibility of the logistic regression model is evaluated using the −2log Likelihood test. This involves comparing the values of −2log Likelihood at stage 0 and stage 1. A good model is indicated when the value of the −2log Likelihood at stage 1 is lower than the value at stage 0.
In Table 7, the value of the −2log Likelihood at stage 0 is 174.807, while in Table 8, the value of the −2log Likelihood at stage 1 is 111.920. This suggests that the logistic regression model is not only feasible but also good.
In the logistic regression model, Nagelkerke R Square quantifies the extent to which the independent variables account for the variation in the dependent variable. In Table 8, the value of Nagelkerke R Square is 0.418, indicating that the independent variables in the study model explain approximately 41.8% of the variation in the dependent variable (the FSs being predicted to be fraudulent). The remaining 58.2% of the variation is attributed to other independent variables that are not included in the study model. Table 9 presents the frequency of expectations according to empirical data of the F-score variable (dependent variable), and this table shows that the accuracy percentage of the model’s predictions is 93.7%.

4.3. Hypothesis Testing

We employed logistic regression analysis in SPSS to test the study hypotheses collectively, aiming to identify variables or reasons that led companies to commit fraud in their FSs, as per the Hexagon theory. The Hexagon theory categorizes fraud motives into six elements, and we assigned independent variables in the study to assess their impact on the dependent variable (FSs predicted to be fraudulent). The results, presented in Table 10, indicate that only 3 out of the 13 independent variables—ROA, the percentage of independent members in audit committees, and tone-related party transactions—had a statistically significant impact on the dependent variable (FSs predicted to be fraudulent).

4.3.1. Pressure Element and Predicted Fraudulent FSs

The first motive for fraud, pressure, was assessed through five independent variables: %∆TA, TA_Trn, LV, Insi_Own, and ROA. The results presented in Table 10 reveal that the first, second, third, and fourth hypotheses related to the pressure motive were rejected, as their results were not statistically significant, indicating that they did not constitute a pressure motive for committing fraud in companies’ FSs as predicted. However, the fifth hypothesis related to the independent variable ROA was accepted. The B coefficient value for ROA was 14.052, with a significance of 0.000, which is less than 5%, signifying that an increase in the ROA value will lead to an increase in fraud in companies’ FSs.

4.3.2. Opportunity Element and Predicted Fraudulent FSs

Regarding opportunity, the second motive for fraud, it was measured through four independent variables: %∆Inven, %Ind_AuCo, LgAuCo_Age, and %Dir_MulPo. The results presented in Table 10 indicate that the sixth, eighth, and ninth hypotheses related to the opportunity motive were rejected, as their results were not statistically significant. This implies that these variables did not constitute an opportunity motive for committing fraud in companies’ FSs as predicted. However, for the seventh hypothesis related to the independent variable percentage of independent audit committees (%Ind_AuCo), the B coefficient value amounted to −1.731, with a significance of 0.045, which is less than 5%. This result is accepted as statistically significant, indicating that any increase in the percentage of independent members in audit committee will lead to a decrease in the likelihood of fraud in companies’ FSs.

4.3.3. Rationalization Element and Predicted Fraudulent FSs

Regarding rationalization as the third motive for fraud, it was measured through the independent variable ExAu_Swt. The investigation and analysis of the results in Table 10 revealed that the tenth hypothesis was not statistically significant and is rejected. The B coefficient value amounted to 0.968, with a significance of 0.382, which is greater than 5%. Therefore, it can be concluded that the rationalization motive had no impact on the FSs of companies that were predicted to be exposed to fraud. This indicates that the change of external auditor by the companies was not attributable to fraudulent motives, but rather was due to other reasons like the expiration of the legal period in which it is allowed for the auditor to audit the company’s accounts.

4.3.4. Arrogance Element and Predicted Fraudulent FSs

Concerning arrogance as the fourth motive for fraud, it was measured through the independent variable CEO_Pic. The investigation and analysis of the results in Table 10 indicated that the eleventh hypothesis was not statistically significant and is rejected. The B coefficient value amounted to −18.294 with a significance of 0.996, which is greater than 5%. Therefore, it can be concluded that the arrogance motive had no impact on the FSs of companies that were predicted to be exposed to fraud. It can also be concluded based on this result that the number of pictures of the CEO in the financial reports did not constitute a fraudulent motive. This means that it is useful to search for and use other variables to measure the motive of arrogance, which are mentioned in the conclusion section.

4.3.5. Competence Element and Predicted Fraudulent FSs

Regarding competence, the fifth motive for fraud, it was measured through the independent variable Dir_Chg. The investigation and analysis of the results in Table 10 showed that the twelfth hypothesis was not statistically significant and is rejected. The B coefficient value amounted to −1.151 with a significance of 0.053, which is greater than 5%. Therefore, it can be concluded that the competence motive had no impact on the FSs of companies that were predicted to be exposed to fraud. Despite the average percentage of change in directors reaching 52.15%, as shown in Table 2, this change is not imputed to fraud in FSs, but rather may reflect aims to hire more efficient directors.

4.3.6. Collusion Element and Predicted Fraudulent FSs

Collusion, as the sixth motive for fraud, was measured through the independent variables, particularly Tone_RPTs. The investigation and analysis of the results in Table 10 showed that the thirteenth hypothesis related to the collusion motive was statistically significant and is accepted, with a B coefficient value of 2.686 and a significance of 0.000, which is less than 5%. This result suggests that the existence of Tone_RPTs may indicate the presence of fraud and manipulation in companies’ FSs.

5. Discussion

In addressing the pressure motive, this study identifies the independent variable ROA as exerting pressure on companies with predicted fraud in their FSs. An escalation in the ROA ratio correlates with an increased likelihood of fraud in companies’ FSs, suggesting that managers are pressured to showcase fake success in corporate management, potentially for financial incentives.
Regarding the relationship between the ROA and the possibility of fraud in FSs, the research findings align with several studies, including those by Manurung and Hadian (2013), Devi et al. (2021), Rukmana (2018), Rengganis et al. (2019), Hidayah and Saptarini (2019), and Tarjo and Sakti (2021), which support a statistically significant positive relationship. Conversely, some studies, like that by Puspitha and Yasa (2018), present a negative existing relationship. Studies suggesting a positive relationship emphasize managers’ attempts to demonstrate favorable results for additional incentives and investor returns, while those indicating a negative relationship highlight managerial tendencies to delay profit announcements to reduce the payable dividend ratios.
Concerning the motivation of opportunities, this study reveals a negative correlation between the independent variable (independent members in audit committees) and predicted fraud in FSs. An increase in the number of independent members in an audit committee is associated with a decreased chance of fraud and manipulation in companies’ FSs. This finding aligns with Owens-Jackson et al. (2009), Rengganis et al. (2019), and Qi and Tian (2012), indicating a negative relationship between earning management and the independence of audit committee members, which is considered a form of fraud in FSs. This underscores that a higher number of independent members enhances the control effectiveness over companies’ work processes, thereby reducing the likelihood of fraud and manipulation, a conclusion that is supported by the current study and previous research.
Regarding the third motive of collusion, this study affirms that the presence of tone-related party transactions is positively associated with FSs being predicted to involve fraud. This finding is consistent with the results of Kohlbeck and Mayhew’s (Kohlbeck and Mayhew 2017) study.

6. Conclusions

In conclusion, this study, which is grounded in the Hexagon theory, endeavors to elucidate the motivations influencing the escalation or mitigation of fraud in the FSs of both listed and non-listed (Over-The-Counter) companies in the ASE. The Hexagon theory, categorizing fraud motives into six distinct elements, guided the study’s investigation.
The findings underscore the impactful role of pressure, opportunity, and collusion motives in FSs being predicted to involve fraud. Some motives were evaluated through multiple independent variables, while others were assessed through a singular variable. The outcomes of this study provide valuable insights for FS users, fostering an enhanced understanding of fraud motives. This comprehension empowers users to adeptly and efficiently evaluate the risk of fraud in FSs, contributing to a more robust and trustworthy financial environment. This research not only contributes to the theoretical framework concerning fraud motives but also offers particular implications for stakeholders in their pursuit of ensuring financial transparency, integrity, and accountability in the corporate landscape.

6.1. Theoretical and Practical Implications

The findings of the current study contribute significantly to both the theoretical and practical dimensions in the realm of fraud examination in FSs.
The theoretical contributions affirm the efficacy of employing Tone_PRTs as a proxy to gauge the collusion variable in the Fraud Hexagon Theory. Notably, it underscores that relevant transactions serve as indicators of potential fraud in FSs. Moreover, the study introduces a nuanced approach by utilizing multiple independent variables to measure certain fraud motives, recognizing the variability that has been observed in prior research outcomes.
On a practical level, the study highlights the pivotal role of the ROA as a pressure variable influencing FSs, with predicted fraud urging external auditors to scrutinize ROA components diligently during corporate audits. The study prompts auditors to monitor changes in the ROA over consecutive years, particularly focusing on indicators such as continuous and conspicuous increases signaling potential fraud.
The study, also, raises the auditor’s attention to fraudulent methods that could manipulate ROA components and underscores the importance of auditor vigilance, ensuring a proper evaluation of revenue and expenses recognition principles and integrity in asset valuation procedures. This includes, for example, but is not limited to, fraudulent methods that may be used to manipulate the ROA components: recognizing the revenues early, recording fictitious revenues, reducing the depreciation expense of an asset using incorrect valuation methods, manipulating the timing of expenses recognition, classifying the capital expenses as operating expenses, and revaluating the assets as lower than their actual fair value.
The findings of this study contribute to a deeper conceptual understanding of creative accounting practices by specifically investigating accounts that are suspected to be manipulated as a motive for fraud. For instance, the application of the Beford’s Law model to the figures derived from the accounts involved in ROA computation enables more precise identification of accounts where manipulation may have occurred.
The discussion extends to proactive measures that auditors can take including increasing sample sizes, reducing acceptable risk levels for ROA components, and meticulously reviewing Tone_RPTs accounts to allay any suspicions of fraud. Additionally, the study recommends a strategic emphasis on governance instructions, particularly advocating for a higher percentage of independent members in audit committees.
The negative correlation that was found between the number of independent members and the likelihood of fraud in FSs underscores the importance of strengthening and enforcing governance rules. This study suggests increasing the percentage of independent members in audit committees beyond the mandated threshold, given its substantial impact on curbing fraud in financial reports, thereby enhancing the reliability of financial markets in developing countries.

6.2. Limitations of the Study

The current study encounters a number of limitations associated with the relatively small number of listed and non-listed industrial companies within the study population. Although the small size encompasses over 95% of the study population, considering the number of firms and their annual financial reports, it remains influenced by the overall size of the study population. Moreover, the study faces additional limitations arising from the working conditions of certain companies or insufficient disclosures for measuring the study variables. Specifically, some firms did not present or publish their FSs during the study period. Additionally, during the data collection process, it became apparent that some companies existed for a duration that was shorter than the study period. However, the total number of companies lasting less than 6 years is relatively low, not exceeding 5%. These companies are included in the sample, given that each FS is independent, as evidenced by variations in companies’ business results from year to year.
Despite the small sample size, it is arguable that the results of this study can be generalized to both the listed and non-listed industrial sector on the ASE. The sample covers a significant percentage of the study population during the study period that extended from 2012 to 2017.
The study drew upon financial data extracted from the FSs of industrial companies to compute the variables. However, it is important to acknowledge that FSs in the accounting domain are subject to certain limitations. These limitations include the use of personal judgment in calculating certain items and the reliance on a historical cost basis for measuring items. Consequently, these inherent limitations in FSs may at times lead to discrepancies between the reported figures and the actual financial standing of the company.

6.3. Future Research

The findings of the current study present an avenue for future research to explore potential changes in motives driving fraud, particularly investigating fraud motives in different periods of time, especially after 2018. Moreover, the study results can provide valuable insights for researchers and stakeholders assessing the effectiveness of governance rule amendments that companies are mandated to adhere to from the outset of 2018.
Combating fraud in companies’ FSs is crucial due to the significant harm that it inflicts on FS users, including investors and lenders, as well as the broader national economy. The current study focused on investigating fraud motives in the industrial sector for the period of 2012–2017, as this sector exhibited a higher prevalence of fraud cases compared to other sectors such as services and finance. Therefore, future researchers are encouraged to delve into fraud motives across all sectors to foster a deeper and more comprehensive understanding of the fraud phenomenon. Such a comprehensive understanding is crucial for refining methods and regulations that are aimed at combating fraud.
Most previous studies used the number of photos of the CEO in financial reports, and this variable alone may not be sufficient to express the motive of arrogance. Therefore, this study suggests using other variables to measure this motivation in a way that enhances the possibility of describing this motivation. For example, the company’s employee turnover rate can be used to measure management arrogance, and the proposed variable can be justified by the fact that the arrogant CEO damages his working relationship with lower management and employees, which prompts them to find other job opportunities. Also, a decrease in the number of training courses and seminars that are held to train the company’s middle management and employees may be an indication of the arrogance of management that does not care about developing the skills of their employees.
It is, also, vital to conduct continuous studies on fraud motives over varying time intervals to grasp the evolving nature of these motives over time. This ongoing exploration ensures that decision-makers are equipped with updated insights into the motives driving fraud, empowering them with proactive measures to effectively combat fraud.

Author Contributions

Conceptualization, A.A.B.; Data curation, A.A.B. and B.K.A.; Formal analysis, A.A.B. and S.R.S.W.; Investigation, A.A.B. and Y.A.A.H.; Methodology, A.A.B., Y.A.A.H., S.R.S.W. and B.K.A.; Project administration, A.A.B.; Validation, A.A.B., S.R.S.W. and B.K.A.; Visualization, A.A.B. and Y.A.A.H.; Writing—original draft, A.A.B., Y.A.A.H., S.R.S.W. and B.K.A.; Writing—review and editing, A.A.B., Y.A.A.H., S.R.S.W. and B.K.A. All authors have read and agreed to the published version of the manuscript.

Funding

This research received no external funding.

Institutional Review Board Statement

Not applicable.

Informed Consent Statement

Not applicable.

Data Availability Statement

The collected and analyzed data are available on the Amman Stock Exchange website at https://www.ase.com.jo/en/history?history_category=64 (accessed on 1 March 2022). Additionally, some of the data collected from the financial reporting disclosures are published on the Amman Stock Exchange website at https://www.ase.com.jo/en/disclosures?symbol=&category_id=1&published%5Bmin%5D=&published%5Bmax%5D= (accessed on 22 May 2022). Moreover, some of the data are collected from the Jordan securities commission website at https://www.jsc.gov.jo/JSC_financial_Reports.aspx (accessed on 8 October 2023).

Conflicts of Interest

The authors declare no conflicts of interest.

References

  1. Abdullahi, Rabiu, and Noorhayati Mansor. 2018. Fraud Prevention Initiatives in the Nigerian Public Sector: Understanding the Relationship of Fraud Incidences and the Elements of Fraud Triangle Theory. Journal of Financial Crime 25: 527–44. [Google Scholar] [CrossRef]
  2. ACFE. 2012. Report to the Nations on Occupational Fraud and Abuse 2012 Global Fraud Study. Available online: https://www.acfe.com/fraud-resources/report-to-the-nations-archive?_ga=2.167272502.964645533.1688775797-1920497977.1661692981&_gac=1.259961208.1688504782.Cj0KCQjwho-lBhC_ARIsAMpgModGq9LhMTftpWyBRlauaKfGKY-3qkUK5MExp2wENADLdGqjGhXnNVcaAsSBEALw_wcB (accessed on 26 July 2023).
  3. ACFE. 2014. Report to The Nations on Occupational Fraud and Abuse 2014 Global Fraud Study. Available online: https://www.tn.gov/content/dam/tn/tdot/documents/InternalAudit/2014_Report_to_the_Nations.pdf (accessed on 7 July 2023).
  4. ACFE. 2016. Report to The Nations on Occupational Fraud and Abuse 2016 Global Fraud Study. Available online: https://www.acfe.com/fraud-resources/report-to-the-nations-archive?_ga=2.198162920.679200895.1688504782-1920497977.1661692981&_gac=1.183293268.1688504782.Cj0KCQjwho-lBhC_ARIsAMpgModGq9LhMTftpWyBRlauaKfGKY-3qkUK5MExp2wENADLdGqjGhXnNVcaAsSBEALw_wcB (accessed on 7 July 2023).
  5. ACFE. 2018. Report to the Nations 2018 Global Study on Occupational Fraud and Abuse. Available online: https://www.acfe.com/fraud-resources/report-to-the-nations-archive?_ga=2.198162920.679200895.1688504782-1920497977.1661692981&_gac=1.183293268.1688504782.Cj0KCQjwho-lBhC_ARIsAMpgModGq9LhMTftpWyBRlauaKfGKY-3qkUK5MExp2wENADLdGqjGhXnNVcaAsSBEALw_wcB (accessed on 7 July 2023).
  6. ACFE. 2020. Report to the Nations on Occupational Fraud and Abuse: 2020 Global Study On Occupational Fraud and Abuse. Available online: https://www.acfe.com/report-to-the-nations/2020/ (accessed on 3 April 2023).
  7. ACFE. 2022. Occupational Fraud 2022: A Report to the Nations. Available online: https://acfepublic.s3.us-west-2.amazonaws.com/2022+Report+to+the+Nations.pdf (accessed on 20 October 2022).
  8. Achmad, Tarmizi, Imam Ghozali, and Imang Dapit Pamungkas. 2022. Hexagon Fraud: Detection of Fraudulent Financial Reporting in State-Owned Enterprises Indonesia. Economies 10: 13. [Google Scholar] [CrossRef]
  9. Aghghaleh, Shabnam Fazli, Zakiah Muhammaddun Mohamed, and Mohd Mohid Rahmat. 2016. Detecting Financial Statement Frauds in Malaysia: Comparing the Abilities of Beneish and Dechow Models. Asian Journal of Accounting and Governance 7: 57–65. [Google Scholar] [CrossRef]
  10. Al-Daoud, Khaleel Ibrahim, Riyad Neman Darwazah, Abeer Fayez Al-Khoury, and Ahmad Hafeth Ismail. 2023. The Impact of Creative Accounting Practices on Financial Performance in Industrial Companies Listed on Amman Stock Exchange. Information Sciences Letters 12: 1651–61. [Google Scholar] [CrossRef]
  11. Alfarago, Dio, Muhammad Syukur, and Azas Mabrur. 2023. The Likelihood of Fraud From the Fraud Hexagon Perspective: Evidence From Indonesia. ABAC Journal 43: 34–51. [Google Scholar]
  12. Alhebri, Adeeb Abdulwahab, and Shaker Dahan Al-Duais. 2020. Family Businesses Restrict Accrual and Real Earnings Management: Case Study in Saudi Arabia. Cogent Business and Management 7: 1806669. [Google Scholar] [CrossRef]
  13. Al-Natsheh, Nancy, and Saleh Al-Okdeh. 2020. The Impact of Creative Accounting Methods on Earnings per Share. Management Science Letters 10: 831–40. [Google Scholar] [CrossRef]
  14. Alrjoub, Ashraf Mohammad Salem, Salam Nawaf Almomani, Atallah Ahmad Al-Hosban, and Mahmoud IzzatAllahham. 2021. The Impact of Financial Performance on Earnings Management Practice Behavior (an Empirical Study on Financial Companies in Jordan). Academy of Strategic Management Journal 20: 1–15. [Google Scholar]
  15. Alzoubi, Ebraheem Saleem Salem. 2016. Disclosure Quality and Earnings Management: Evidence from Jordan. Accounting Research Journal 29: 429–56. [Google Scholar] [CrossRef]
  16. Amiram, Dan, Zahn Bozanic, James D. Cox, Quentin Dupont, Jonathan M. Karpoff, and Richard Sloan. 2018. Financial Reporting Fraud and Other Forms of Misconduct: A Multidisciplinary Review of the Literature. Review of Accounting Studies 23: 732–83. [Google Scholar] [CrossRef]
  17. Auditing Standards Board. 2021. AU-C Section 550 Related Parties. Available online: https://us.aicpa.org/content/dam/aicpa/research/standards/auditattest/downloadabledocuments/au-c-00550.pdf%0A (accessed on 1 April 2022).
  18. Bao, Yang, Bin Ke, Bin Li, Y. Julia Yu, and Jie Zhang. 2020. Detecting Accounting Fraud in Publicly Traded U.S. Firms Using a Machine Learning Approach. Journal of Accounting Research 58: 199–235. [Google Scholar] [CrossRef]
  19. Beneish, Messod D. 1999. The Detection of Earnings Manipulation. Financial Analysts Journal 55: 24–36. [Google Scholar] [CrossRef]
  20. Bradbury, Michael, Yuen Teen Mak, and S. M. Tan. 2006. Board Characteristics, Audit Committee Characteristics and Abnormal Accruals. Pacific Accounting Review 18: 47–68. [Google Scholar] [CrossRef]
  21. Campa, Domenico, Alberto Quagli, and Paola Ramassa. 2023. The Roles and Interplay of Enforcers and Auditors in the Context of Accounting Fraud: A Review of the Accounting Literature. Journal of Accounting Literature, ahead-of-print. [Google Scholar] [CrossRef]
  22. Cressey, Donald R. 1950. The Criminal Violation of Financial Trust. American Sosiological Review 15: 738–43. [Google Scholar] [CrossRef]
  23. Çakali, Kaan Ramazan. 2022. Agency Problem in Corporate Governance: Worldcom Case. İşletme 3: 15–31. [Google Scholar]
  24. Dechow, Patricia M., Weili Ge, Chad R. Larson, and Richard G. Sloan. 2011. Predicting Material Accounting Misstatements. Contemporary Accounting Research 28: 17–82. [Google Scholar] [CrossRef]
  25. Devi, Putu Nirmala Chandra, Anak Agung Gde Putu Widanaputra, I. Gusti Ayu Nyoman Budiasih, and Ni KetutRasmini. 2021. The Effect of Fraud Pentagon Theory on Financial Statements: Empirical Evidence from Indonesia. Journal of Asian Finance, Economics and Business 8: 1163–69. [Google Scholar] [CrossRef]
  26. Dewi, Krisna, and Indah Anisykurlillah. 2021. Analysis of the Effect of Fraud Pentagon Factors on Fraudulent Financial Statement with Audit Committee as Moderating Variable. Accounting Analysis Journal 10: 39–46. [Google Scholar] [CrossRef]
  27. DeZoort, F. Todd, and Paul D. Harrison. 2018. Understanding Auditors’ Sense of Responsibility for Detecting Fraud within Organizations. Journal of Business Ethics 149: 857–74. [Google Scholar] [CrossRef]
  28. Dorgham, Tariq Hani Mohammed, Nabil Bashir Al-Halabi, and Mohammed Musa Shanikat. 2014. The Impact of Management Control Systems on Limiting Fraudulent Practices in Manufacturing Companies. International Journal of Finance and Managerial Accounting 5: 1–14. [Google Scholar]
  29. Handoko, Bambang Leo, and Dessy Tandean. 2021. An Analysis of Fraud Hexagon in Detecting Financial Statement Fraud (Empirical Study of Listed Banking Companies on Indonesia Stock Exchange for Period 2017–2019). Paper presented at the 2021 7th International Conference on E-Business and Applications, Singapore, February 24; New York: ACM, pp. 93–100. [Google Scholar] [CrossRef]
  30. Hasnan, Suhaily, Nur Syafiqah Mohamad Eskandar, Alfiatul Rohmah Mohamed Hussain, Ahmed Abdullah Saad Al-Dhubaibi, Mohd Ezrien Mohamad Kamal, and Rohmawati Kusumaningtias. 2022. Audit Committee Characteristics and Financial Restatement Incidence in the Emerging Market. Corporate and Business Strategy Review 3: 20–33. [Google Scholar] [CrossRef]
  31. Hidayah, Erna, and Galih Devi Saptarini. 2019. Pentagon Fraud Analysis in Detecting Potential Financial Statement Fraud of Banking Companies in Indonesia. In International Conference on Acoounting, Business, & Economics (UII-ICABE 2019). Yogyakarta: Faculty of Business & Economics, Universitas Islam Indonesia, pp. 89–102. [Google Scholar]
  32. Hung, Dang Ngoc, Hoang Thi Viet Ha, and Dang Thai Binh. 2017. Application of F-Score in Predicting Fraud, Errors: Experimental Research in Vietnam. International Journal of Accounting and Financial Reporting 7: 303–22. [Google Scholar] [CrossRef]
  33. Jeppesen, Kim K. 2019. The Role of Auditing in the Fight against Corruption. The British Accounting Review 51: 100798. [Google Scholar] [CrossRef]
  34. Kakati, Shivam, and Chandana Goswami. 2019. Factors and Motivation of Fraud in The Corporate Sector: A Literature Review. Journal of Commerce & Accounting Research 8: 86–96. [Google Scholar]
  35. Kizil, Cevdet, and Burhan Kasbasi. 2018. Accounting Scandals and Eye-Catching Frauds: USA-Japan Comparison by Considering the Role of Auditing. Journal of Asian Research 2: 123–38. [Google Scholar] [CrossRef]
  36. Kohlbeck, Mark, and Brian W. Mayhew. 2017. Are Related Party Transactions Red Flags? Contemporary Accounting Research 34: 900–28. [Google Scholar] [CrossRef]
  37. Larune, Jessica Audrey Theofani, Verawati Gita Sari Harahap, Ida RohanaSilaban, and Arie Pratania Putri. 2021. The Effect of Number of Audit Committee Meetings, Company Size, Leverage and Managerial Ownership on Financial Reporting Fraud in Service Companies on the IDX. JurnalMantik 5: 153–59. [Google Scholar]
  38. Li, Puling, and Zhaoyang Yang. 2019. Accounting Fraud and Prevention in Listed Companies in China. International Journal of Frontiers in Sociology 1: 23–31. [Google Scholar] [CrossRef]
  39. Lokanan, Mark, and Sharma Satish. 2018. A Fraud Triangle Analysis of the Libor Fraud. Journal of Forensic & Investigative Accounting 10: 187–212. [Google Scholar]
  40. Manurung, Daniel T. H., and Niki Hadian. 2013. Detection Fraud of Financial Statement with Fraud Triangle. Paper presented at the 23rd International Business Research Conference, Marriott Hotel, Melbourne, VIC, Australia, November 18–20. [Google Scholar]
  41. Marks, Jonathan. 2012. The Mind behind the Fraudsters Crime: Key Behavioral and Environmental Elements. Hong Kong: Crowe Howarth LLP (Presentation). [Google Scholar]
  42. Md Nasir, Noorul Azwin Binti, Muhammad Jahangir Ali, and Kamran Ahmed. 2019. Corporate Governance, Board Ethnicity and Financial Statement Fraud: Evidence from Malaysia. Accounting Research Journal 32: 514–31. [Google Scholar] [CrossRef]
  43. Md Nasir, Noorul Azwinbinti, Muhammad Jahangir Ali, Rushdi M. R. Razzaque, and Kamran Ahmed. 2018. Real Earnings Management and Financial Statement Fraud: Evidence from Malaysia. International Journal of Accounting and Information Management 26: 508–26. [Google Scholar] [CrossRef]
  44. Novira, Suri, and Yesi Mutia Basridan Pipin Kurnia. 2018. Pengaruh Fraud TriangelDalamMendeteksi Financial Statement Fraud. Jurnal Ekonomi 26: 36–52. [Google Scholar]
  45. Owens-Jackson, Lisa A., Diana Robinson, and Sandra Waller Shelton. 2009. The Association Between Audit Committee Characteristics, the Contracting Process and Fraudulent Financial Reporting. American Journal of Business 24: 57–66. [Google Scholar] [CrossRef]
  46. Pamungkas, Imang Dapit, Imam Ghozali, Tarmizi Achmad, Muammar Khaddafi, and Retnoningrum Hidayah. 2018. Corporate Governance Mechanisms in Preventing Accounting Fraud: A Study of Fraud Pentagon Model. Journal of Applied Economic Sciences 13: 549–60. [Google Scholar]
  47. Pålsson, Anne Marie. 1996. Does the Degree of Relative Risk Aversion Vary with Household Characteristics? Journal of Economic Psychology 17: 771–87. [Google Scholar] [CrossRef]
  48. Pozzoli, Matteo, and Marco Venuti. 2014. Related Party Transactions and Financial Performance: Is There a Correlation? Empirical Evidence from Italian Listed Companies. Open Journal of Accounting 3: 28–37. [Google Scholar] [CrossRef]
  49. Pramana, Yudha, Herkulanus Bambang Suprasto, I. GustiAyu Made Dwija Putri, and I. GustiAyu Nyoman Budiasih. 2019. Fraud Factors of Financial Statements on Construction Industry in Indonesia Stock Exchange. International Journal of Social Sciences and Humanities 3: 187–96. [Google Scholar] [CrossRef]
  50. Premananda, Ni Luh Putu Uttari, I. Ketut Budiartha, Herkulanus Bambang Suprasto, and I. Dewa Nyoman Badera. 2019. Fraud Diamond Analysis in Detecting Fraudulent Financial Reporting (Study on Indonesian Capital Market). International Journal of Sciences: Basic and Applied Research 47: 84–95. [Google Scholar]
  51. Puspitha, Made Yessi, and Gerianta Wirawan Yasa. 2018. Fraud Pentagon Analysis in Detecting Fraudulent Financial Reporting (Study on Indonesian Capital Market). International Journal of Sciences: Basic and Applied Research 42: 93–109. Available online: http://gssrr.org/index.php?journal=JournalOfBasicAndApplied (accessed on 1 May 2021).
  52. Putra, Aditya Prayatna. 2015. Fraud Triangle (Pressure, Opportunity, and Rationalization) and The Level of Accounting Irregularities in Indonesia. In Peluang Dan Tantangan Asean Economic Community (AEC) Terhadap Profesi Akuntan Di Indonesia. Yogyakarta: Deepublish. Available online: http://www.lib.ibs.ac.id/materi/Prosiding/SNAXVIII/makalah/140.pdf (accessed on 11 September 2021).
  53. Qi, Baolei, and Gaoliang Tian. 2012. The Impact of Audit Committees Personal Characteristics on Earnings Management: Evidence from China. Journal of Applied Business Research (JABR) 28: 1331–44. [Google Scholar] [CrossRef]
  54. Rengganis, R. R. Maria Yulia Dwi, Maria Mediatrix Ratna Sari, I. Gusti Ayu Nyoman Budiasih, I. Gde Ary Wirajaya, and Herkulanus Bambang Suprasto. 2019. The Fraud Diamond: Element in Detecting Financial Statement of Fraud. International Research Journal of Management, IT and Social Sciences 6: 1–10. [Google Scholar] [CrossRef]
  55. Reurink, Arjan. 2018. Financial Fraud: A Literature Review. Journal of Economic Surveys 32: 1292–325. [Google Scholar] [CrossRef]
  56. Rukmana, Heru Satria. 2018. Pentagon Fraud Affect on Financial Statement Fraud and Firm Value Evidence in Indonesia. South East Asia Journal of Contemporary Business 16: 118–22. [Google Scholar]
  57. Rustiarini, Ni Wayan, Anik Yuesti, and Agus Wahyudi Salasa Gama. 2021. Public Accounting Profession and Fraud Detection Responsibility. Journal of Financial Crime 28: 613–27. [Google Scholar] [CrossRef]
  58. Saleh, Mousa Mohammad Abdullah, Mohammad Aladwan, Omar Alsinglawi, and Mohammad Odeh Salem Almari. 2021. Predicting Fraudulent Financial Statements Using Fraud Detection Models. Academic of Strategic Management 20: 1–17. [Google Scholar]
  59. Shimamura, Hidemi. 2023. Nissan After Carlos. In Overcoming Crisis Case Studies of Asian Multinational Corporations. Edited by Parissa Haghirian. Singapore: World Scientific Publishing Co. Pte Ltd., pp. 113–27. [Google Scholar] [CrossRef]
  60. Shwetha, S., N. Nayana, and K. Vaishnavi. 2023. A Study on Role and Responsibility of Auditor in Fraud Detection and Various Factors Influencing Fraud Detection in Bengaluru City. Indian Journal of Natural Sciences 14: 59646–58. [Google Scholar]
  61. Sikarini, Rosikah Andaru, and Lintang Kurniawati. 2023. The Effect of Hexagon Fraud in Detecting Fraud Financial Statements (Empirical Study on Financial Sector Companies Listed on the Indonesia Stock Exchange 2017-2021). International Journal of Latest Research in Humanities and Social Science 6: 190–200. [Google Scholar] [CrossRef]
  62. Situngkir, Naomi Clara, and Dedik Nur Triyanto. 2020. Detecting Fraudulent Financial Reporting Using Fraud Score Model and Fraud Pentagon Theory: Empirical Study of Companies Listed in the LQ 45 Index. The Indonesian Journal of Accounting Research 23: 373–410. [Google Scholar] [CrossRef]
  63. Stanwick, Peter A., and Sarah D. Stanwick. 2009. Qwest Communications: A Case Study Of Fraud And Greed. Journal of Business Case Studies (JBCS) 5: 1–4. [Google Scholar] [CrossRef]
  64. Subramanyam, K. R., and John J. Wild. 2009. Financial Statement Analysis, 10th ed. Singapore: McGraw-Hill/Irwin. Available online: www.mhhe.com (accessed on 2 July 2021).
  65. Sultana, Nigar, Harjinder Singh, and Asheq Rahman. 2019. Experience of Audit Committee Members and Audit Quality. European Accounting Review 28: 947–75. [Google Scholar] [CrossRef]
  66. Sunardi, Sunardi, and M. Nuryatno Amin. 2018. Fraud Detection of Financial Statement by Using Fraud Diamond Perspective. International Journal of Development and Sustainability 7: 878–91. [Google Scholar]
  67. Tang, Jiali, and Khondkar E. Karim. 2019. Financial Fraud Detection and Big Data Analytics—Implications on Auditors’ Use of Fraud Brainstorming Session. Managerial Auditing Journal 34: 324–37. [Google Scholar] [CrossRef]
  68. Tarjo, Alexander Anggono, and Eklamsia Sakti. 2021. Detecting Indications of Financial Statement Fraud: A Hexagon Fraud Theory Approach. AKRUAL: JurnalAkuntansi 13: 119–31. [Google Scholar] [CrossRef]
  69. Tebogo, Baitshepi. 2011. Does the Enron Case Study Provide Valuable Lessons in the Early Detection of Corporate Fraud & Failure? Available online: https://www.researchgate.net/publication/228181549_Does_the_Enron_Case_Study_Provide_Valuable_Lessons_in_the_Early_Detection_of_Corporate_Fraud_Failure (accessed on 1 March 2024). [CrossRef]
  70. Therese, Thoresen, and Anita Rakstad Jakobsen. 2008. Greed at the Top: Fraud and the Failure of Oversight at Adelphia Communications Corporation and Tyco International Ltd. Bergen: The Norwegian School of Economics (NHH). [Google Scholar]
  71. Vousinas, Georgios L. 2019. Advancing Theory of Fraud: The S.C.O.R.E. Model. Journal of Financial Crime 26: 372–81. [Google Scholar] [CrossRef]
  72. Wolfe, David T., and Dana R. Hermanson. 2004. The Fraud Diamond: Considering the Four Elements of Fraud. The CPA Journal 74: 38–42. [Google Scholar]
  73. Zachro, Siti Fatimah, and Cynthia Afriani Utama. 2021. The Effect of Family Ownership on the Relationship between Busy Directors and Stock Price Crash Risk for Listed Firms on the Indonesia Stock Exchange. JurnalKeuangan Dan Perbankan 25: 63–80. [Google Scholar] [CrossRef]
Figure 1. Research model of the study.
Jrfm 17 00120 g001
Figure 2. Cumulative net income for industrial sector.
Jrfm 17 00120 g002
Table 1. Independent variable measurement.
Fraud Motive ElementIndependent Variables (and Symbols)Independent Variable MeasurementAdapted from Study
PressureChange in Total Assets (%∆TA)(Total Assets t − Total Assets t − 1) ÷ Total Assets t − 1(Tarjo and Sakti 2021)
Asset Turnover (TA_Trn)Sales ÷ Average Total Assets(Subramanyam and Wild 2009)
Leverage Ratio (LV)(Total debt ÷ total assets)(Lokanan and Satish 2018; Sunardi and Amin 2018; Tarjo and Sakti 2021; Manurung and Hadian 2013; Handoko and Tandean 2021)
Insider Ownership Ratio (Insi_Own)Number of shares that are owned by management ÷ number of company shares(Tarjo and Sakti 2021; Alzoubi 2016)
Return on Assets (ROA)Net Income ÷ Average Total Assets(Lokanan and Satish 2018)
OpportunityInventory Change (%∆Inven)(Inventory t − Inventory t − 1) ÷ Inventory t − 1(Premananda et al. 2019)
Percentage of Independent Audit Committees (%Ind_AuCo)Number of independent members in audit committee ÷ Number of members in audit committee(Bradbury et al. 2006; Alzoubi 2016)
Audit Committee Age (LgAuCo_Age)This variable is measured by calculating the natural logarithm for the average age of audit committee members(Qi and Tian 2012)
Multiple-position Percentages of Director Positions in Other Companies (%Dir_MulPo)Number of director positions in other companies ÷ total number of directors(Puspitha and Yasa 2018; Premananda et al. 2019)
RationalizationAuditor Switching (ExAu_Swt)Dummy variable takes number 1 if the enterprise voluntarily changes its auditors, otherwise 0.(Sunardi and Amin 2018; Tarjo and Sakti 2021; Devi et al. 2021)
ArroganceFrequency Number of CEO Image (CEO_Pic)The accumulated number of CEO images in the annual report of a company(Handoko and Tandean 2021)
CompetenceChange of Director (Dir_Chg)Dummy variable takes number 1 if the directors of the firm are changed, where number 0 denotes that the company’s directors have not changed.(Tarjo and Sakti 2021; Handoko and Tandean 2021; Devi et al. 2021)
CollusionTone-Related Party Transactions (Tone_RPTs)The indicator variable is a dummy variable, so if the company has any forms of tone, RPTs are equal 1, otherwise equal 0. Here, the forms of tone RPTs are as follows:
  • Loans granted to Officer, director, or main shareholder.
  • Borrowings made by Officer, director, or main shareholder.
  • Guarantees from Officer, director, or main shareholder.
  • Consulting provided by Investee, Officer, director, or main shareholder.
  • Legal and investment services provided by Investee, Officer, director, or main shareholder.
  • Unrelated business activities performed by Investee, Officer, director, or main shareholder.
  • Overhead reimbursement paid by Officer, director, or main shareholder.
  • Stock transactions performed by Officer, director, or main shareholder.
(Kohlbeck and Mayhew 2017)
Table 2. Descriptive statistics for dependent and independent variables.
Variable SymbolNMinimumMaximumMeanStd. Deviation
F-Score3490.001.000.06880.2534
%∆TA349−0.66991.2341−0.01250.1873
TA_Trn3490.002.20870.56930.3852
LV3490.0043.66030.41500.3342
Insi_Own3490.000.35350.02650.0641
ROA349−0.96930.4787−0.01270.1239
%∆Inven349−1.00212.22530.652411.3863
%Ind_AuCo3490.001.000.55210.3305
LgAuCo_Age3493.54584.33073.98350.1456
%Dir_MulPo3490. 001.000.70810.2693
ExAu_Swt3490.001.000.06020.2381
CEO_Pic3490.009.000.14320.8624
Dir_Chg3490.001.000.52150.5002
Tone_RPTs3490.001.000.37540.4849
Table 3. Multicollinearity test for the independent variables’ regression testing has been validated with these results.
Variable SymbolToleranceVariance Inflation Factor (VIF)
%∆TA0.6471.546
TA_Trn0.7851.274
LV0.7471.338
Insi_Own0.8521.173
ROA0.5491.822
%∆Inven0.9831.018
%Ind_AuCo0.8681.152
LgAuCo_Age0.9371.067
%Dir_MulPo0.8181.222
ExAu_Swt0.8941.118
CEO_Pic0.9271.079
Dir_Chg0.9171.091
Tone_RPTs0.9301.076
Table 4. Correlation matrix for the independent variables.
Variable Symbol%∆TATA_TrnLVROA%∆Inven%Ind_AuCo%Dir_MulPo
%∆TA1.000
TA_Trn−0.0571.000
LV−0.0940.0091.000
ROA−0.364−0.2320.3681.000
%∆Inven−0.083−0.038−0.015−0.0111.000
%Ind_AuCo−0.040−0.119−0.145−0.102−0.0061.000
%Dir_MulPo0.101−0.036−0.171−0.0950.0170.0981.000
ExAu_Swt−0.4970.1490.0710.118−0.031−0.100−0.020
Dir_Chg0.0310.2880.017−0.0920.0400.249−0.086
CEO_Pic0.0000.0000.0000.0000.0000.0000.000
Insi_Own0.1270.063−0.186−0.180−0.0030.0340.332
LgAuCo_Age0.0820.2920.389−0.1110.029−0.0560.090
Tone_RPTs0.009−0.166−0.3410.147−0.002−0.0540.192
Variable SymbolExAu_SwtDir_ChgCEO_PicInsi_OwnLgAuCo_AgeTone_RPTs
ExAu_Swt1.000
Dir_Chg−0.1291.000
CEO_Pic0.0000.0001.000
Insi_Own−0.0700.0370.0001.000
LgAuCo_Age0.1810.2150.000−0.0061.000
Tone_RPTs−0.081−0.2710.0000.158−0.4071.000
Table 5. Hosmer and Lemeshow Test.
Chi-SquareDFSig.
4.82780.776
Table 6. Omnibus tests of model coefficients.
Chi-SquareDFSig.
Step 1Step62.887130.000
Block62.887130.000
Model62.887130.000
Table 7. Iteration history.
Iteration Step−2 Log LikelihoodCoefficient
Constants
1197.252−1.725
2176.168−2.367
3174.818−2.583
4174.807−2.606
5174.807−2.606
Table 8. Model summary.
−2 Log LikelihoodCox and Snell R SquareNagelkerke R Square
111.9200.1650.418
Table 9. Classification table.
Predicted
F-ScoreCorrect Percentage
ObservedNon-Fraudulent FSs (0)Fraudulent FSs (1)
F-ScoreNon-fraudulent FSs (0)322399.1
Fraudulent FSs (1)19520.8
Overall Percentage 93.7
Table 10. Hypothesis test results for the variables in the logistic regression equation.
Hexagon Theory ElementsVariable SymbolBS.E.WaldSig.Exp. (B)Hypothesis Number
Pressure%∆TA−1.4191.3531.1010.2940.2421
TA_Trn−0.2000.6030.1100.7410.8192
LV0.7211.2200.3490.5552.0563
Insi_Own2.0154.2610.2240.6367.5014
ROA14.0523.85613.2810.000 *1,266,436.555
Opportunity%∆Inven−0.0040.0440.0070.9350.9966
%Ind_AuCo−1.7310.8654.0030.045 *0.1777
LgAuCo_Age−4.5852.4413.5290.0600.0108
%Dir_MulPo2.1631.2463.0140.0838.6989
RationalizationExAu_Swt0.9681.1060.7660.3822.63110
ArroganceCEO_Pic−18.2943373.4590.0000.9960.00011
CompetenceDir_Chg−1.1510.5943.7550.0530.31612
CollusionTone_RPTs2.6860.68415.4000.000 *14.67513
Constant12.9989.9391.7100.191441,540.844
* means statistically significant.
Disclaimer/Publisher’s Note: The statements, opinions and data contained in all publications are solely those of the individual author(s) and contributor(s) and not of MDPI and/or the editor(s). MDPI and/or the editor(s) disclaim responsibility for any injury to people or property resulting from any ideas, methods, instructions or products referred to in the content.

