
Renewable Energy Stocks’ Performance and Climate Risk: An Empirical Analysis

1
Department of Information Systems, Virginia Commonwealth University, Richmond, VA 23284, USA
2
Information Technology & Decision Sciences Department, Old Dominion University, Norfolk, VA 23529, USA
3
Department of Artificial Intelligence, University of International Business and Economics, Beijing 100029, China
*
Author to whom correspondence should be addressed.
J. Risk Financial Manag. 2024, 17(3), 121; https://doi.org/10.3390/jrfm17030121
Submission received: 20 February 2024
/
Revised: 11 March 2024
/
Accepted: 13 March 2024
/
Published: 18 March 2024
(This article belongs to the Special Issue Finance, Risk and Sustainable Development)
Abstract
:This article studies the relationship between renewable energy stocks’ performance and climate risk. It shows that publicly held renewable energy stocks underperform as a reaction to climate policy information releases, modeled by feed-in tariff (FIT) legislation announcements. The study examined stock price behaviors 2 days before and 30 days after FIT policy announcements. The stock sample used in the study has 3702 firm-day combinations, which included 180 cleantech firms and 32 events from 2007 to 2017. Based on the residual analysis of the sample’s abnormal return, it indicated that the FIT announcements are associated with significant declines in returns. The cumulative abnormal return until Day 18 was a significant −0.83%, while the average abnormal return on the day was −0.16% at normal levels. The study partially excluded the likelihood of a transitory result by varying the measurement horizon. It also adopted both the market model and the Fama–French three-factor models to rule out model misspecification when estimating abnormal returns and thus increased the robustness. In fact, the results were stable to changes in estimating the model’s specifications. In addition, the study compared the portfolio’s performance with mimicking portfolios in terms of size, book-to-market equity (BE/ME), and the firms’ geographic location. It demonstrated that the documented anomaly of the portfolio of renewable energy companies is robust.
1. Introduction
Climate risk is an important factor to consider in a firm’s sustainable development process. It encompasses risks stemming from exogenous climate factors such as floods, which can severely impact businesses. For instance, floods can disrupt products’ generation processes, delay the supply of crucial production materials, and damage property assets owned by the firm. Such climate-related disruptions can negatively affect both the operational and financial performance of the firm, potentially leading to financial losses. Therefore, climate risk should be factored into the valuation process of the firm and reflected in its overall value. Investors and stakeholders alike must take climate risk into account when evaluating companies or projects. Failure to do so could result in significant investment failures and financial losses.
Investors in both the equity and bond markets price the climate risk. In the bond market, climate risk leads to higher underwriting fees and initial yields, particularly in countries issuing long-term municipal bonds (Lin and Wu 2023). These higher fees stem from the potential financial losses associated with climate risk. Notably, the impact of climate risk on bond-issuing fees is most pronounced in long-term securities. In the equity market, climate risk-related policies contribute to abnormal returns in the clean energy sector compared with peer sectors. Policies addressing climate risk raise awareness of climate change, prompting investors to integrate this information into equity valuations. Positive information favoring the clean energy sector enhances its equity valuations. Therefore, investors in both the equity and bond markets are cognizant of climate risk and incorporate it into the valuation process of equities and bonds. In essence, both markets price climate risk accordingly.
Renewable energy firms provide products, services, or processes that minimize waste. For example, Sunrun Inc. (San Francisco, CA, USA), a United States-based provider of residential solar electricity, operates as a renewable energy company. Compared with other firms, renewable energy companies are more susceptible to climate risk. In response to climate risk-related policy announcements, such as the Paris Agreement, Climategate, and Fukushima, renewable energy firms experienced more significant abnormal returns compared with other firms. Therefore, when investigating the pricing of climate risk in the equity market, it is beneficial to compare renewable energy firms with their peer firms.
Several studies have investigated whether and how the stock market prices climate risk. According to the literature, climate risk is likely to be a new risk factor that is incorporated into equity prices (Faccini et al. 2022; Ginglinger and Moreau 2023). Properly managing climate risk requires an accurate measure of it. An inaccurate measure could impede effective risk management. Various measures of climate risk exist, including natural disasters, global warming, and government policies related to climate change. Among these measures, climate risk policies are commonly used. This study contributes to the measurement of climate risk by utilizing governments’ environmental policies, specifically the feed-in tariff (FIT) policies. FIT is a policy aimed at incentivizing investments in renewable energy (Wilby et al. 2009). It guarantees small-scale producers of renewable energy an above-market price for their contributions to the grid. Compared with other policies, the FIT policy is the most widely recognized government initiative promoting the generation and utilization of renewable energy in the market (Bürer and Wüstenhagen 2009). Additionally, the adoption of a FIT policy helps mitigate self-selection bias, which occurs when firms with certain characteristics are more likely to make specific corporate decisions. It is unlikely that self-selection bias affected this study since the FIT legislation event is exogenous to firms.
The study proposes a hypothesis stating that the announcement of the FIT policy increases consumers’ awareness of climate change, prompting them to purchase more renewable energy-related products as a means of mitigating climate risk. Consequently, the market performance of the renewable energy sector improves, leading investors to view the sector more favorably when evaluating its value. The study identified 1-month stock return anomalies that support the existence of the climate risk factor. Specifically, the portfolio of renewable energy stocks exhibited a non-rebounding reaction to climate risk-relevant information. According to the study, if multi-factor models capture all sources of economic risks, the return of cleantech stocks should demonstrate no distinct movement compared with non-cleantech firms with a similar size, book-to-market ratio, and geographic location. However, the behavior of the sample returns deviated from that of its benchmark portfolio. The return of cleantech stocks appeared to be sensitive to climate policy information, whereas the benchmark portfolio did not exhibit similar patterns. To rigorously test the hypothesis, the study used different measurement horizons, estimation models, methods for calculating abnormal returns, and benchmark portfolios and indexes, all of which consistently supported the same conclusion. Additionally, the study suggested that the model’s specification of trading volume is unlikely to be a critical factor in the test. In fact, slight adjustments to the risk factor specification only marginally affected the overall volatility, with the main result remaining consistent.
The study significantly contributes to the literature on pricing climate risk. Painter (2020) examined how the municipal bond market prices climate risk and found that it is priced in poorly rated bonds. Schlenker and Taylor (2021) demonstrated that financial derivatives also incorporate climate risk into pricing. Stroebel and Wurgler (2021) suggested that asset prices may underestimate the climate risk. Despite these insights, there remains a gap in understanding how the equity market prices climate risk. This study fills this gap by investigating how the US equity market prices climate risk. It revealed that the US equity market responds to announcements of climate risk-related policy legislation, providing empirical evidence that the equity market indeed prices climate risk. While previous studies explored how various climate change policies, such as the Paris Agreement, Climategate, and Fukushima, affected the equity market’s returns, this study focused on a different type of climate risk policy: the FIT policy and its impact on the equity market. Additionally, this study used the daily prices of individual equities, offering a more precise analysis. Moreover, the study contributes to the literature on climate risk management (Andersson et al. 2016; Hong et al. 2019), enhancing our understanding of how climate risk is perceived and managed within the financial markets.
The article is organized as follows: Section 2 reviews the literature on pricing climate risk. Section 3 describes the theoretical background of this study. Section 4 describes the methodology adopted by the study. Section 5 reports the main findings of the study. Section 6 presents the results of the robustness tests. Section 7 is the discussion. Section 8 concludes the study, mentioning some limitations and discussing future research directions.
2. Literature Review
Climate risk has been extensively studied in the finance literature. It represents a non-business risk stemming from climate change, and government environmental policies are commonly used to hedge against climate risk. The renewable energy sector, in particular, faces heightened climate risk due to the public good nature of its products. However, the climate risk premiums associated with the renewable energy sector remain largely underexplored. This is attributed to the limited investment experience of investors and entrepreneurs, as well as their lack of knowledge in the renewable energy sector. In the equity market, accurate measurement of the climate risk is crucial for effectively pricing it. In the literature, climate risk is primarily measured using three types of events: natural disasters, global warming, and climate policies. Natural disasters, such as droughts, can serve as indicators for forecasting poor stock returns of companies in the food sector (Ginglinger and Moreau 2023). In contrast, while the factor of global warming is less significantly priced in the stock market, climate policy-related factors exhibit greater significance (Faccini et al. 2022). For instance, studies by Bartram et al. (2022) demonstrated that climate policies impact both firms’ total emission performance and abnormal returns. This study adopted climate policies as the measure of climate risk.
Compared with other sectors, the renewable energy sector is expected to yield higher returns due to facing greater climate risk. Unlike products whose demand is primarily determined by price and demand equilibrium, the demand for cleantech products is influenced by climate risk-related factors. Some actions taken by environmentalists may escalate the climate risk faced by the cleantech sector, as they could impact the development direction of clean technology. For instance, tidal energy projects might pose threats to marine habitats and marine life, leading environmental organizations to protest against their usage, thus hindering the widespread adoption of tidal energy-generating technology. Furthermore, fluctuations in the prices of natural resources used in cleantech product generation can increase climate risk by affecting the market demand for clean products. For example, between 2009 and mid-2011, the price of polysilicon plummeted by 89%. This dramatic price drop rendered Solyndra’s solar panel technology, namely copper indium gallium selenide (CIGS), which had previously enjoyed a competitive advantage due to its low price, uncompetitive in the market. Eventually, this financial strain led the firm to declare bankruptcy.
In reality, however, investments in the renewable energy sector have underperformed. From a market perspective, low demand for renewable energy products is one reason, while the limited opportunities for renewable energy startups to be acquired by established companies is another. Additionally, the significant capital requirements and lengthy investment periods for startups to succeed present further challenges. For example, Solyndra, a manufacturer of photovoltaic systems, raised $970 million in equity for a planned IPO in 2010 but ultimately withdrew the IPO and filed for bankruptcy in 2011. This failure can be attributed to the substantial gap between its operational needs and the amount of capital it was able to secure. Indeed, such mismatches can severely hinder the development of renewable energy companies. Many startups in the renewable energy sector fail because they are unable to secure sufficient follow-on funding during the production and commercialization stages. The development path for these startups often spans 10 years or more, earning it the moniker “the valley of death.” To fully realize the climate risk premiums associated with the renewable energy sector, the study argues for increased investments in this sector.
The feed-in tariff (FIT) policy functions as a subsidy system aimed at bolstering the production and demand for clean electricity. It achieves this goal by providing reimbursement to both the generators and users of clean electricity. Under this policy, the government, along with designated electricity suppliers, enters into contracts lasting 10 to 25 years with qualified electricity producers or consumers. These parties receive payments according to the schedule specified in the contract. The FIT payment rate is fixed and determined by the installation cost of the clean electricity-generating plant, with payments calculated per kilowatt-hour (kWh) of electricity generated. In the United States, the FIT policy serves as a means to redirect capital from other sectors toward the renewable energy sector. By doing so, it reduces the cost of renewable energy products, stimulates demand for these products, fosters the development of clean technology, and enhances the sector’s competitive edge in the market. The stability, continuity, and credibility of the FIT policy position it as an ideal complementary source of funding for renewable energy startups. Moreover, the policy encourages potential buyers to acquire renewable energy startups. In summary, the FIT policy serves as a signal of the renewable energy sector’s prosperity to investors.
Bartram et al. (2022) investigated the impact of California’s carbon cap-and-trade program on a firm’s greenhouse gas emissions. The authors found that the program significantly reduced greenhouse gas emissions for financially unconstrained firms. The program is expected to increase regulatory costs, motivating firms to decrease their greenhouse gas emissions. Similarly, other environmental policies, such as the feed-in tariff (FIT) policy, are also likely to increase regulatory costs. The improved environmental performance resulting from such policies affects the abnormal return of firms in the capital market. The authors modeled climate change policies, including the Paris Agreement, Climategate, Fukushima, and FIT policy announcements, as events. They demonstrated that the renewable energy sector reacts positively to climate change policies. These policies encourage investors to consider climate risk in the valuation process, leading to a positive expectation for the renewable energy sector.
Painter (2020) explored how the bond market prices climate risk. The author demonstrated that countries facing greater climate risk pay higher underwriting fees and initial yields when issuing long-term municipal bonds. These increased issuing fees serve as compensation for the potential losses caused by climate risk. A major factor contributing to the variation in issuing fees is investor attention. The Stern Review on Climate Change, for instance, attracted significant investor attention to climate risk issues (Zscheischler et al. 2018). Consequently, investors adjust their required rate of return on bonds based on the climate risk level of a country. In general, investors demand a higher rate of return for countries with higher levels of climate risk.
Schlenker and Taylor (2021) suggest that financial derivatives incorporate climate risk into their prices. The authors demonstrate that the prices of financial derivatives respond to both short-term weather forecasts and long-term weather trends. Investors tend to align the price of financial derivatives more closely with climate model predictions than with weather station trends. This finding supported the notion that accurately assessing climate change provides firms with valuable information to predict future weather changes and climate trends. As a result, firms can take proactive actions to mitigate potential losses due to weather changes, and investors can evaluate firms’ value with greater accuracy.
The study makes a significant contribution to the literature by using the feed-in tariff (FIT) policy to model climate risk. The FIT policy is intricately linked to the renewable energy sector, serving as a subsidy policy implemented by the US government to incentivize the production and consumption of clean electricity generated from renewable sources such as wind, solar, and tidal energy. Through FIT policy legislation announcements, the US government determines various factors, including the supported renewable energy generation technologies, tariff rates, contract lengths, and other regulations and terms. These legislation announcements of the FIT policy draw the attention of investors, particularly those within the renewable energy sector, to climate risk. Investors interpret these announcements as positive signals, leading to an increase in the valuation of renewable energy equity. Consequently, significant abnormal returns are observed for equities in the renewable energy sector. Furthermore, the FIT policy can enhance the financial performance of renewable energy firms, thereby influencing the stock performance of these firms.
Like our study, Pham et al. (2023), Xu et al. (2023), and He and Zhang (2022) focused on the impact of climate policies on the stock returns of environmentally friendly firms, finding implications for climate risk evaluations in equity prices. In contrast, Lin and Wu (2023) concentrated on the impact of climate risk disclosures on the risk of a stock price crash in China. Xu et al. (2023) also compared the results between the US and China. Another difference is that these studies used different types of climate policies or different aspects of policies as the independent variables. For instance, Xu et al. (2023) used climate policy uncertainty as the independent variable instead of the policy itself. Pham et al. (2023) also investigated the impact of tightening and loosening of climate policies associated with the Paris Agreement and US presidential elections on stock returns. None of the previous studies have investigated the impact of the FIT policy on climate risk evaluations. This study aims to fill this gap in the literature.
3. Theoretical Background
The findings in the study are grounded in the information avoidance theory, as proposed by Lin and Wu (2023). According to this theory, individuals may consciously or unconsciously ignore or downplay the risks associated with climate change, despite the availability of scientific evidence and information highlighting its potential impacts. This avoidance behavior is often driven by feelings of fear, helplessness, or guilt that arise when confronted with climate risk information. People tend to steer clear of such information to avoid the negative emotions associated with acknowledging the severity of the problem.
Moreover, individuals may avoid climate risk information if it challenges their existing beliefs, as this can create cognitive dissonance and psychological discomfort. Additionally, social norms and group identities play a significant role in shaping individuals’ acceptance of climate risk. If climate risk contradicts their social identity, individuals may be inclined to ignore it. Furthermore, confirmation bias leads individuals to seek out information that confirms their existing beliefs while disregarding contradictory information. This bias can result in selective exposure to information, further exacerbating the tendency to ignore climate risk-related information. Even when individuals accept climate risk, they may prioritize other risks or concerns over climate risks, leading them to overlook climate risk information.
However, the government’s announcement of a FIT policy draws significant attention to climate risk. This forces individuals to confront climate risk-related information, as they are compelled to acknowledge it due to the government’s announcement of the FIT information. Moreover, companies respond to the FIT information, thereby revealing the impact of climate risk on equity prices. For instance, as highlighted by Ginglinger and Moreau (2023), climate risk influences the capital structure of firms. Consumers also show increased interest in purchasing renewable energy stocks. In conclusion, the government’s public announcement of a FIT policy ensures that individuals cannot ignore climate risk-related information, leading to corresponding responses from consumers and firms, thereby reflecting the climate risk in equity prices.
4. Methodology
In this study, first, the expected return based on the market model was estimated by
Equation (1) estimates the relationship between an equity share’s actual return and the return on the market via ordinary least squares (OLS) regression, where is the intercept, is the estimated coefficient of the equity share’s actual return on the market return, and is the residual. In Equation (1), the components of the regression are replaced with three and five Fama–French factors for the corresponding models, respectively.
Next, the abnormal return based on the market model was estimated by
Equation (2) calculates the abnormal return by taking the difference between the actual return and the estimated expected return. The estimated expected return is determined with the regression coefficients estimates and obtained from Equation (1) (Agrawal and Kamakura 1995; Binder 1998). The cumulative abnormal returns (CARs) are estimated by adding the sum of abnormal return over an event window.
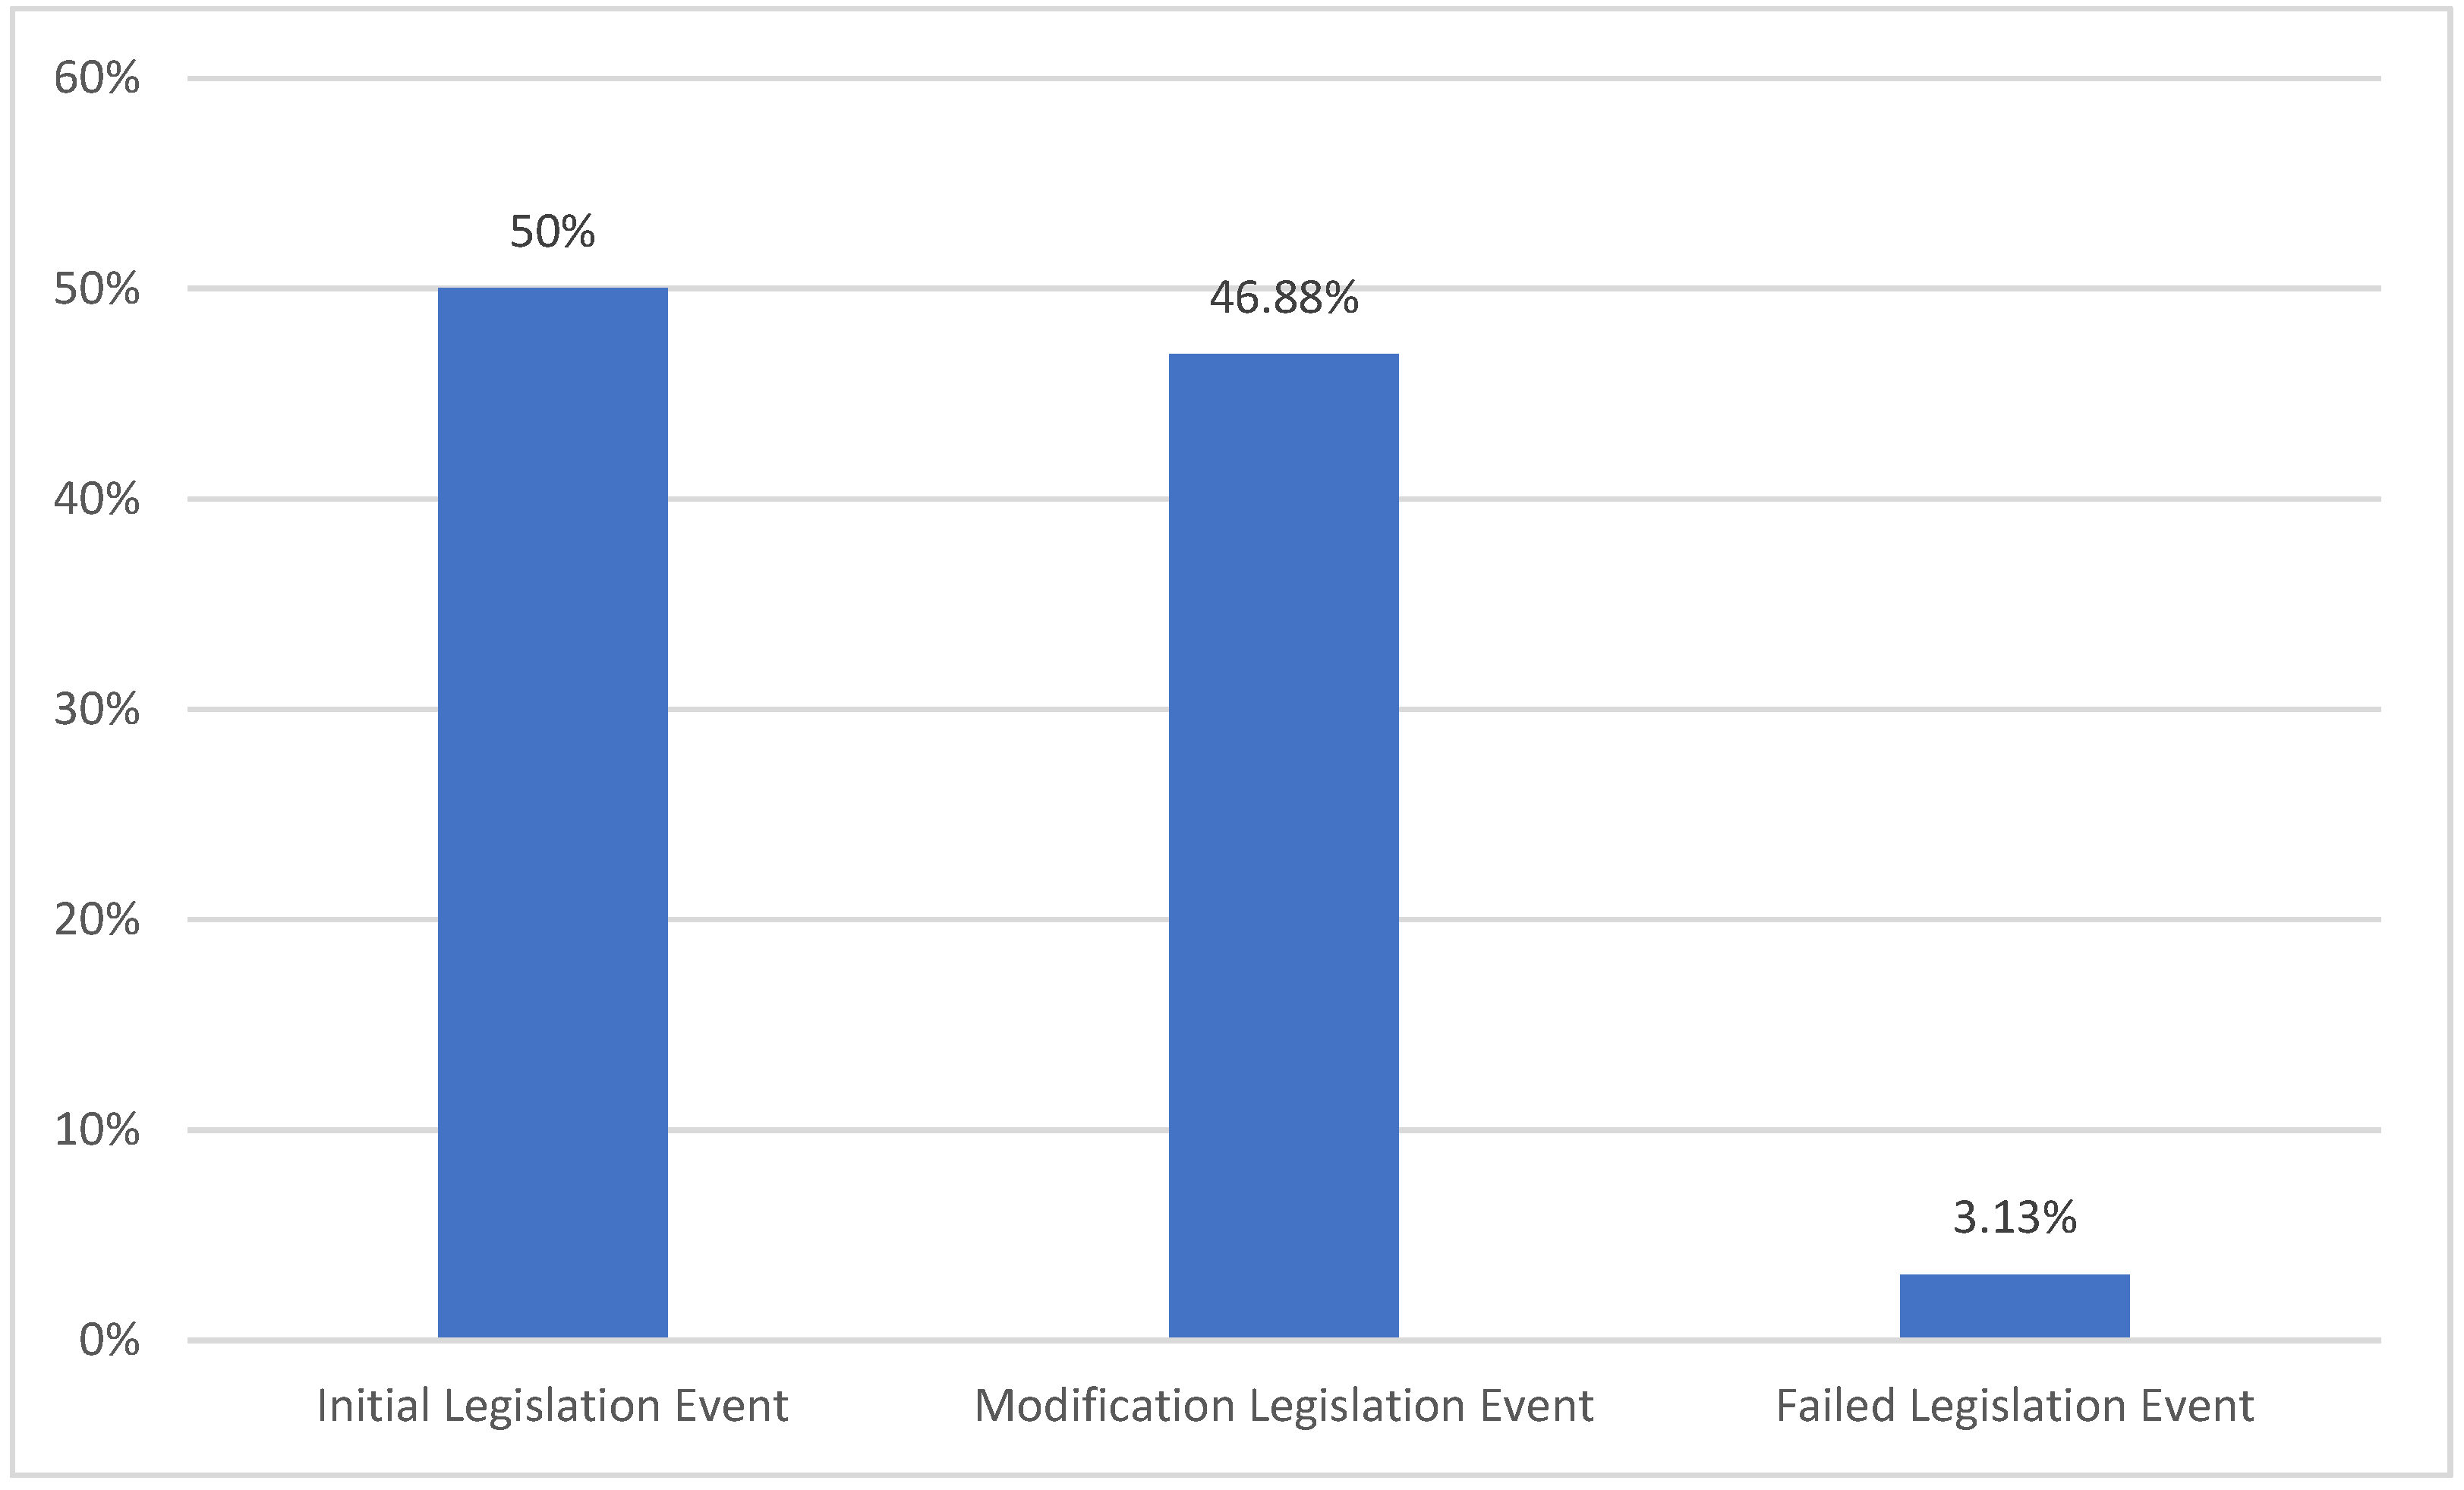
The study manually collected the legislative events of FIT policies from government websites, such as the California Public Utilities Commission (CPUC) website (https://www.cpuc.ca.gov/, accessed on 19 February 2024). As can be seen from Figure 1, there were 32 state-level FIT legislation events from 2007 to 2017, including 16 initial FIT legislation events, 15 modification legislation events, and one failed FIT legislation event. There were 180 renewable energy firms identified by matching the firm’s business description with the keywords from the categories of cleantech groups. Refer to Cumming et al. (2016) for a detailed description of the methodology. The study generated a sample of 3702 firm-day combinations, which included 180 cleantech firms and 32 events from 2007 to 2017.
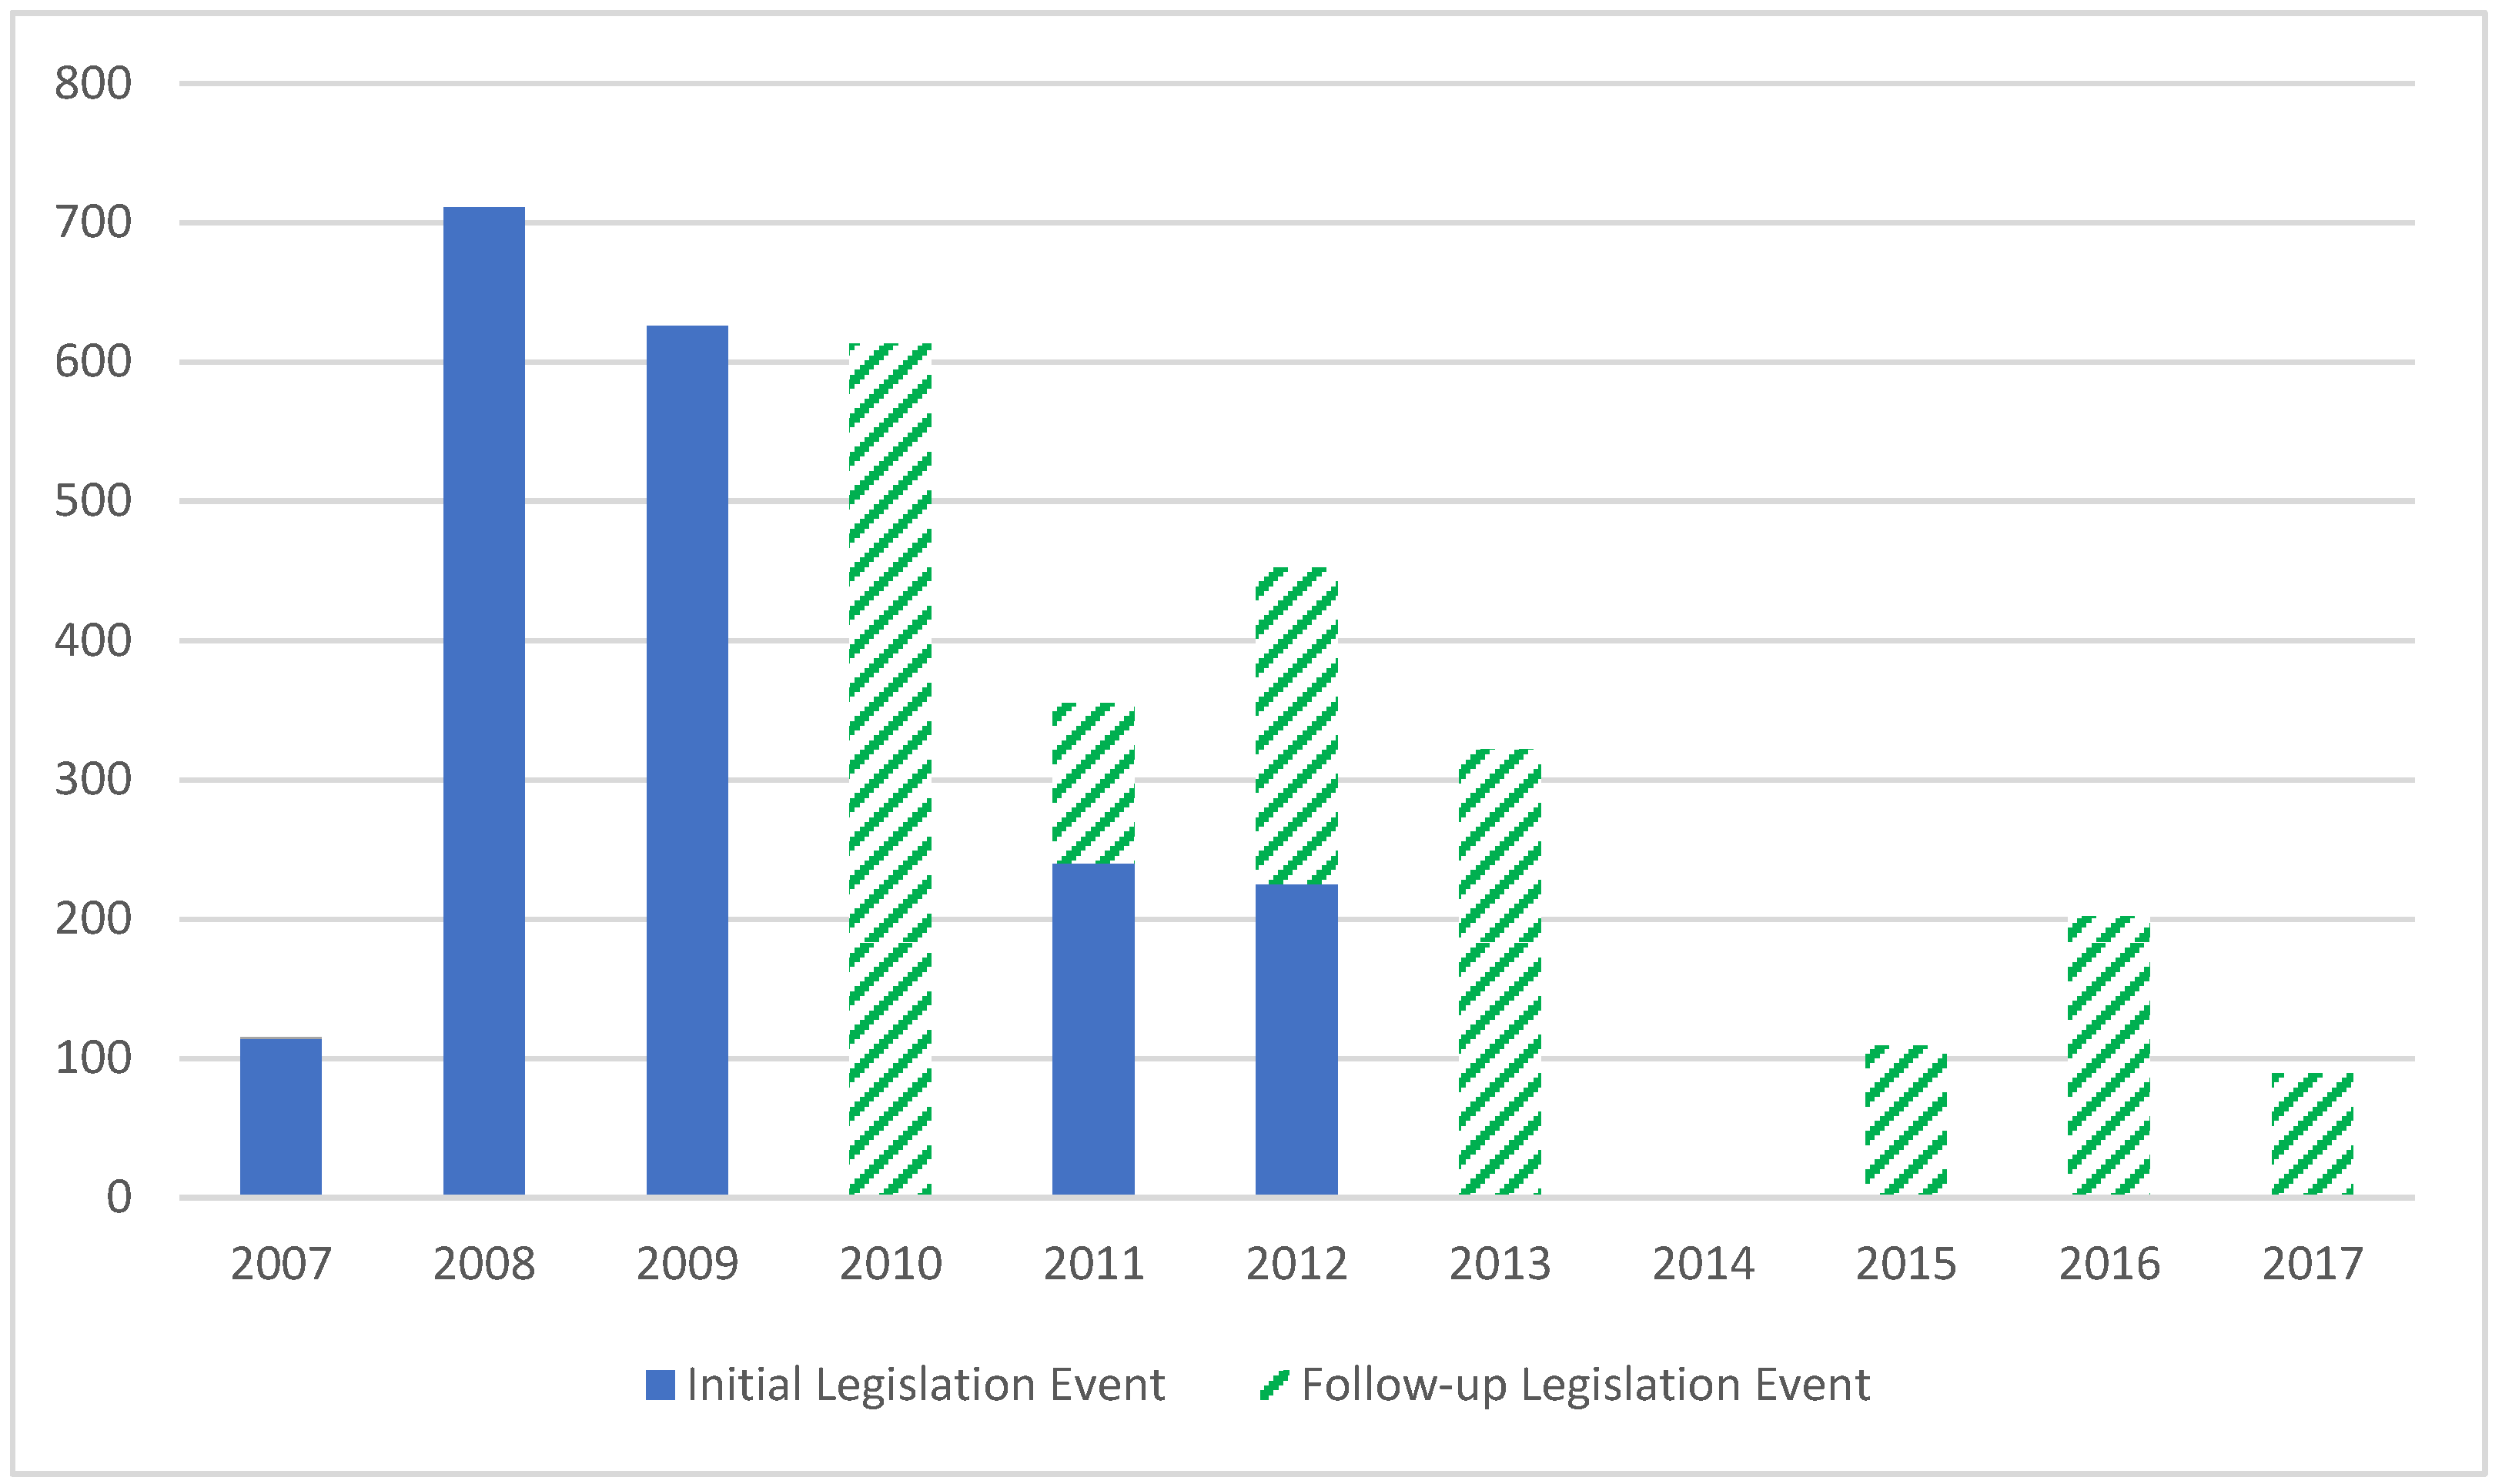
Figure 2 displays the types of legislative events of the sample for each year. The equity return data primarily originated from the Center for Research in Security Prices (CRSP) database, Kenneth French’s website, and the Capital IQ platform. The accounting data were sourced from Compustat.
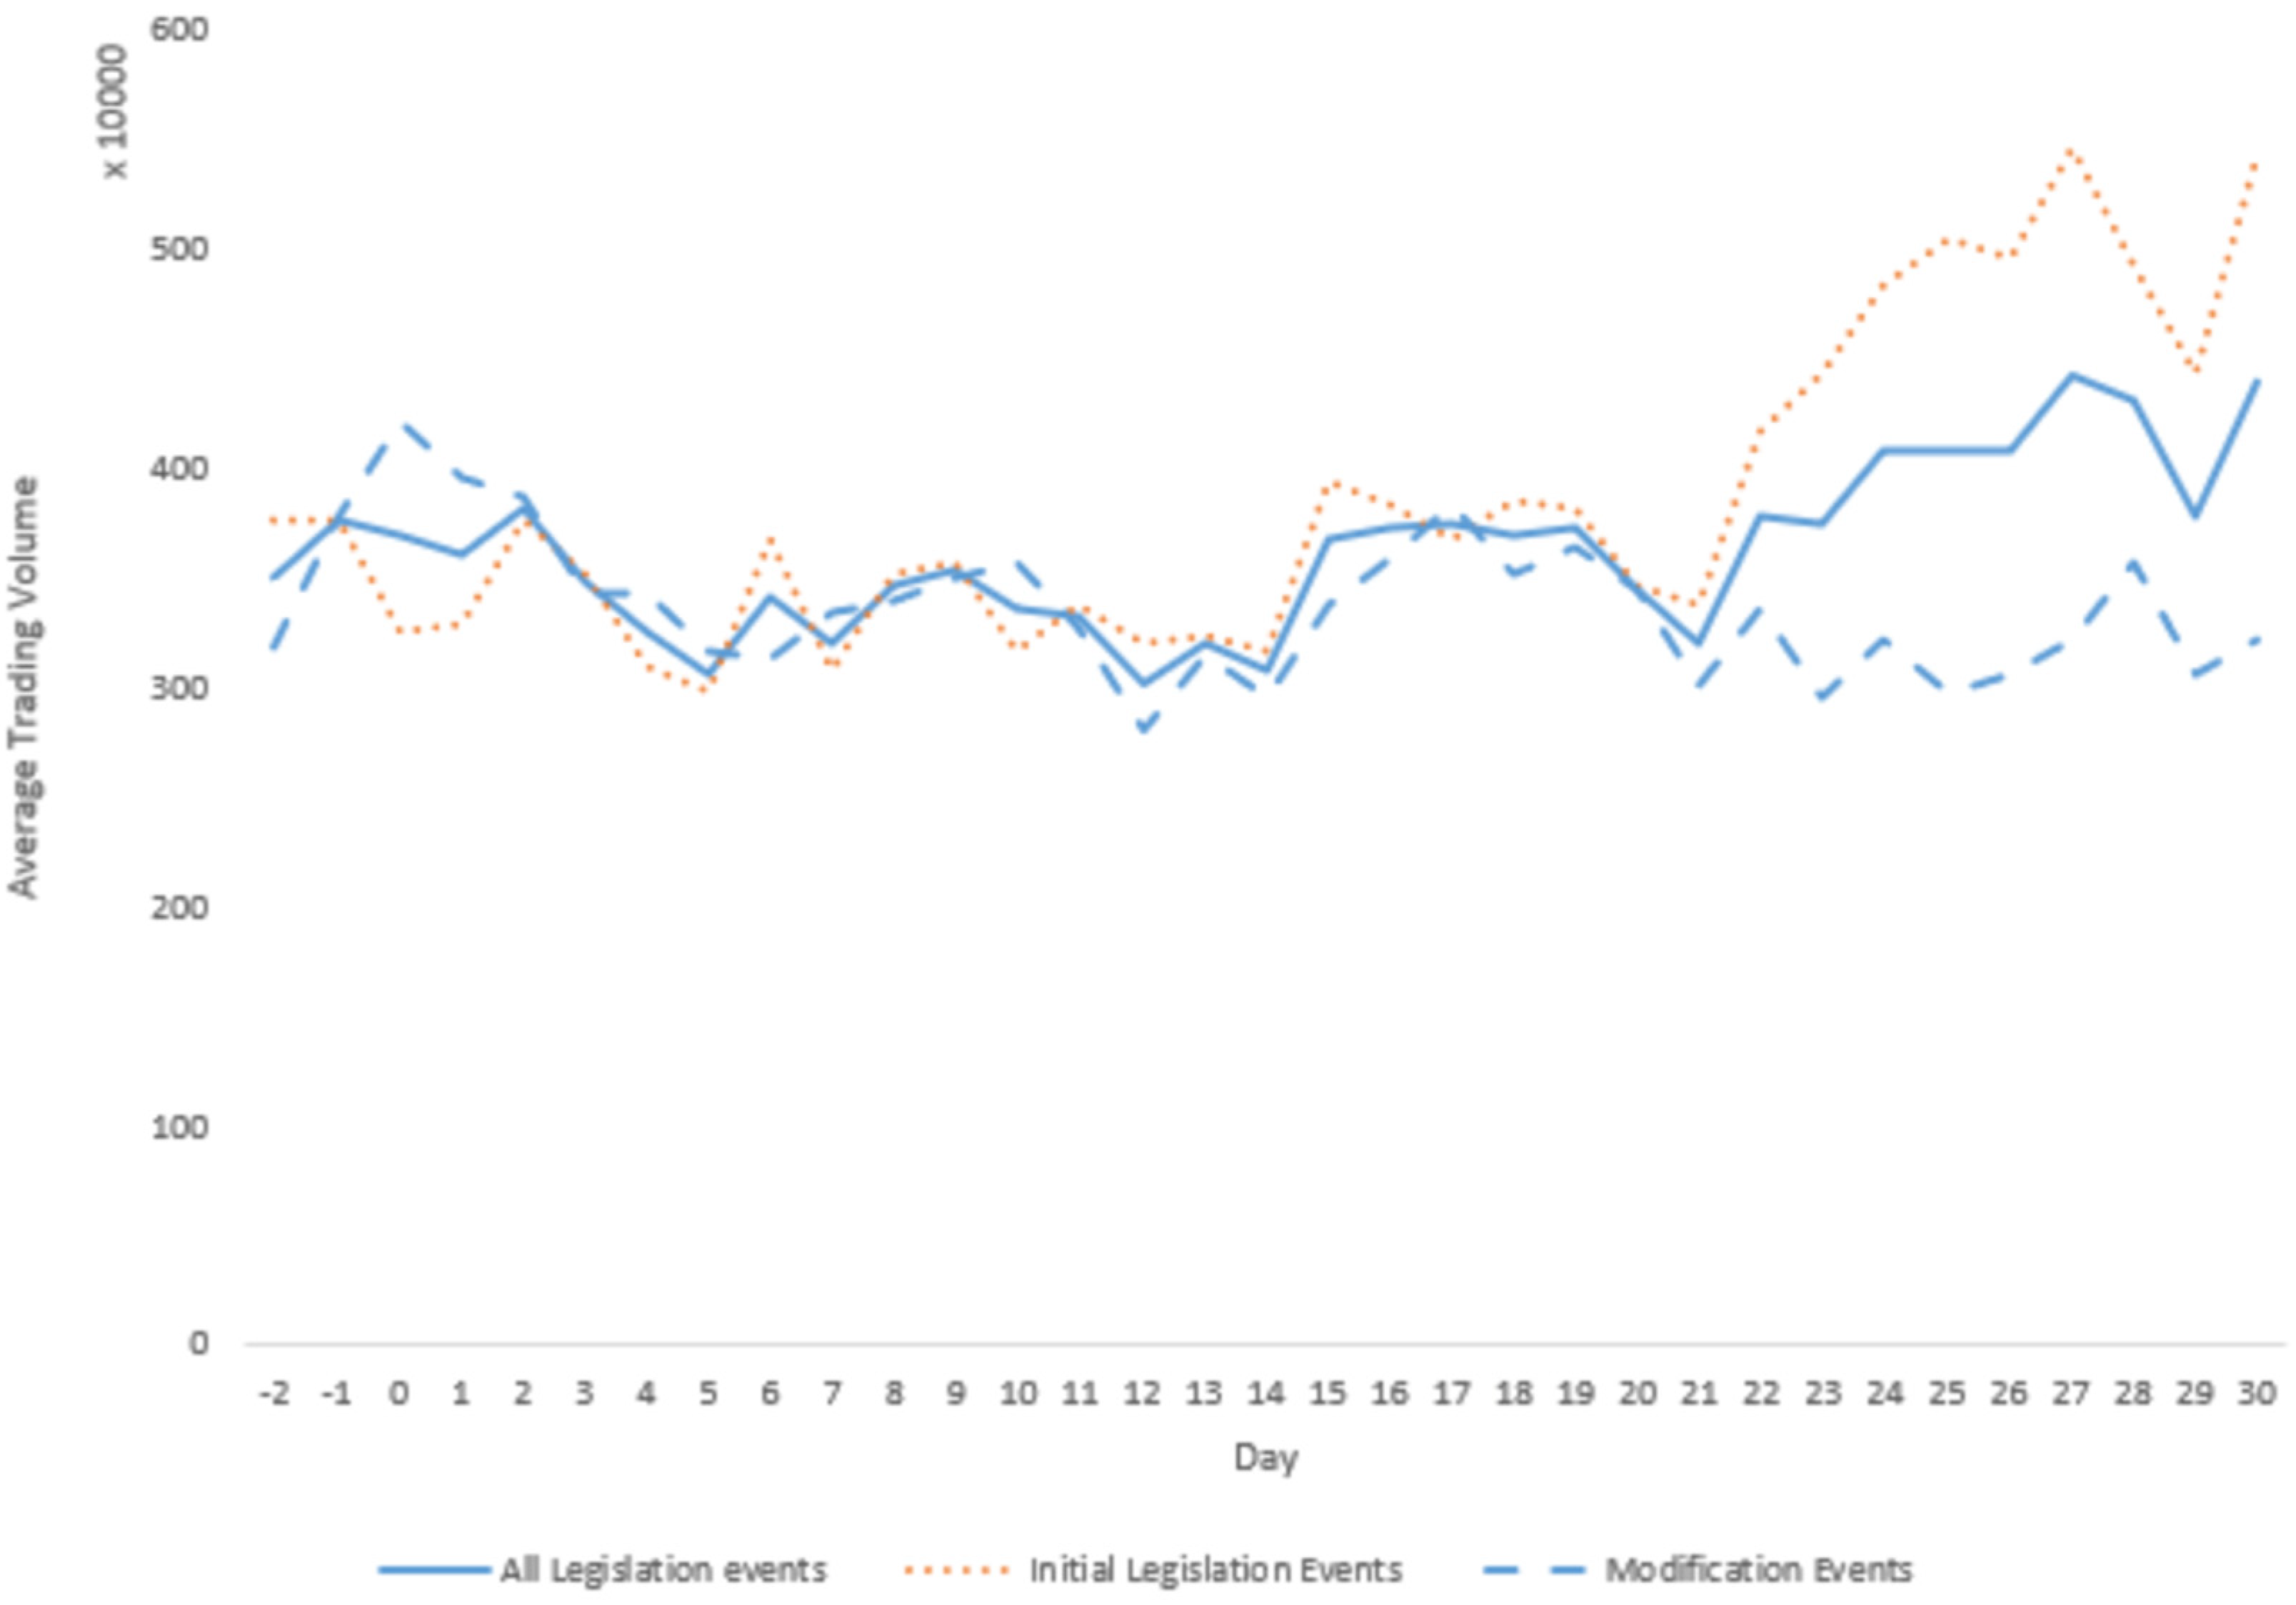
Figure 3 illustrates the daily trading volumes for the portfolio of 180 renewable energy firms following the announcement day of FIT policy legislation events. Notably, there was a significant increase in trading volumes after Day 19, with Day 0 representing the announcement day. It is evident from Figure 3 that the initial legislation events resulted in higher trading volumes compared with the modification events.
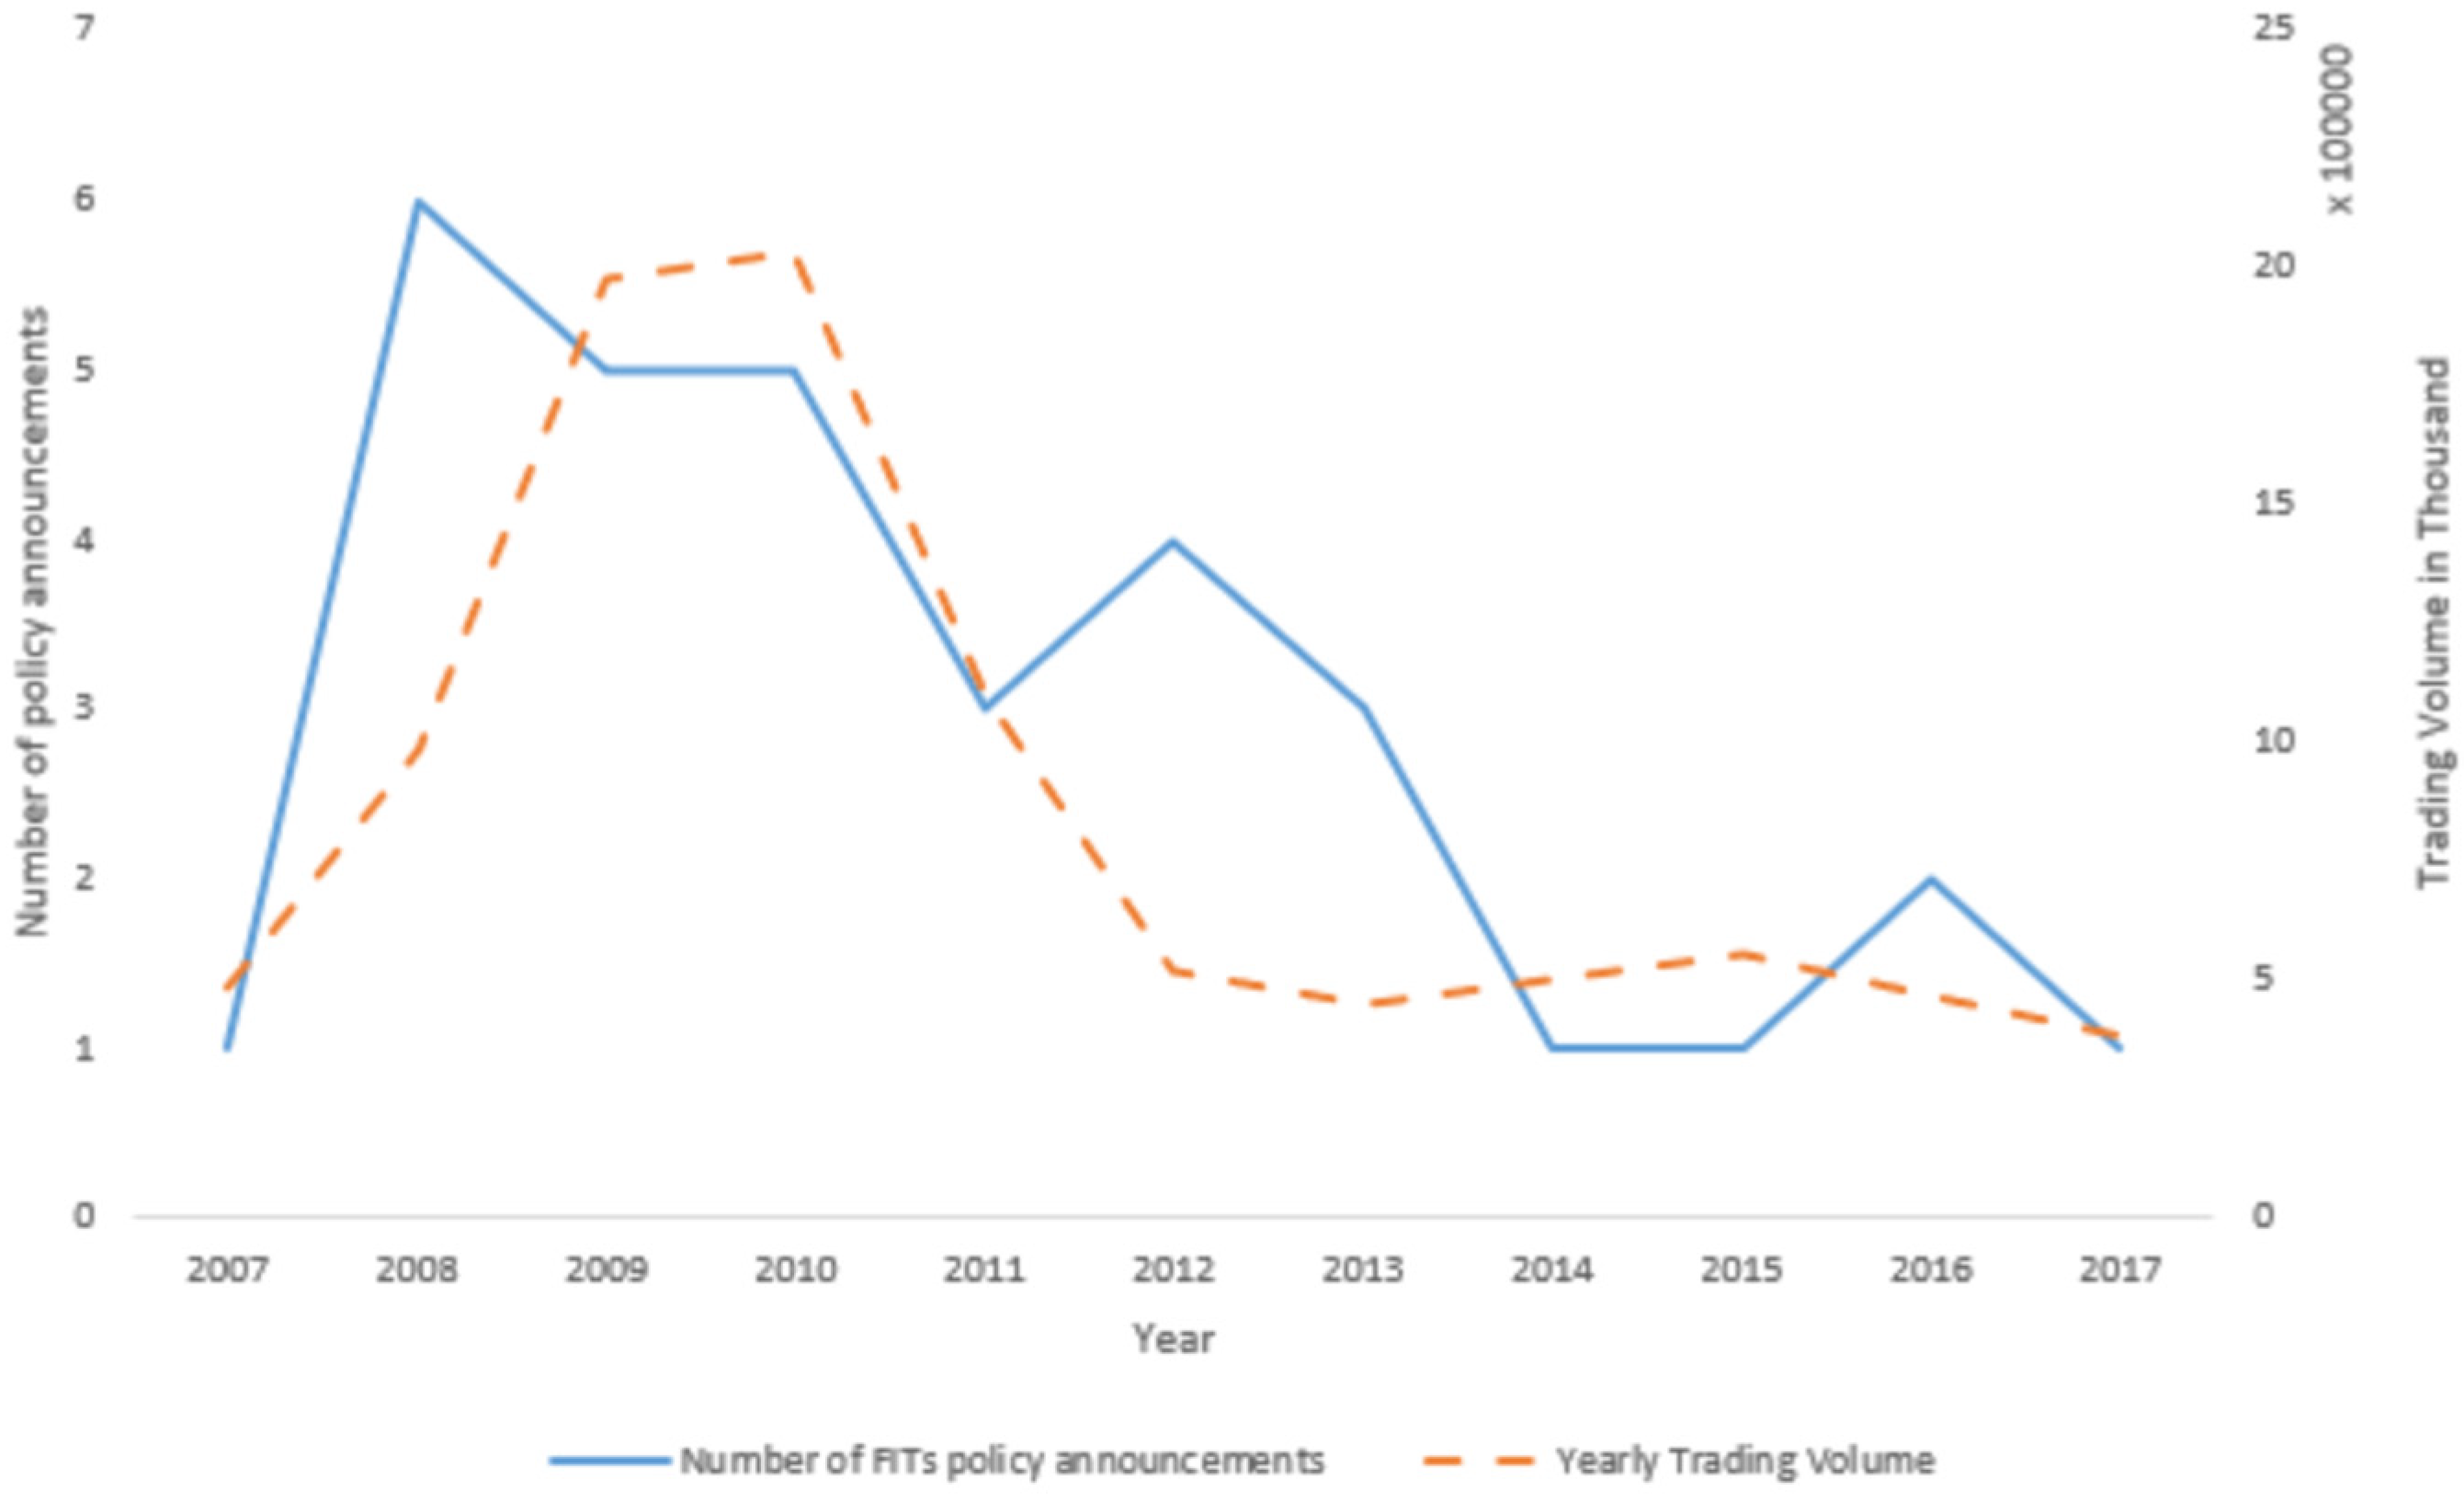
Figure 4 depicts the yearly trading volumes of the portfolio of renewable energy firms in comparison with the number of FIT announcements spanning from 2007 to 2017. Notably, the number of FIT announcements peaked in 2008, followed by a decline in subsequent years. In contrast, the year 2010 recorded the highest trading volumes, closely followed by 2009. Furthermore, there appears to be a positive correlation between the number of FIT announcements and the yearly trading volumes. Additionally, a lag of 1 to 2 years exists between the FIT announcements and the yearly trading volume.
5. Research Findings
Figure 5 illustrates the cumulative abnormal returns for the portfolio of 180 renewable energy firms. It tracks the cumulative abnormal returns from 2 days before (i.e., a negative 2-day event window) to 30 days after (i.e., a positive 30-day event window) around the events’ dates, utilizing various estimation models. The cumulative abnormal returns (CAR) represent the average daily cumulative returns for the renewable energy firms. Abnormal returns (ARs) were computed as residuals, based on the stocks’ daily return and the benchmark model’s estimations. The benchmark models used include the market model (market model CAR), the Fama–French three-factor model (3-factor model CAR), the Fama–French five-factor model (5-factor model CAR), and the Fama–French three-factor model with 49 industry portfolios (3-factor model with 49 industry CAR). As observed from Figure 5, significant CARs were evident after Day 15, consistent with the 16-day lag observed in the trading volumes. Among the estimation models, the 3-factor model with 49 industry CAR exhibited the most significant results, followed by the market model CAR. The 3-factor CAR and 5-factor CAR displayed similar patterns. Conversely, the cleantech firm index CAR was insignificant compared with other CARs such as the 3-factor model CAR and market model CAR. These results suggested that the cleantech sector prices the FIT information, whereas the non-cleantech sector fails to do so. Additionally, the findings indicated that industry-related factors play a crucial role in the evaluation of the FIT information.
The central theme of the study revolved around whether renewable energy stocks exhibit abnormal returns in response to policy-relevant information. It operated under the assumption that a well-specified asset-pricing model is utilized. If the stock performance of the renewable energy sector is solely a result of confounding effects, such as different betas, sizes, and book-to-market ratios, then the residuals from the regressions should be both economically and statistically indistinguishable from 0. However, Table 1 demonstrates that on Days 3, 5, 6, 12–18 (excluding Day 13), and 22, the firms statistically underperformed significantly, with their values being inflated. These aforementioned days exhibited strong testing power at the significance level of 1%. An information-based interpretation of negative abnormal returns suggested that the market participants absorbed specific information about renewable energy firms from the FIT announcements. On the other hand, a firm value-based interpretation of the negative abnormal returns indicates that renewable energy firms experienced a non-rebounding increase in value following the FIT announcements. Consequently, the expected firm value from investors became inflated, resulting in a declining required equity return. This was further supported by the trading volumes, as investors increased their trading volume in response to their evaluation of firm values. Table 2 presents the summary statistics for the 180 cleantech firms.
Given that the events are publicly accessible information, it is plausible that the observed negative abnormal returns stemmed from transitory effects due to booming trading volumes. Figure 3 illustrates the daily average trading volume of the entire sample and its subsamples. Notably, the number of traded shares did not surge until 20 days after the announcement events. However, Figure 5 depicts a decline in cumulative abnormal returns around Day 12 to Day 18. Consequently, controlling the trading volumes seemed less urgent. Presumably, it was the variation in prices that prompted investors’ trading activity. Furthermore, Figure 4 displays the co-movements of yearly average trading volumes and the number of announcements by year. It suggests that the announcement events slightly preceded the trading volumes, thereby supporting our proposition.
6. Robustness Tests
In this section, the study conducted robustness tests aimed at enhancing the credibility of the findings and eliminating potential alternative explanations. These tests included examining different event windows, establishing a benchmark portfolio, utilizing various indexes of the renewable energy sector, and calculating buy-and-hold returns to bolster the rigor of the findings.
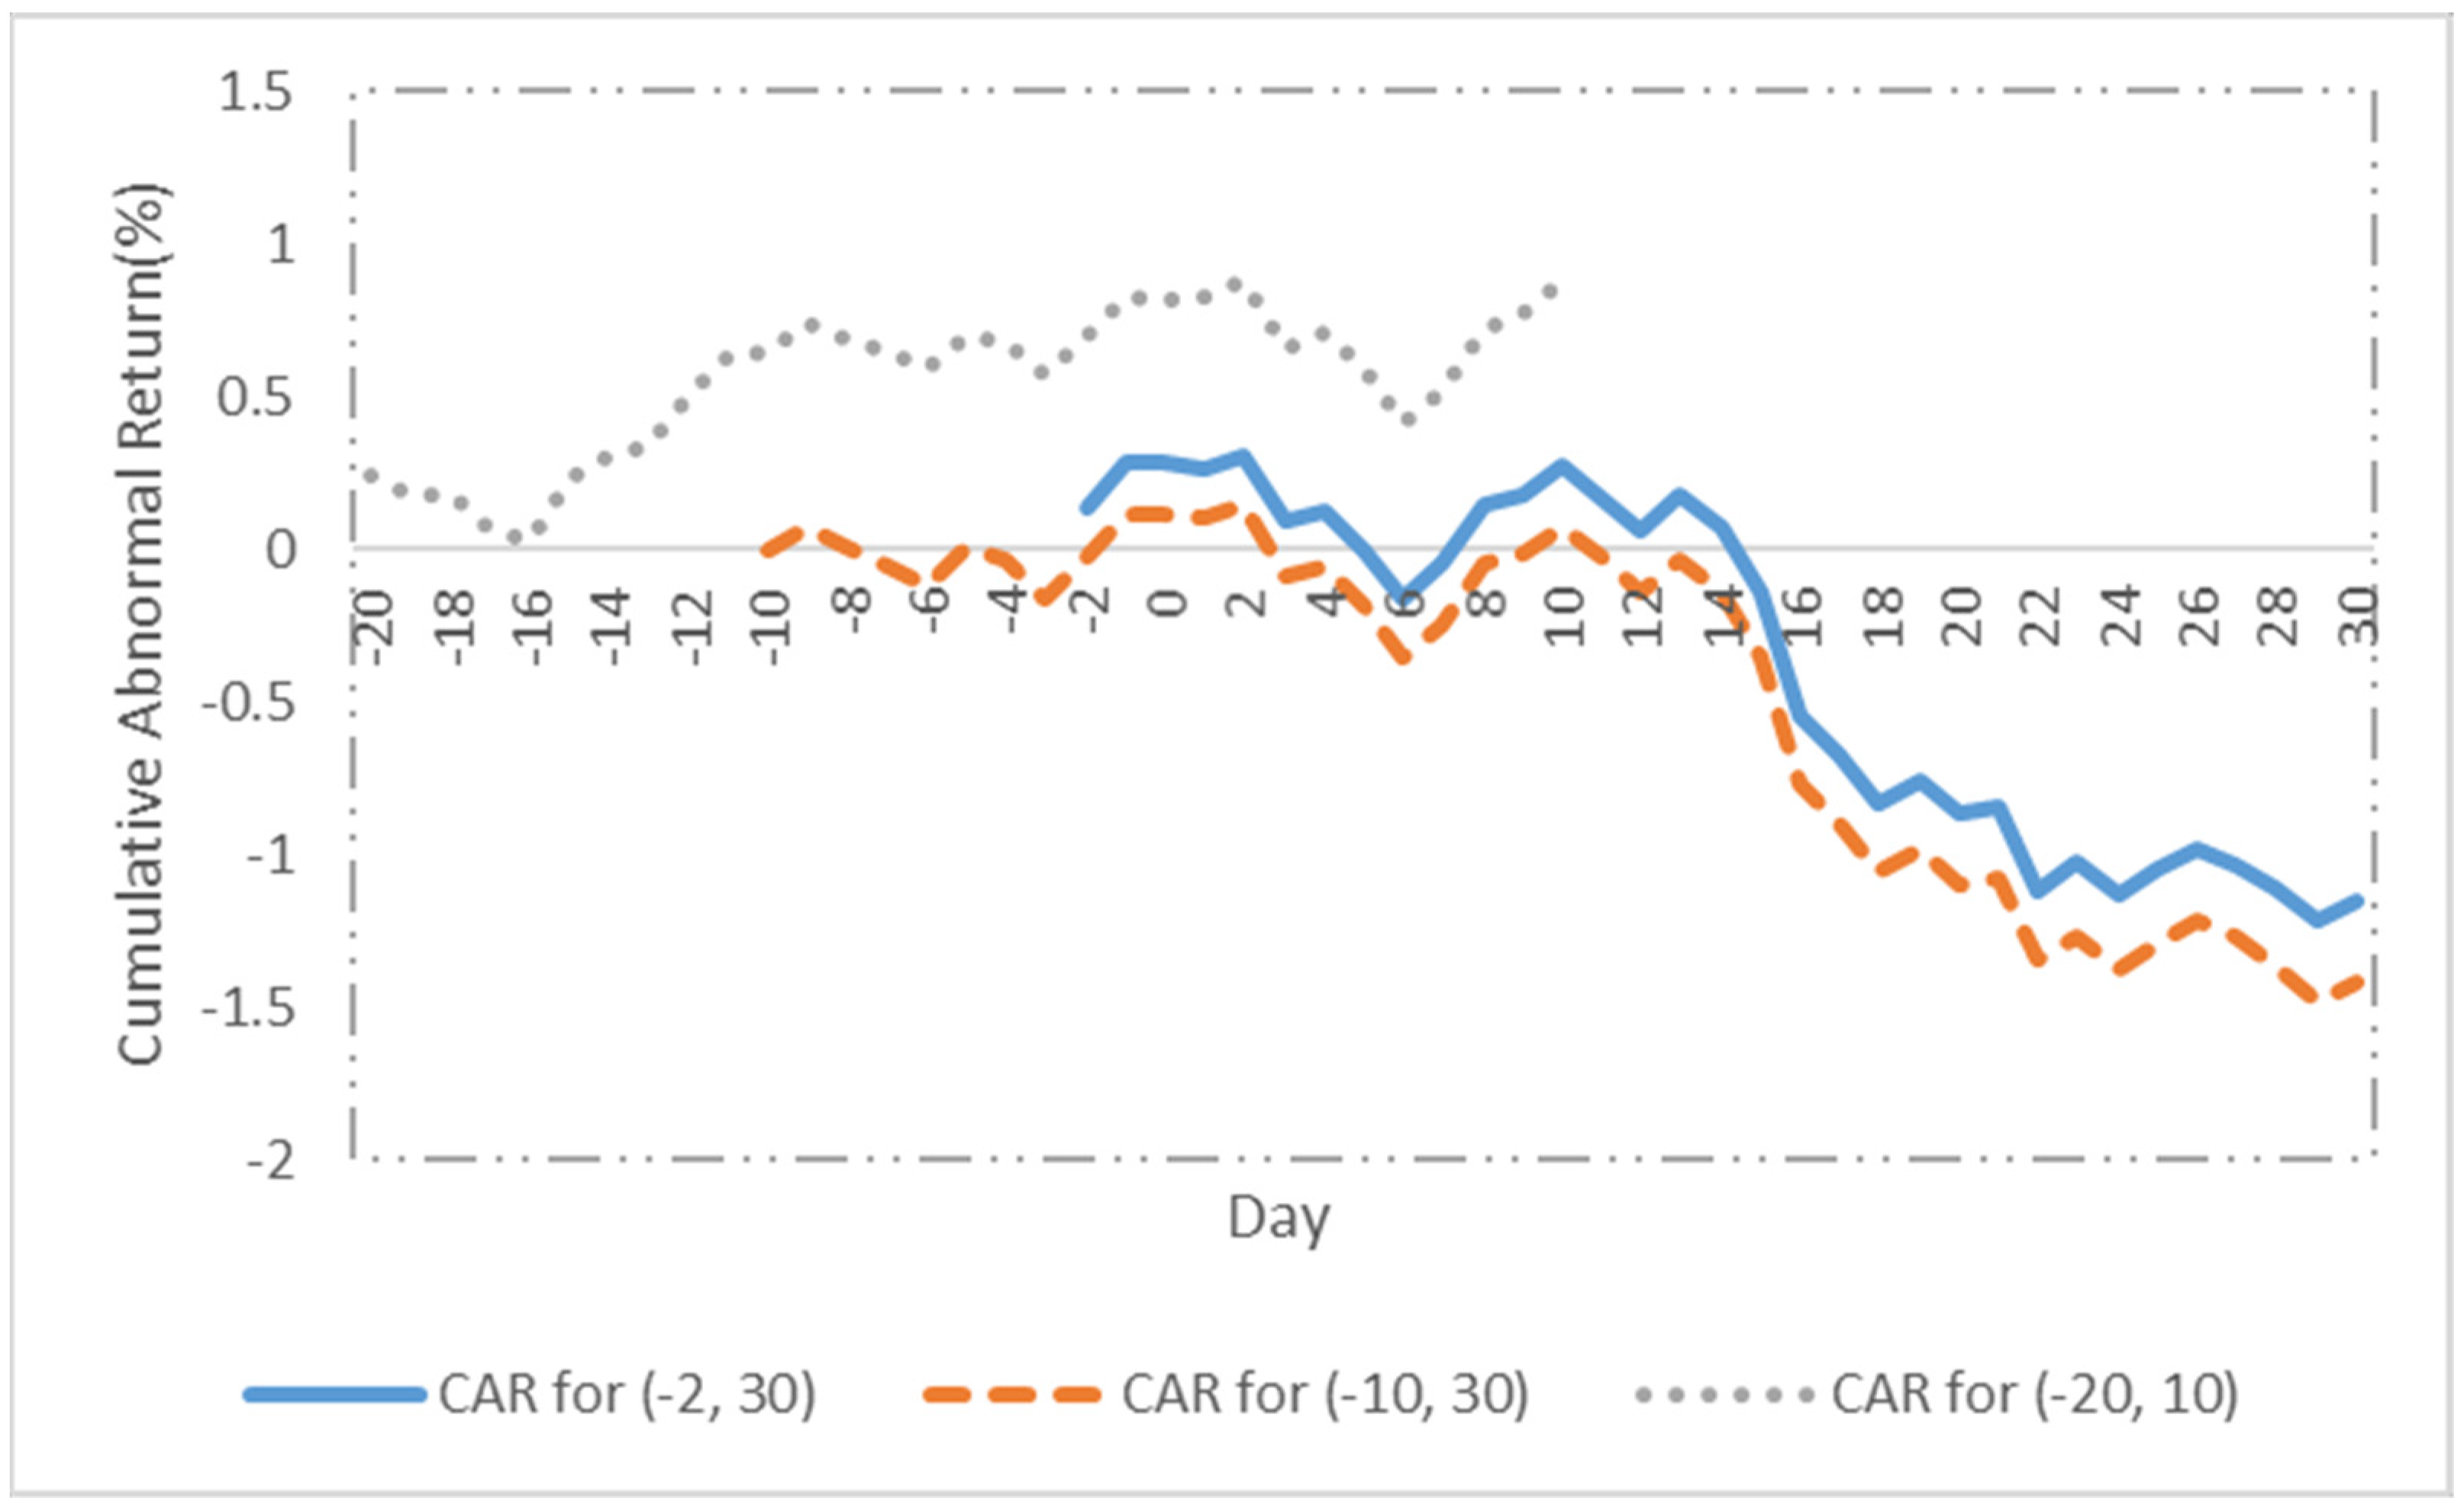
Firstly, the study examined different event windows. Figure 6 illustrates the cumulative abnormal return for three distinct event windows, namely CARs for the window of (−2, +30), CARs for the window of (−10, +30), and CARs for the window of (−20, +10), encompassing 180 renewable energy firms and announcements of 32 FIT policy legislations. Abnormal returns (ARs) were computed as residuals based on the daily stock returns and the market models’ estimations. The analysis revealed significant abnormal returns for the two windows of (−2, +30) and (−10, +30). However, no significant abnormal return was observed for the window of (−20, +10). Therefore, these tests corroborated the findings of the study.
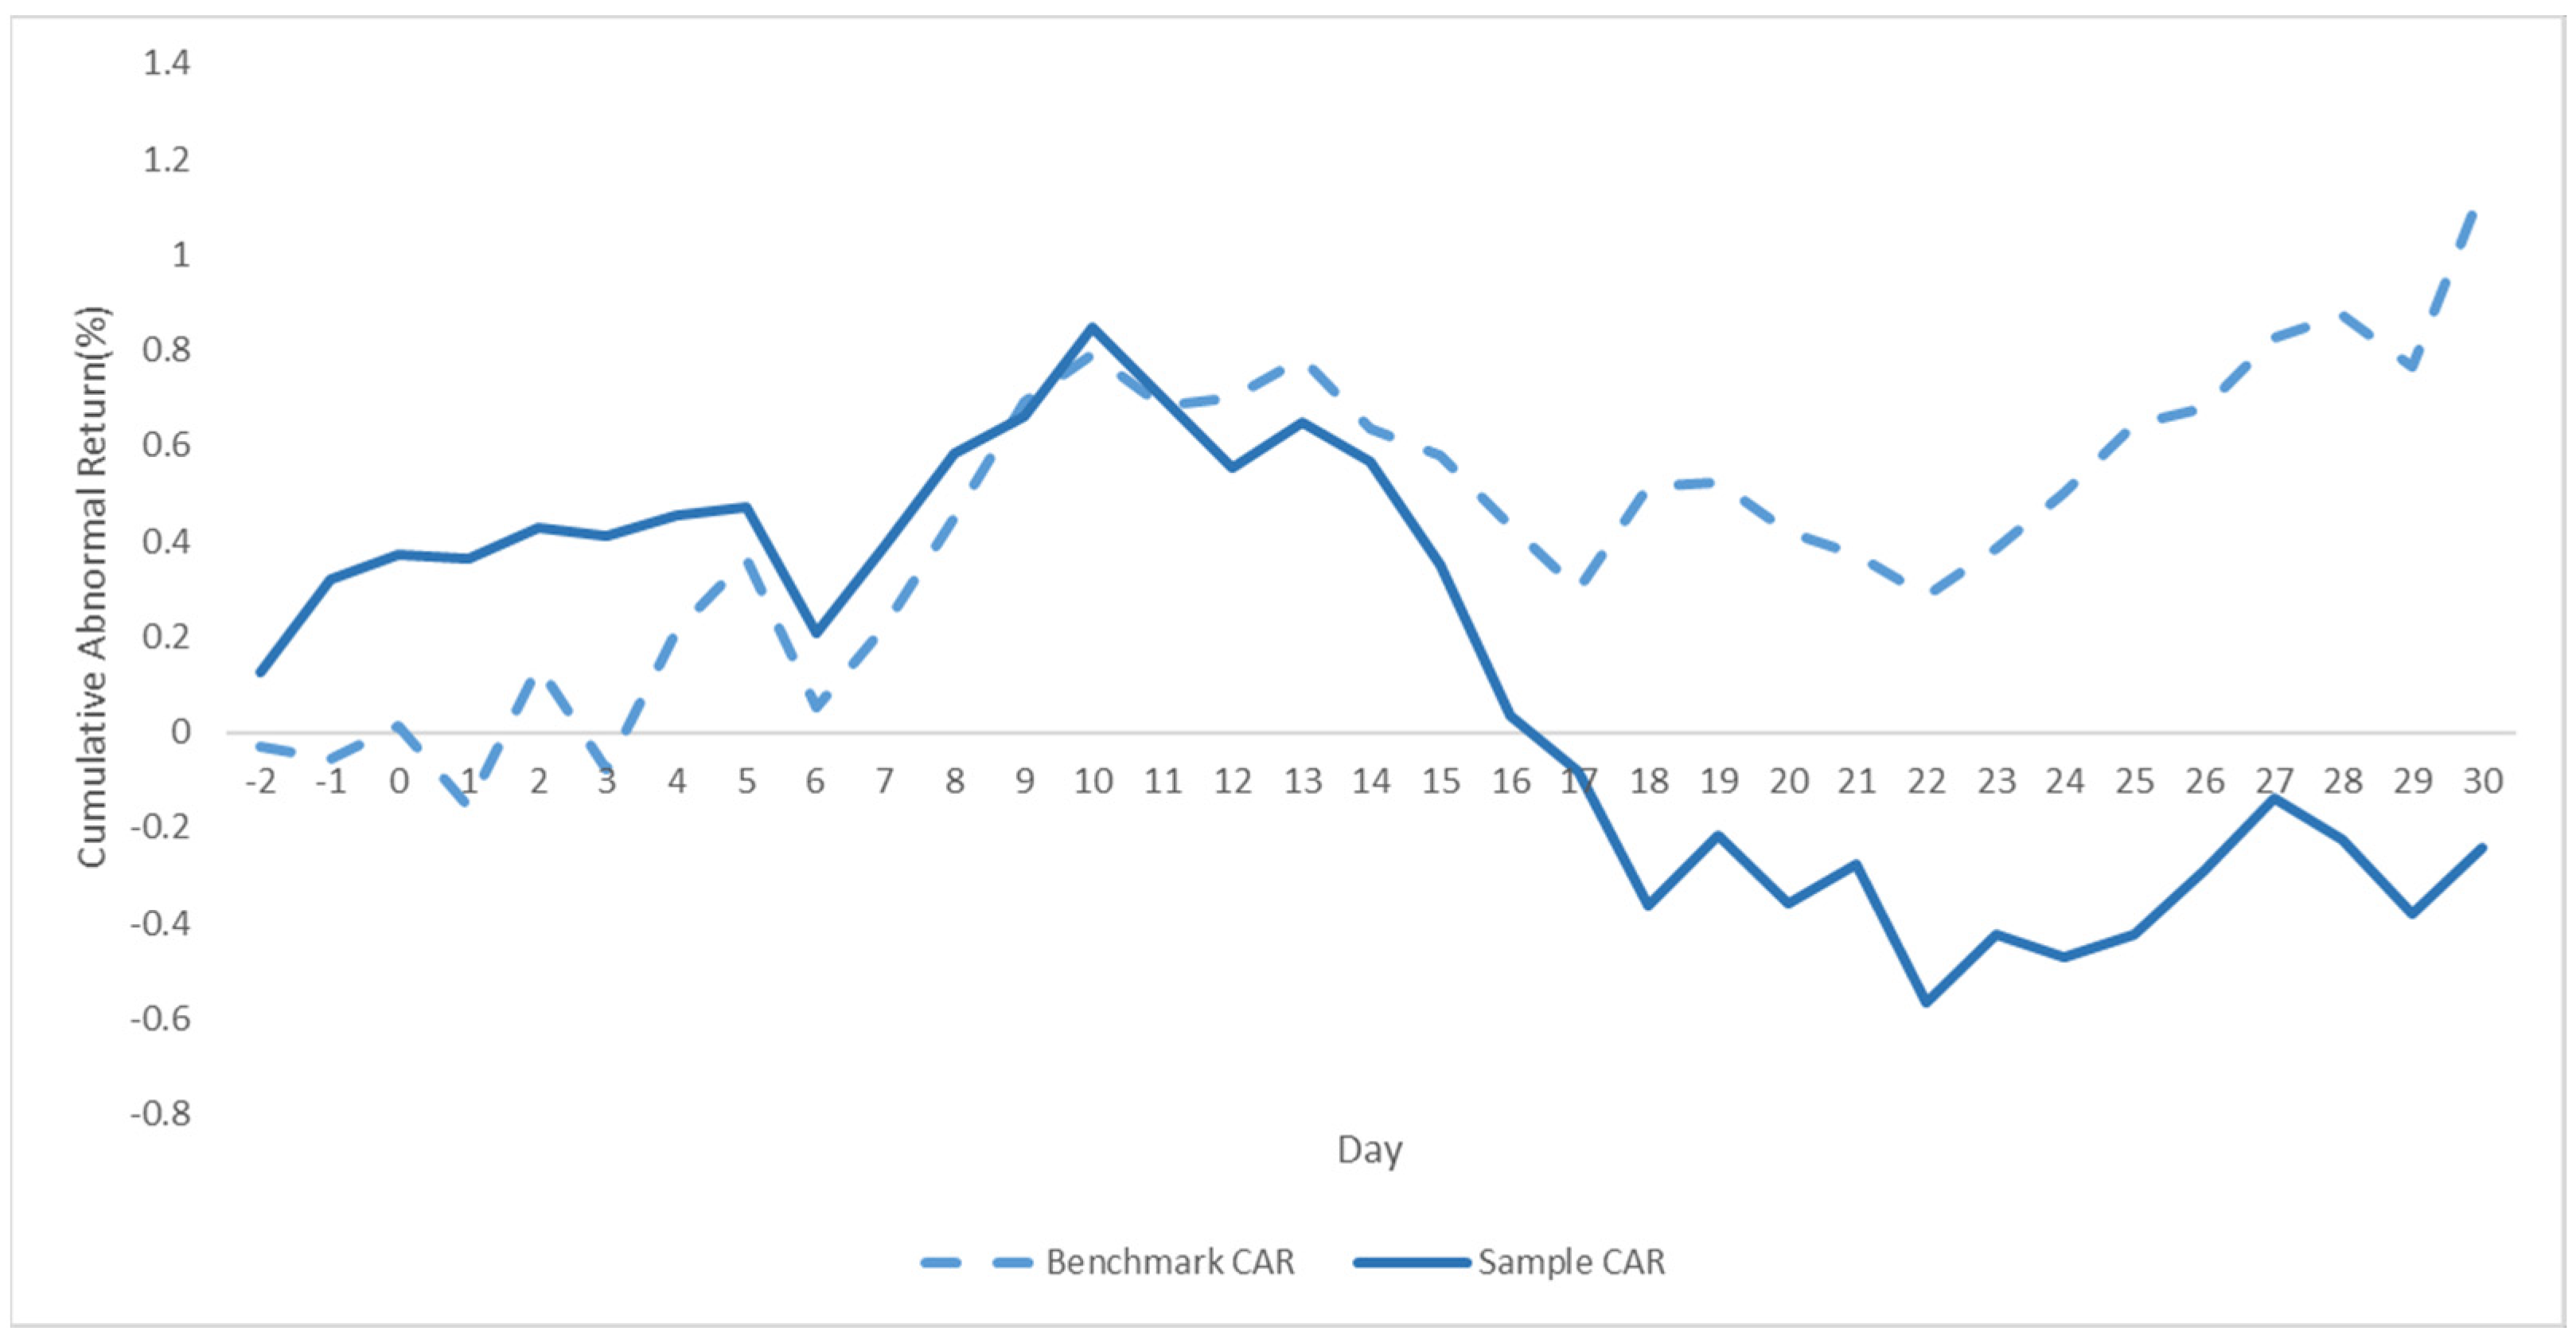
Figure 7 depicts the cumulative abnormal returns of the sample alongside the benchmark portfolio. The sample comprised 1979 observations of renewable energy firms spanning from 2007 to 2015. Meanwhile, the benchmark portfolio consisted of 1703 firms selected based on their size, book-to-market ratio, and geographical locations for the same period. CARs represented the average daily cumulative returns of the renewable energy firms. The plot illustrates the CARs over the 32-day period of (−3, +30) for both the portfolio of renewable energy firms and its corresponding benchmark portfolio. Notably, the renewable energy portfolio displayed a consistent downward trend, whereas the benchmark portfolio exhibited a slight upward trend. Around 20 days after the policy announcements, there was a persistent decline of approximately 0.6%. This discrepancy between the patterns of the renewable energy portfolio and the benchmark portfolio confirmed the findings that the values of renewable energy firms increased following FIT policy legislation events.
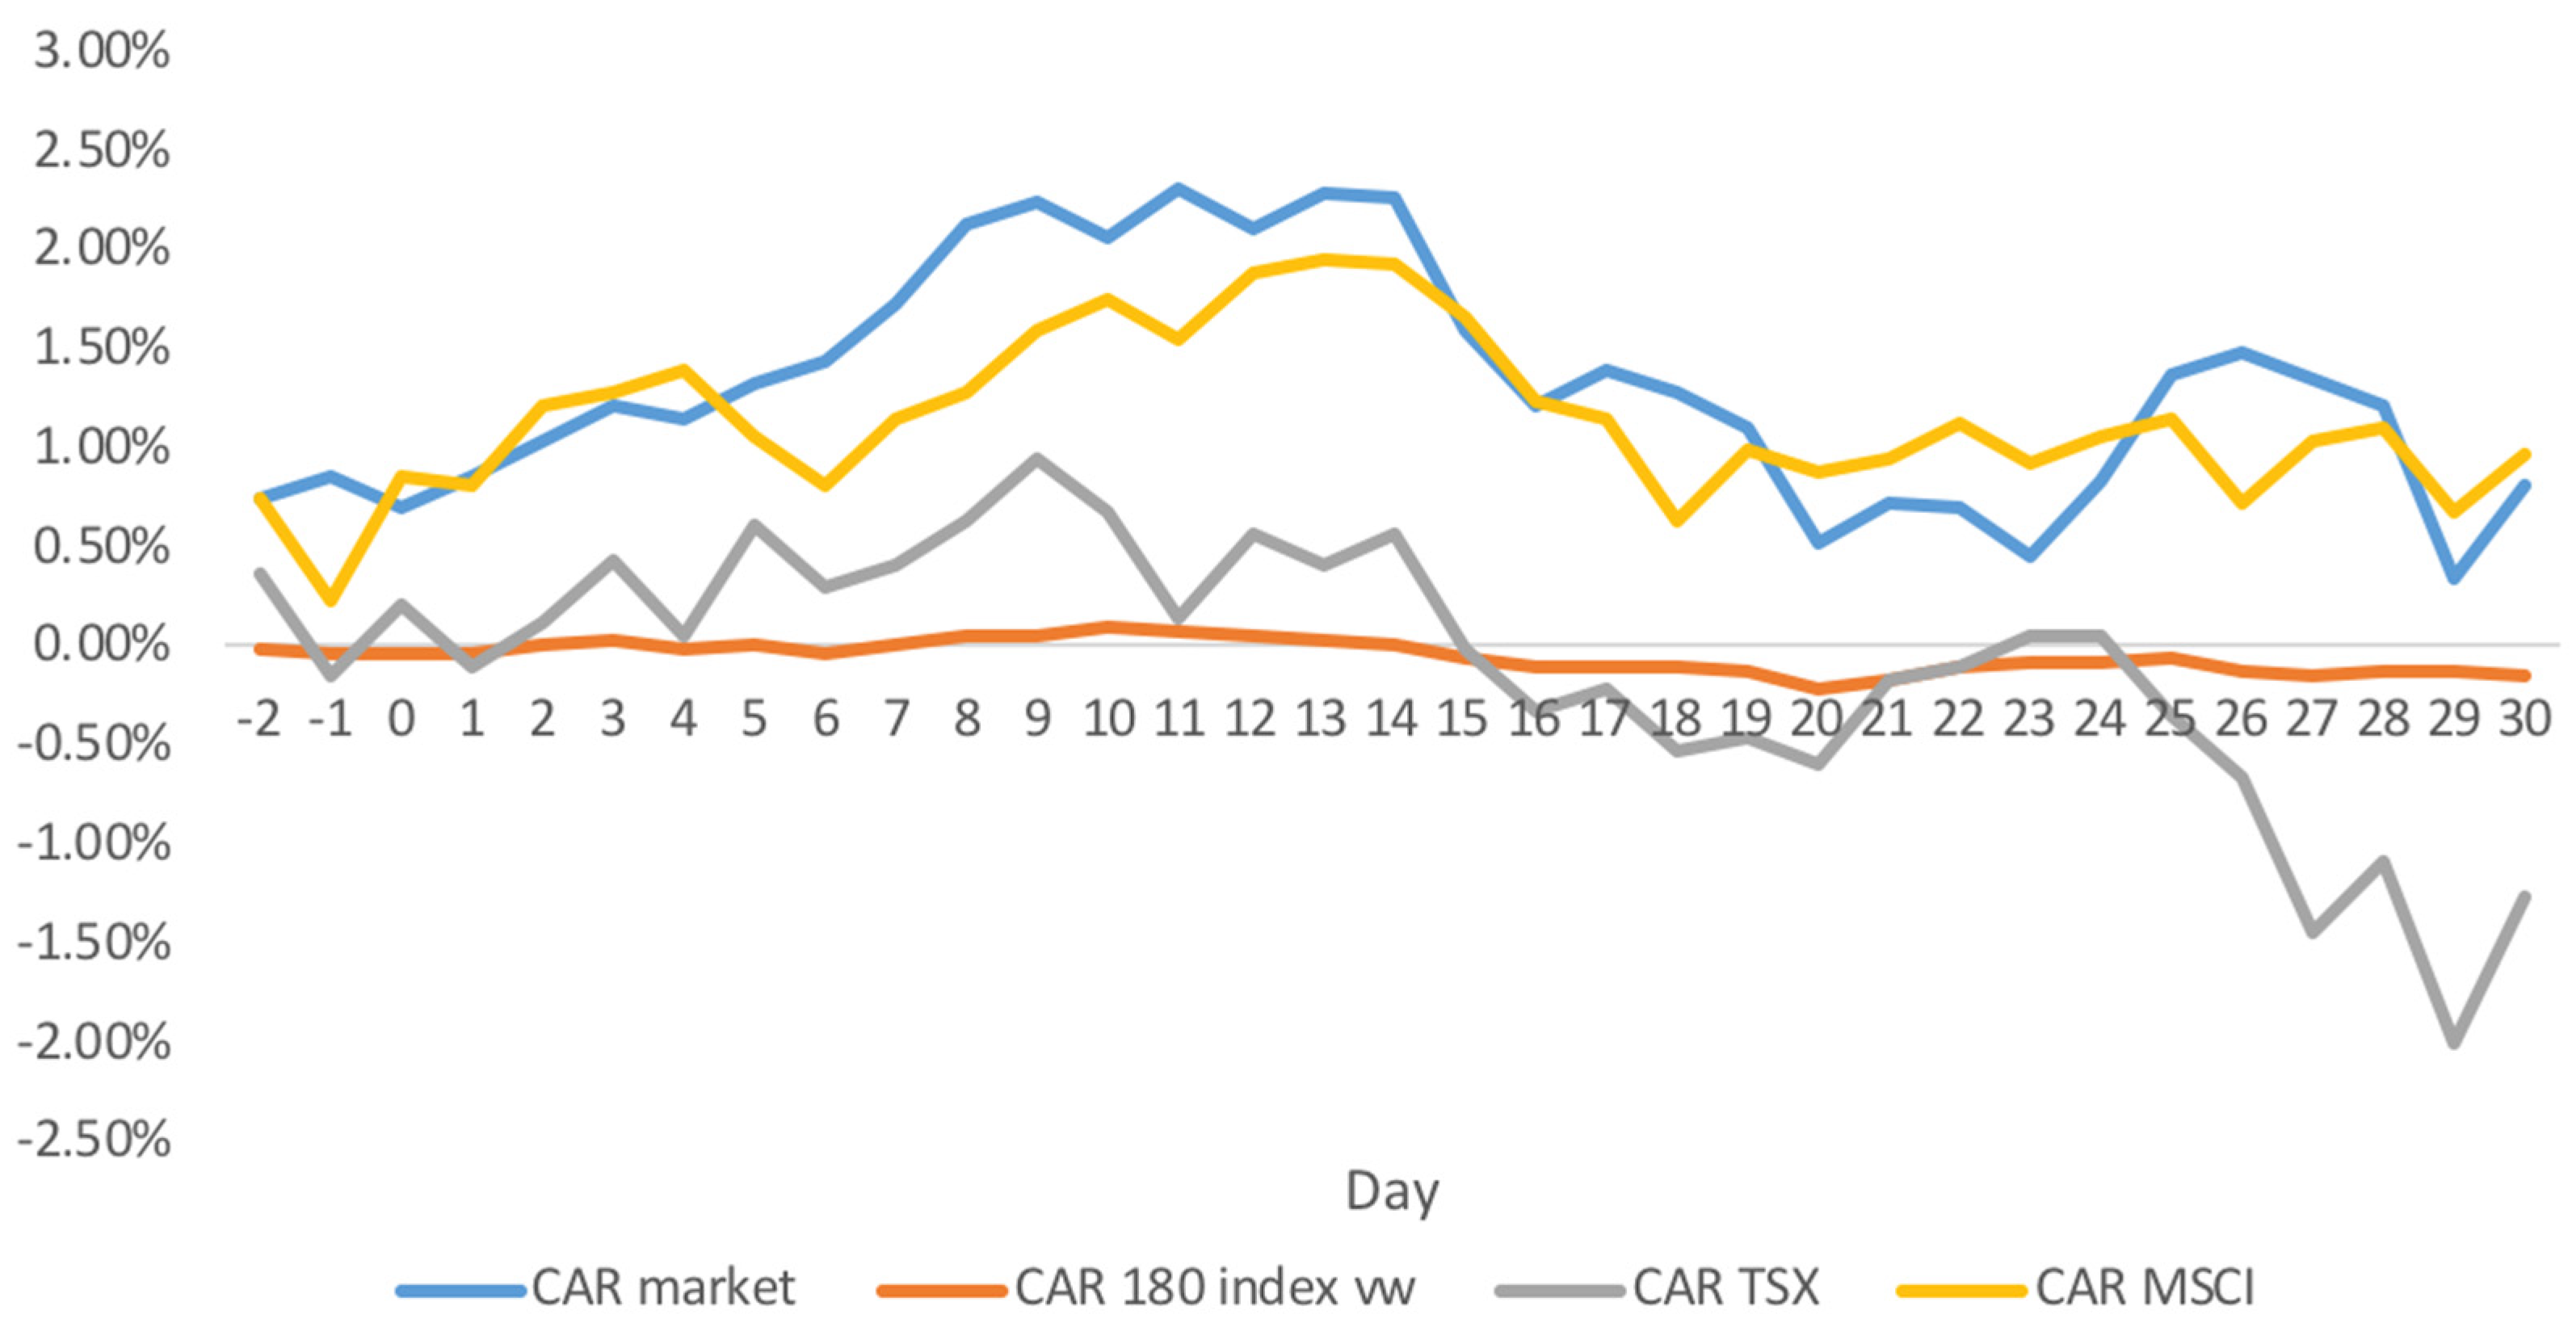
Figure 8 illustrates the adjusted cumulative abnormal returns across various benchmarks. The benchmark-adjusted abnormal returns represent the disparity between the daily return of the sample and the corresponding benchmark. The study used several indices as benchmarks, including the CRSP value weighted index (CRSP VW), the 180 cleantech composite (180 CT) index developed by the study, the MSCI global clean technology (MSCI GCT) index, and the S&P/TSX renewable energy and clean technology (S&P/TSX RECT) index. The results depicted in Figure 8 align with the findings of the study, confirming the consistency of the observed abnormal returns across different benchmarks.
In Table 3, the study presents the returns of 1-month buy-and-hold strategies. Each row corresponds to a specific index: the NYSE-ASE-NASDAQ value weighted index, the 180 Cleantech Composite index, the MSCI Global Clean Technology index, and the S&P/TSX RECT index. The returns of one-month equally weighted buy-and-hold strategies are compared with these benchmark indices. The buy-and-hold returns were calculated by compounding 30 daily returns, starting from the event day. The abnormal return was derived as the difference between the average return of the sample and the benchmarks. Wealth relatives were expressed as ratios of average gross returns. Given that the MSCI GCT index was launched in 2012, the article reports the results from 2012 in Row 3. Similarly, since the S&P/TSX RECT index began in 2010, the article presents the results from 2010 in Row 4. The T-value represents the null hypothesis of the wealth relative being equal to 1. The results reported in Table 3 are consistent with the findings of the study, further corroborating its conclusions.
7. Discussion
Climate risk has garnered significant attention in the financial literature due to the increasing awareness of global warming. The pricing of climate risk is a crucial research area studied across equities, bonds, and derivatives markets. While bonds, financial derivatives, and even country-level equity markets have been analyzed for their incorporation of climate risk, there remains a gap in understanding how individual equities price this risk. Previous work investigated the equity market using the daily prices of ETFs focused on the clean energy sector or fossil fuel industry companies. Although they found supportive evidence for the pricing of climate risk in the equity market, their analysis lacked a model of individual equities. This study addressed this gap by using a keyword matching method to identify renewable energy firms and constructing a sample of renewable energy stocks. Through the event study method, it examined the abnormal returns of the sample and presented confirmatory results regarding the pricing of climate risk in the equity market.
The renewable energy industry is particularly susceptible to climate risk due to the nature of its products, which often exhibit the characteristics of public goods. Unlike traditional market-driven pricing mechanisms, factors such as climate risk and policy changes exert a significant influence on the pricing dynamics of renewable energy products. Venture capital investors in renewable energy projects, for example, closely monitor environmental policies such as feed-in tariffs (FIT) due to their potential impact on the industry’s viability. Given the heightened exposure to climate risk, it is expected that the renewable energy sector would command greater climate risk premiums. The study’s findings support this expectation, demonstrating that the renewable energy industry experienced increased climate risk premiums during periods of FIT policy legislation events. Notably, abnormal returns within the renewable energy sector exhibited statistical significance when compared against several benchmark indices. This suggests that investors assign greater value to renewable energy stocks in response to climate policy announcements, underscoring the industry’s sensitivity to climate risk factors.
The feed-in tariff (FIT) policy has been extensively studied in the environmental policy literature, given its close relationship with the performance of renewable energy companies. Indeed, the FIT policy serves to reduce the cost of renewable energy, stimulate demand, and encourage both the generation and consumption of renewable energy. Consequently, renewable energy companies stand to benefit from FIT policies, thereby improving their financial performance. The study examined the impact of FIT policies on the equity performance of renewable energy firms and found that it generated abnormal returns for these companies. Specifically, FIT policies increased the value of renewable energy firms from the perspective of investors.
The study used an event study methodology to investigate the relationship between FIT policies and climate risk. Additionally, it conducted robustness tests by using different event windows and benchmark portfolios, thereby enhancing the rigor of the methodology and research findings. By utilizing FIT policy legislation events, the study explored climate risk premia within the renewable energy industry, thereby mitigating concerns related to endogeneity. Notably, FIT policies have significant relevance to investments in the renewable energy sector and are regarded by venture capital investors as the most efficient and effective environmental policies. Consequently, this empirical study makes a valuable contribution to the existing FIT policy literature.
According to the findings of this study, FIT policy announcements play an important role in revealing the value of climate risk in equity pricing. FIT policy announcements facilitate more informed decision-making by policymakers, investors, and businesses, contributing to more resilient and sustainable financial markets and economies. For policymakers, they can use a FIT policy as an opportunity for businesses. Policymakers use FIT policies to clearly communicate the rationale, objectives, and implications of FIT policies, helping investors and stakeholders better understand the climate risks facing companies in the renewable energy sector. Policymakers can also use FIT policies as part of a broader strategy to incentivize clean energy investments, reduce greenhouse gas emissions, and transition to a low-carbon economy. For investors, they can recognize FIT policy announcements as indicators of climate risk and use such information for making investment decisions. Investors can adjust their evaluation models and risk assessments to incorporate the potential impacts of FIT policies on companies’ financial performance and market prospects. For companies, they can use FIT policy announcements to inform their risk management and adaptation strategies. By responding to FIT policies, businesses can exploit climate risk, better manage climate risks, identify market opportunities, and enhance their competitiveness.
8. Conclusions and Future Work
The study investigated how the stock market prices climate risk by examining the relationship between the returns of renewable energy firms and FIT policies. It revealed that the value of renewable energy firms increased following the enactment of FIT policy legislations. These findings were robust across various models, including the market model, the Fama–French five-factor model, and other benchmarks, indicating that climate risk is indeed being priced into the equity market. This supports the argument that climate risk should be considered as a significant factor in the evaluation of firms within the financial market. Moreover, the results suggested that accurately estimating the climate risk can provide valuable insights for investors when pricing financial assets. Given the close association between FIT policies and climate risk, their inclusion in the evaluation process can enhance the accuracy of pricing.
The study, however, has several limitations. Firstly, it focused solely on the US equity market. A more diversified sample from the international equity market could provide broader insights. Future research could explore how international portfolios react to global FIT policy announcements. Given the widespread adoption of FIT policies as an environmental measure, studying their impact on climate risk from a global perspective would be beneficial. Secondly, expanding the range of data to cover different markets and periods would strengthen the generalization of the results. Thirdly, while the study constructed the sample of renewable energy firms using a text mining methodology, alternative methods such as industry categorization could be used to refine the sample selection process and enhance the study’s robustness. Fourthly, this research relied on an event study methodology to analyze abnormal returns. Future research could consider utilizing a “compound event” approach, which integrates various processes, such as climate drivers and hazards, to model the climate risk more comprehensively.
Author Contributions
Conceptualization, L.L.; methodology, L.L.; writing—original draft preparation, L.L.; writing—review and editing, X.Z.; supervision, X.Z.; resources, S.W. All authors have read and agreed to the published version of the manuscript.
Funding
This research received no external funding.
Data Availability Statement
The data can be found in Center for Research in Security Prices (CRSP).
Conflicts of Interest
The authors declare no conflict of interest.
References
- Agrawal, Jagdish, and Wagner A. Kamakura. 1995. The economic worth of celebrity endorsers: An event study analysis. Journal of Marketing 59: 56–62. [Google Scholar] [CrossRef]
- Andersson, Mats, Patrick Bolton, and Frédéric Samama. 2016. Hedging climate risk. Financial Analysts Journal 72: 13–32. [Google Scholar] [CrossRef]
- Bartram, Söhnke M., Kewei Hou, and Sehoon Kim. 2022. Real effects of climate policy: Financial constraints and spillovers. Journal of Financial Economics 143: 668–96. [Google Scholar] [CrossRef]
- Binder, John. 1998. The event study methodology since 1969. Review of Quantitative Finance and Accounting 11: 111–37. [Google Scholar] [CrossRef]
- Bürer, Mary Jean, and Rolf Wüstenhagen. 2009. Which renewable energy policy is a venture capitalist’s best friend? Empirical evidence from a survey of international cleantech investors. Energy Policy 37: 4997–5006. [Google Scholar] [CrossRef]
- Cumming, Douglas, Irene Henriques, and Perry Sadorsky. 2016. ‘Cleantech’ venture capital around the world. International Review of Financial Analysis 44: 86–97. [Google Scholar] [CrossRef]
- Faccini, Renato, Rastin Matin, and George S. Skiadopoulos. 2022. Dissecting Climate Risks: Are They Reflected in Stock Prices? Available online: https://papers.ssrn.com/sol3/papers.cfm?abstract_id=3795964 (accessed on 19 February 2024).
- Ginglinger, Edith, and Quentin Moreau. 2023. Climate risk and capital structure. Management Science 69: 7492–516. [Google Scholar] [CrossRef]
- He, Mengxi, and Yaojie Zhang. 2022. Climate policy uncertainty and the stock return predictability of the oil industry. Journal of International Financial Markets, Institutions and Money 81: 101675. [Google Scholar] [CrossRef]
- Hong, Harrison, Frank Weikai Li, and Jiangmin Xu. 2019. Climate risks and market efficiency. Journal of Econometrics 208: 265–81. [Google Scholar] [CrossRef]
- Lin, Boqiang, and Nan Wu. 2023. Climate risk disclosure and stock price crash risk: The case of China. International Review of Economics & Finance 83: 21–34. [Google Scholar]
- Painter, Marcus. 2020. An inconvenient cost: The effects of climate change on municipal bonds. Journal of Financial Economics 135: 468–82. [Google Scholar] [CrossRef]
- Pham, Linh, Wei Hao, Ha Truong, and Hai Hong Trinh. 2023. The impact of climate policy on US environmentally friendly firms: A firm-level examination of stock return, volatility, volume, and connectedness. Energy Economics 119: 106564. [Google Scholar] [CrossRef]
- Schlenker, Wolfram, and Charles A. Taylor. 2021. Market expectations of a warming climate. Journal of Financial Economics 142: 627–40. [Google Scholar] [CrossRef]
- Stroebel, Johannes, and Jeffrey Wurgler. 2021. What do you think about climate finance? Journal of Financial Economics 142: 487–98. [Google Scholar] [CrossRef]
- Wilby, R. L., J. Troni, Y. Biot, L. Tedd, B. C. Hewitson, D. M. Smith, and R. T. Sutton. 2009. A review of climate risk information for adaptation and development planning. International Journal of Climatology 29: 1193–215. [Google Scholar] [CrossRef]
- Xu, Xin, Shupei Huang, Brian M. Lucey, and Haizhong An. 2023. The impacts of climate policy uncertainty on stock markets: Comparison between China and the US. International Review of Financial Analysis 88: 102671. [Google Scholar] [CrossRef]
- Zscheischler, Jakob, Seth Westra, Bart J. J. M. van den Hurk, Sonia I. Seneviratne, Philip J. Ward, Andy Pitman, Amir AghaKouchak, David N. Bresch, Michael Leonard, Thomas Wahl, and et al. 2018. Future climate risk from compound events. Nature Climate Change 8: 469–77. [Google Scholar] [CrossRef]
Figure 1.
Total FIT legislation events.

Figure 2.
Yearly FIT legislation events.

Figure 3.
Daily trading volumes.

Figure 4.
Policy announcements and trading volumes.

Figure 5.
Cumulative abnormal returns for different models.

Figure 6.
Cumulative abnormal returns for different event windows.

Figure 7.
Cumulative abnormal returns for different portfolios.

Figure 8.
Cumulative abnormal returns adjusted for different benchmarks.


Table 1.
Average abnormal returns.
| Market Model | FF 3-Factor | FF 5-Factor | 3-Factor (49 Industry) | |||||
|---|---|---|---|---|---|---|---|---|
| Day | Ave. AR | T-Statistic | Ave. AR | T-Statistic | Ave. AR | T-Statistic | Ave. AR | T-Statistic |
| −2 | 0.14% | 2.02 | 0.05% | 0.76 | 0.07% | 1.06 | 0.00% | −0.05 |
| −1 | 0.15%a | 2.14 | 0.13% | 1.94 | 0.09% | 1.26 | 0.11% | 1.52 |
| 0 | 0.00% | 0.03 | 0.09% | 1.45 | 0.06% | 1.00 | −0.02% | −0.32 |
| 1 | −0.02% | −0.23 | 0.07% | 0.90 | 0.03% | 0.41 | −0.04% | −0.54 |
| 2 | 0.04% | 0.61 | 0.07% | 0.94 | 0.02% | 0.30 | 0.12% | 1.46 |
| 3 | −0.22% | −3.05 | −0.15% | −2.09 | −0.04% | −0.51 | 0.02% | 0.19 |
| 4 | 0.03% | 0.41 | −0.07% | −0.91 | −0.07% | −0.97 | −0.07% | −0.76 |
| 5 | −0.13% | −2.01 | −0.16% | −2.51 | −0.11% | −1.69 | −0.33% | −4.59 |
| 6 | −0.16% | −2.34 | −0.01% | −0.12 | 0.01% | 0.21 | −0.05% | −0.63 |
| 7 | 0.11% | 1.53 | −0.04% | −0.52 | −0.02% | −0.34 | 0.00% | 0.04 |
| 8 | 0.20% | 2.74 | 0.09% | 1.20 | −0.02% | −0.22 | 0.01% | 0.18 |
| 9 | 0.03% | 0.37 | 0.01% | 0.13 | −0.08% | −1.07 | 0.01% | 0.12 |
| 10 | 0.10% | 1.39 | 0.07% | 0.93 | 0.02% | 0.22 | 0.01% | 0.16 |
| 11 | −0.11% | −1.58 | 0.03% | 0.45 | 0.00% | 0.03 | −0.06% | −0.83 |
| 12 | −0.11% | −1.66 | −0.06% | −0.97 | −0.07% | −1.11 | 0.01% | 0.12 |
| 13 | 0.11% | 1.70 | 0.05% | 0.82 | 0.12% | 1.74 | −0.04% | −0.47 |
| 14 | −0.11% | −1.70 | −0.05% | −0.86 | −0.08% | −1.23 | −0.04% | −0.57 |
| 15 | −0.20% | −3.11 | −0.17% | −2.64 | −0.17% | −2.66 | −0.12% | −1.56 |
| 16 | −0.41% | −6.41 | −0.44% | −6.85 | −0.41% | −6.34 | −0.42% | −5.64 |
| 17 | −0.12% | −1.79 | −0.08% | −1.22 | −0.06% | −0.80 | −0.20% | −2.50 |
| 18 | −0.16% | −2.64 | −0.16% | −2.77 | −0.08% | −1.32 | −0.19% | −2.66 |
| 19 | 0.07% | 1.15 | 0.00% | −0.05 | 0.02% | 0.38 | 0.04% | 0.58 |
| 20 | −0.10% | −1.39 | −0.06% | −0.85 | −0.03% | −0.45 | 0.09% | 1.04 |
| 21 | 0.02% | 0.32 | 0.08% | 1.12 | 0.10% | 1.34 | 0.07% | 0.87 |
| 22 | −0.28% | −4.42 | −0.17% | −2.67 | −0.16% | −2.55 | −0.05% | −0.69 |
| 23 | 0.09% | 1.28 | 0.00% | 0.01 | −0.02% | −0.27 | −0.03% | −0.35 |
| 24 | −0.11% | −1.50 | −0.13% | −1.95 | −0.11% | −1.65 | −0.13% | −1.61 |
| 25 | 0.09% | 1.17 | 0.04% | 0.54 | −0.04% | −0.52 | −0.16% | −1.90 |
| 26 | 0.07% | 0.95 | 0.26% | 3.56 | 0.22% | 2.95 | 0.09% | 1.12 |
| 27 | −0.05% | −0.81 | −0.12% | −1.74 | −0.10% | −1.51 | −0.15% | −1.87 |
| 28 | −0.08% | −1.17 | −0.07% | −1.00 | −0.09% | −1.21 | −0.10% | −1.28 |
| 29 | −0.10% | −1.71 | −0.13% | −2.11 | −0.16% | −2.63 | −0.24% | −3.12 |
| 30 | 0.07% | 0.92 | 0.12% | 1.63 | 0.09% | 1.12 | 0.15% | 1.75 |
a The bold numbers are significant at the level of 10%.
Table 2.
Summary statistics for 180 cleantech firms.
| Year | Asset in Millions | Debt in Millions | Revenue in Millions | Yearly Return | CAR Market Yearly Return | TSX Index |
|---|---|---|---|---|---|---|
| 2007 | 98.925 | 5533.502 | 8420.786 | 0.011 | 0.006 | na |
| 2008 | 145.626 | 5089.023 | 7206.872 | −0.045 | −0.037 | na |
| 2009 | 111.028 | 4885.164 | 4763.786 | 0.037 | 0.025 | na |
| 2010 | 114.947 | 4903.165 | 5873.812 | 0.016 | 0.015 | 0.072 |
| 2011 | 133.790 | 5163.261 | 5922.559 | −0.022 | 0.000 | −0.047 |
| 2012 | 121.490 | 5575.039 | 5772.477 | 0.010 | 0.013 | −0.083 |
| 2013 | 159.216 | 5787.811 | 6057.146 | 0.033 | 0.023 | 0.006 |
| 2014 | 186.802 | 6248.019 | 5392.293 | 0.002 | 0.009 | 0.014 |
| 2015 | 141.566 | 6628.720 | 4852.874 | −0.016 | −0.001 | −0.012 |
| 2016 | 120.921 | 6886.280 | 5589.158 | 0.010 | 0.010 | 0.164 |
| 2017 | 134.108 | 8259.181 | 7916.766 | 0.006 | 0.016 | 0.139 |
Table 3.
One-month returns of equally weighted buy-and-hold strategies.
| Sample | Benchmark | Abnormal Return | Wealth Relative | T-Value | |
|---|---|---|---|---|---|
| CRSP VW | 0.09% | 1.24% | −1.15% | 0.99 | −4.0667 |
| 180 CT index | 0.09% | 0.97% | −0.88% | 0.99 | −0.0262 |
| MSCI GCT index | 0.09% | 0.23% | −0.14% | 1.01 | 1.4164 |
| S&P/TSX RECT index | 0.09% | 0.53% | −0.43% | 1.00 | −0.8989 |
Disclaimer/Publisher’s Note: The statements, opinions and data contained in all publications are solely those of the individual author(s) and contributor(s) and not of MDPI and/or the editor(s). MDPI and/or the editor(s) disclaim responsibility for any injury to people or property resulting from any ideas, methods, instructions or products referred to in the content. |
© 2024 by the authors. Licensee MDPI, Basel, Switzerland. This article is an open access article distributed under the terms and conditions of the Creative Commons Attribution (CC BY) license (https://creativecommons.org/licenses/by/4.0/).
Share and Cite
MDPI and ACS Style
Li, L.; Zheng, X.; Wang, S. Renewable Energy Stocks’ Performance and Climate Risk: An Empirical Analysis. J. Risk Financial Manag. 2024, 17, 121. https://doi.org/10.3390/jrfm17030121
AMA Style
Li L, Zheng X, Wang S. Renewable Energy Stocks’ Performance and Climate Risk: An Empirical Analysis. Journal of Risk and Financial Management. 2024; 17(3):121. https://doi.org/10.3390/jrfm17030121
Chicago/Turabian StyleLi, Lingyu, Xianrong Zheng, and Shuxi Wang. 2024. "Renewable Energy Stocks’ Performance and Climate Risk: An Empirical Analysis" Journal of Risk and Financial Management 17, no. 3: 121. https://doi.org/10.3390/jrfm17030121