 Lulu Jiang1,2*
 Rebecca Roberts1
 Melissa Wong1
 Lushuang Zhang1Chelsea Joy Webber1,3
 Jenna Libera1Zihan Wang1Alper Kilci1Matthew Jenkins1
 Alejandro Rondón Ortiz3Luke Dorrian1Jingjing Sun4,5Guangxin Sun4
 Sherif Rashad4,6Caroline Kornbrek7Sarah Anne Daley3,8
 Peter C. Dedon4,5Brian Nguyen7
 Weiming Xia3,8
 Takashi Saito9
 Takaomi C. Saido10
 Benjamin Wolozin1,3,11,12*
- 1Department of Anatomy and Neurobiology, Chobanian and Avedisian School of Medicine, Boston University, Boston, MA, United States
- 2Department of Neuroscience, Center for Brain Immunology and Glia (BIG), School of Medicine, University of Virginia, Charlottesville, VA, United States
- 3Department of Pharmacology, Physiology and Biophysics, Chobanian and Avedisian School of Medicine, Boston University, Boston, MA, United States
- 4Department of Biological Engineering, Massachusetts Institute of Technology, Cambridge, MA, United States
- 5Singapore-MIT Alliance for Research and Technology, Antimicrobial Resistance IRG, Campus for Research Excellence and Technological Enterprise, Singapore, Singapore
- 6Department of Neurosurgical Engineering and Translational Neuroscience, Graduate School of Biomedical Engineering, Tohoku University, Sendai, Japan
- 7LifeCanvas Technologies, Cambridge, MA, United States
- 8Geriatric Research Education and Clinical Center, Bedford VA Healthcare System, Bedford, MA, United States
- 9Department of Neurocognitive Science, Institute of Brain Science, Nagoya City University Graduate School of Medical Sciences, Nagoya, Japan
- 10Laboratory for Proteolytic Neuroscience, RIKEN Center for Brain Science, Saitama, Japan
- 11Department of Neurology, Chobanian and Avedisian School of Medicine, Boston University, Boston, MA, United States
- 12Center for Systems Neuroscience, Boston University, Boston, MA, United States
Introduction: The study of the pathophysiology study of Alzheimer’s disease (AD) has been hampered by lack animal models that recapitulate the major AD pathologies, including extracellular -amyloid (A) deposition, intracellular aggregation of microtubule associated protein tau (MAPT), inflammation and neurodegeneration.
Methods: The humanized APPNL-G-F knock-in mouse line was crossed to the PS19 MAPTP301S, over-expression mouse line to create the dual APPNL-G-F/PS19 MAPTP301S line. The resulting pathologies were characterized by immunochemical methods and PCR.
Results: We now report on a double transgenic APPNL-G-F/PS19 MAPTP301S mouse that at 6 months of age exhibits robust A plaque accumulation, intense MAPT pathology, strong inflammation and extensive neurodegeneration. The presence of A pathology potentiated the other major pathologies, including MAPT pathology, inflammation and neurodegeneration. MAPT pathology neither changed levels of amyloid precursor protein nor potentiated A accumulation. Interestingly, study of immunofluorescence in cleared brains indicates that microglial inflammation was generally stronger in the hippocampus, dentate gyrus and entorhinal cortex, which are regions with predominant MAPT pathology. The APPNL-G-F/MAPTP301S mouse model also showed strong accumulation of N6-methyladenosine (m6A), which was recently shown to be elevated in the AD brain. m6A primarily accumulated in neuronal soma, but also co-localized with a subset of astrocytes and microglia. The accumulation of m6A corresponded with increases in METTL3 and decreases in ALKBH5, which are enzymes that add or remove m6A from mRNA, respectively.
Discussion: Our understanding of the pathophysiology of Alzheimer’s disease (AD) has been hampered by lack animal models that recapitulate the major AD pathologies, including extracellular -amyloid (A) deposition, intracellular aggregation of microtubule associated protein tau (MAPT), inflammation and neurodegeneration. The APPNL-G-F/MAPTP301S mouse recapitulates many features of AD pathology beginning at 6 months of aging, and thus represents a useful new mouse model for the field.
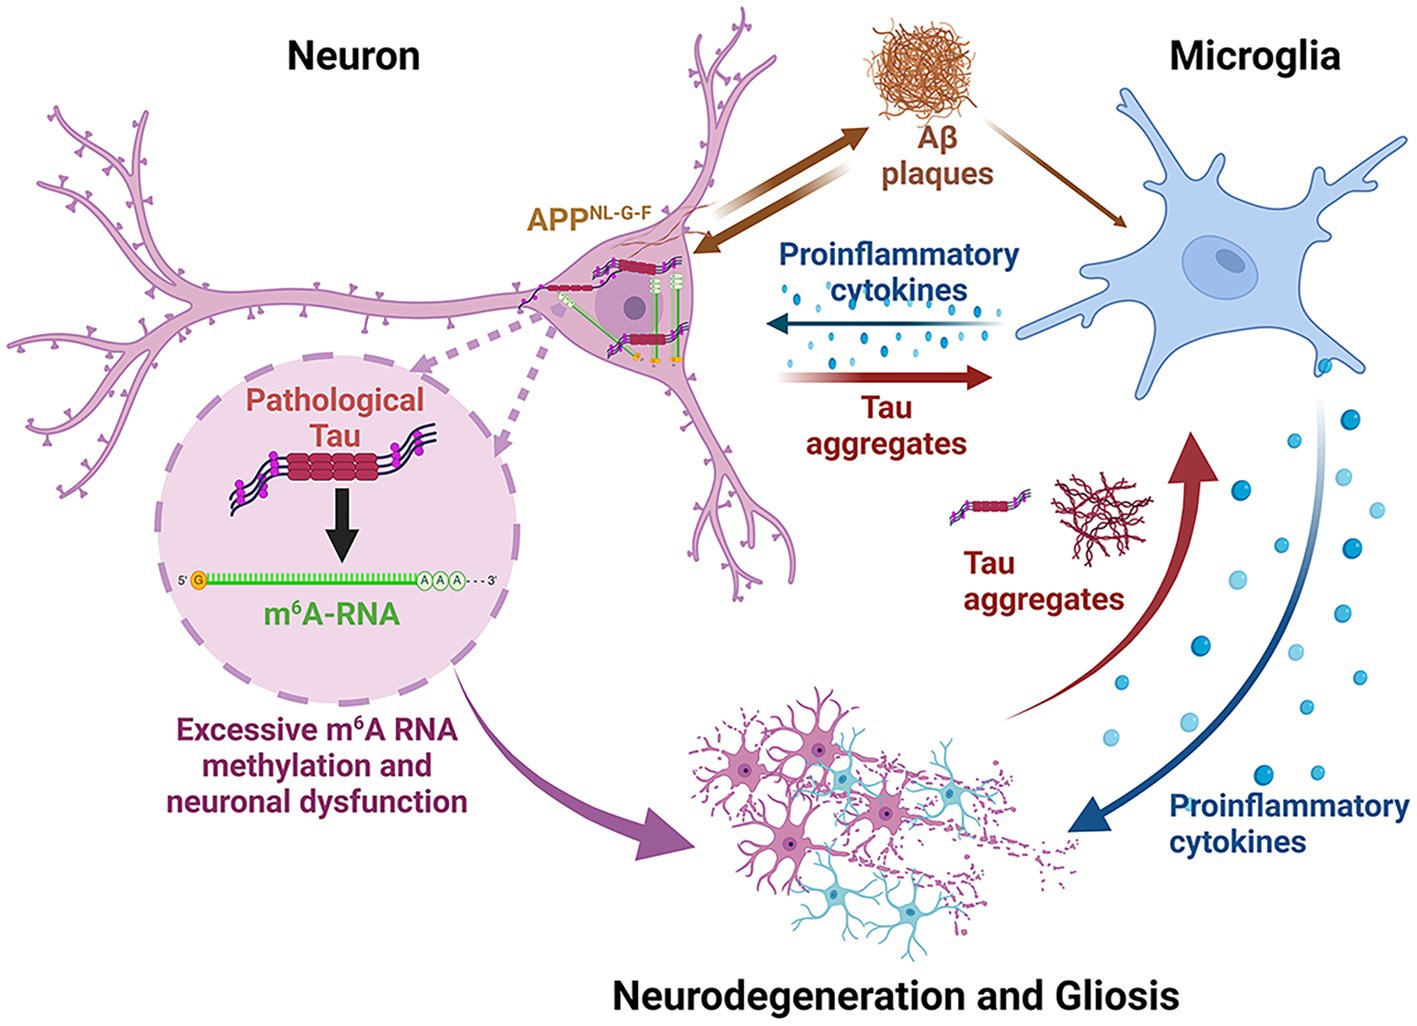
Graphical Abstract. This figure summarizes the pathophysiological changes occurring in the APPNL-G-F /MAPTP301S mouse model. This model has the humanized APPNL-G-F gene as a knocking. The neurons consequently produce abundant Aβ40/42 which leads to rapid formation of extracellular Aβ plaques. The accumulation of Aβ stimulates inflammation and also feeds back to neurons to enhance MAPT pathology and neurodegeneration. The neurons over-express P301S MAPT, which leads to rapid formation of MAPT pathologies; the amount of pathology is enhanced modestly by the abundant production and aggregation of Aβ. The MAPT aggregation in the neurons stimulate the accumulation of cytoplasmic m6A, presumably as part of the translational stress response. Secreted MAPT stimulates microglial inflammation and astrocytosis. All of these factors accelerate neurodegeneration. The inflammation in this model tends to accumulate most in regions with MAPT pathology, particularly the hippocampus, although some reactive microglia are also observed near Aβ plaques.
1 Introduction
The hallmark pathologies of Alzheimer’s disease (AD) consist of the accumulation of neuritic plaques composed of β-amyloid (Aβ), the accumulation of neurofibrillary tangles (NFTs) composed of microtubule associated protein tau (MAPT, Tau), inflammation and neurodegeneration (Scheltens et al., 2021). Mutations in amyloid precursor protein (APP) cause AD, however cognitive loss is only weakly correlated with the accumulation of Aβ (Scheltens et al., 2021). Cognitive loss is much more robustly correlated with MAPT based NFTs pathology, and mutations in MAPT are sufficient to cause dementia (frontotemporal dementia, FTD) (Scheltens et al., 2021). Mutations in MAPT might not cause AD because MAPT pathology does not drive the accumulation of Aβ pathology (Scheltens et al., 2021). The requirement of Aβ and MAPT pathologies to model AD has posed a challenge for mouse models of AD because mutations in either gene alone are insufficient to produce both pathologies in mice.
Models relying only on genetic modification of amyloid precursor protein (APP) develop abundant Aβ plaques but produce little MAPT pathology beyond modest increases in phosphorylation (Sasaguri et al., 2022). Mouse models over-expressing mutant APP, such as Tg2576, or over-expressing mutant APP and mutant presenilin 1, such as 5xFAD, rapidly develop accumulated Aβ and develop neuritic plaques. However, over-expressing APP and presenilin 1 cause effect resulting from the over-expression that are unrelated to the disease process (Saito et al., 2014; Sakakibara et al., 2018). These problems have been addressed by knocking in the human APP gene containing mutations that increase production of Aβ40 and/or Aβ42 (Saito et al., 2014; Sakakibara et al., 2018). These mice develop robust plaque pathology beginning as early as 3 months of age, however they develop little tau pathology and little neurodegeneration (Saito et al., 2014; Sakakibara et al., 2018).
The absence of robust MAPT pathology in mouse models expressing only endogenous MAPT likely derives from the low aggregation propensity of murine MAPT (Eckermann et al., 2007; Mocanu et al., 2008). This limitation has been addressed by introducing human tau constructs into the mouse brain (Hutton et al., 2001; Sasaguri et al., 2022). Many mouse models have been developed based on over-expressing wild type (WT) tau or mutant forms of tau linked to frontotemporal dementia (Hutton et al., 2001; Sasaguri et al., 2017, 2022). These models develop robust tau pathologies, including pathologically phosphorylated, misfolded, oligomeric and/or fibrillar forms of tau pathology. These models also exhibit progressive neurodegeneration, which is consistent with observations in humans that cognitive loss is more closely associated with tau pathology than Aβ pathology (Lewis et al., 2000; Ramsden et al., 2005; Polydoro et al., 2009). Human MAPT knock-in models have also been developed, and these models produce tau pathology, but only very late in the murine life span (~15 months) (Saito et al., 2014; Sakakibara et al., 2018; Sasaguri et al., 2022).
Multiple groups have explored crossing transgenic APP mouse over-expression models with tau mouse models (Ribe et al., 2005; Saul et al., 2013; Chabrier et al., 2014; Heraud et al., 2014; Stancu et al., 2014; Pooler et al., 2015; Chen et al., 2016; Kang et al., 2021). The results generally show that Aβ accelerates tau pathology (Chabrier et al., 2014; Heraud et al., 2014; Stancu et al., 2014; Chen et al., 2016). The tau pathology does not appear to increase Aβ deposition (Saul et al., 2013; Chabrier et al., 2014; Heraud et al., 2014; Stancu et al., 2014; Chen et al., 2016; Kang et al., 2021); indeed, in some cases it accelerates removal of Aβ (Chen et al., 2016). These studies all suffer because they exhibit artifacts arising from the over-expression APP (WT or mutant) and in some cases mutant presenilins (Balducci and Forloni, 2011; Saito et al., 2014; Sasaguri et al., 2017). Recent studies have begun to explore crossing human knockin models (Sasaguri et al., 2022). Human APP knockin (KI) models develop robust Aβ pathology, yet do not exhibit artifacts associated with APP over-expression, such as elevated levels of APP cleavage products (Saito et al., 2014). Human MAPT KI models exhibit delayed tau pathology, as does a cross between the two KI models (Saito et al., 2019; Islam et al., 2023). Thus, we sought to create a model that avoided artifacts associated with APP over-expression, yet utilizes over-expression of P301S MAPT to promote robust tau pathology.
We now report creating a mouse model in which the APPNL-G-F KI and the PS19 P301S MAPT mouse lines were crossed (Yoshiyama et al., 2007; Saito et al., 2014). The resulting mouse model, termed APPNL-G-F/MAPTP301S, develops many aspects of AD pathology. The APPNL-G-F/MAPTP301S mouse exhibits a progressive increase in Aβ load, neuritic plaques, all major forms of tau pathology, as well as exhibiting enhanced microglial activation, astrogliosis, neurodegeneration and a progressive loss in cognitive function. This model also exhibits other key elements of AD pathology including inflammation and elevated levels of N6-methyl-adenosine (m6A) tagged RNA, which has recently been shown to change strongly with disease progression (Jiang L. et al., 2021). In this APPNL-G-F/MAPTP301S model, we also found that Aβ pathology potentiates MAPT pathology, astrogliosis, inflammation and neurodegeneration. MAPT pathology does not appear enhance the accumulation of Aβ pathology or inflammation beyond that observed in the APPNL-G-F mouse, although the inflammation that did occur tended to be in regions with predominant MAPT pathology. Intriguingly we found that levels of m6A RNA correlate with MAPT but not Aβ pathology.
2 Methods
2.1 Mice
Use of all animals was approved by the Boston University Institutional and Animal Care and Use Committee (IACUC). All animals used in this study were handled according to IACUC approved protocols and housed in IACUC approved vivariums at the Boston University Animal Science Center. The APPNL-G-F mouse model was generated by Saito et al. (2014) at the RIKEN Brain Science Institute in Japan; the PS19 (B6; C3-Tg (Prnp-MAPT*P301S)PS19Vle/J, stock #008169) and C57BL/6J (stock #000664) mice were originally purchased from the Jackson Laboratory in Maine (Yoshiyama et al., 2007). All mice used were on a congenic C57BL/6 J background. To generate the APPNL-G-F/MAPTP301S cross, homozygous APPNL-G-F mice were bred with heterozygous PS19 mice resulting in either the double transgenic cross or heterozygous APPNL-G-F mice. Due to littermates being heterozygous for the APP mutations, wild-type C57BL/6 J mice were used as controls.
2.2 Immunoblot
The homogenized lysate for western blot were collected from fresh frozen brain tissue with RIPA lysis buffer. Reducing and non-reducing protein samples were separated by gel electrophoresis and transferred to 0.2 μm nitrocellulose membranes using the Bolt SDS-PAGE system (Life Technologies). Membranes were blocked in 5% nonfat dry milk (NFDM) in PBS supplemented with 0.025% Tween-20 (PBST) for 1 h RT, followed by incubation overnight at 4°C in primary antibody diluted in 5% bovine serum albumin/PBST. Primary antibodies used were as follows: pTau217 (1, 500) anti-tau antibody (rabbit, Thermo Scientific, Cat# 44744); 4G8, Anti-Amyloid β Antibody, clone W0-2, reactive to amyloid-β, aa 17–24 (Millipore Sigma, Cat# MABN10). Membranes were then washed 3 times with PBST and incubated in HRP-conjugated secondary antibodies (Jackson ImmunoResearch) diluted in 1% BSA/PBST at RT for 1 h. After incubation in secondary antibody, membranes were washed 3 times in PBST and developed using SuperSignal West Pico Chemilluminescent ECL substrate (Thermo Fisher Scientific, cat# 34080).
2.3 Immunohistochemistry
Wild type (WT), APPNL-G-F, MAPTP301S, and APPNL-G-F/MAPTP301S mouse brains were collected at 3, 6, and 9 months of age, respectively. Briefly, mice were anaesthetized with isoflurane and then the hearts perfused with 20 mL ice cold PBS for 5 min followed by perfusion with 20 mL ice cold 4% PFA for 10 min. The mouse brains were dissected and placed in 4% PFA on ice for 2 h. Then the brains were washed with PBS and transferred into 30% sucrose/PBS until the brains sank to the bottom of the tube (about 48 h), and sectioned. The fixed brains were sliced into 30 μm coronal sections by cryostat, and stored in 0.005% sodium azide/PBS solution at 4°C for up to 3 months. For long-term storage, the sections were transferred into cryoprotectant solution (30% glycerol and 30% ethylene glycol in PBS), and stored at −20°C.
For immuno-labeling, the 30 μm free-floating sections with hippocampus or lateral entorhinal cortex (LEnt) were blocked with 5% BSA and 5% goat serum in PBST (PBS/0.25% Triton X-100) for 30 min and then incubated with monoclonal 6E10 antibody (BioLegend, cat# 803001, 1:1000 dilution) overnight at 4°C. On the second day, sections were washed with PBST three times and then incubated with biotinylated goat anti-mouse IgG antibody (Vector Laboratories, cat# BA-9200) for 2 h RT. The antibody binding was visualized using a Vectastain ABC Kit (Vector Laboratories, cat# PK-6100) and diaminobenzidine (DAB) substrate tablet (Sigma-Aldrich, cat# D4293-50SET) as described previously (Jiang et al., 2019). Images were captured by Keyence microscope bz-x800.
2.4 Immuno-fluorescence staining of fixed brain tissues
For immuno-fluorescence labeling, selected sections of hippocampus from bregma-1.8 and LEnt from bregma-2.8, were washed in PBS for 10 min and then permeabilized in 0.5 mL PBS/0.25% Triton X-100 (PBST). The tissues were blocked in PBST supplemented with 5% BSA and 5% normal donkey serum for 1.5–2 h at RT. The 1° antibodies were diluted in 5% BSA/PBST, added to the sections and incubated overnight at 4°C. On the second day, the sections were washed 3× in PBST, 15 min each. Next the sections were incubated for 2 h at RT in 5% BSA/PBST containing 2° antibodies (1:700 for Dylight-/Alexa-conjugated antibodies made in donkey, Thermo Fisher Scientific). For DAPI nuclei stain, the sections were incubated for 15 min in DAPI (1:10000)/PBST, then washed 2× with PBST and 1× with PBS, 10 min each. The labeled brain sections were mounted onto microscope glass slides in Prolong gold anti-fade reagent. The following 1° antibodies were used in this study: NeuN (chicken, Millipore, cat# ABN91), 1:300; MC1 (mouse, provided by Peter Davies, Northwell), 1:100; TOMA2 (mouse, provided by Rakez Kayed, UTMB Galveston), 1:200 (Castillo-Carranza et al., 2014); 6E10 antibody (BioLegend, cat# 803001, 1:1000 dilution); 4G8, Anti-Amyloid β Antibody, clone W0-2, reactive to amyloid-β, aa 17–24 (Millipore Sigma, Cat# MABN10), 1:1000; Iba-1 (Abcam, Cat# ab5076), 1:1000; Images were captured by Carl Zeiss confocal LSM700.
2.5 Tissue preservation and clearing, Immunolabeling and imaging
Paraformaldehyde-fixed samples were preserved with using SHIELD reagents (LifeCanvas Technologies) using the manufacturer’s instructions (Park et al., 2018). Samples were delipidated using LifeCanvas Technologies Clear+ delipidation reagents. Following delipidation samples were labeled using eFLASH (Costa et al., 2019) technology which integrates stochastic electrotransport (Kim et al., 2015) and SWITCH (Murray et al., 2015), using a SmartBatch+ (or SmartLabel) device (LifeCanvas Technologies). After immunolabeling, samples were incubated in 50% EasyIndex (RI = 1.52, LifeCanvas Technologies) overnight at 37°C followed by 1 day incubation in 100% EasyIndex for refractive index matching. After index matching the samples were imaged using a SmartSPIM axially-swept light sheet microscope using a 3.6x objective (0.2 NA) (LifeCanvas Technologies).
2.6 Measurements of pathological proteins Aβ and phosphorylated tau by enzyme-linked immunosorbent assay
The Measurements of pathological Aβ and phosphorylated tau by enzyme-linked immunosorbent assay (ELISA) was performed as described previously (Xia et al., 2009; Stein et al., 2015; Stathas et al., 2022). In brief, frozen mouse brain tissue was homogenized in 5:1 volume of freshly prepared, ice cold 5 M guanidine hydrochloride in Tris-buffered saline (20 mM Tris-HCl, 150 mM NaCl, pH 7.4), which contained 1:100 Halt protease inhibitor cocktail (Thermo Fisher Scientific) and 1:100 phosphatase inhibitor cocktail 2 & 3 (Sigma-Aldrich) as previously reported (Park et al., 2018; Costa et al., 2019). The homogenate was then shaken (regular rocker) overnight at room temperature. The lysate was diluted with 1% Blocker A [Meso Scale Discovery (MSD), #R93BA-4] in wash buffer according to specific immunoassays: 1:4000 for Aβ1–38, Aβ1–40, and Aβ1–42 (MSD #K15200E-2), and 1:300 for p-tau181, p-tau202 (MSD custom kit), total tau and p-tau231 (MSD #K15121D-2). Samples were centrifuged at 17,000 g and 4°C for 15 min. The supernatant was subsequently applied to the immunoassays, and the original homogenate was aliquoted and stored at −80°C.
To capture MAPT phosphorylated at Thr residue 181, antibody AT270 was used. The detecting antibody was the biotinylated HT7 that recognizes residue 159–163 of tau (Thermo Fisher Scientific). To measure p-tau396, a rabbit monoclonal antibody against p-tau396 (Abcam, ab156623) was used as the capturing antibody, and HT7 was used as a detecting antibody. Sulfo-tag conjugated streptavidin secondary antibody was used for signal detection by the MSD platform. MSD SECTOR Imager 2400 was used to measure p-tau396 levels. Internal calibrators of p-tau and tau were used (MSD). p-tau levels were measured in arbitrary units, which may or may not be related among the different epitopes. Standards with known concentrations were used for Aβ, and all standards and samples were run in duplicate. Measurements were made using the multi-detection SPECTOR 2400 Imager (MSD).
2.7 Reverse transcription quantitative real-time PCR
The reverse transcription quantitative real-time PCR (RT-qPCR) was applied for the rapid detection of gene expression changes of pro-inflammatory cytokines and complement proteins in the brain tissue of WT, APPNL-G-F, MAPTP301S, and APPNL-G-F/MAPTP301S double transgenic, respectively. The primers used in this study are listed below:

2.8 Images analysis
The intensity in immuno-fluorescence or DAB stained brain sections were measured by MATLAB program; the NeuN-positive cell number were quantified by Image J automatically cell counting. The quantification of cell numbers was done in a blinded manner, with the investigator analyzing the samples being different than the investigator coding the samples.
Studies using the Imaris Bitplane program were used to create videos of immunofluorescence in the cleared brains.
2.9 Statistical analysis
Statistical analyses and figures artwork were performed using GraphPad Prism version 9.00 for Windows with two sided α of 0.05. All group data are expressed as mean ± SEM. Colum means were compared using one-way ANOVA with treatment as the independent variable. And group means were compared using two-way ANOVA with factors on genotype and age time course of the mice, respectively. When ANOVA showed a significant difference, pair wise comparisons between group means were examined by Tukey’s multiple comparison test. Significance was defined at p < 0.05.
3 Results
3.1 Generation of the APPNL-G-F/MAPTP301S mouse line
The APPNL-G-F mouse line was developed to avoid artifacts associated with over-expressing APP (Saito et al., 2014). These mice develop robust neuritic plaque pathology. We initiated the project by crossing homozygous APPNL-G-F mice with heterozygous P301S MAPT mice. The mice generated normal mendelian patterns of inheritance, producing expected genotypes in the offspring. The resulting mouse lines were aged, harvested and examined patterns of APP expression, as well as the accumulation of Aβ and neuritic plaques at 3, 6, and 9 months of age. Immunoblots of APP using the 48G antibody showed that expression of the tau transgene reduces the expression of APP at each age (Figures 1A,B).
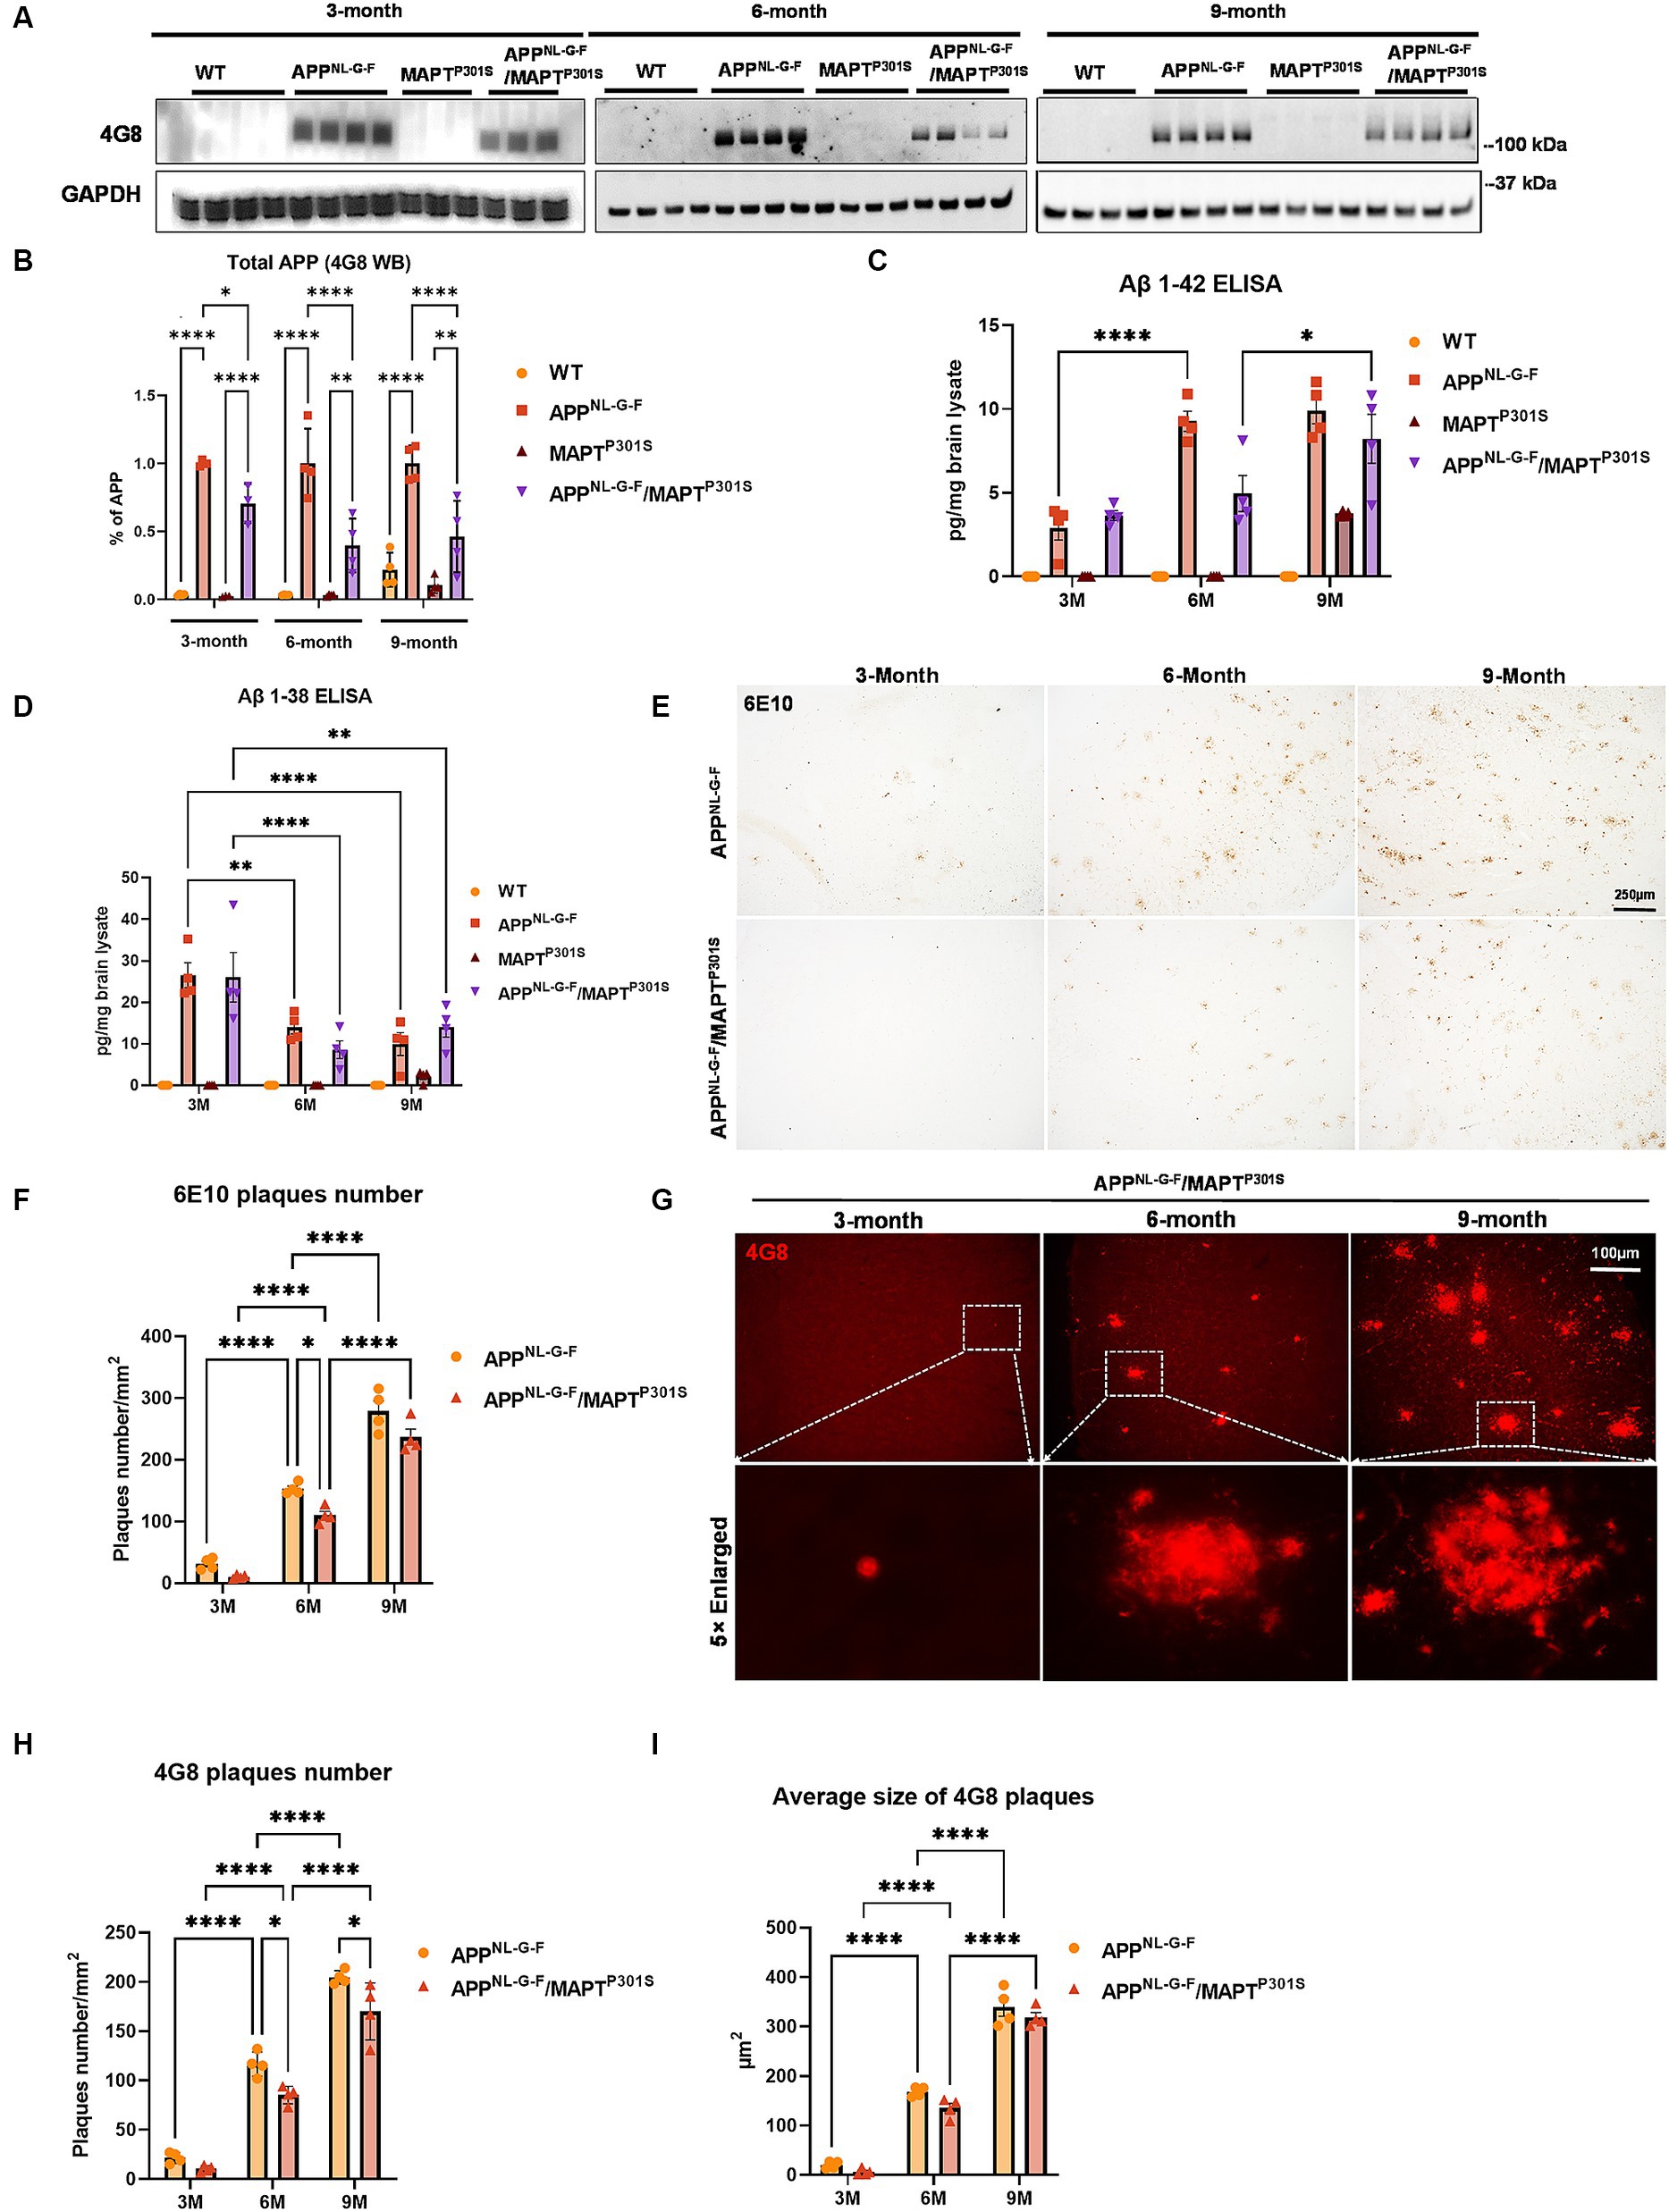
Figure 1. Beta-amyloid deposition accumulates in a time-dependent manner in the APPNL-G-F/MAPTP301S mouse. (A) Representative images of immunoblot with 4G8 antibody showed the expression of human amyloid precursor protein (APP) in the APPNL-G-F and APPNL-G-F/MAPTP301S mouse brain but not wild type (WT) or MAPTP301S brain. Total brain lysates were harvested at 3, 6, and 9 months for each of the four mouse genotypes (WT, APPNL-G-F, MAPTP301S, and APPNL-G-F/MAPTP301S double transgenic, respectively). GAPDH was detected as the internal control. (B) Quantification of human APP expression in the total brain lysate as shown in (A). N = 4, data shown as mean ± SEM. (C,D) The amount of Aβ38 and Aβ42 in the total brain lysate detected by V-PLEX Aβ Peptide Panel 1 (4G8) Kit. Brain lysate from 4 genotypes of mice were detected at 3, 6, and 9 months, respectively. N = 4 mice in each condition, data shown as mean ± SEM. Two-way ANOVA with Tukey’s multiple comparisons test, *p < 0.05, **p < 0.01, and ****p < 0.001. (E) The 6E10 antibody (reactive to aa 1–16 Aβ and to APP) was used to examine the diffused amyloid plaques in the aging process of APPNL-G-F and APPNL-G-F/MAPTP301S mouse brain. Representative DAB staining images showed the progressive increase of 6E10 positive β-amyloid plaques in the entorhinal cortex from 3 to 6 and 9 months of mouse brain. Scale bar 250 μm. (F) Quantification for the number of 6E10 positive β-amyloid plaques averaged over 1 mm2 squares across each brain slice. N = 4 mice in each group, data shown as mean ± SEM. Two-way ANOVA with Tukey’s multiple comparisons test, *p < 0.05 and ****p < 0.001. (G) The 4G8 antibody (reactive to Aβ, aa 17–24) was used to examine the compact amyloid plaques in the aging process of APPNL-G-F and APPNL-G-F/MAPTP301S mouse brain. Representative red fluorescence labeling stacked images showed the progressive increase of 4G8 positive β-amyloid plaques in the entorhinal cortex from 3 to 6 and 9 months of mouse brain. Scale bar 100 μm. (H,I) Quantification of the number and average size of 4G8 positive Aβ + plaques. N = 4 mice per group, 3 sections were used for each mouse. Data shown as mean ± SEM. Two-way ANOVA with Tukey’s multiple comparisons test, *p < 0.05 and ****p < 0.001.
To explore the accumulation of extracellular Aβ in the transgenic mice, we examined the amount of Aβ38 and Aβ42 in the total brain lysates by V-PLEX Aβ Peptide ELISA Kit. The V-PLEX platform offers analytically validated singleplex and multiplex assay kits, which can provide accurate and reproducible results with consistency from lot to lot (van Dyck et al., 2023). ELISA quantification of Aβ42 showed that Aβ42 levels progressively increased with age in both APPNL-G-F and APPNL-G-F x MAPTP301S mouse brains (Figure 1C). Notably, in the APPNL-G-F mouse the Aβ42 level peaked at 6 months and remained constant at 9 months while levels of Aβ42 steadily increased with age (at 3, 6, and 9 months) in APPNL-G-F × MAPTP301S mouse brain (Figure 1C). In contrast, Aβ38 levels decreased with age in APPNL-G-F and APPNL-G-F × MAPTP301S mice (Figure 1D).
Quantification of Aβ plaque-load by immunohistochemistry indicated that plaque load results largely followed the quantification of Aβ42 determined by ELISA. Mice at 3, 6, and 9 months were harvested and subjected to immunohistochemistry using both colorimetric and fluorescent approaches. Analysis of sections with antibody 6E10, which preferentially detects diffuse plaques, was done using the colorimetric DAB/peroxidase method. These results showed a progressive increase in amyloid plaque accumulation in the APPNL-G-F mouse line as well as the APPNL-G-F/MAPTP301S mouse line (Figures 1E,F). Importantly, amyloid plaques showed age-dependent increases for both the APPNL-G-F and the APPNL-G-F/MAPTP301S mouse lines (Figures 1E–I), although the APPNL-G-F/MAPTP301S mouse line exhibited less accumulation than for the APPNL-G-F mouse line (Figures 1E–G). For instance, a robust, progressive increase in 4G8-positive plaque load was observed in both the APPNL-G-F mouse line as well as the APPNL-G-F × MAPTP301S mouse line, but the APPNL-G-F × MAPTP301S mice exhibited fewer (15–20%) plaques than the APPNL-G-F mice at 6 and 9 months (Figures 1G,H). Interestingly, the average plaque size did not differ between the two groups (Figures 1G,I).
These results indicate that the APPNL-G-F × MAPTP301S double transgenic mouse model recapitulates the progressive accumulation Aβ plaques and levels similar to that seen in the APPNL-G-F model although total levels of APP and Aβ accumulation are lower in the cross than with the knock-in gene alone.
3.2 APPNL-G-F potentiates progression of MAPT pathology in the APPNL-G-F/MAPTP301S double transgenic mice
Another goal of the APPNL-G-F/MAPTP301S double transgenic mice is to recapitulate the development of MAPT pathology associated with cognitive decline in AD patients. To investigate the MAPT aggregation in the MAPTP301S and APPNL-G-F/MAPTP301S mice as well as the effect of APPNL-G-F on MAPT pathology, we examined MAPT phosphorylation, oligomerization and misfolding in the aging process of all four genotypes, including MAPTP301S, APPNL-G-F and APPNL-G-F/MAPTP301S in comparison to WT C57BL/6 control. The total brain lysates were prepared from the fresh frozen brain tissue harvested at 3, 6, and 9 months and homogenized in RIPA buffer.
Recent studies highlight phosphorylated MAPT at threonine MAPT 217 (pTau217) as a new promising plasma biomarker for pathological changes implicated in AD (Telser et al., 2022). Immunohistochemistry with postmortem AD brain tissue also demonstrated that pTau217 is found in neurofibrillary tangles (NFTs) and neuropil threads that are also positive for pTau181, 202, 202/205, 231, and 369/404 (Wennstrom et al., 2022). Levels of pTau217 also correlate with total Aβ and NFT brain load in AD brain (Ashton et al., 2022; Wennstrom et al., 2022). Thus, we use levels of pTau217 as biomarker for evaluating the pathological progression of the APPNL-G-F/MAPTP301S mouse model. Immunoblots of brain lysates from MAPTP301S and APPNL-G-F/MAPTP301S mice showed progressive accumulation of pTau217 over 3, 6, and 9 months range (Figures 2A,B). The APPNL-G-F/MAPTP301S exhibited significantly more pTau217 MAPT phosphorylation at 6 and 9 months compared to MAPTP301S alone, which suggest that APPNL-G-F potentiated MAPT phosphorylation (Figures 2A,B). Total levels of MAPT were measured using the BT2 antibody (epitope between aa 194–198, but not PHF MAPT) by ELISA assay. We also used ELISA assays to measure levels of hyper-phosphorylated MAPT in the brain lysate, quantifying MAPT phosphorylation at threonine181 (pTau181) with the AT270 antibody (Figures 2C,D). The result showed that both APPNL-G-F/MAPTP301S and MAPTP301S accumulated hyperphosphorylated tau, but crossing APPNL-G-F to MAPTP301S increased the accumulation of pTau181 and 217 (Figures 2B–D).
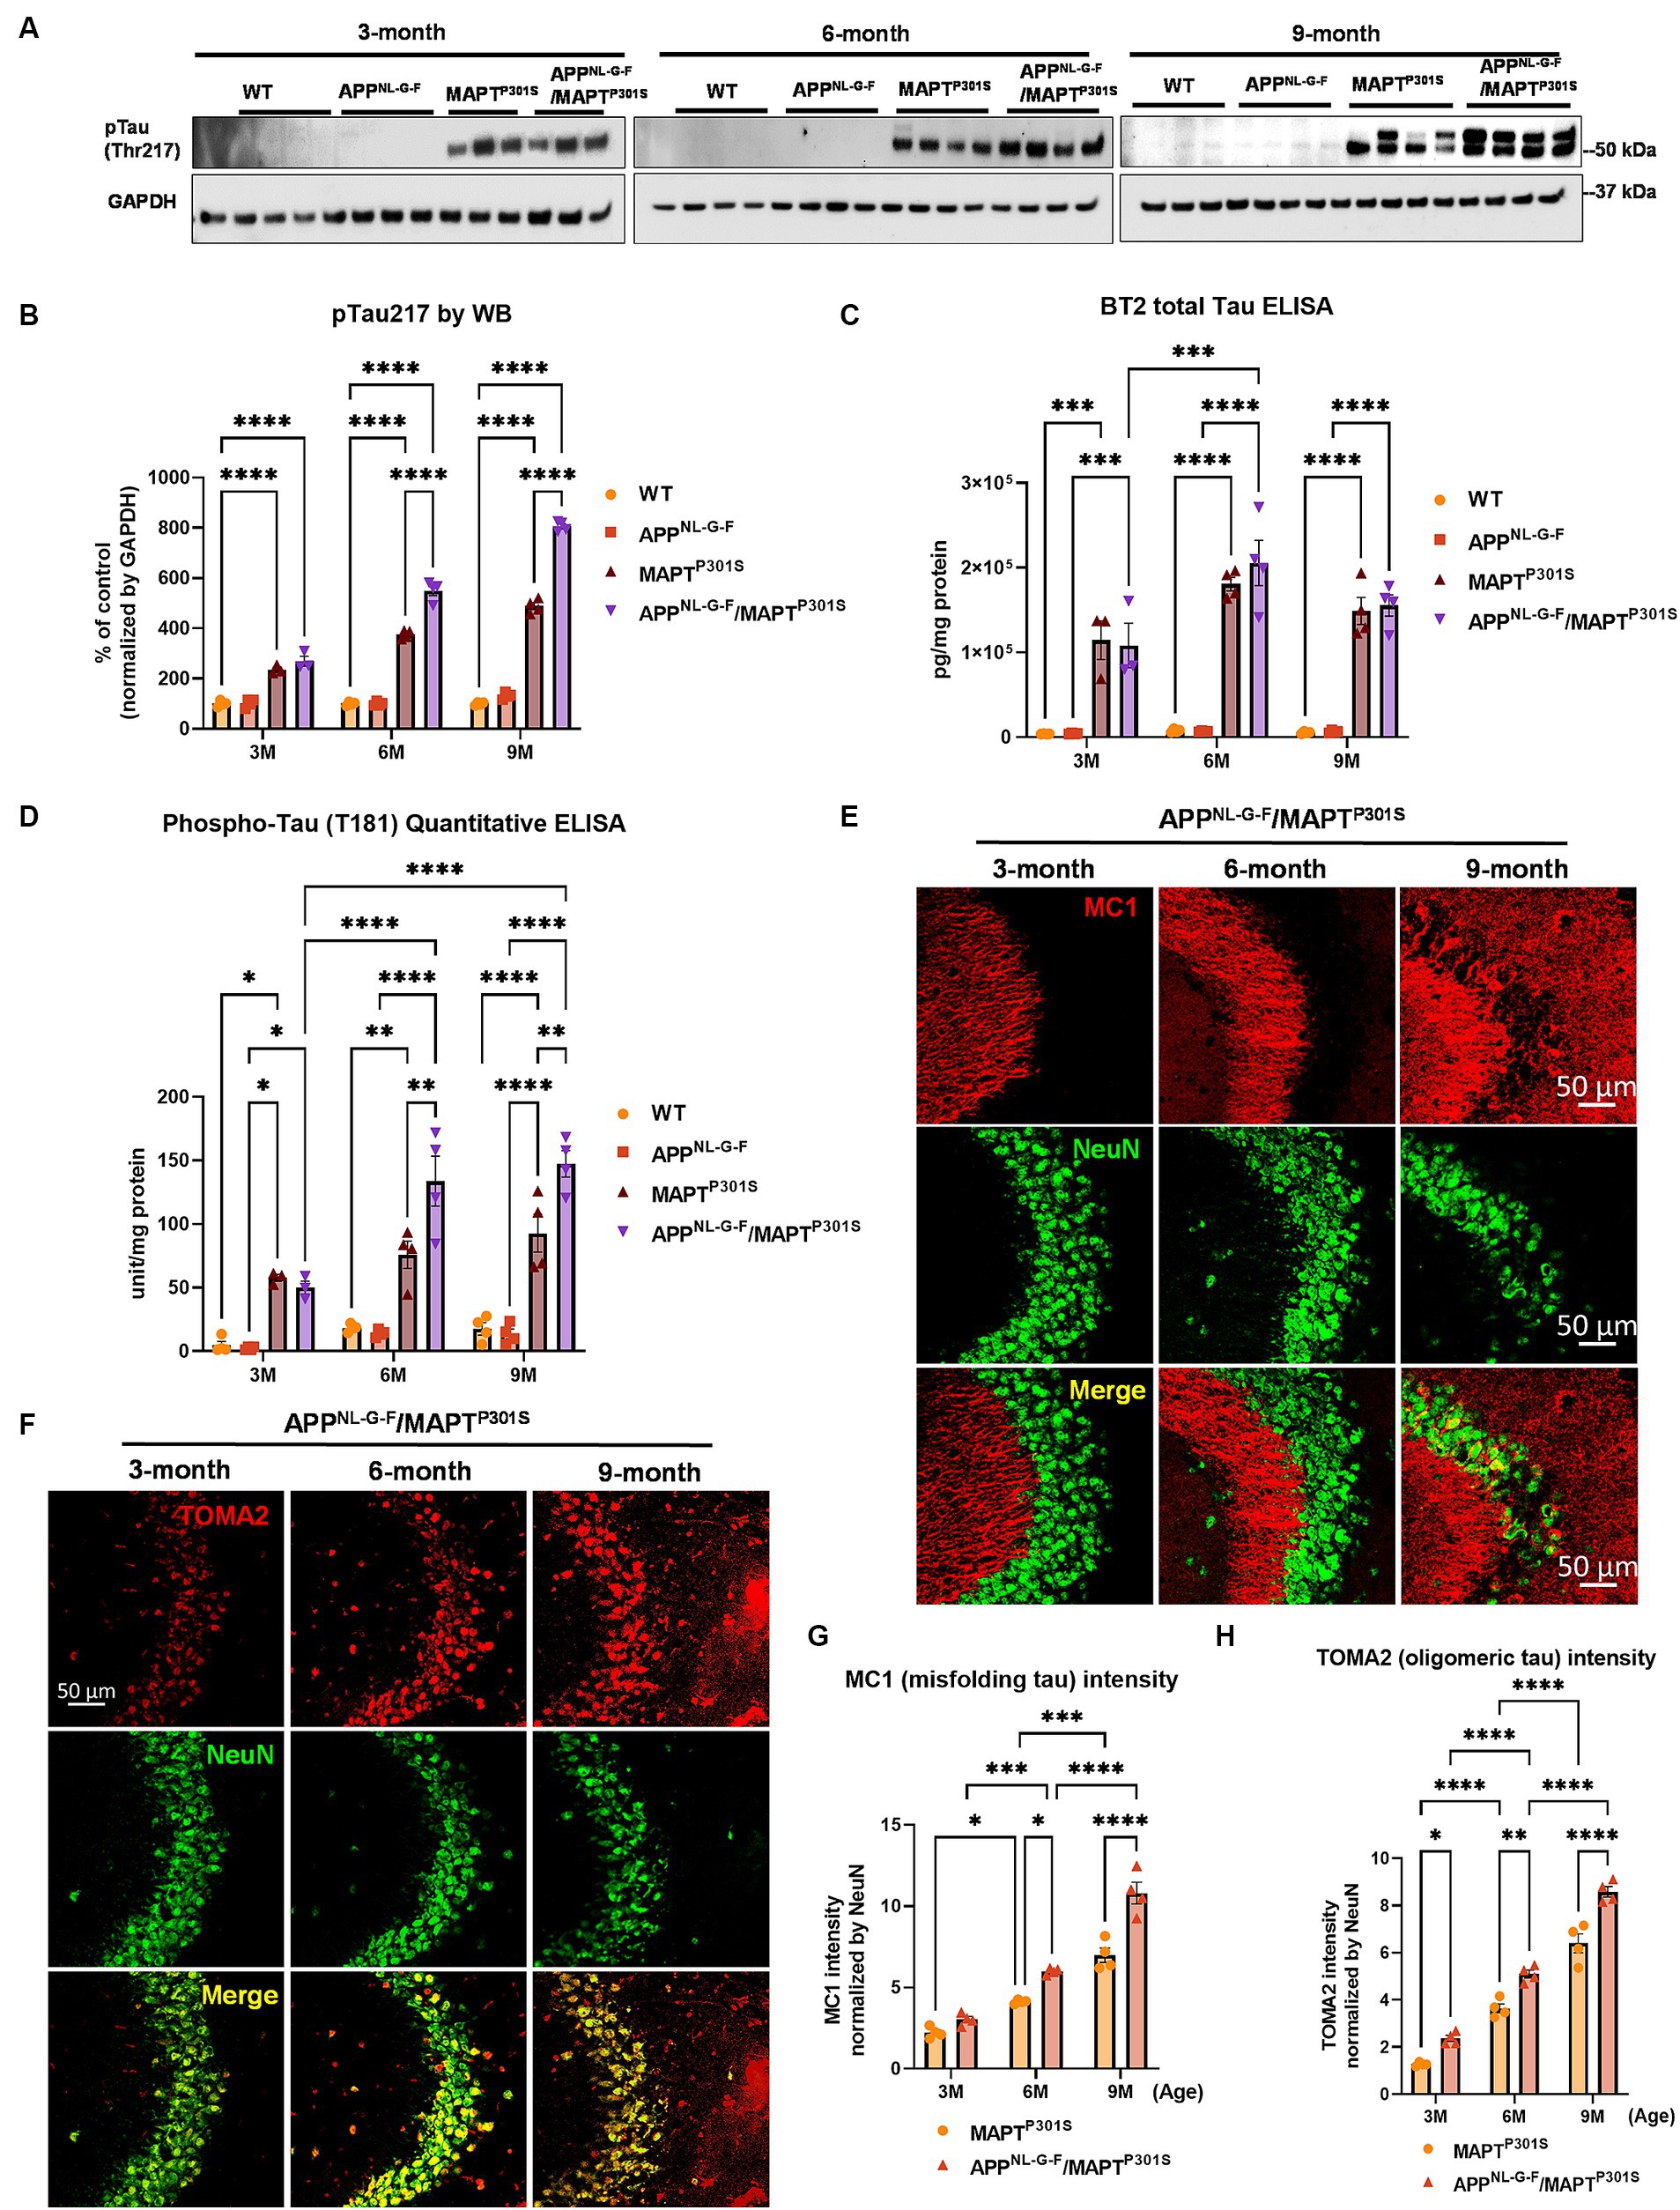
Figure 2. APPNL-G-F potentiates progression of MAPT pathology in the APPNLGF/MAPTP301S double transgenic mice. (A) Representative images of western blot with phosphorylated tau antibody on phosphor-site threonine217 (pTau217) showed the accumulation of hyper phosphorylated tau in the MAPTP301S and APPNL-G-F/MAPTP301S mouse brain but not wild type (WT) or APPNL-G-F brain. Total brain lysate were harvested at 3, 6, and 9 months for each of the four genotypes (WT, APPNL-G-F, MAPTP301S, and APPNL-G-F/MAPTP301S) of mice, respectively. GAPDH was detected as the internal control. (B) Quantification of pTau217 in the total brain lysate as shown in (A). N = 4 mice in each group, data shown as mean ± SEM. Statistics was by two-way ANOVA with post hoc Tukey’s multiple comparisons test, ****p < 0.001. (C,D) Detection of total MAPT levels in the brain lysates with the BT2 antibody (epitope between aa 194–198, but not PHF tau) and threonine181 phosphorylated tau (pTau181) by AT270 antibody, respectively, with ELISA assay. N = 4 mice in each group, data shown as mean ± SEM. Statistical analysis was by two-way ANOVA with post hoc Tukey’s multiple comparisons test, ***p < 0.005 and ****p < 0.001. (E) Representative fluorescence labeling images showed the accumulation of misfolding tau (by MC1 antibody, red) in the hippocampal CA3 region of APPNL-G-F/MAPTP301S mice over 3, 6, and 9 months. NeuN antibody (green) was used to label the neuronal cells. Scale bar 50 μm. (F) Representative fluorescence images show the accumulation of oligomeric tau (TOMA2 antibody, red) in the hippocampal CA3 brain region of APPNL-G-F/MAPTP301S mice over 3, 6, and 9 months. NeuN antibody (green) was used to label neurons. Scale bar 50 μm. (G,H) Quantification of misfolded tau (MC1) and oligomeric tau (TOMA2) as shown in (E,F) respectively. Total fluorescence intensity was collected and then normalized by NeuN for statistics. N = 4 mice in each group, data is shown as mean ± SEM. Two-way ANOVA was used for statistics followed by post hoc analysis with Tukey’s multiple comparisons test, *p < 0.05, **p < 0.01, ***p < 0.005, and ****p < 0.001.
In addition to the MAPT phosphorylation, we also examined the MAPT misfolding by the conformational tau marker MC1 (epitope within aa 312–322) with immuno-fluorescence labeling. Our result showed that MAPT tau misfolding started at the dendritic compartment of the neurons in CA3 when the mice were 3 months old (Figure 2E). By 9 months of age, the misfolded MAPT had also distributed and accumulated in neuronal soma (Figure 2E). Compared to MAPTP301S alone, the APPNL-G-F/MAPTP301S double transgenic mouse consistently potentiated accumulation of misfolded MAPT over the time span of 3, 6, and 9 months of age (Figure 2G).
Studies suggest that MAPT oligomers are the more toxic species that induce neurodegeneration (Lasagna-Reeves et al., 2011; Castillo-Carranza et al., 2014; Apicco et al., 2018; Jiang et al., 2019, 2020). To assess the assembly of MAPT oligomers in the APPNL-G-F/MAPTP301S double transgenic mouse, we detected MAPT by immuno-fluorescence in hippocampus using the antibody TOMA2, which specifically recognizes oligomeric MAPT (Sengupta et al., 2018). The result showed strong labeling of oligomeric MAPT that was selective for the somatic compartment of the neurons and exhibited progressive age dependent accumulation as the mice (Figure 2F). Quantification of TOMA2 intensity revealed that MAPT oligomers were more abundant in APPNL-G-F/MAPTP301S double transgenic mouse compared to MAPTP301S (Figure 2H).
These results demonstrate that APPNL-G-F potentiates the progression of MAPT pathology including phosphorylation, mis-conformation and oligomerization in the APPNL-G-F/MAPTP301S double transgenic mice.
3.3 APPNL-G-F is the predominant driver of microglial activation and astrogliosis
Microglial activation and astrogliosis are thought to be induced by Aβ and MAPT pathology, and contribute to subsequent neurodegeneration in AD (Hansen et al., 2018; Leng and Edison, 2021). To characterize glial activation in the APPNL-G-F/MAPTP301S double transgenic mouse, we analyzed the microglial and astrocytic morphologies as well as levels of inflammatory factor transcripts during the aging process in the APPNL-G-F/MAPTP301S mouse brain. Our data showed that microglia exhibit a ramified appearance under basal conditions labeled by Iba-1 marker. The presence of the APPNL-G-F gene induced morphological changes with thickening processes and amoeboid shape (Figures 3A,B). The morphological changes induced by the APPNL-G-F gene were similar for the APPNL-G-F mouse and the APPNL-G-F/MAPTP301S mouse lines (Figure 3A). Quantification of these morphological changes suggested that the effect of the APPNL-G-F gene were not additive with those of the P301S MAPT transgene (Figures 3C,D). Similar results were observed for astrocytosis (labeled by astrocytic marker GFAP), along with strong co-localization with the Aβ plaques (Figures 3A,D).
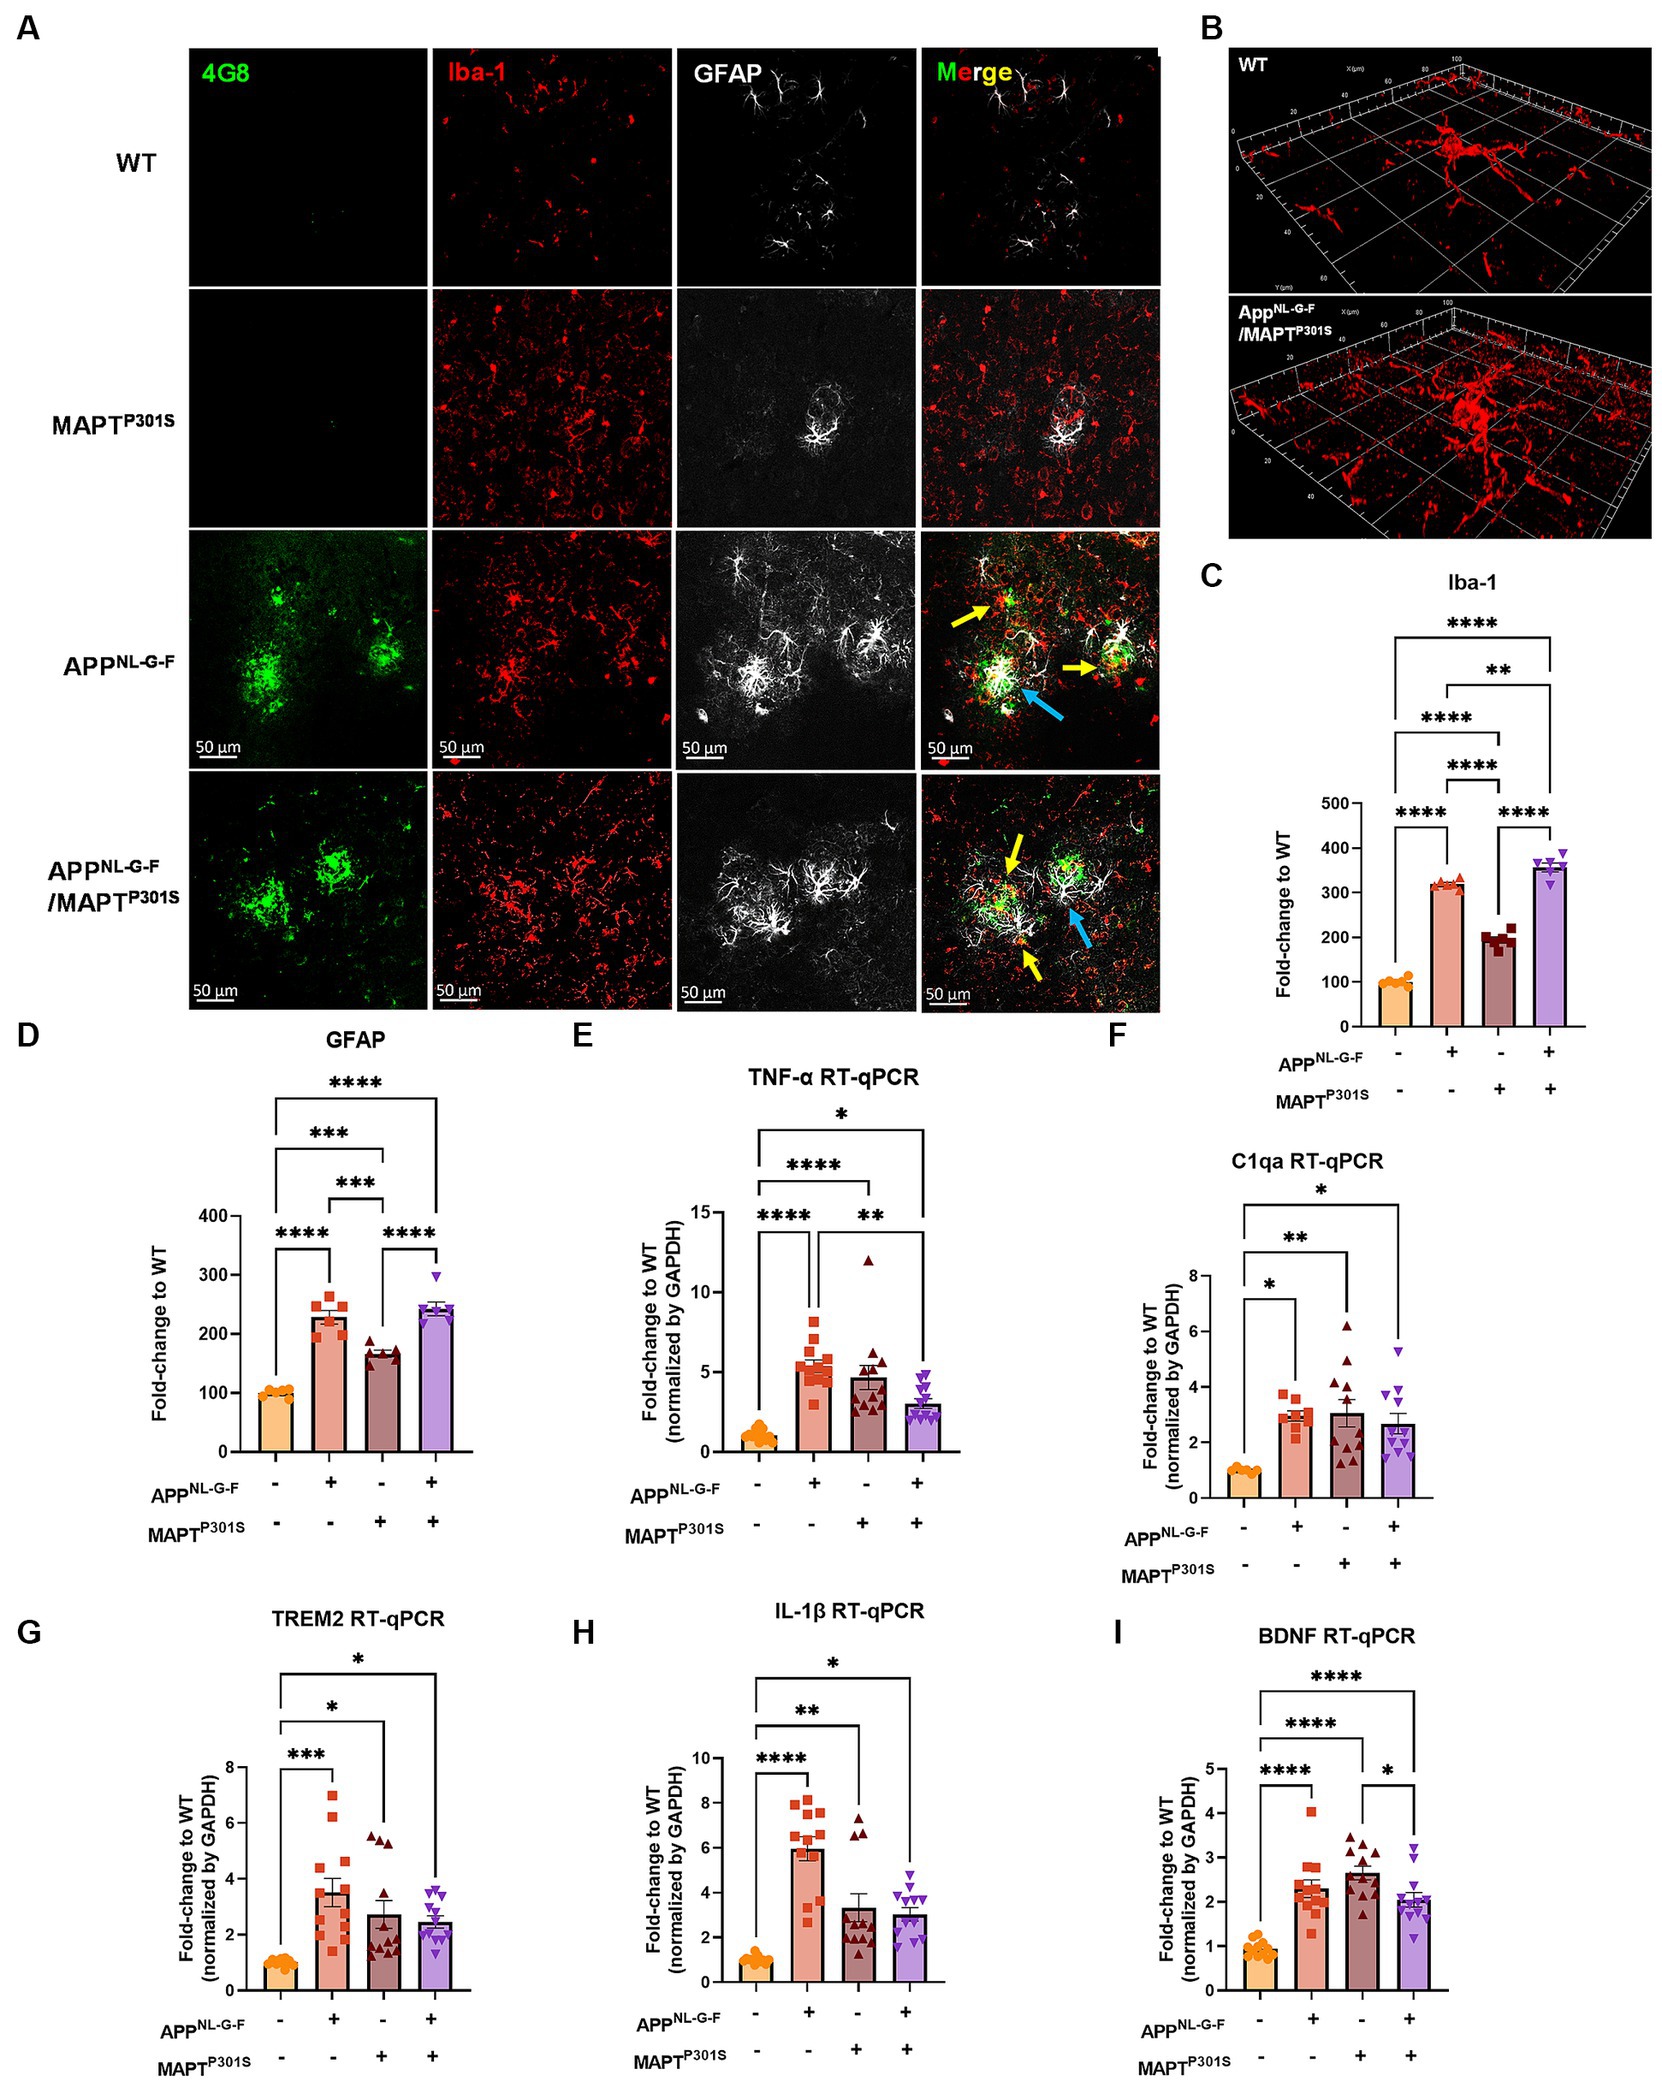
Figure 3. APPNL-G-F is the predominant driver of microglial activation and astrogliosis. (A) Representative fluorescence labeling images showed the activation and morphological changes of microglia (by Iba-1 antibody, red) in the frontal cortex in pathological APPNL-G-F and/or MAPTP301S mouse brain at 9 months old. Astrocytes (GFAP antibody, white) were robustly activated around Aβ plaques. Scale bar 50 μm. (B) Enlarged image showed the amoeba-like morphological changes of microglia in the APPNL-G-F/MAPTP301S mouse brain. (C,D) Quantification of microglial activation by Iba-1 intensity and astrogliosis by GFAP intensity as shown in (A). Data was normalized to the fold increase of WT control. N = 6 mice in each group, data is shown as mean ± SEM. Two-way ANOVA was used for statistics followed by post hoc analysis with Tukey’s multiple comparisons test, **p < 0.01, ***p < 0.005, and ****p < 0.001. (E–I) Quantification on the transcriptomic levels of inflammatory factors in the brain of WT, APPNL-G-F, MAPTP301S, and APPNL-G-F/MAPTP301S mouse lines, respectively, at 9 months. The pro-inflammatory factors TNF-α, IL-1β, C1qa as well as BDNF were quantified by RT qPCR. Results are shown as fold-change vs. WT control. N = 10–12 mice per group; data is shown as mean ± SEM. One-way ANOVA was used for statistics followed by post hoc analysis with Tukey’s multiple comparisons test, *p < 0.05, **p < 0.01, ***p < 0.005, and ****p < 0.001.
The imaging studies of Iba1 convey what occurs locally around neuritic plaques and MAPT pathology, but do not convey the distribution of inflammation in the APPNL-G-F/MAPTP301S mouse brain. We performed clarity on APPNL-G-F/MAPTP301S mouse brain and WT brain, and then labeled with antibodies to Aβ (4G8), phospho-202/5 MAPT (AT8) and Iba1 (Yang et al., 2014; Ueda et al., 2020). Neuritic plaques were evident throughout the neocortex, as expected (Supplementary Videos S1–3 Aβ = Green). As expected, WT brain exhibited very little labeling (Supplementary Video S3). Labeling for phospho-tau encountered technical difficulties, so was weak, but the labeling that was present in the APPNL-G-F/MAPTP301S mouse brains occurred in the hippocampus and entorhinal cortex (Supplementary Videos S2, 3, pS202/5 MAPT, AT8 = Red). These patterns of labeling or Aβ and MAPT are consistent with prior studies of APPNL-G-F and P301S MAPT mice (Yoshiyama et al., 2007; Saito et al., 2014; Sasaguri et al., 2017; Apicco et al., 2018). The MAPT pathology in the APPNL-G-F/P301S MAPT mice was much more abundant in the hippocampus and entorhinal cortex than in the neocortex, and the Aβ pathology was greatest in the neocortex. The distribution of microglia was labeled with anti-Iba1 (Supplementary Videos S2, 3, Pink). Interestingly, the Iba1 labeling was much more evident in the hippocampus than in the cortex. The pattern of migration of Iba1 labeling suggests that microglia are more responsive to MAPT pathology than Aβ pathology in the APPNL-G-F/P301S MAPT mice.
(Note that technical damage to the brain of APPNL-G-F/P301S MAPT mouse #2 (Supplementary Video S3) in the ventral temporal cortex, near the entorhinal region, during removal appeared to elicit strong inflammatory reactivity; we focused less on this reactivity because the relative roles of Aβ/MAPT pathology versus brain damage are difficult to determine.)
To examine the microglia and astrocyte activation through independent approaches, we measured transcripts coding for pro-inflammatory cytokines, anti-inflammatory cytokines and complement proteins in the brain tissue of WT, APPNL-G-F, MAPTP301S, and APPNL-G-F/MAPTP301S mice, respectively (Figures 3E–H). Our result show similar results for multiple arms of the inflammatory cascade. The pro-inflammatory cytokines TNF-α and IL-1β both showed strongest increases in mice carrying the APPNL-G-F gene (Figures 3E,H); interestingly, mice carrying the MAPTP301S and APPNL-G-F/MAPTP301S genes exhibited levels that were elevated compared to WT mice, but significantly less than that in the APPNL-G-F mice (Figures 3E,H). A similar pattern was observed for TREM2, a key member of the DAM response, which is thought to participate in epherocytosis (Ulland and Colonna, 2018). Next we examined the complement protein, C1q, which contributes to synaptic pruning and also binds to fibrillar Aβ in AD (Afagh et al., 1996; Rupprecht et al., 2021). In the APPNL-G-F/MAPTP301S mouse model, we examined the C1qa RNA level by RT-qPCR and found that it was elevated equally among the APPNL-G-F, MAPTP301S, and APPNL-G-F/MAPTP301S mouse lines compared to WT control (Figure 3F). Finally, we also examined brain-derived neurotrophic factor (BDNFs), which maintains synaptic plasticity and has attracted increasing attention for its potential as a biomarker or therapeutic molecule for AD (Bathina and Das, 2015). Quantification of BDNF transcript by RT-PCR in the APPNL-G-F/MAPTP301S mouse model showed elevation BDNF each of the mouse models (Figure 3I).
The combined data indicate that the APPNL-G-F/MAPTP301S mouse model recapitulates many of the pivotal neuroinflammatory features of AD, and also suggest that the accumulation of Aβ is a stronger driver of microglial activation and astrogliosis that MAPT pathology.
3.4 APPNL-G-F potentiates neurodegeneration in the APPNL-G-F/MAPTP301S mice
Analysis of glial activation in the APPNL-G-F/MAPTP301S mouse model prompted us to quantify how expression of neuronal and synaptic markers change with aging in each mouse line (APPNL-G-F, MAPTP301S, and APPNL-G-F/MAPTP301S vs. WT control). Analysis of MAP2 and NeuN showed that the APPNL-G-F/MAPTP301S mouse line displayed progressive age-dependent neuronal loss from 3 to 6 and 9 months-old (Figures 4A–D); importantly, the APPNL-G-F/MAPTP301S cross showed greater reduction of signal than either the APPNL-G-F and MAPTP301S lines alone, indicating enhanced neurodegeneration for the APPNL-G-F/MAPTP301S line. For instance, at 6 months, the APPNL-G-F/MAPTP301S mouse showed ~35% loss of MAP-2 compared to WT control, which progressed to more than 60% loss of MAP-2 at 9 months (Figure 4B). In addition to the immuno-fluorescence labeling, we also examined synaptic levels using immunoblot quantification of the post-synaptic marker PSD-95 (Figures 4E,F). The results paralleled those observed for MAP-2 and NeuN, with all KI or transgenic lines exhibiting age-dependent synaptic loss, and the APPNL-G-F/MAPTP301S line exhibiting significantly more loss than that observed with either human gene alone (Figures 4E,F).
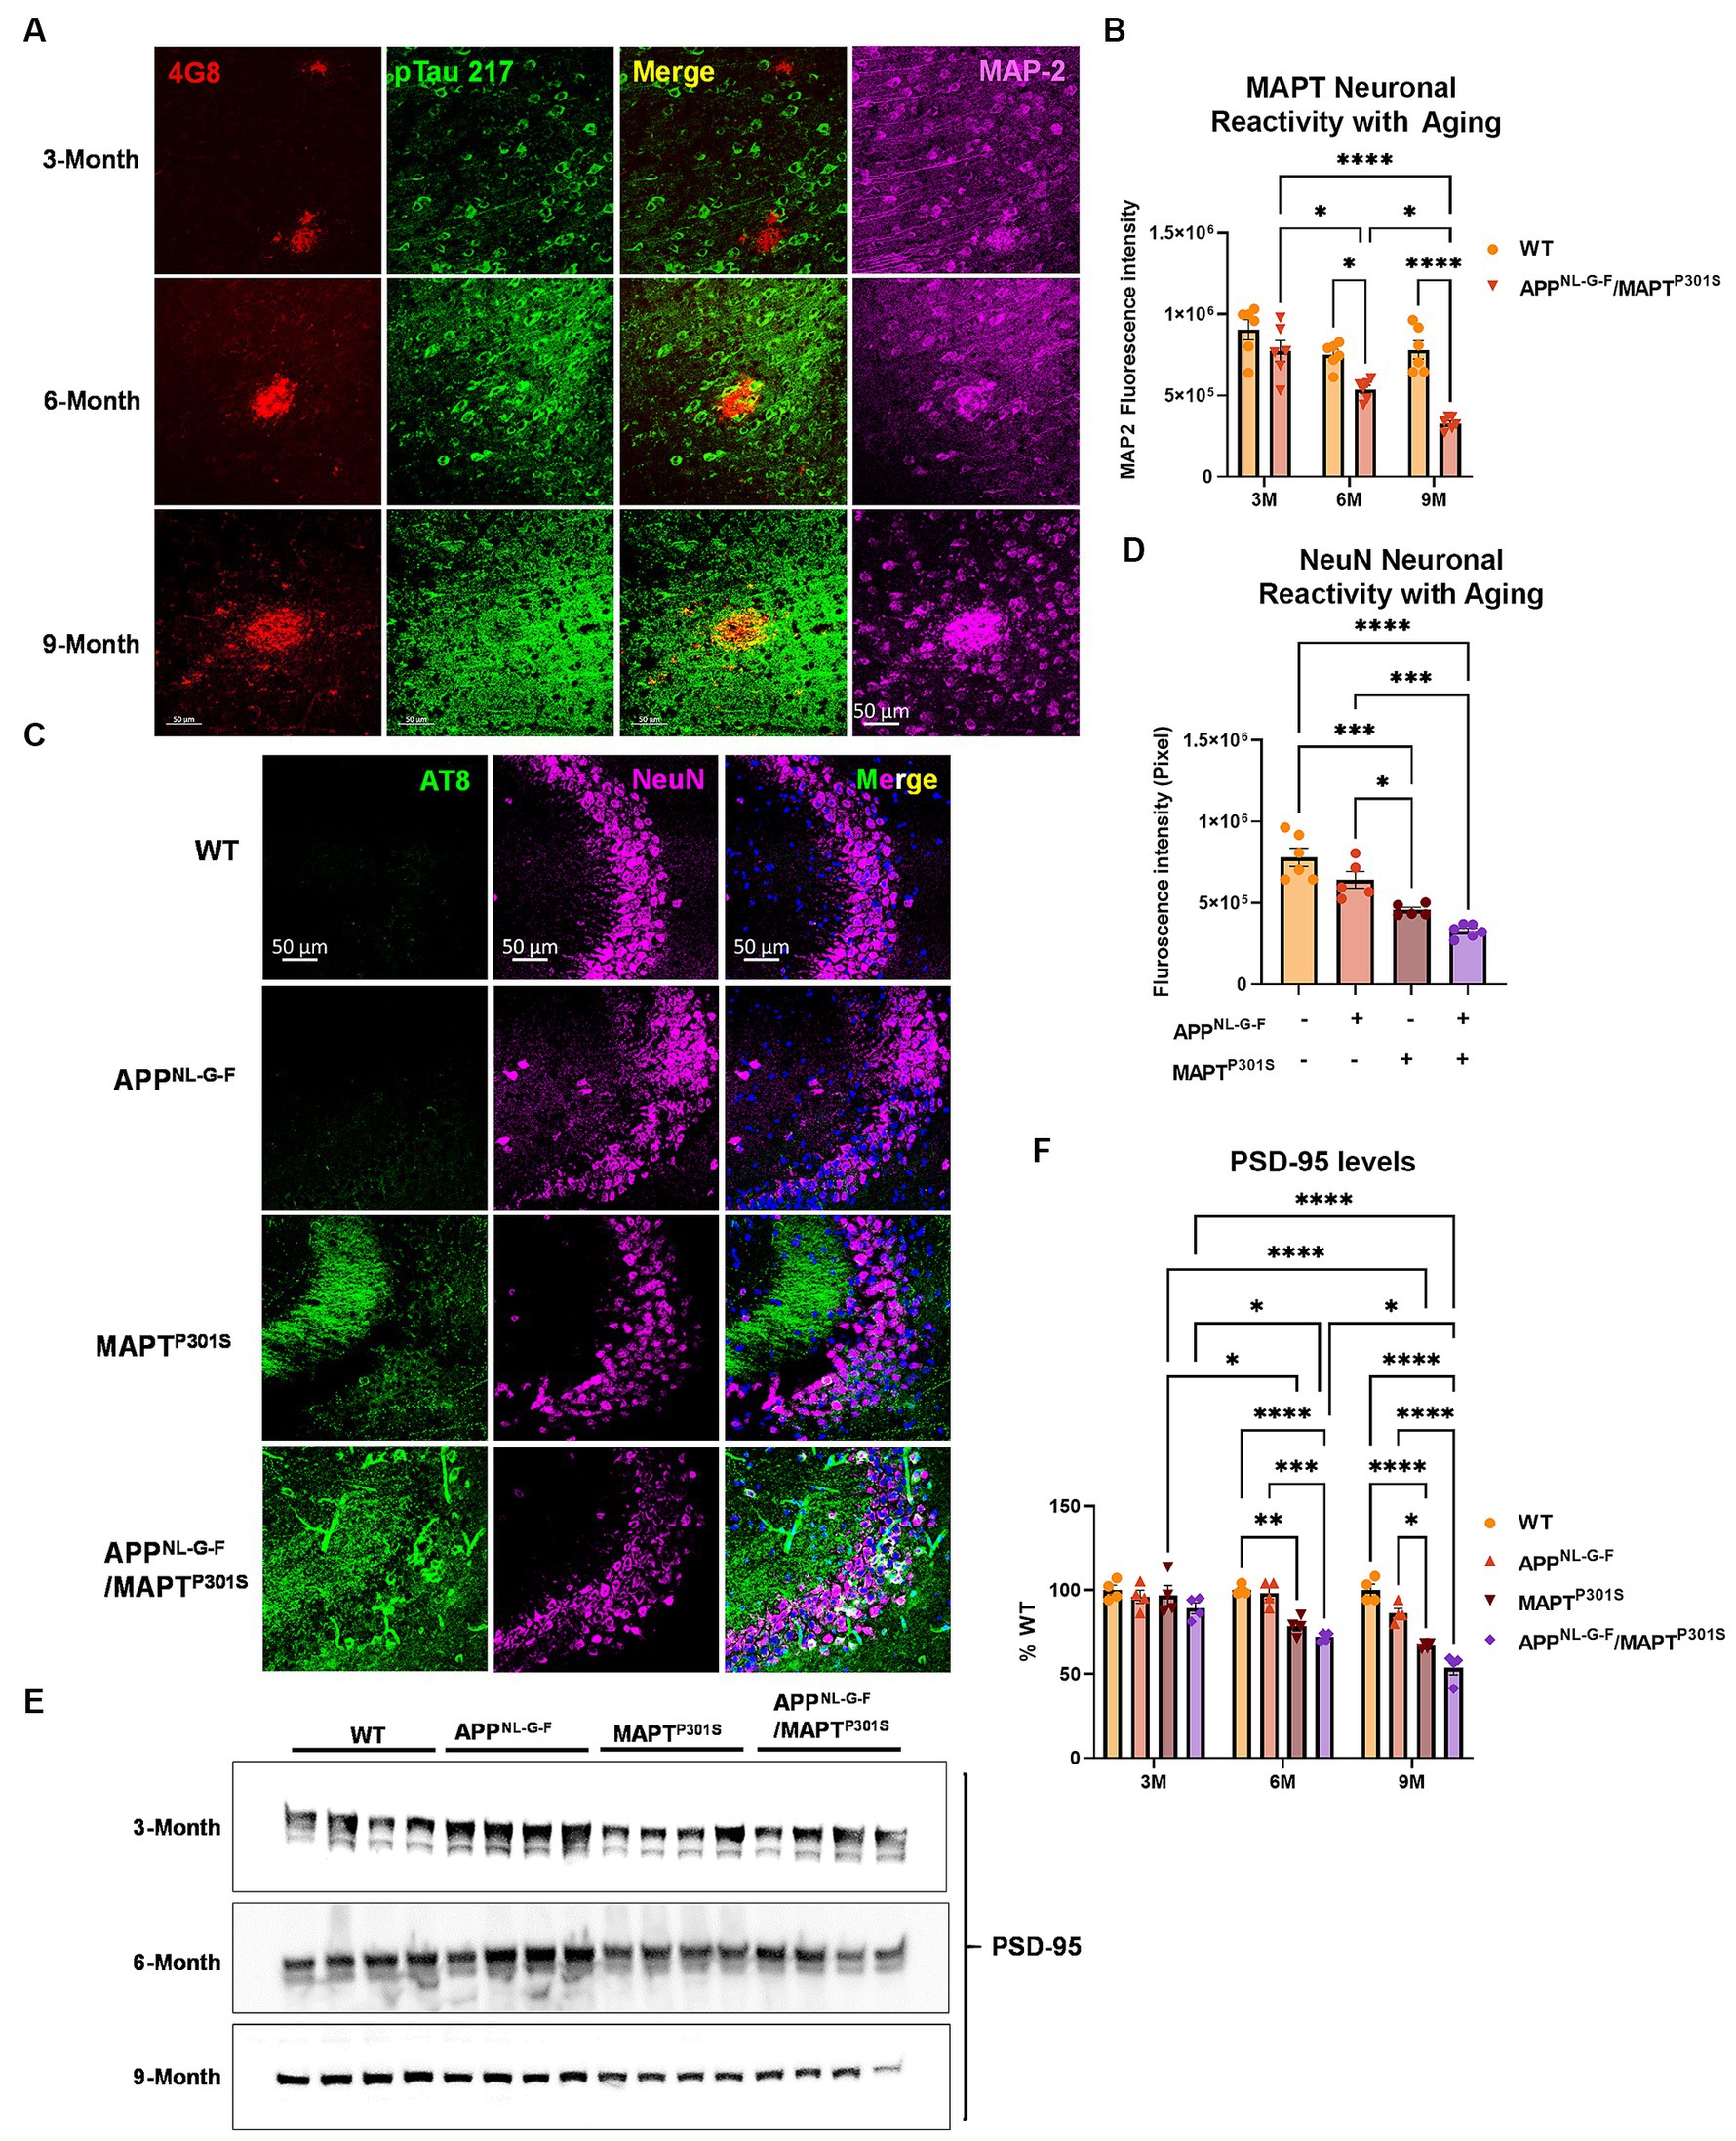
Figure 4. APPNL-G-F potentiates neurodegeneration in the APPNLGF/MAPTP301S double transgenic mice. (A) Representative images showed the enhanced neurodegeneration (MAP-2, magenta) associated with progressive Aβ deposition (4G8, red) and phosphorylated tau (pTau217, green) accumulation in the APPNL-G-F/MAPTP301S mouse brain. Scale bar 50 μm. (B) Quantification of neurodegeneration by MAP-2 intensity as shown in (A). N = 6 mice in each group; data is shown as mean ± SEM. Two-way ANOVA was used for statistics followed by post hoc analysis with Tukey’s multiple comparisons test, *p < 0.05 and ****p < 0.001. (C) Representative images showed enhanced neurodegeneration in APPNL-G-F/MAPTP301S mouse brain compared to APPNL-G-F or MAPTP301S mouse lines at 9 months. Scale bar 50 μm. (D) Quantification of neurodegeneration by NeuN positive neuronal intensity as shown in panel (C) (magenta panels). N = 6 mice in each group, data is shown as mean ± SEM. One-way ANOVA was used for statistics followed by post hoc analysis with Tukey’s multiple comparisons test, *p < 0.05 and ***p < 0.005. (E,F) Immunoblot of post-synaptic marker PSD-95 showed the potentiated neurodegeneration in the APPNL-G-F/MAPTP301S mouse brain compared to APPNL-G-F or MAPTP301S mouse lines over a 3, 6, and 9 months old. Quantification of band intensities showed that progressive and enhanced decrease of PSD-95 in the APPNL-G-F/MAPTP301S mouse brain. N = 4 mice in each group, data was normalized to percentage of WT control and is shown as mean ± SEM. Two-way ANOVA was used for statistics followed by post hoc analysis with Tukey’s multiple comparisons test, *p < 0.05, **p < 0.01, ***p < 0.005, and ****p < 0.001.
3.5 N6-methyl-adenosine and its regulatory enzyme proteins are dysregulated in the APPNLGF/MAPTP301S double transgenic mice
N6-methyl-adenosine (m6A) is the most abundant modification in eukaryotic RNA (Jiang X. et al., 2021). In the recent studies, our group used immunohistochemical labeling of m6A to show that m6A accumulation is a general feature of AD pathology (Jiang L. et al., 2021). Levels of m6A modifications are controlled by addition of m6A modifications with m6A methyltransferases (also known as writers), such as METTL3/14/16, RBM15/15B and WTAP; m6A levels are also controlled by removal via demethylases (also known as erasers), including FTO and ALKBH5 (Flamand et al., 2023). The m6A-binding proteins YTHDF1/2/3, YTHDC1/2 IGF2BP1/2/3 and HNRNPA2B1 recognize the modifications; these are also known as “readers” (Jiang X. et al., 2021). Previously we showed that interaction of MAPT with HNRNPA2B1 and m6A RNA mediates the progression of tauopathy (Jiang L. et al., 2021). Other studies of AD indicate that m6A dysregulation often occurs in the context of altered expression of m6A writers and readers (Han et al., 2020; Huang et al., 2020; Deng et al., 2021; Zhao et al., 2021; Zhang et al., 2023). Hence, we examined levels of m6A writers and readers in the APPNL-G-F/MAPTP301S mouse model.
Immunofluorescence studies with anti-m6A antibody suggest that total levels of m6A progressively increased in the APPNL-G-F/MAPTP301S mouse at 3, 6, and 9 months compared to WT control (Figures 5A,B). Immunoblotting show that the m6A methyltransferase Mettl3 also increased in the APPNL-G-F, MAPTP301S and APPNLGF/MAPTP301S compared to WT control at 6 months (Figures 5C,D). However, at 9 months only the MAPTP301S or APPNLGF/MAPTP301S mouse lines showed significant increases in Mettl3 levels (Figures 5C,D). The m6A eraser ALKBH5 showed a small but significant decrease in expression in MAPTP301S and APPNLGF/MAPTP301S mouse compared to WT control at 6 and 9 months (Figures 5E,F). These results demonstrate dysregulation of m6A and enzymes in the m6A pathway in a manner similar to that observed in AD, and suggest that the phenomenon is predominantly driven by MAPTP301S tau pathology.
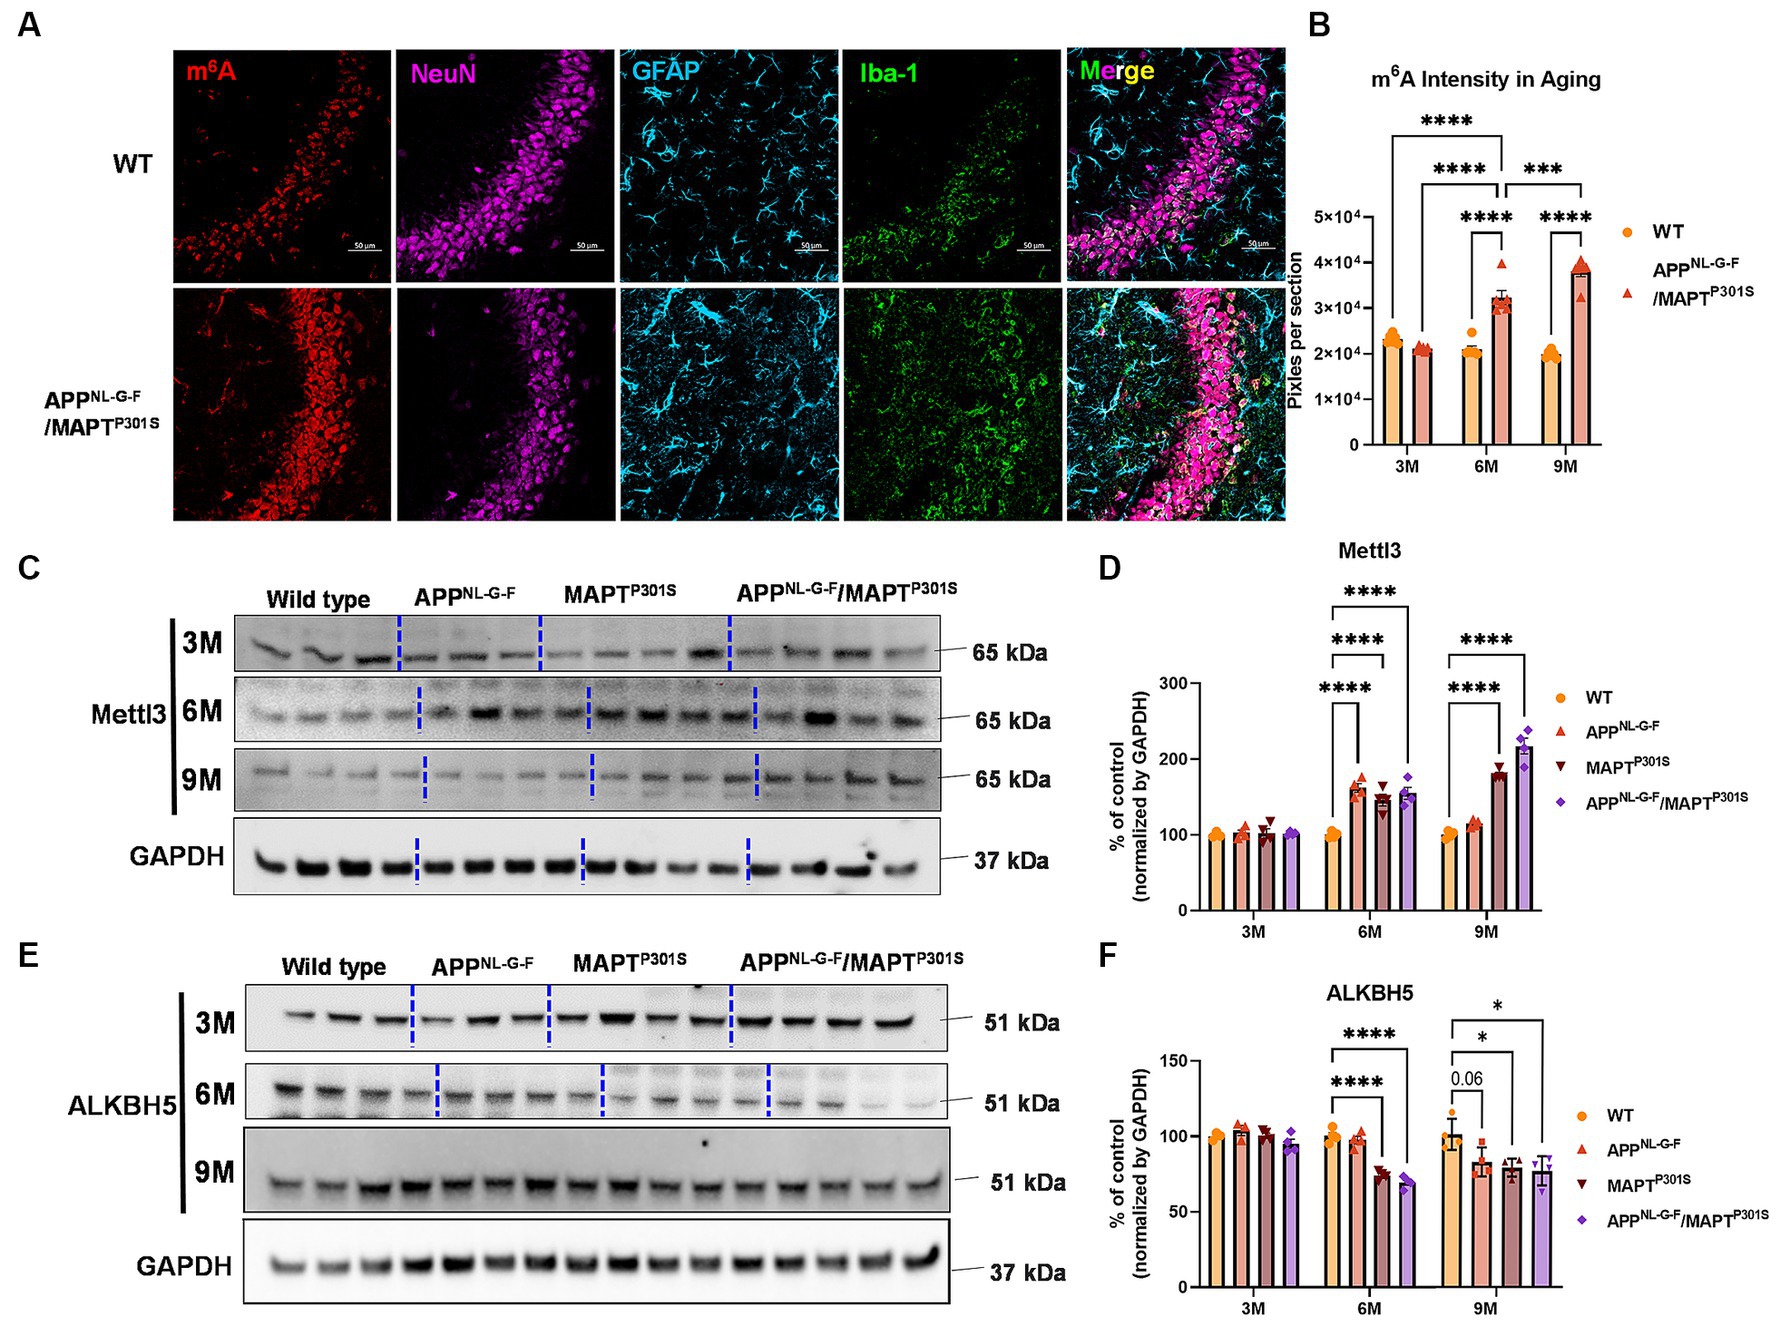
Figure 5. m6A and its regulator enzyme proteins are dysregulated in the APPNLGF/MAPTP301S double transgenic mice in correspondence to the progression of tau pathology. (A) Representative images showed the increased m6A intensity in APPNLGF/MAPTP301S mouse brain at 6 months compared to WT control. Scale bar 50 μm. (B) Quantification of m6A intensity in comparison between APPNLGF/MAPTP301S and WT control during the aging process. N = 6 mice in each group, 3 brain sections were selected from each mouse brain with same position of hippocampus CA3. Data are shown as mean ± SEM. Two-way ANOVA was used for statistics followed by post hoc analysis with Tukey’s multiple comparisons test, ***p < 0.005 and ****p < 0.001. (C,D) Immunoblot analysis of the m6A methyltransferase Mettl3 showed progressively increased intensity in APPNL-G-F /MAPTP301S mouse brain compared to APPNL-G-F or MAPTP301S alone at 3, 6, and 9 months. GAPDH was detected and used as internal control for statistical analysis. N = 4 mice in each group, data was normalized to percentage of WT control and is shown as mean ± SEM. Two-way ANOVA was used followed by post hoc analysis with Tukey’s multiple comparisons test, ****p < 0.001. (E,F) Immunoblot analysis of the m6A RNA demethylase ALKBH5 showed decreased intensity in APPNL-G-F/MAPTP301S mouse brain compared to APPNL-G-F or MAPTP301S alone during the aging process at 3 to 6 and 9 months. Quantification of band intensity showed the decreased ALKBH5 correlated with MAPT pathology in APPNL-G-F/MAPTP301S and MAPTP301S mouse brain. GAPDH was used as internal control for statistical analysis. N = 4 mice in each group, data was normalized to percentage of WT control and is shown as mean ± SEM. Two-way ANOVA was used followed by post hoc analysis with Tukey’s multiple comparisons test, ****p < 0.001.
4 Discussion
The results presented above show that Aβ enhances tau pathologies (phosphorylation, misfolding, and fibrillization) in the context of P301S MAPT over-expression; our interpretation of the results is summarized in Graphical abstract. Neurodegeneration parallels tau pathology, being enhanced in the double transgenic mouse. However, the converse is not true. Aβ pathologies (neuritic plaque, Aβ40 and Aβ42 load) are not greater in the APPNL-G-F/MAPTP301S mouse than in the APPNL-G-F mouse alone. These results are consistent with those recently reported for an APPNL-G-F/MAPTP290S mouse, which is a mouse model in which both human APP and human MAPT are knockins (Huang et al., 2022). The report on the APPNL-G-F/MAPTP290S mouse showed enhancement of MAPT pathology by Aβ but the pathology occurs only in very old mice, and the manuscript did not provide any information on other pathologies, such as inflammation or m6A. We now report that inflammation occurs near Aβ pathology, but the gross distribution of inflammation reflects the gross distribution of tau pathology. In addition, the amount and distribution of m6A parallels MAPT pathology.
Our results for Aβ and MAPT pathologies are generally consistent with prior observations using crosses of APP over-expression mouse lines and MAPT over-expression mouse models (Saul et al., 2013; Chabrier et al., 2014; Heraud et al., 2014; Stancu et al., 2014; Chen et al., 2016; Kang et al., 2021). These over-expression models consistently observe that the presence of Aβ pathology enhances the accumulation of MAPT pathology, neurodegeneration and cognitive loss (Saul et al., 2013; Chabrier et al., 2014; Heraud et al., 2014; Stancu et al., 2014; Chen et al., 2016; Kang et al., 2021). These same studies indicate that the presence of MAPT pathology either does not change the accumulation of Aβ pathology or decreases it (Saul et al., 2013; Chabrier et al., 2014; Heraud et al., 2014; Stancu et al., 2014; Chen et al., 2016; Kang et al., 2021), with only one initial study suggesting that MAPT pathology increases Aβ pathology (Ribe et al., 2005). The enhancement of MAPT pathology in the APPNL-G-F/MAPTP301S mouse is also evident in the distribution of MAPT pathology in the hippocampus. The APPNL-G-F model exhibits modest phospho-MAPT pathology at 6 and 9 months that is evident in the dendritic fields in the CA3 region, while the APPNL-G-F/MAPTP301S cross exhibits MAPT pathology in the dendritic fields as well as in the neuronal soma of CA3 (Figure 4D). The cell body MAPT pathology is particularly important because this pathology colocalizes with markers of the translational stress response, such as stress granule proteins HNRNPA2B1, TIA1, EIF3n and PABP, and also neuronal death (as shown by cleaved caspase 3 and loss of NeuN positive cells) (Ash et al., 2014; Apicco et al., 2018; Maziuk et al., 2018; Apicco et al., 2019; Jiang et al., 2019, 2021). Thus, neurodegeneration appears to be potentiated in the APPNL-G-F/MAPTP301S model.
The distributions of the Aβ and MAPT pathologies observed in the APPNL-G-F/MAPTP301S model are notably distinct. The classic model of AD is based on the Aβ cascade and proposes that aggregated Aβ stimulates inflammation, and that these two factors produce additive injury to elicit neurodegeneration in AD (Scheltens et al., 2021). This injury is further enhanced by aging, vascular damage, metabolic conditions such as Type II Diabetes and genetic risk factors (Scheltens et al., 2021). The direct connection between Aβ and MAPT pathology is poorly understood, as shown by the weak correlation between the distribution of Aβ pathology and the distribution of MAPT pathology in humans (Serrano-Pozo et al., 2011; Perez-Nievas et al., 2013; Scheltens et al., 2021). The distribution of pathology in the APPNL-G-F/MAPTP301S model highlights the poor spatial correlation between these pathologies. The differential distribution of the pathologies might be further accentuated by the strong genetic factors driving the accumulation of MAPT pathology in this model (Graphical abstract). MAPT pathology in the MAPTP301S model accumulates so rapidly because of the strong MAPT expression (the human protein is expressed about 5-fold higher than the endogenous mouse protein) and the protein itself has a mutation that enhances the rate of aggregation (Yoshiyama et al., 2007). These two factors present a strong force driving MAPT aggregation (Graphical abstract). Such a strong genetic push reduces the need for a toxin, such as Aβ, to drive the MAPT pathology, although the accumulation of Aβ in the APPNL-G-F/MAPTP301S model clearly does accelerate the appearance and enhance the amount of MAPT pathology moderately (Graphical abstract). From an anatomical perspective, the disparate distribution of Aβ and MAPT pathology in the APPNL-G-F/MAPTP301S model might also be accentuated by the strong genetic engineering that drives the MAPT pathology, although general toxicity from Aβ accumulation does appear to enhance total MAPT pathology and neurodegeneration in this model.
Increasing evidence points to a key role for inflammation in AD. Many AD-linked genes appear to enhance disease risk by affecting the biology of microglia. For instance, TREM2 is one of the strongest risk factors for AD, and evidence suggests that TREM2 acts to recognize Aβ pathology and direct microglial responses toward the pathology (Guerreiro et al., 2013; Zhou et al., 2020). The strong impact of Aβ on inflammation is also evident in the APPNL-G-F/MAPTP301S model. Inflammatory cells are readily evident in the area around Aβ plaques (Figure 3A). These microglia were more abundant and showed greater ramifications than in the P301S MAPT model. However, it is important to note that microglia do respond to MAPT pathology, Iba-1 reactivity was increased in the P301S MAPT model, but not to the same level as observed in the APPNL-G-F or APPNL-G-F/MAPTP301S model. The inflammatory responses (Figure 3) are interesting when compared to the neurodegenerative responses (Figure 4). As mentioned, inflammatory responses are higher for the APPNL-G-F than the MAPTP301S or the APPNL-G-F/MAPTP301S models. However, neurodegeneration is greater for the APPNL-G-F/MAPTP301S model that the APPNL-G-F or MAPTP301S models. The differential sensitivities of inflammation and neurodegeneration suggest that MAPT is a stronger driver of neurodegeneration than is inflammation in this animal model (Graphical abstract). Thus, while the “Disease Associated Microglial” phenotype is strongly associated with disease and might be an important driver of disease in humans, our results suggest that in the APPNL-G-F/MAPTP301S mouse model MAPT pathology is a stronger driver of neurodegeneration than inflammation. These results are also consistent with published work indicating that Aβ pathology strongly stimulates the “Disease Associated Microglial” phenotype while MAPT pathology elicits microglial responses exhibiting weaker cytokine production (Paolicelli et al., 2022).
The increases observed for m6A parallel those reported by our group previously (Jiang L. et al., 2021). Other groups have also observed that m6A accumulates in models of tauopathy, as well as in other diseases with intracellular aggregates, including ALS and Huntington’s disease (McMillan et al., 2023; Nguyen et al., 2023; Atrian et al., 2024). Interestingly, m6A does not appear to accumulate in models of Aβ amyloidosis, which accumulate aggregates extracellularly (Han et al., 2020). These models develop little intracellular MAPT pathology, nor other types of neuronal protein aggregates (Oakley et al., 2006). Mouse MAPT has only 3 repeats and a much lower tendency to aggregate; since aggregated MAPT is thought to mediate Aβ induced degeneration, the absence of MAPT pathology also might explain the low levels of neurodegeneration observed in APP mouse models (Oakley et al., 2006). In the current study, increases in m6A were observed most prominently in neurons, and that levels of m6A correlated with levels of MAPT pathology. This finding is consistent with the observation that MAPT pathology co-localizes with the RNA binding protein, HNRNPA2B1, which functions as an indirect m6A reader. The increases in m6A are also consistent with the observed increase in the m6A writer, METTL3, and decrease in m6A eraser, ALKBH5 (Tong et al., 2018).
Our study is designed to probe the link between m6A, MAPT and Aβ. Thus, the results presented above in Figure 5 directly compare m6A levels in the context of MAPT pathology, Aβ pathology and combined MAPT and Aβ pathology. The results are clear in that m6A levels (as determined by immunohistochemistry with the anti- m6A antibody) follow MAPT pathology (Graphical abstract). Our prior work shows that oligomeric MAPT (which is highly phosphorylated) forms a complex with m6A and the m6A reader HNRNPA2B1 (Jiang L. et al., 2021). Multiple groups also have shown that MAPT functions in part to facilitate the integrated stress response and formation of stress granules, as well as to regulate ribosomal function. m6A is known to accumulate in the cytoplasm in response to stress, but the function of cytoplasmic m6A remains to be clearly delineated (Meier et al., 2016; Briggs et al., 2017; Koren et al., 2019; Ries et al., 2019; Wolozin and Ivanov, 2019; Fu and Zhuang, 2020). The studies in this manuscript indicate that m6A responds to MAPT rather than Aβ pathology, although the functions of cytoplasmic m6A remains to be determined.
Use of an anti-m6A antibody has limitations. The first consideration is specificity. Antibodies against m6A also recognize demethylated adenosine, m6Am. This modification constitutes 2–10% of total m6A detected in tissues, with brain being on the lower end of the abundance (Linder et al., 2015). Interestingly, m6Am also non-enzymatically converts to m6A, so the biological impact of m6Am is currently ambiguous (Linder et al., 2015; Flamand et al., 2023). A second consideration is the nature of the RNA species showing the increase. The m6A modification occurs in all types of RNA, although it has the lowest abundant in tRNA (Linder et al., 2015; Flamand et al., 2023). Use of the m6A antibody does not provide insight into methylation of individual RNA molecules. m6A RNAseq approaches are required to provide mechanistic understanding of the changes in methylation and to identify specific molecules (e.g., mRNA transcripts) whose methylation impacts on disease.
Our studies also provide insight into potential mechanisms regulating m6A in disease. The increases in m6A observed correlate with MAPT pathology are show a corresponding association with increased levels of METTL3 and reduced levels of ALKBH5, which are the enzymes that, respectively, add and remove m6A from mRNA. More writing combined with reduced erasure leads to increased levels of m6A. Although changes in m6A were most evident in neurons, the results in Figure 5A show that some astrocytes and microglia also exhibited strong increases in m6A in the APPNL-G-F/MAPTP301S model. Such results are consistent with emerging studies showing that m6A regulates inflammation, macrophages and also astrocytosis (Cockova et al., 2021; Yi et al., 2021; Sun Z. et al., 2022; Sun J. et al., 2022; Wang et al., 2022). Such findings raise the possibility that m6A modulation might also be applied towards regulation of inflammation in AD; indeed a recent study observed that conditional knockout of METTL3 in microglia attenuated inflammation and Aβ accumulation in a mouse model based on Aβ injection (Yin et al., 2023).
Another final important consideration is the type of AD model. Total m6A levels were also reported in a previous manuscript examining m6A in an AD model utilizing over-expression of only APP, which is a model that exhibits Aβ accumulation without corresponding MAPT pathology (Han et al., 2020). Data from this manuscript suggest that the absence of MAPT pathology in this model produced a corresponding absence of m6A accumulation (Han et al., 2020).
5 Conclusion
The field is increasingly moving towards use of KI models. The APPNL-G-F/MAPTP301S model described in this manuscript takes advantage of the APPNL-G-F KI line, but utilizes the human MAPTP301S line in order to achieve robust MAPT pathology. Our results show that this model provides an appealing alternative to the double APPNL-G-F × MAPT KI model, which develop both MAPT pathologies very slowly (Saito et al., 2019). The current APPNL-G-F/MAPTP301S model thus provides a useful compromise. This model exhibits strong Aβ accumulation and strong inflammation, while avoiding artifacts associated with APP or presenilin over-expression. The APPNL-G-F/MAPTP301S model also possesses the benefits arising from strong expression of human MAPT with the resulting rapid development of robust MAPT pathology, strong m6A accumulation and, importantly, significant neurodegeneration.
Data availability statement
The raw data supporting the conclusions of this article will be made available by the authors, without undue reservation.
Ethics statement
The animal studies were approved by Boston University Institutional Animal Care and Use Committee. The studies were conducted in accordance with the local legislation and institutional requirements.
Author contributions
LJ: Conceptualization, Formal analysis, Methodology, Writing – original draft, Writing – review & editing, Data curation, Investigation, Validation. RR: Investigation, Methodology, Writing – review & editing. MW: Investigation, Methodology, Writing – review & editing. LZ: Investigation, Methodology, Writing – review & editing. CW: Formal analysis, Investigation, Methodology, Writing – review & editing. JL: Formal analysis, Writing – review & editing. ZW: Formal analysis, Writing – review & editing. AK: Investigation, Writing – review & editing. MJ: Investigation, Writing – review & editing. AO: Formal analysis, Investigation, Methodology, Writing – review & editing. LD: Investigation, Methodology, Writing – review & editing. JS: Investigation, Writing – review & editing. GS: Investigation, Writing – review & editing. SR: Investigation, Writing – review & editing. CK: Formal analysis, Writing – review & editing. SD: Investigation, Writing – review & editing. PD: Conceptualization, Formal analysis, Writing – review & editing. BN: Formal analysis, Writing – review & editing. WX: Writing – review & editing. TSait: Resources, Writing – review & editing. TSaid: Resources, Writing – review & editing. BW: Conceptualization, Formal analysis, Funding acquisition, Methodology, Project administration, Resources, Supervision, Writing – original draft, Writing – review & editing.
Funding
The author(s) declare financial support was received for the research, authorship, and/or publication of this article. BW was supported by NIH (AG050471, R01AG080810, AG056318, AG064932, AG061706, and UO1AG072577) and the BrightFocus Foundation. SR was supported by JSPS Kakenhi 20KK0338.
Conflict of interest
CK and BN are employed by LifeCanvas Technologies. BW is co-founder and Chief Scientific Officer for Aquinnah Pharmaceuticals Inc.
The remaining authors declare that the research was conducted in the absence of any commercial or financial relationships that could be construed as a potential conflict of interest.
Publisher’s note
All claims expressed in this article are solely those of the authors and do not necessarily represent those of their affiliated organizations, or those of the publisher, the editors and the reviewers. Any product that may be evaluated in this article, or claim that may be made by its manufacturer, is not guaranteed or endorsed by the publisher.
Supplementary material
The Supplementary material for this article can be found online at: https://www.frontiersin.org/articles/10.3389/fnins.2024.1372297/full#supplementary-material
References
Afagh, A., Cummings, B. J., Cribbs, D. H., Cotman, C. W., and Tenner, A. J. (1996). Localization and cell association of C1q in Alzheimer’s disease brain. Exp. Neurol. 138, 22–32. doi: 10.1006/exnr.1996.0043
Apicco, D. J., Ash, P. E. A., Maziuk, B., LeBlang, C., Medalla, M., Al Abdullatif, A., et al. (2018). Reducing the RNA binding protein TIA1 protects against tau-mediated neurodegeneration in vivo. Nat. Neurosci. 21, 72–80. doi: 10.1038/s41593-017-0022-z
Apicco, D. J., Zhang, C., Maziuk, B., Jiang, L., Ballance, H. I., Boudeau, S., et al. (2019). Dysregulation of RNA splicing in tauopathies. Cell Rep. 29, 4377–4388.e4. doi: 10.1016/j.celrep.2019.11.093
Ash, P. E., Vanderweyde, T. E., Youmans, K. L., Apicco, D. J., and Wolozin, B. (2014). Pathological stress granules in Alzheimer’s disease. Brain Res. 1584, 52–58. doi: 10.1016/j.brainres.2014.05.052
Ashton, N. J., Janelidze, S., Mattsson-Carlgren, N., Binette, A. P., Strandberg, O., Brum, W. S., et al. (2022). Differential roles of Aβ42/40, p-tau231 and p-tau217 for Alzheimer’s trial selection and disease monitoring. Nat. Med. 28, 2555–2562. doi: 10.1038/s41591-022-02074-w
Atrian, F., Ramirez, P., De Mange, J., Marquez, M., Gonzalez, E. M., Minaya, M., et al. (2024), m6A-dependent circular RNA formation mediates tau-induced neurotoxicity. bioRxiv. Available at: https://doi.org/10.1101/2024.01.25.577211. [Epub ahead of preprint]
Balducci, C., and Forloni, G. (2011). APP transgenic mice: their use and limitations. NeuroMolecular Med. 13, 117–137. doi: 10.1007/s12017-010-8141-7
Bathina, S., and Das, U. N. (2015). Brain-derived neurotrophic factor and its clinical implications. Arch. Med. Sci. 11, 1164–1178. doi: 10.5114/aoms.2015.56342
Briggs, D. I., Defensor, E., Memar Ardestani, P., Yi, B., Halpain, M., Seabrook, G., et al. (2017). Role of endoplasmic reticulum stress in learning and memory impairment and Alzheimer’s disease-like neuropathology in the PS19 and APPSwe mouse models of tauopathy and amyloidosis. eNeuro 4:ENEURO.0025-17. doi: 10.1523/ENEURO.0025-17.2017
Castillo-Carranza, D. L., Sengupta, U., Guerrero-Munoz, M. J., Lasagna-Reeves, C. A., Gerson, J. E., Singh, G., et al. (2014). Passive immunization with tau oligomer monoclonal antibody reverses tauopathy phenotypes without affecting hyperphosphorylated neurofibrillary tangles. J. Neurosci. 34, 4260–4272. doi: 10.1523/JNEUROSCI.3192-13.2014
Chabrier, M. A., Cheng, D., Castello, N. A., Green, K. N., and LaFerla, F. M. (2014). Synergistic effects of amyloid-beta and wild-type human tau on dendritic spine loss in a floxed double transgenic model of Alzheimer’s disease. Neurobiol. Dis. 64, 107–117. doi: 10.1016/j.nbd.2014.01.007
Chen, W., Abud, E. A., Yeung, S. T., Lakatos, A., Nassi, T., Wang, J., et al. (2016). Increased tauopathy drives microglia-mediated clearance of beta-amyloid. Acta Neuropathol. Commun. 4:63. doi: 10.1186/s40478-016-0336-1
Cockova, Z., Honc, O., Telensky, P., Olsen, M. J., and Novotny, J. (2021). Streptozotocin-induced astrocyte mitochondrial dysfunction is ameliorated by FTO inhibitor MO-I-500. ACS Chem. Neurosci. 12, 3818–3828. doi: 10.1021/acschemneuro.1c00063
Costa, E. C., Silva, D. N., Moreira, A. F., and Correia, I. J. (2019). Optical clearing methods: an overview of the techniques used for the imaging of 3D spheroids. Biotechnol. Bioeng. 116, 2742–2763. doi: 10.1002/bit.27105
Deng, Y., Zhu, H., Xiao, L., Liu, C., Liu, Y. L., and Gao, W. (2021). Identification of the function and mechanism of m6A reader IGF2BP2 in Alzheimer’s disease. Aging 13, 24086–24100. doi: 10.18632/aging.203652
Eckermann, K., Mocanu, M. M., Khlistunova, I., Biernat, J., Nissen, A., Hofmann, A., et al. (2007). The beta-propensity of tau determines aggregation and synaptic loss in inducible mouse models of tauopathy. J. Biol. Chem. 282, 31755–31765. doi: 10.1074/jbc.M705282200
Flamand, M. N., Tegowski, M., and Meyer, K. D. (2023). The proteins of mRNA modification: writers, readers, and erasers. Annu. Rev. Biochem. 92, 145–173. doi: 10.1146/annurev-biochem-052521-035330
Fu, Y., and Zhuang, X. (2020). m6A-binding YTHDF proteins promote stress granule formation. Nat. Chem. Biol. 16, 955–963. doi: 10.1038/s41589-020-0524-y
Guerreiro, R., Wojtas, A., Bras, J., Carrasquillo, M., Rogaeva, E., Majounie, E., et al. (2013). Alzheimer genetic analysis, TREM2 variants in Alzheimer’s disease. N. Engl. J. Med. 368, 117–127. doi: 10.1056/NEJMoa1211851
Han, M., Liu, Z., Xu, Y., Liu, X., Wang, D., Li, F., et al. (2020). Abnormality of m6A mRNA methylation is involved in Alzheimer’s disease. Front. Neurosci. 14:98. doi: 10.3389/fnins.2020.00098
Hansen, D. V., Hanson, J. E., and Sheng, M. (2018). Microglia in Alzheimer’s disease. J. Cell Biol. 217, 459–472. doi: 10.1083/jcb.201709069
Heraud, C., Goufak, D., Ando, K., Leroy, K., Suain, V., Yilmaz, Z., et al. (2014). Increased misfolding and truncation of tau in APP/PS1/tau transgenic mice compared to mutant tau mice. Neurobiol. Dis. 62, 100–112. doi: 10.1016/j.nbd.2013.09.010
Huang, H., Camats-Perna, J., Medeiros, R., Anggono, V., and Widagdo, J. (2020). Altered expression of the m6A methyltransferase METTL3 in Alzheimer’s disease. eNeuro 7:ENEURO.0125-20.2020. doi: 10.1523/ENEURO.0125-20.2020
Huang, M., Macdonald, J., Lavenir, I., Chen, R., Craxton, M., Slavik-Smith, E., et al. (2022). Increase in tau pathology in P290S Mapt knock-in mice crossed with AppNL-G-F mice. eNeuro 9:ENEURO.0247-22.2022. doi: 10.1523/ENEURO.0247-22.2022
Hutton, M., Lewis, J., Dickson, D., Yen, S. H., and McGowan, E. (2001). Analysis of tauopathies with transgenic mice. Trends Mol. Med. 7, 467–470. doi: 10.1016/S1471-4914(01)02123-2
Islam, A., Saito, T., Saido, T., and Ali, A. B. (2023). Presubiculum principal cells are preserved from degeneration in knock-in APP/TAU mouse models of Alzheimer’s disease. Semin. Cell Dev. Biol. 139, 55–72. doi: 10.1016/j.semcdb.2022.03.001
Jiang, L., Ash, P. E. A., Maziuk, B. F., Ballance, H. I., Boudeau, S., Abdullatif, A. A., et al. (2019). TIA1 regulates the generation and response to toxic tau oligomers. Acta Neuropathol. 137, 259–277. doi: 10.1007/s00401-018-1937-5
Jiang, L., Lin, W., Zhang, C., Ash, P. E. A., Verma, M., Kwan, J., et al. (2021). Interaction of tau with HNRNPA2B1 and N6-methyladenosine RNA mediates the progression of tauopathy. Mol. Cell 81, 4209–4227.e12. doi: 10.1016/j.molcel.2021.07.038
Jiang, X., Liu, B., Nie, Z., Duan, L., Xiong, Q., Jin, Z., et al. (2021). The role of m6A modification in the biological functions and diseases. Signal Transduct. Target. Ther. 6:74. doi: 10.1038/s41392-020-00450-x
Jiang, L., Zhao, J., Cheng, J. X., and Wolozin, B. (2020). Tau oligomers and fibrils exhibit differential patterns of seeding and association with RNA binding proteins. Front. Neurol. 11:579434. doi: 10.3389/fneur.2020.579434
Kang, S., Kim, J., and Chang, K. A. (2021). Spatial memory deficiency early in 6×Tg Alzheimer’s disease mouse model. Sci. Rep. 11:1334. doi: 10.1038/s41598-020-79344-5
Kim, S. Y., Cho, J. H., Murray, E., Bakh, N., Choi, H., Ohn, K., et al. (2015). Stochastic electrotransport selectively enhances the transport of highly electromobile molecules. Proc. Natl. Acad. Sci. U.S.A. 112, E6274–E6283. doi: 10.1073/pnas.1510133112
Koren, S. A., Hamm, M. J., Meier, S. E., Weiss, B. E., Nation, G. K., Chishti, E. A., et al. (2019). Tau drives translational selectivity by interacting with ribosomal proteins. Acta Neuropathol. 137, 571–583. doi: 10.1007/s00401-019-01970-9
Lasagna-Reeves, C. A., Castillo-Carranza, D. L., Sengupta, U., Clos, A. L., Jackson, G. R., and Kayed, R. (2011). Tau oligomers impair memory and induce synaptic and mitochondrial dysfunction in wild-type mice. Mol. Neurodegener. 6:39. doi: 10.1186/1750-1326-6-39
Leng, F., and Edison, P. (2021). Neuroinflammation and microglial activation in Alzheimer disease: where do we go from here? Nat. Rev. Neurol. 17, 157–172. doi: 10.1038/s41582-020-00435-y
Lewis, J., McGowan, E., Rockwood, J., Melrose, H., Nacharaju, P., Van Slegtenhorst, M., et al. (2000). Neurofibrillary tangles, amyotrophy and progressive motor disturbance in mice expressing mutant (P301L) tau protein. Nat. Genet. 25, 402–405. doi: 10.1038/78078
Linder, B., Grozhik, A. V., Olarerin-George, A. O., Meydan, C., Mason, C. E., and Jaffrey, S. R. (2015). Single-nucleotide-resolution mapping of m6A and m6Am throughout the transcriptome. Nat. Methods 12, 767–772. doi: 10.1038/nmeth.3453
Maziuk, B. F., Apicco, D. J., Cruz, A. L., Jiang, L., Ash, P. E. A., da Rocha, E. L., et al. (2018). RNA binding proteins co-localize with small tau inclusions in tauopathy. Acta Neuropathol. Commun. 6:71. doi: 10.1186/s40478-018-0574-5
McMillan, M., Gomez, N., Hsieh, C., Bekier, M., Li, X., Miguez, R., et al. (2023). RNA methylation influences TDP43 binding and disease pathogenesis in models of amyotrophic lateral sclerosis and frontotemporal dementia. Mol. Cell 83, 219–236.e7. doi: 10.1016/j.molcel.2022.12.019
Meier, S., Bell, M., Lyons, D. N., Rodriguez-Rivera, J., Ingram, A., Fontaine, S. N., et al. (2016). Pathological tau promotes neuronal damage by impairing ribosomal function and decreasing protein synthesis. J. Neurosci. 36, 1001–1007. doi: 10.1523/JNEUROSCI.3029-15.2016
Mocanu, M. M., Nissen, A., Eckermann, K., Khlistunova, I., Biernat, J., Drexler, D., et al. (2008). The potential for beta-structure in the repeat domain of tau protein determines aggregation, synaptic decay, neuronal loss, and coassembly with endogenous tau in inducible mouse models of tauopathy. J. Neurosci. 28, 737–748. doi: 10.1523/JNEUROSCI.2824-07.2008
Murray, E., Cho, J. H., Goodwin, D., Ku, T., Swaney, J., Kim, S. Y., et al. (2015). Simple, scalable proteomic imaging for high-dimensional profiling of intact systems. Cell 163, 1500–1514. doi: 10.1016/j.cell.2015.11.025
Nguyen, T. B., Miramontes, R., Chillon-Marinas, C., Maimon, R., Vazquez-Sanchez, S., Lau, A. L., et al. (2023) Aberrant splicing in Huntington’s disease via disrupted TDP-43 activity accompanied by altered m6A RNA modification. bioRxiv. Available at: https://doi.org/10.1101/2023.10.31.565004. [Epub ahead of preprint]
Oakley, H., Cole, S. L., Logan, S., Maus, E., Shao, P., Craft, J., et al. (2006). Intraneuronal beta-amyloid aggregates, neurodegeneration, and neuron loss in transgenic mice with five familial Alzheimer’s disease mutations: potential factors in amyloid plaque formation. J. Neurosci. 26, 10129–10140. doi: 10.1523/JNEUROSCI.1202-06.2006
Paolicelli, R. C., Sierra, A., Stevens, B., Tremblay, M. E., Aguzzi, A., Ajami, B., et al. (2022). Microglia states and nomenclature: a field at its crossroads. Neuron 110, 3458–3483. doi: 10.1016/j.neuron.2022.10.020
Park, Y. G., Sohn, C. H., Chen, R., McCue, M., Yun, D. H., Drummond, G. T., et al. (2018). Protection of tissue physicochemical properties using polyfunctional crosslinkers. Nat. Biotechnol. 37, 73–83. doi: 10.1038/nbt.4281
Perez-Nievas, B. G., Stein, T. D., Tai, H. C., Dols-Icardo, O., Scotton, T. C., Barroeta-Espar, I., et al. (2013). Dissecting phenotypic traits linked to human resilience to Alzheimer’s pathology. Brain 136, 2510–2526. doi: 10.1093/brain/awt171
Polydoro, M., Acker, C. M., Duff, K., Castillo, P. E., and Davies, P. (2009). Age-dependent impairment of cognitive and synaptic function in the htau mouse model of tau pathology. J. Neurosci. 29, 10741–10749. doi: 10.1523/JNEUROSCI.1065-09.2009
Pooler, A. M., Polydoro, M., Maury, E. A., Nicholls, S. B., Reddy, S. M., Wegmann, S., et al. (2015). Amyloid accelerates tau propagation and toxicity in a model of early Alzheimer’s disease. Acta Neuropathol. Commun. 3:14. doi: 10.1186/s40478-015-0199-x
Ramsden, M., Kotilinek, L., Forster, C., Paulson, J., McGowan, E., Santa Cruz, K., et al. (2005). Age-dependent neurofibrillary tangle formation, neuron loss, and memory impairment in a mouse model of human tauopathy (P301L). J. Neurosci. 25, 10637–10647. doi: 10.1523/JNEUROSCI.3279-05.2005
Ribe, E. M., Perez, M., Puig, B., Gich, I., Lim, F., Cuadrado, M., et al. (2005). Accelerated amyloid deposition, neurofibrillary degeneration and neuronal loss in double mutant APP/tau transgenic mice. Neurobiol. Dis. 20, 814–822. doi: 10.1016/j.nbd.2005.05.027
Ries, R. J., Zaccara, S., Klein, P., Olarerin-George, A., Namkoong, S., Pickering, B. F., et al. (2019). m6A enhances the phase separation potential of mRNA. Nature 571, 424–428. doi: 10.1038/s41586-019-1374-1
Rupprecht, C., Rupprecht, R., and Rammes, G. (2021). C1q, a small molecule with high impact on brain development: putative role for aging processes and the occurrence of Alzheimer’s disease. Eur. Arch. Psychiatry Clin. Neurosci. 271, 809–812. doi: 10.1007/s00406-021-01273-9
Saito, T., Matsuba, Y., Mihira, N., Takano, J., Nilsson, P., Itohara, S., et al. (2014). Single App knock-in mouse models of Alzheimer’s disease. Nat. Neurosci. 17, 661–663. doi: 10.1038/nn.3697
Saito, T., Mihira, N., Matsuba, Y., Sasaguri, H., Hashimoto, S., Narasimhan, S., et al. (2019). Humanization of the entire murine MAPT gene provides a murine model of pathological human tau propagation. J. Biol. Chem. 294, 12754–12765. doi: 10.1074/jbc.RA119.009487
Sakakibara, Y., Sekiya, M., Saito, T., Saido, T. C., and Iijima, K. M. (2018). Cognitive and emotional alterations in App knock-in mouse models of Aβ amyloidosis. BMC Neurosci. 19:46. doi: 10.1186/s12868-018-0446-8
Sasaguri, H., Hashimoto, S., Watamura, N., Sato, K., Takamura, R., Nagata, K., et al. (2022). Recent advances in the modeling of Alzheimer’s disease. Front. Neurosci. 16:807473. doi: 10.3389/fnins.2022.807473
Sasaguri, H., Nilsson, P., Hashimoto, S., Nagata, K., Saito, T., De Strooper, B., et al. (2017). APP mouse models for Alzheimer’s disease preclinical studies. EMBO J. 36, 2473–2487. doi: 10.15252/embj.201797397
Saul, A., Sprenger, F., Bayer, T. A., and Wirths, O. (2013). Accelerated tau pathology with synaptic and neuronal loss in a novel triple transgenic mouse model of Alzheimer’s disease. Neurobiol. Aging 34, 2564–2573. doi: 10.1016/j.neurobiolaging.2013.05.003
Scheltens, P., De Strooper, B., Kivipelto, M., Holstege, H., Chetelat, G., Teunissen, C. E., et al. (2021). Alzheimer’s disease. Lancet 397, 1577–1590. doi: 10.1016/S0140-6736(20)32205-4
Sengupta, U., Carretero-Murillo, M., and Kayed, R. (2018). Preparation and characterization of tau oligomer strains. Methods Mol. Biol. 1779, 113–146. doi: 10.1007/978-1-4939-7816-8_9
Serrano-Pozo, A., Frosch, M. P., Masliah, E., and Hyman, B. T. (2011). Neuropathological alterations in Alzheimer disease. Cold Spring Harb. Perspect. Med. 1:a006189. doi: 10.1101/cshperspect.a006189
Stancu, I. C., Ris, L., Vasconcelos, B., Marinangeli, C., Goeminne, L., Laporte, V., et al. (2014). Tauopathy contributes to synaptic and cognitive deficits in a murine model for Alzheimer’s disease. FASEB J. 28, 2620–2631. doi: 10.1096/fj.13-246702
Stathas, S., Alvarez, V. E., Xia, W., Nicks, R., Meng, G., Daley, S., et al. (2022). Tau phosphorylation sites serine202 and serine396 are differently altered in chronic traumatic encephalopathy and Alzheimer’s disease. Alzheimers Dement. 18, 1511–1522. doi: 10.1002/alz.12502
Stein, T. D., Montenigro, P. H., Alvarez, V. E., Xia, W., Crary, J. F., Tripodis, Y., et al. (2015). Beta-amyloid deposition in chronic traumatic encephalopathy. Acta Neuropathol. 130, 21–34. doi: 10.1007/s00401-015-1435-y
Sun, Z., Chen, W., Wang, Z., Wang, S., Zan, J., Zheng, L., et al. (2022). Matr3 reshapes m6A modification complex to alleviate macrophage inflammation during atherosclerosis. Clin. Immunol. 245:109176. doi: 10.1016/j.clim.2022.109176
Sun, J., Liu, G., Chen, R., Zhou, J., Chen, T., Cheng, Y., et al. (2022). PARP1 is upregulated by hyperglycemia via N6-methyladenosine modification and promotes diabetic retinopathy. Discov. Med. 34, 115–129.
Telser, J., Risch, L., Saely, C. H., Grossmann, K., and Werner, P. (2022). P-tau217 in Alzheimer’s disease. Clin. Chim. Acta 531, 100–111. doi: 10.1016/j.cca.2022.03.018
Tong, J., Flavell, R. A., and Li, H. B. (2018). RNA m6A modification and its function in diseases. Front. Med. 12, 481–489. doi: 10.1007/s11684-018-0654-8
Ueda, H. R., Erturk, A., Chung, K., Gradinaru, V., Chedotal, A., Tomancak, P., et al. (2020). Tissue clearing and its applications in neuroscience. Nat. Rev. Neurosci. 21, 61–79. doi: 10.1038/s41583-019-0250-1
Ulland, T. K., and Colonna, M. (2018). TREM2—a key player in microglial biology and Alzheimer disease. Nat. Rev. Neurol. 14, 667–675. doi: 10.1038/s41582-018-0072-1
van Dyck, C. H., Swanson, C. J., Aisen, P., Bateman, R. J., Chen, C., Gee, M., et al. (2023). Lecanemab in early Alzheimer’s disease. N. Engl. J. Med. 388, 9–21. doi: 10.1056/NEJMoa2212948
Wang, J. N., Wang, F., Ke, J., Li, Z., Xu, C. H., Yang, Q., et al. (2022). Inhibition of METTL3 attenuates renal injury and inflammation by alleviating TAB3 m6A modifications via IGF2BP2-dependent mechanisms. Sci. Transl. Med. 14:eabk2709. doi: 10.1126/scitranslmed.abk2709
Wennstrom, M., Janelidze, S., Nilsson, K. P. R., Netherlands Brain, B., Serrano, G. E., Beach, T. G., et al. (2022). Cellular localization of p-tau217 in brain and its association with p-tau217 plasma levels. Acta Neuropathol. Commun. 10:3. doi: 10.1186/s40478-021-01307-2
Wolozin, B., and Ivanov, P. (2019). Stress granules and neurodegeneration. Nat. Rev. Neurosci. 20, 649–666. doi: 10.1038/s41583-019-0222-5
Xia, W., Yang, T., Shankar, G., Smith, I. M., Shen, Y., Walsh, D. M., et al. (2009). A specific enzyme-linked immunosorbent assay for measuring beta-amyloid protein oligomers in human plasma and brain tissue of patients with Alzheimer disease. Arch. Neurol. 66, 190–199. doi: 10.1001/archneurol.2008.565
Yang, B., Treweek, J. B., Kulkarni, R. P., Deverman, B. E., Chen, C. K., Lubeck, E., et al. (2014). Single-cell phenotyping within transparent intact tissue through whole-body clearing. Cell 158, 945–958. doi: 10.1016/j.cell.2014.07.017
Yi, D., Wang, Q., Zhao, Y., Song, Y., You, H., Wang, J., et al. (2021). Alteration of N6-methyladenosine mRNA methylation in a rat model of cerebral ischemia-reperfusion injury. Front. Neurosci. 15:605654. doi: 10.3389/fnins.2021.605654
Yin, H., Ju, Z., Zheng, M., Zhang, X., Zuo, W., Wang, Y., et al. (2023). Loss of the m6A methyltransferase METTL3 in monocyte-derived macrophages ameliorates Alzheimer’s disease pathology in mice. PLoS Biol. 21:e3002017. doi: 10.1371/journal.pbio.3002017
Yoshiyama, Y., Higuchi, M., Zhang, B., Huang, S. M., Iwata, N., Saido, T. C., et al. (2007). Synapse loss and microglial activation precede tangles in a P301S tauopathy mouse model. Neuron 53, 337–351. doi: 10.1016/j.neuron.2007.01.010
Zhang, X., Yang, S., Han, S., Sun, Y., Han, M., Zheng, X., et al. (2023). Differential methylation of circRNA m6A in an APP/PS1 Alzheimer’s disease mouse model. Mol. Med. Rep. 27:55. doi: 10.3892/mmr.2023.12942
Zhao, F., Xu, Y., Gao, S., Qin, L., Austria, Q., Siedlak, S. L., et al. (2021). METTL3-dependent RNA m6A dysregulation contributes to neurodegeneration in Alzheimer’s disease through aberrant cell cycle events. Mol. Neurodegener. 16:70. doi: 10.1186/s13024-021-00484-x
Keywords: tauopathy, neurodegeneration, RNA binding proteins, tau oligomers, neuropathology, RNA methylation, neuritic plaques, clarity
Citation: Jiang L, Roberts R, Wong M, Zhang L, Webber CJ, Libera J, Wang Z, Kilci A, Jenkins M, Ortiz AR, Dorrian L, Sun J, Sun G, Rashad S, Kornbrek C, Daley SA, Dedon PC, Nguyen B, Xia W, Saito T, Saido TC and Wolozin B (2024) β-amyloid accumulation enhances microtubule associated protein tau pathology in an APPNL-G-F/MAPTP301S mouse model of Alzheimer’s disease. Front. Neurosci. 18:1372297. doi: 10.3389/fnins.2024.1372297
Edited by:
Eva Ramos Alonso, Complutense University of Madrid, SpainReviewed by:
Celia Giulietta Fernandez, Recursion Pharmaceuticals, United StatesTal Nuriel, Columbia University, United States
Copyright © 2024 Jiang, Roberts, Wong, Zhang, Webber, Libera, Wang, Kilci, Jenkins, Ortiz, Dorrian, Sun, Sun, Rashad, Kornbrek, Daley, Dedon, Nguyen, Xia, Saito, Saido and Wolozin. This is an open-access article distributed under the terms of the Creative Commons Attribution License (CC BY). The use, distribution or reproduction in other forums is permitted, provided the original author(s) and the copyright owner(s) are credited and that the original publication in this journal is cited, in accordance with accepted academic practice. No use, distribution or reproduction is permitted which does not comply with these terms.
*Correspondence: Lulu Jiang, wpm5vs@virginia.edu; Benjamin Wolozin, bwolozin@bu.edu