
Segmenting Bitcoin Transactions for Price Movement Prediction

1
Technology, Information Systems and Analytics, Mike Ilitch School of Business, Wayne State University, Detroit, MI 48201, USA
2
Information Systems and Operations Management, Goizueta Business School, Emory University, Atlanta, GA 30322, USA
3
Department of Marketing, McCombs School of Business, The University of Texas at Austin, Austin, TX 78712, USA
4
Department of Information, Risk and Operations Management, McCombs School of Business, The University of Texas at Austin, Austin, TX 78712, USA
*
Author to whom correspondence should be addressed.
J. Risk Financial Manag. 2024, 17(3), 128; https://doi.org/10.3390/jrfm17030128
Submission received: 8 February 2024
/
Revised: 6 March 2024
/
Accepted: 7 March 2024
/
Published: 21 March 2024
(This article belongs to the Special Issue Editorial Board Members’ Collection Series: Journal of Risk and Financial Management)
Abstract
:Cryptocurrencies like Bitcoin have received substantial attention from financial exchanges. Unfortunately, arbitrage-based financial market price prediction models are ineffective for cryptocurrencies. In this paper, we utilize standard machine learning models and publicly available transaction data in blocks to predict the direction of Bitcoin price movement. We illustrate our methodology using data we merged from the Bitcoin blockchain and various online sources. This gave us the Bitcoin transaction history (block IDs, block timestamps, transaction IDs, senders’ addresses, receivers’ addresses, transaction amounts), as well as the market exchange price, for the period from 13 September 2011 to 5 May 2017. We show that segmenting publicly available transactions based on investor typology helps achieve higher prediction accuracy compared to the existing Bitcoin price movement prediction models in the literature. This transaction segmentation highlights the role of investor types in impacting financial markets. Managerially, the segmentation of financial transactions helps us understand the role of financial and cryptocurrency market participants in asset price movements. These findings provide further implications for risk management, financial regulation, and investment strategies in this new era of digital currencies.
1. Introduction
Cryptocurrencies have become an important component in the digital economy and financial markets (Adrian and Mancini-Griffoli 2021), with Bitcoin being the most popular. Bitcoin and blockchain technology are called the key drivers behind the next revolution in the financial industry (Li et al. 2021; Su et al. 2020). Despite Bitcoin’s popularity, explosive growth, and innovation, it is often characterized as a financial bubble (e.g., Geuder et al. 2019; Cheah and Fry 2015). While the supply of Bitcoin is constrained, demand is speculative and causes wide fluctuations in price. Many governmental financial agencies, e.g., the U.S. Securities and Exchange Commission (SEC 2014), have issued investor alerts about Bitcoin due to the high risk associated with its price volatility (Aalborg et al. 2019). Studies of the extreme volatility in Bitcoin prices have also found evidence of both deliberate price manipulation Gandal et al. (2018) and substantial empirical support for the hypothesis that backers of the leading token Tether have the ability, and have possibly used Tether, to prop up the price of Bitcoin (Griffin and Shams 2020). Evidence of such market manipulation raises the specter of naive investors being left at the vagaries of an unregulated market manipulated by sophisticated, malicious actors engaging in deliberate and fraudulent price manipulation (Popper 2018). Investors can be unknowingly victimized without a fundamental pricing method against which to benchmark. It is, therefore, crucial to better understand Bitcoin’s price movement and develop proper investment strategies, risk management, and financial regulation.
Several studies exist in which scholars have studied Bitcoin price movements (see Table 1). While these methods can help predict Bitcoin price movements to some extent, few have investigated the heterogeneous behavior of various investor segments and how investor heterogeneity influences Bitcoin price movement. In contrast, previous studies have shown that different types of investors react differently to stock price movements in the stock market, and this heterogeneity influences stock prices. Whether heterogeneity in investor types exists in the Bitcoin market and how this heterogeneity is related to Bitcoin price movement remains unclear and is one focus of this paper.
In this paper, we investigate investor segments in the Bitcoin market and study the heterogeneity in investment behavior. Based on our findings, we present a novel approach to predict the direction of Bitcoin price movements (up or down). Comparing our proposed approach with those in the extant research indicates the superior predictive power of our approach within a short investment duration. We also propose a typology of Bitcoin investors (i.e., investor segments) which, to the best of our knowledge, is the first attempt at systematically segmenting Bitcoin investors. This segmentation allows us to generate rich insights to help better understand the behaviors and actions of investors participating in Bitcoin markets. This information could also be utilized to better understand the role of investors’ participation in initial coin offerings and the short-term evolution of the coin (Holden and Malani 2022; Lyandres et al. 2022).
This paper is organized as follows. Section 2 reviews the current methods for predicting Bitcoin price movement and the challenges associated with them. Section 3 presents our investor segmentation approach and methodology. Section 4 presents the data analysis and results, and Section 5 interprets the results. Section 6 discusses the conclusions.
2. Neither Fish nor Fowl: A Review of Challenges in Current Predictions of Bitcoin Price Movements
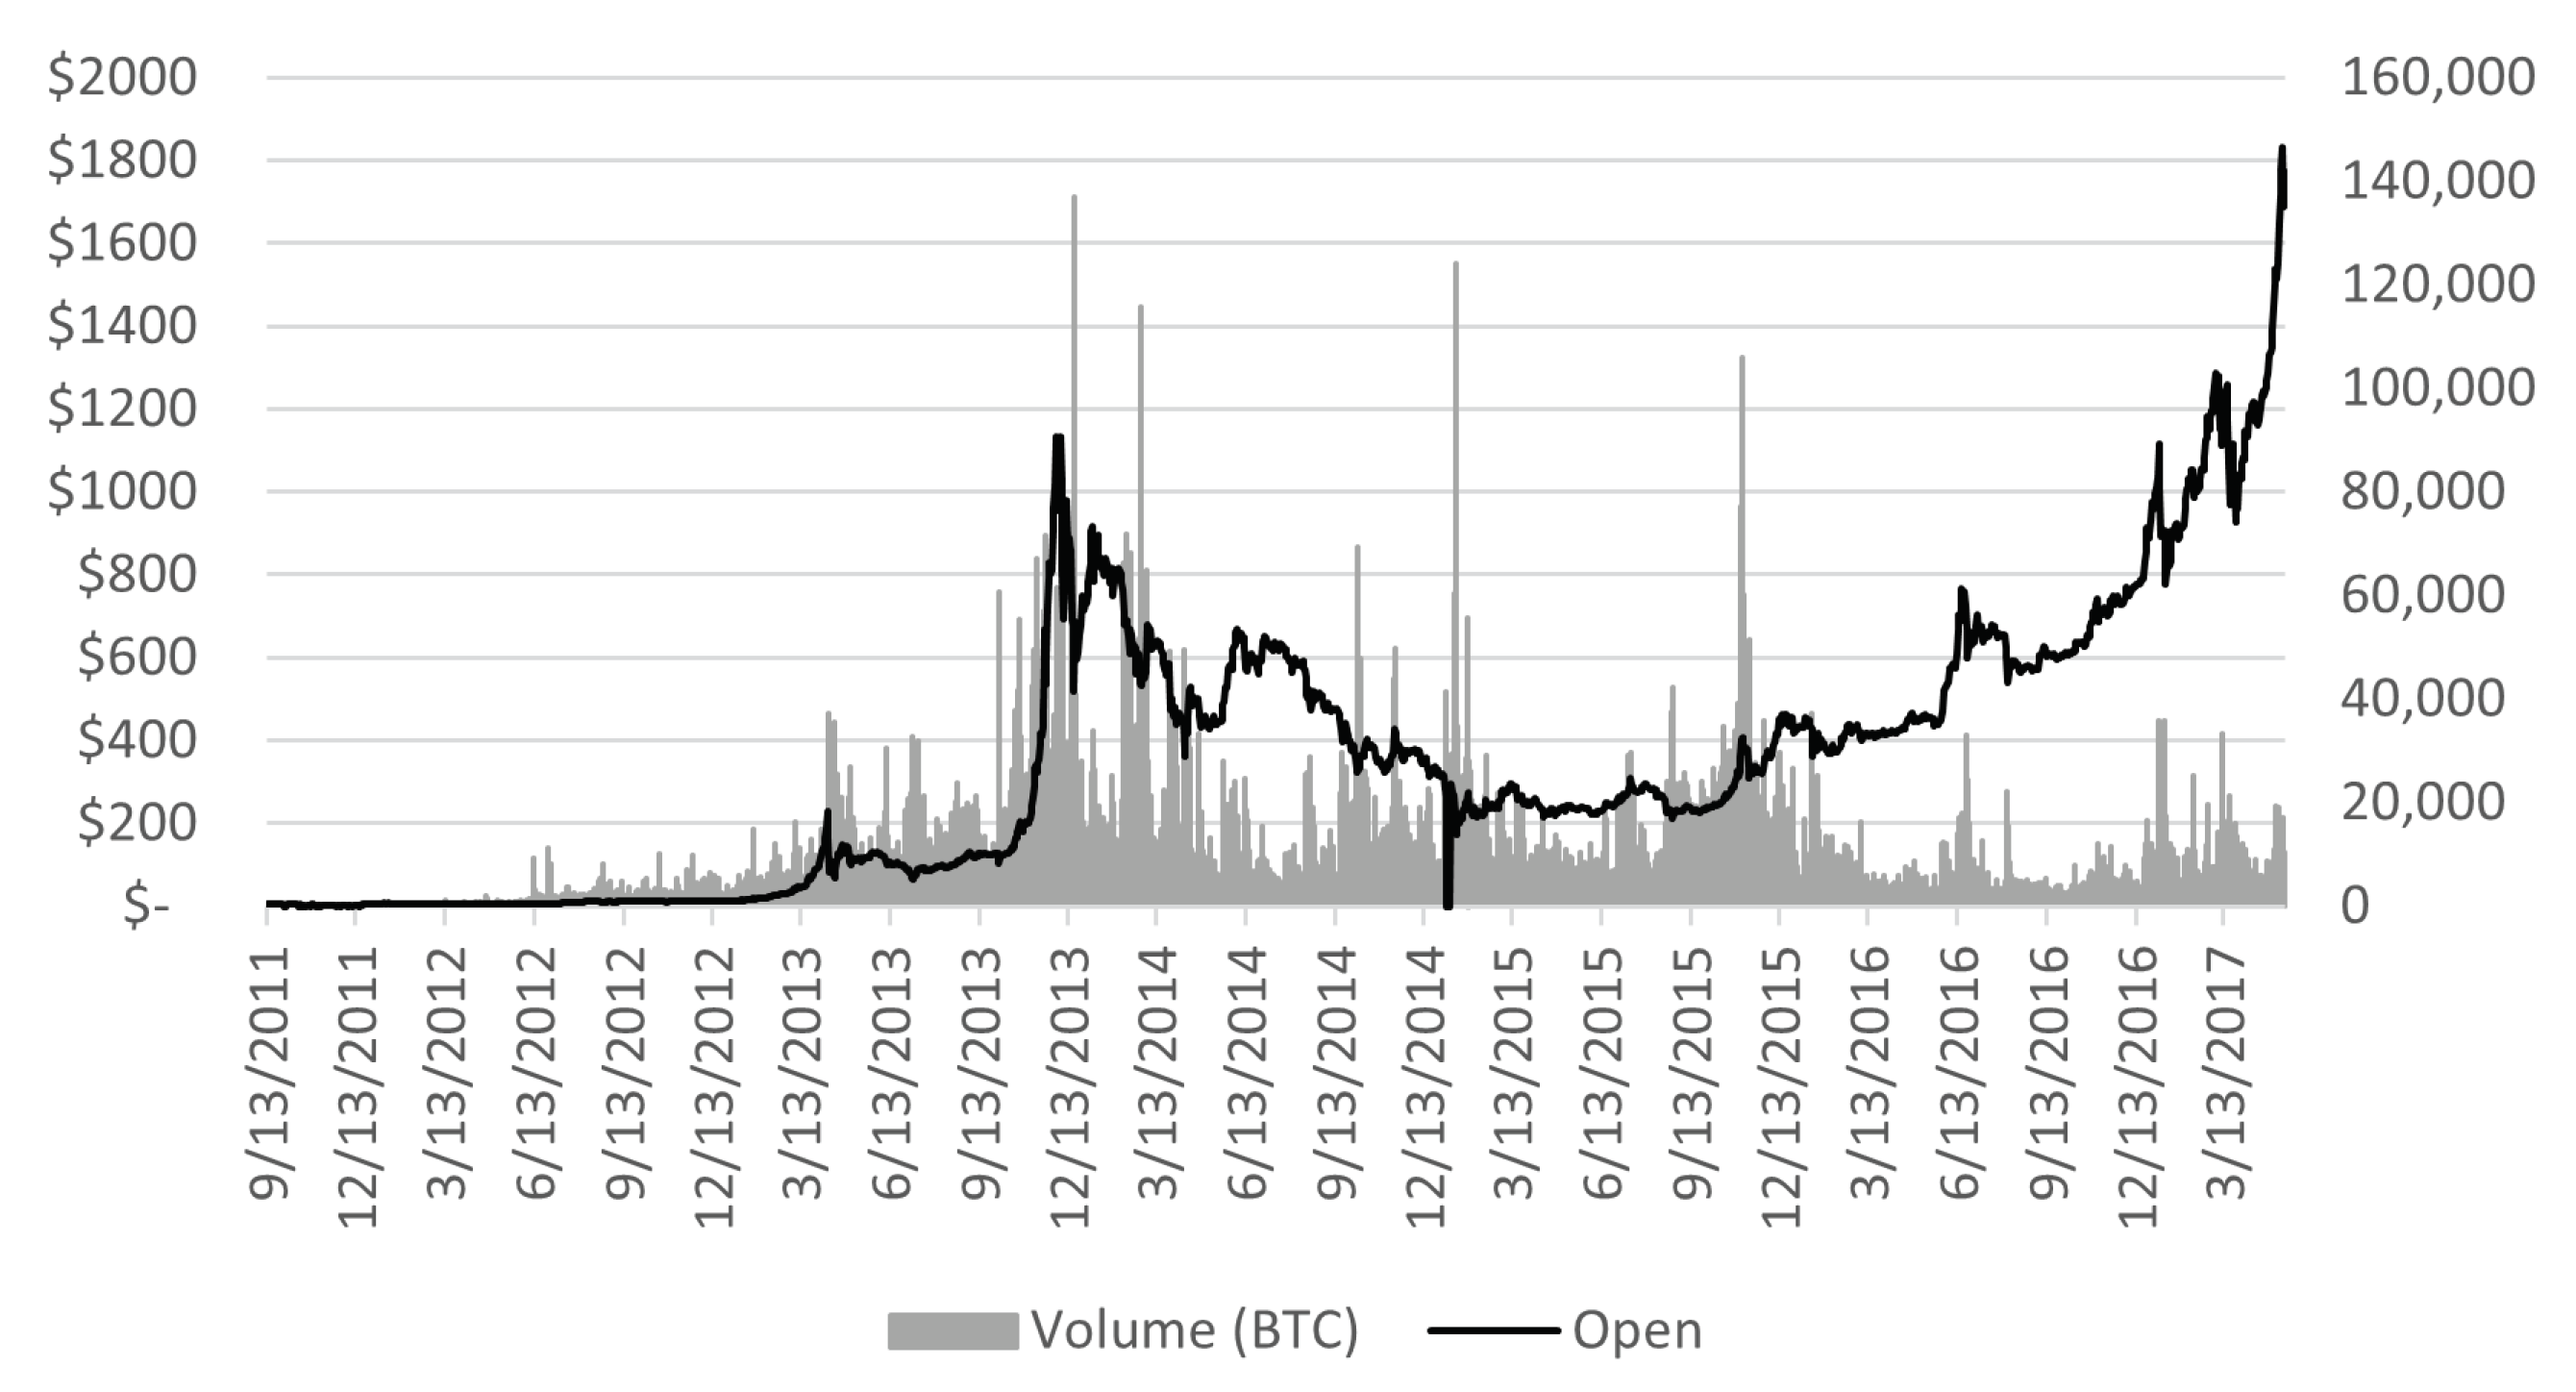
The study of Bitcoin price movements is challenging for several reasons. First, as seen in Figure 1, Bitcoin prices exhibit very high daily volatility, making accurate prediction difficult (McNally et al. 2018; Miller and Kim 2021). Second, Bitcoin speculative assets are “neither fish nor fowl”—they are speculative investments that behave neither like traditional currencies nor usual physical commodities like wheat, oil, etc. (Gronwald 2019). This leads to higher fundamental uncertainties on the part of investors (Abraham et al. 2018). Extant research has shown that Bitcoin price volatility is highest at times when US and European investors are not engaging in the trade of cryptocurrency assets (Dimpfl and Odelli 2020).
Economists generally say that “money” serves three functions: (1) it is a useful medium to facilitate the exchange of one product for another; (2) it should be able to serve as a unit of account so the comparative value or worth of different objects or entities can be measured and compared; and (3) it should provide a vehicle to store value. Currently, at best, Bitcoin only marginally satisfies these functions1. The fact that it can take ten minutes to several hours (or more) to confirm that a Bitcoin transaction is valid makes using Bitcoin very inconvenient and problematic for everyday shopping transactions in daily life. The Lightning Network (LN) was invented in 2016 to allow for faster transaction verification, thereby better facilitating the use of Bitcoin for everyday transactions. The LN also has lower transaction fees. However, the LN comes with its own problems, such as the need to pre-establish a channel between the buyer and seller and show (post) liquidity to guarantee the validity of the transaction when opening an exchange arrangement. This may be problematic for small or infrequent purchases as it ties up resources. The LN also requires more technical skill to navigate.
Despite El Salvador’s adoption of Bitcoin as legal tender, the U.S. Internal Revenue Service considers Bitcoin assets to be property and not a currency for tax purposes (IRS Notice 2014-21, as modified by Notice 2023-34). The U.S. Commodity Futures Trading Commission (CFTC), which historically oversees physical commodity markets and commodity-linked products like derivatives and futures contracts, has classified the intangible Bitcoin asset as a commodity, although it does not derive its value from any physical asset such as gold, oil, etc. Thus, Bitcoin presents problems when used as a unit of exchange for most purposes (Alvarez et al. 2023).
Due to its extreme volatility, Bitcoin also presents problems in being perceived as a unit of account that could provide easy understanding and comparison of the value of goods and services relative to each other. As a store of value, the extreme volatility makes this problematic in the short run, and the intrinsic “financial bubble” aspects of this speculative asset, along with the potential for fraud or manipulation, make long-term storage of value problematic2.
Thus, Bitcoin valuation is “free-floating”3 in the sense that its value is not benchmarked against or tied to other financial assets such as gold or silver. Neither is its value derived from its use as a raw material or intermediary resource in productive enterprises, e.g., rare-earth minerals have value because they are used in the manufacturing of permanent magnets and other high-tech products. Additionally, Bitcoin’s value is not based on interest rates and purchase price parity concepts, which are useful for currency exchange valuation. Furthermore, its value is not associated with production costs, e.g., computation costs and electrical power (Arnosti and Weinberg 2022). Some have argued that Bitcoin has intrinsic value due to its portfolio diversification effect. Whether or not Bitcoin has a diversifying effect on portfolios, as with gold, is not clear. Some have observed diversifying effects (Li et al. 2021) and others have urged caution in using Bitcoin for portfolio diversification (Bakry et al. 2021). Almeida and Gonçalves (2023) provided a literature review of the portfolio diversification literature with respect to Bitcoin.
Consequently, economic theory and/or econometric arbitrage-free pricing methods, familiar for currency and asset pricing in finance, are missing. Finally, the relationships between Bitcoin market price, price volatility, and transaction behaviors are not yet well understood (Aalborg et al. 2019; Kjærland et al. 2018), making theoretical pricing models problematic. Moreover, due to random high price volatility, its use as a “storage of value” is uncertain at best. High volatility generates technical and economic risks for participants, system risks to the Bitcoin ecosystem, and societal risks at large, resembling a signal in high noise (Weaver 2018).
The absence of theoretically justified or arbitrage-based economic pricing models may not mean that predicting Bitcoin prices is futile. To assess the feasibility of obtaining a successful prediction of future prices, the finance concept of “weak form efficiency” is relevant. Applied to asset pricing, the weak-form efficient market hypothesis (EMH) asserts that publicly available information, such as an asset’s price history and volume history, cannot be used to make money in a highly liquid market by successfully predicting the asset’s future price direction because rationally informed investors will immediately incorporate past information into current prices in an unbiased manner. According to this theory, public information is already incorporated into current prices, and future prices become random fluctuations from today’s prices (the random-walk hypothesis). Some literature has tested the null hypothesis of weak-form efficiency for Bitcoin prices, examining whether prices follow a random walk, and has rejected this null hypothesis. Consequently, the EMH is not supported empirically for Bitcoin (e.g., see Bariviera 2017). In his literature review survey on efficiency in the cryptocurrency market, Kyriazis (2019) stated, “It is found that the majority of academic papers provide evidence for the inefficiency of Bitcoin and other digital currencies of primary importance.” Since prices may not follow a random walk, implying there may be dependence on Bitcoin price changes, it is worthwhile to examine whether public data and dependence on prices can be exploited for successful prediction of Bitcoin price change direction (cf., Fischer et al. 2019).
Apart from the EMH financial analysis, there is a burgeoning literature that technically addresses the prediction of Bitcoin price using various statistical and algorithmic methods, rather than methods derived from theoretical financial or economic relationships. For example, using ancillary information from social media platforms such as Twitter, News, and Google Trends, (Dutta et al. 2020). Mai et al. (2018) and Bartolucci et al. (2020) found that social media characteristics, such as the frequency of Bitcoin-related news or emotions in online discussions, can partially explain Bitcoin price movements. User sentiments being able to influence the price seems reasonable in light of the above discussion on Bitcoin pricing. Bitcoin price movement is not based on underlying economic fundamentals but is primarily speculative. The viral quality of social media discourse taps into, reflects, and even amplifies this speculative nature of cryptocurrency price determination.
A fundamental effort, therefore, concerns constructing quantitative models to predict Bitcoin prices based on historical price information. The first step in Bitcoin price prediction is to predict the direction (going up, staying stagnant, or going down) of Bitcoin price changes (e.g., should one buy or not). Table 1 highlights the research that has used a variety of machine-learning techniques and data sources for predicting the direction of Bitcoin price movements.
A review of the studies in Table 1 reveals that (1) most existing studies predicted daily Bitcoin price changes, (2) some studies predicted at the block time period using historical price data but performed poorly, and (3) two studies that used transaction information achieved relatively low accuracy scores. While a recent machine learning approach used historical (eight-month-old) data and a random forest model to achieve high prediction accuracy of price movement (Amjad and Shah 2016), there is little evidence that such old data can causally influence the recent price of a highly volatile Bitcoin. Chen (2023) also applied machine learning (random forest regression and LSTM) to predict Bitcoin prices and found that higher accuracy for next-day price prediction was achieved when using only a one-period look-back on explanatory variables. In summary, the existing literature shows that when using historical price data, the predictive accuracy over a short time period is very challenging, whereas over a longer time period, accuracy is not significantly better than chance. Our study, however, sheds light on the predictability of price changes at a block level, within a short time frame. Our study not only achieves a higher prediction accuracy but also provides the possible mechanisms underlying Bitcoin price movement and the heterogeneity of investors.
While some existing studies have exploited Bitcoin transaction network data to predict Bitcoin price movement, a similarly important yet less explored topic is the converse: whether and how Bitcoin price affects Bitcoin transactions, or more specifically, how different segments of investors react differently to Bitcoin price movement. There are two questions worth investigating, which are discussed later in this paper. First, do changes in Bitcoin price, in turn, affect Bitcoin transaction behavior? And second, are such relationships heterogeneous, i.e., based on Bitcoin transaction characteristics? Some researchers have already found linkages between Bitcoin price and transaction network characteristics—such as connections among Bitcoin market participants (Akcora et al. 2018) and transaction volume (Koutmos 2018)—that are bidirectional and dynamic.
3. Not All Blocks Are Created Equal: Investor Segmentation
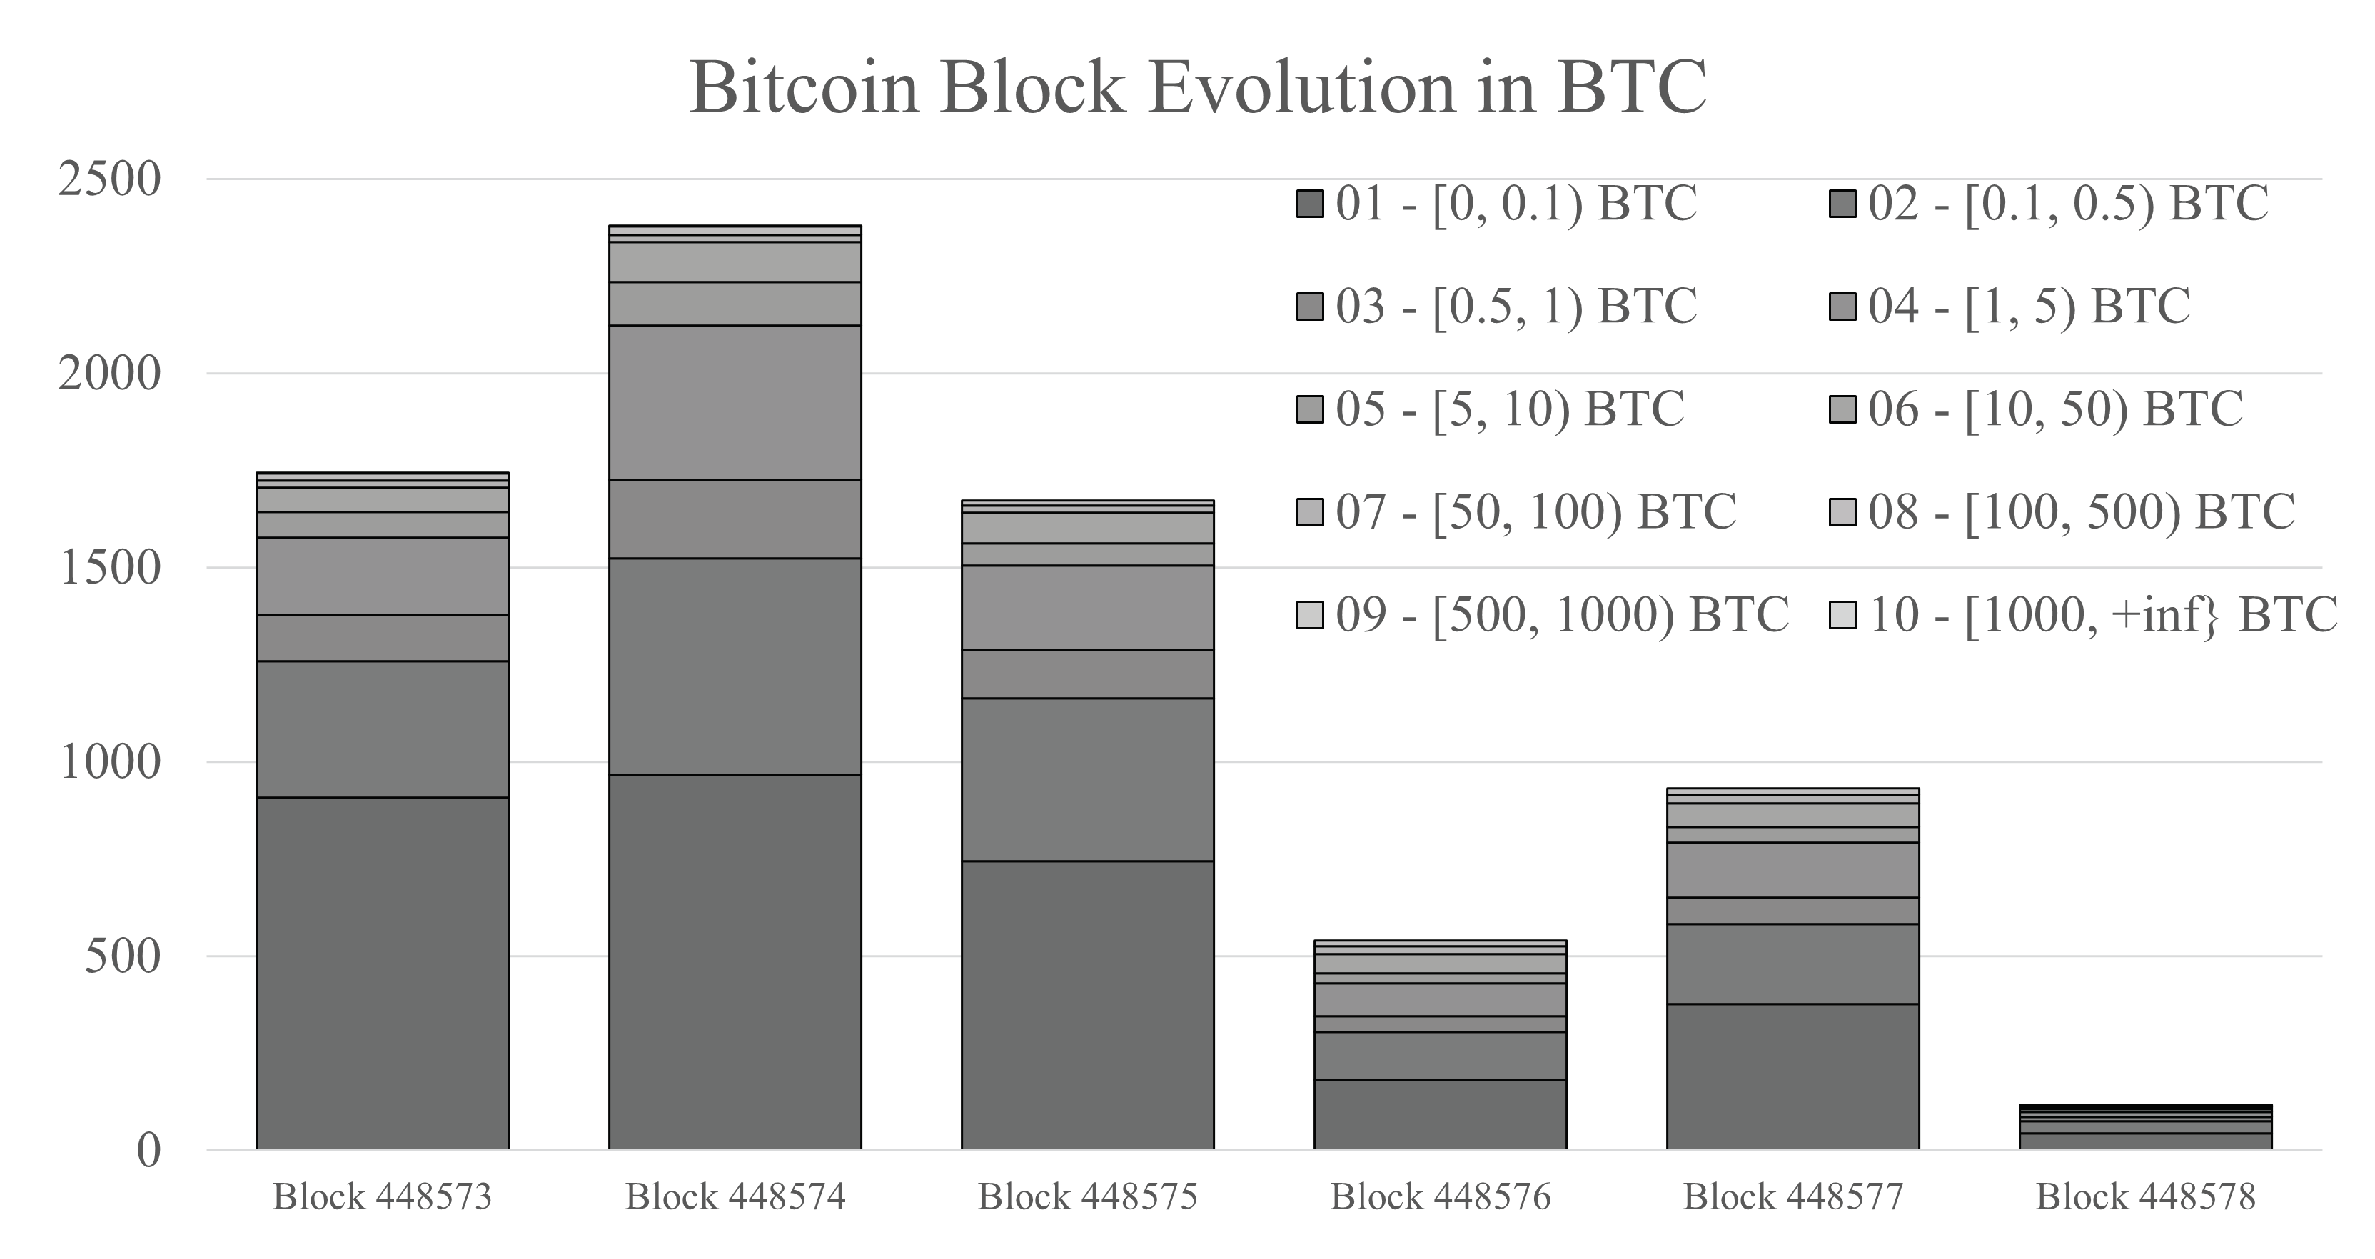
Each block in a Bitcoin blockchain contains all transactions that occur in approximately a rolling 10-min time window. The number of Bitcoin transactions occurring in each block, however, can vary significantly. Also, transactions can range in size from a fraction of a Bitcoin to a large number of Bitcoins. Because of this, Bitcoin transaction blocks are not uniform in composition and can differ in attributes such as the number and size of transactions. We further observe that Bitcoin blocks show interesting patterns when segmenting transactions in each block by transaction amounts. Figure 2 shows an example of how blocks evolve when transactions are segmented by transaction amount (in BTC).
Figure 2 shows that the number of transactions in each transaction class varies significantly across blocks. Additionally, if we calculate the proportion of transactions falling into each transaction class, it also varies significantly by block. Therefore, given the high price volatility associated with the high volatility of the transaction classes, we propose that analogous to what is found in the stock market, there are multiple investor types in the Bitcoin market, and if classified by their transaction amount, different types of investors are dynamically associated with Bitcoin price movement. Later, in Section 5, we present possible labels, i.e., different types of investors, for these transaction classes and provide possible underlying mechanisms to explain the associations.
Based on the above proposal, we develop an effective predictive model that captures the heterogeneity in the association between the types of Bitcoin investors and Bitcoin price movement. In our predictive model, to predict the directionality of BTC price movements over time, we use the change in transaction class in two ways: (1) the change in the number of transactions in each transaction class from one block to the next, and (2) the change in the proportion of each transaction class to the total transaction numbers from one block to the next. This allows us to capture the heterogeneity in speculations by various investor types and utilize their prior time-period decisions to predict future price movements. This segmentation of investors provides rich insights for more accurate prediction—not just for capturing volatility but also for understanding the behavior and actions of investors participating in this market. Details of operationalizing this approach are described in Section 4.
4. Data Analysis and Results
4.1. Data
Historical Bitcoin transaction data were collected and processed from three data sources: (1) blockchain.com (accessed on 21 March 2018); (2) blockcypher.com (accessed on 21 March 2018); and (3) Bitcoinchart.com (accessed on 21 March 2018). The first two sources provide Bitcoin transaction history data, including block IDs, block timestamps, transaction IDs, senders’ addresses, receivers’ addresses, and transaction amounts. They contain 306,033,506 transactions in total, dating from 18:15:05 on 3 January 2009 to 03:56:50 on 21 March 2018. The third source provides the Bitcoin market transaction price for every five minutes, with the time windows for this data source being from 13:50:00 on 13 September 2011 to 00:00:00 on 14 May 2017. We merged these three datasets to obtain the Bitcoin transaction history with market exchange price for the time period from 13:50:00 on 13 September 2011 to 00:00:00 on 14 May 2017.
4.2. Transaction Segmentation
For each block, we segmented the transactions into 15 segments based on transaction volume, as shown in Table 2. Here, the “Transaction Amount Segment” represents the transaction amount interval (in BTCs) in which a transaction falls.
4.3. Price Movement Prediction
The baseline framework for predicting the direction of price movement (moves up or not at time T)4 is described as follows:
Here, , the predicted binary variable, can take the value of one or zero, with one representing an upward Bitcoin market price movement from time to T, and zero representing an unchanged or downward market price movement from time to T. The function f represents a binary prediction classifier that utilizes the following predictive variables:
- (1)
- , a vector representing the direction of the historical Bitcoin price movement from time to . This vector of zeros and ones is denoted by:where represents the Bitcoin price movement direction from time to .
- (2)
- , a vector representing the change in transaction volume of all transaction classes during each time period from time to . This vector is denoted by:i.e.,
- (3)
- A variable , representing a fixed effect measured at time T. We consider two types of time-specific fixed effects: the day/night fixed effects and the month fixed effects. We tested our results with various values of the look-back period (p). For consistency and simplicity, and to save space, we present the subsequent results only for the case .
Here, to accommodate two possible models, represents either the change in the number of transactions within transaction class i or the change in the proportion of transactions falling in transaction class i from time to t depending on whether we are focusing on the changes in the number or the proportion of changes, respectively.
As mentioned previously, in our investigation, is defined in two alternative ways: (1) measures the change in the number of transactions in transaction segment i from time to t, and (2) represents the change in the proportion of transactions in segment i from time to t. The first approach allows us to capture the change in the number of transactions over time, whereas the second approach allows us to capture the change in the distribution of transactions over time. Additionally, including a time-specific fixed effect enables the model to capture transaction times across different countries, and consequently, the differences in transaction patterns caused by the time/location differences.
Additionally, we estimated the performances of multiple combinations of variables for the prediction of price movement: transaction volume/distribution changes in each transaction interval, historical price, day/night fixed effect, and month fixed effect (Table 3). Using the transaction volume changes and the transaction distribution changes, we demonstrated a significant predictive improvement compared with existing studies, suggesting an important role of publicly accessible transaction data in Bitcoin price movement.
We present the results using two classifiers. The first is recurrent neural network (RNN) classifiers since they have been shown to have a strong ability to learn and model time-series data with non-linear and complex relationships. A special form of RNN, the Long Short-Term Memory (LSTM) method, allows information to persist and is capable of learning from the past while selectively remembering patterns for a longer duration of time. LSTM provides a good prediction of the direction of Bitcoin price movement. Specifically, we constructed a three-layer LTSM model, using categorical cross-entropy as the loss function.
Another classifier used with the same sets of variables is the logistic regression model. Model fixed effects are included for possible day/night and month fixed effects. In the logistic regression model, the prediction function takes the form of:
In this equation, p is the number of look-back periods for the transaction volume or transaction volume distribution changes; denotes the intercept; and , , and denote the coefficients of the historical price movements, changes in the number (or proportion, respectively) of transactions in each volume segment, and the fixed effects vectors.5
4.4. Results
First, we report the prediction results for the direction of price movement based on transaction volume changes as the key predictive variable while incorporating other variables in the predictive model. The best prediction model results are presented in Table 3 (upper) with an accuracy rate of 63.1%. The best-performing predictive models were (a) the recurrent neural network method (LSTM), using the historical price movement, historical changes in the transaction volume, and day/night fixed effects (i.e., not including the month fixed effects), and (b) the LSTM method, incorporating all the variables introduced earlier, including the month fixed effects. While both LSTM models exhibited the same accuracy (number of correct predictions divided by the number of predictions), the first LSTM model exhibited a slightly higher F1-score (the harmonic mean of the precision and the recall), indicating greater overall accuracy as measured with the precision and recall rates. Since all the models in Table 3 were run on the same dataset and same forecast horizon (unlike the summary given in Table 1), this result clearly shows that incorporating transaction volume changes improved performance. For comparison with the methods in Table 1, the LSTM metrics for prediction using historical data and not incorporating the transaction data or fixed effects yielded an accuracy of 0.4941 and an F1-score of 0.5292. This compares to (see top two rows of Table 3) the accuracy of 0.631 and F1-score of 0.768–0.773 for the same analysis on the same dataset with the same prediction horizon but also including the transaction network data. The common dataset and prediction horizon in Table 3 make it more fair to compare the results of Table 1 with those of Table 3 with the incorporation of a transaction volume variable. The LSTM models performed better when the transaction volume was incorporated.
Since Table 3 (upper) shows that the inclusion of historical changes in transaction volume provided a more accurate classification of the direction of price movement, this raises the question of how much the inclusion of transaction volume changes contributes to the prediction. To further explore this, Table 3 (upper) revisits the previous logistic regression models from Table 1, comparing the results when excluding versus including the historical and transaction volume changes from the explanatory variables (logistic regression was among the top methods on our data and also one of the most used quantitative methods employed in the literature presented in Table 1). The results in the last line of Table 3 (upper) show that including the historical price movement and fixed effects without including the historical record of transaction volume changes led to significantly worse performances in classifying price movement direction. These results provide empirical evidence of the central role transaction network characteristics play in predicting Bitcoin price movement. The comparison is fair because all models used the same dataset and prediction horizon.
Next, we replicated the analysis of Table 3 (lower), but now used the changes in the proportion (instead of the number) of transaction segments as predictive variables (as discussed in after Equation (3b) in Section 4.3). With the inclusion of the changes in transaction volume distributions in the model, we observed (Table 3 (lower)) a slight improvement in predictive accuracy for the recurrent neural network method when also including the historical price movement, monthly fixed effects, and day/night fixed effects. The highest accuracy rate reached was 63.6%. By contrast, the logistic regression model performed significantly worse, even relative to the logistic regression model that included transaction volume changes as the predictive variable (compared with the previous table).
4.5. The Relationship between Price Movement and Transaction Volume in the Bitcoin Market
Next, we explored the causal effect of transaction volume changes in each transaction segment on the direction of Bitcoin price movement. While our previous predictive models achieved relatively high accuracy, these models are inherently black-box models and did not explicitly explain how the transaction volume was related to the direction of Bitcoin price movement. Thus, we applied the linear probability model to interpret the direction of Bitcoin price changes in a time-series framework (Battey et al. 2019). Specifically, we regressed the binary direction of Bitcoin price movement on a series of historical transaction volume changes in each transaction segment while incorporating fixed effects. The coefficients reflect the explanatory power of each transaction volume segment at the examined block time prior to the current block time on the current price movement. The interplay between the transaction volume and block time allows us to explore how the explanatory power varies based on transaction size and time. The rationale behind this estimation strategy is to differentiate the impacts of the volume of small-amount and large-amount historical transactions and if they have different degrees of effect on future price changes. Thus, we estimate the following linear probability model:
The dependent variable in Equation (5) is the binary variable indicating whether the Bitcoin price moves upward () versus staying stagnant or moving downward (). This model is similar to the earlier predictive model (Equation (1)). Through this linear probability model, we can interpret how a change in the number of transactions in different transaction amount segments generates heterogeneous effects on Bitcoin price movement.
Based on the estimated coefficients (Table 4), we can observe that a transaction volume (or transaction distribution) that is older than 10 blocks in the past does not have a significant impact on the expected current Bitcoin price movement6. Furthermore, interestingly, these coefficients suggest that a unit change in “small-amount” transactions positively affects Bitcoin price movement, whereas a unit change in “large-amount” transactions negatively affects Bitcoin price movement.
We now turn to the specific transaction amount segments. First, although all the coefficients for the first transaction amount interval, 0 to 0.1 Bitcoins, were significant, the transactions in this interval were likely to be transaction fees and were less related to the amount of the transaction. The significance here could suggest that the volume of micro-transactions is a proxy for overall transactions happening in the marketplace. For the next four intervals, 0.1 to 10 BTC, we found that an increase in transactions in the segment 0.1 to 1 BTC had a shorter-term positive effect on the Bitcoin price with no effect observed beyond , whereas the positive effect of larger Bitcoin transactions, from 1 to 10 BTC, persisted over a longer term. Small-transaction investors whose transactions fall in the 0.1 to 1 BTC interval are more likely to be driven by market sentiments and speculations that affect the price in the short term. Since a small amount of Bitcoin is more affordable, potential amateur or uncertain buyers can purchase, and this could lead to a significant increase in demand. A longer-term effect was observed on transactions in the range of 1 to 10 BTC. This is intuitive because a participant with a stronger speculation motive is likely to invest more in such a dynamic financial market Dyhrberg et al. (1995). Thus, mid-scale transactions ranging from 1 to 10 BTC were much larger and more frequent, leading to significant effects on Bitcoin price movement in the long run. This result is consistent with earlier findings that the persistence of Bitcoin price volatility is driven by massive middle-scale transactions (Scharnowski 2021). By way of contrast, transactions ranging from 500 to 10,000 BTCs exhibited a negative effect on pricing. This is possibly because many investors in this large-dollar range are institutional investors, and they can benefit from investing in products that are classified as overvalued by timing the correction of overpricing Edelen et al. (2016); Jang and Kang (2019). As a result, it could be an indication of an anticipated price drop when these large-dollar investors become more active in making Bitcoin transactions.
5. Interpretation and Discussion
Our findings provide interesting insights into the dynamic relationship between Bitcoin price and transaction distribution. The findings suggest that various segments of Bitcoin market participants influence price movement in intervals as short as one block or as long as two hours. We identify three groups (small, mid, and large) of participants based on transaction amounts. We then analyze how different types of market participants can potentially respond to price dynamics in different ways, and how the divergent patterns of market response can lead to changes in the dynamics of price and transactions. This utilizes theory from social influence and network density to shed information on price movement.
5.1. Market Participants
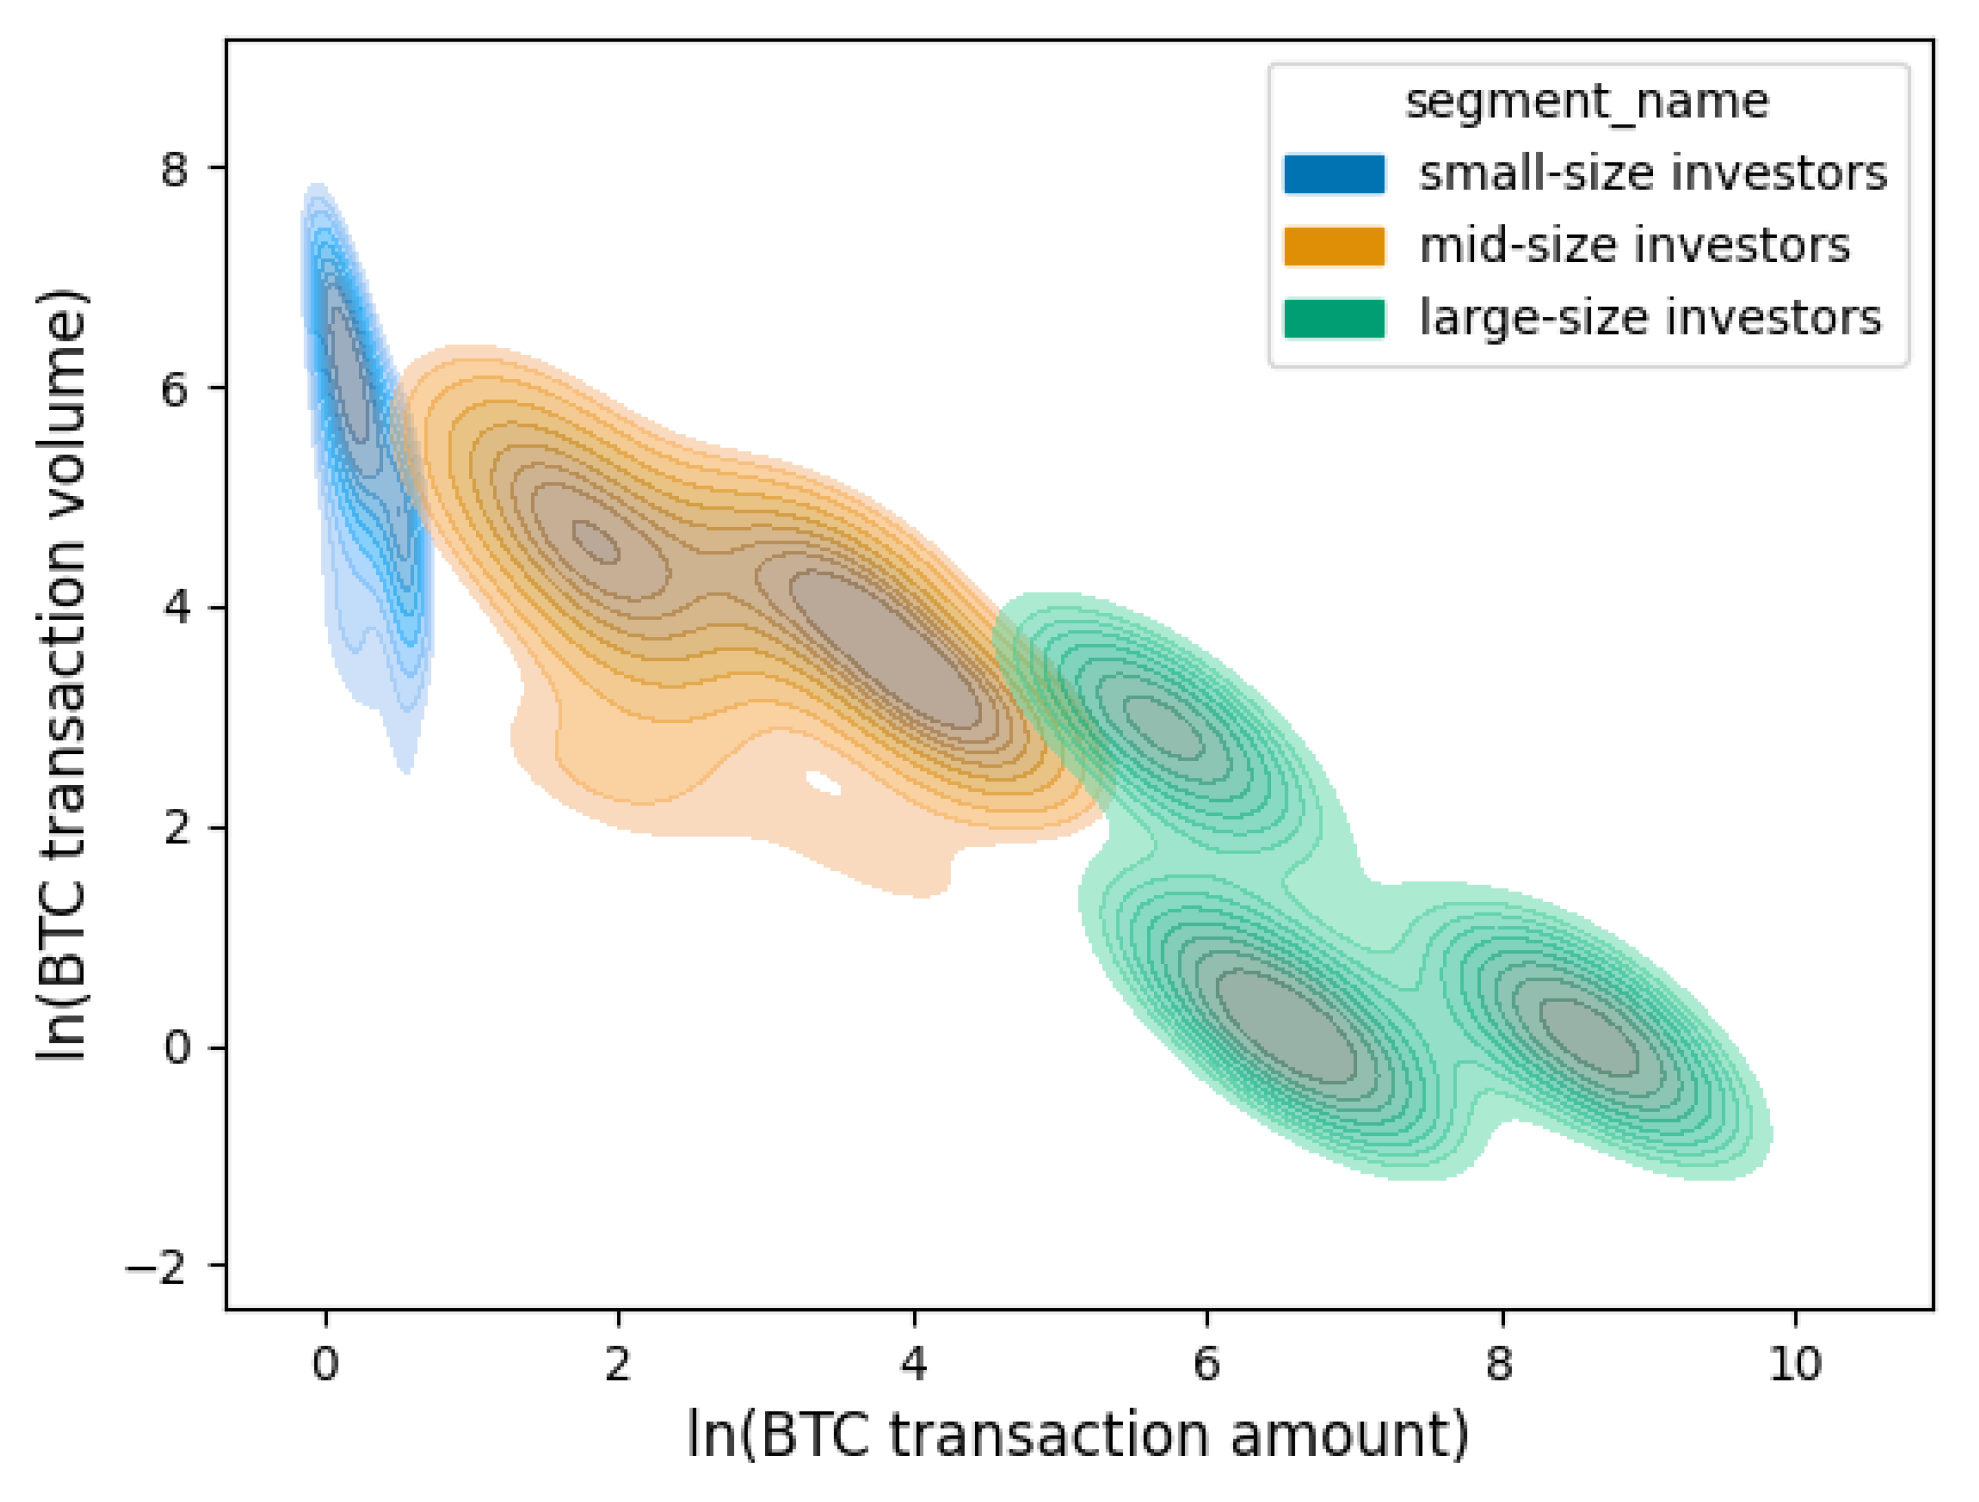
A rationale consistent with our Bitcoin market analysis is that different market participants respond to Bitcoin price movement in different ways and, in turn, also generate different effects on Bitcoin price. While these insights are similar to market segmentation present in financial equity markets, it is of particular importance to study the relationship between Bitcoin transactions and price movement given Bitcoin’s high volatility Blau (2017), its speculative nature, and the public accessibility of its transaction information. The transaction information also enables information transparency that is usually held by large financial institutions in traditional financial markets. This information can help future market participants make more rational decisions to optimize returns from Bitcoin markets. It is expected that Bitcoin price and transactions have a dynamic relationship similar to assets in the stock market (Gabaix et al. 2006). On the one hand, traders with small and large transaction amounts respond deferentially to price movement in the Bitcoin market, whereas on the other hand, trading behaviors can reflect (and even cause) price movement. Thus, we present three groups of participants, as seen in Figure 3: small investors (e.g., algorithmic traders), mid-sized investors (e.g., individuals), and institutional investors (e.g., individual whales). Figure 3 presents a contour map, where the x-axis represents the natural logarithm of transaction amounts, the y-axis represents the natural logarithm of the number of transactions in each block, and the contour lines and shading represent the total number of blocks. In this figure, we can see that the transactions show significant patterns and can be segmented into three segments: large transaction volume but small transaction amount, medium transaction volume and medium transaction amount, and low transaction volume but large transaction amount. These correspond to the three investor groups, which we describe next.
5.1.1. Individual Investors
Similar to individual participants in the stock market, individual Bitcoin investors mainly focus on small-to-medium transactions. In a financial market, individual market participants focusing on small-amount transactions actively adjust their investment strategies following changes in stock prices. For example, as discussed in earlier stock market studies (e.g., Niederhoffer and Osborne 1966), individual stock market investors are more likely to invest when stock prices are increasing and less likely to invest when stock prices are decreasing. This type of investment behavior can be explained by behavioral financial theories (e.g., Ji et al. 2008), which argue that an individual’s expectation of continued price increase in a “rising market” could surpass expectations of the risk associated with a price decline in the future. This transaction pattern is similar in the Bitcoin market, where we observed a long-term positive impact on price movement.
5.1.2. Algorithmic Bitcoin Traders (Micro-Traders)
Algorithmic traders concentrate on high-frequency transactions that lie within the smaller-size transaction segments. The goal of high-frequency transactions is fundamentally different from that of individual participants in the market Gsell (2008): algorithmic trading tends to focus on short-term costs and benefits, whereas individuals are relatively more interested in longer-term trends in the market price. Therefore, the optimal strategy of algorithmic trading is to capitalize on the benefits in a rising market by selling immediately after the price increases. In other words, in contrast to individual participants’ investment behaviors, algorithmic trading tends toward “sell” as the price increases and “buy” as the price decreases. Both individual market participants and algorithm traders are sensitive to price movement, and a change in the market price leads to an increase in transactions for both types of participants with small transaction amounts in the Bitcoin market. This is consistent with our findings on the short-term positive relationship between small-size transaction volume and price movement.
For individual traders who concentrate on small transactions, a commonly exhibited trading strategy is to buy in a rising market and sell in a falling market Ji et al. (2008), whereas on the other hand, algorithmic trading tends toward buying in a falling market and selling in a rising market. In any case, market price movements generate a positive effect on transaction volume, with some small-amount market participants buying and others selling. It is thus possible to exploit price movement to predict the volume of small-amount transactions. Additionally, the buying and selling behaviors among small-amount participants could also reflect price movement, especially in the Bitcoin market where the supply of new Bitcoins is limited. Therefore, an increase in transactions marks a higher level of trading activity, suggesting a higher demand for Bitcoins in the market. This leads to a price rise as demand increases while the supply remains fairly stable. Although a causal link between small-amount transactions and a price rise or decline might be too strong an assumption for the Bitcoin market, any changes in the volume of small-amount transactions might still reflect—and thus can be used as a predictor of—price movement in the Bitcoin market.
5.1.3. Larger-Volume Traders (Institutions and Whales)
Typically, individual market participants and algorithm traders are not involved in large-scale transactions in the financial market due to their limited financial resources and capacity. Instead, market participants focusing on transactions with high amounts are generally large institutional traders who have sufficient financial resources to engage in such transactions (Chan and Lakonishok 1995). These investors likely possess private information on the long-term performance of an asset and tend to invest when the price is declining or sell when the price is increasing, which is again consistent with our findings regarding Bitcoin.
Institutional trading, which focuses on large-amount transactions, depends on the specific trading volume and the size of the investor (Gabaix et al. 2006). Given the high volatility of the Bitcoin market, institutional traders might be less inclined to engage in transactions due to risk aversion compared to individuals and algorithm traders (O’Connell and Teo 2009).
Therefore, there could be a divergent pattern of transactions under price movement between market participants who focus on small-amount transactions versus large-amount transactions. On the other hand, since institutional trading involving large-amount transactions is disproportionately influential in the Bitcoin market (Aalborg et al. 2019), changes in the volume of large-amount transactions can generate a direct impact on the Bitcoin price, in addition to reflecting the price movement. The above differential dynamics provide a basis for predicting the mutual relationship between transaction volume and Bitcoin price in the upper tail of transactions.
5.2. Using Prediction of Price Direction Movement as an Investment Guide
To better illustrate the predictability and application of our model, we compared it to a very simple trading strategy based on a naive prediction model, the random-walk model. We then monitored the total asset value and ROI of each investment strategy at each block over a span of a month. The investment strategy used is simple: once block (number N) is mined, immediately invest the balance to purchase Bitcoins (BTCs) and hold it. Continue to hold it when the next block (number N+1) is mined, provided the predicted price movement from block N to is “up”. Alternatively, immediately sell all BTCs in the account if the predicted price movement from block N to is “stagnant or down”. We applied the same strategy based on our model prediction and a “random-walk” model prediction, which assumes that the Bitcoin price has a 50% chance of going up and a 50% chance of not going up.
The use of the random-walk model to provide a reasonable comparison model against our model may require a justification for some. Indeed, one might conjecture that it is easier for a machine learning model to outperform the random-walk model, especially in series with trends. However, for very short-term predictions (about ten minutes into the future for a block-length prediction), this conjecture is less obvious because of Bitcoin’s extremely high volatility. Additionally, there is empirical support for the random-walk hypothesis being a reasonable (non-rejectable) alternative model in some tests of the efficient market hypothesis for Bitcoin (e.g., Nadarajah and Chu 2017). Thus, we do not view the random-walk model as a “straw man” comparison but rather as a reasonably simple alternative model for comparison.
We can also find some support for using the random-walk model as an alternative model in the theoretical and empirical exchange rate literature. The paper by (Meese and Rogoff 1983) is an important and seminal paper in the currency exchange literature. It shows that for out-of-sample prediction, sophisticated exchange rate models in the literature do not perform better in short-term prediction (1–12-month horizons in their paper) compared to the random-walk model. According to Moosa and Burns (2014), “This view [that the random-walk model does as well as more sophisticated econometric finance models] is still widely accepted to the extent that it is typically argued that the Meese–Rogoff results, which are “yet to be overturned”, constitutes a puzzle.”
We include the random-walk model because it is a reasonable short-term alternative model, especially due to the high local volatility of Bitcoin prices. At any rate, in light of the currency literature cited above, as well as some literature that tests whether Bitcoin price changes are consistent with the weak-form (random walk) efficient market hypothesis, we feel that the random-walk model provides a reasonable comparison benchmark for short-term prediction.
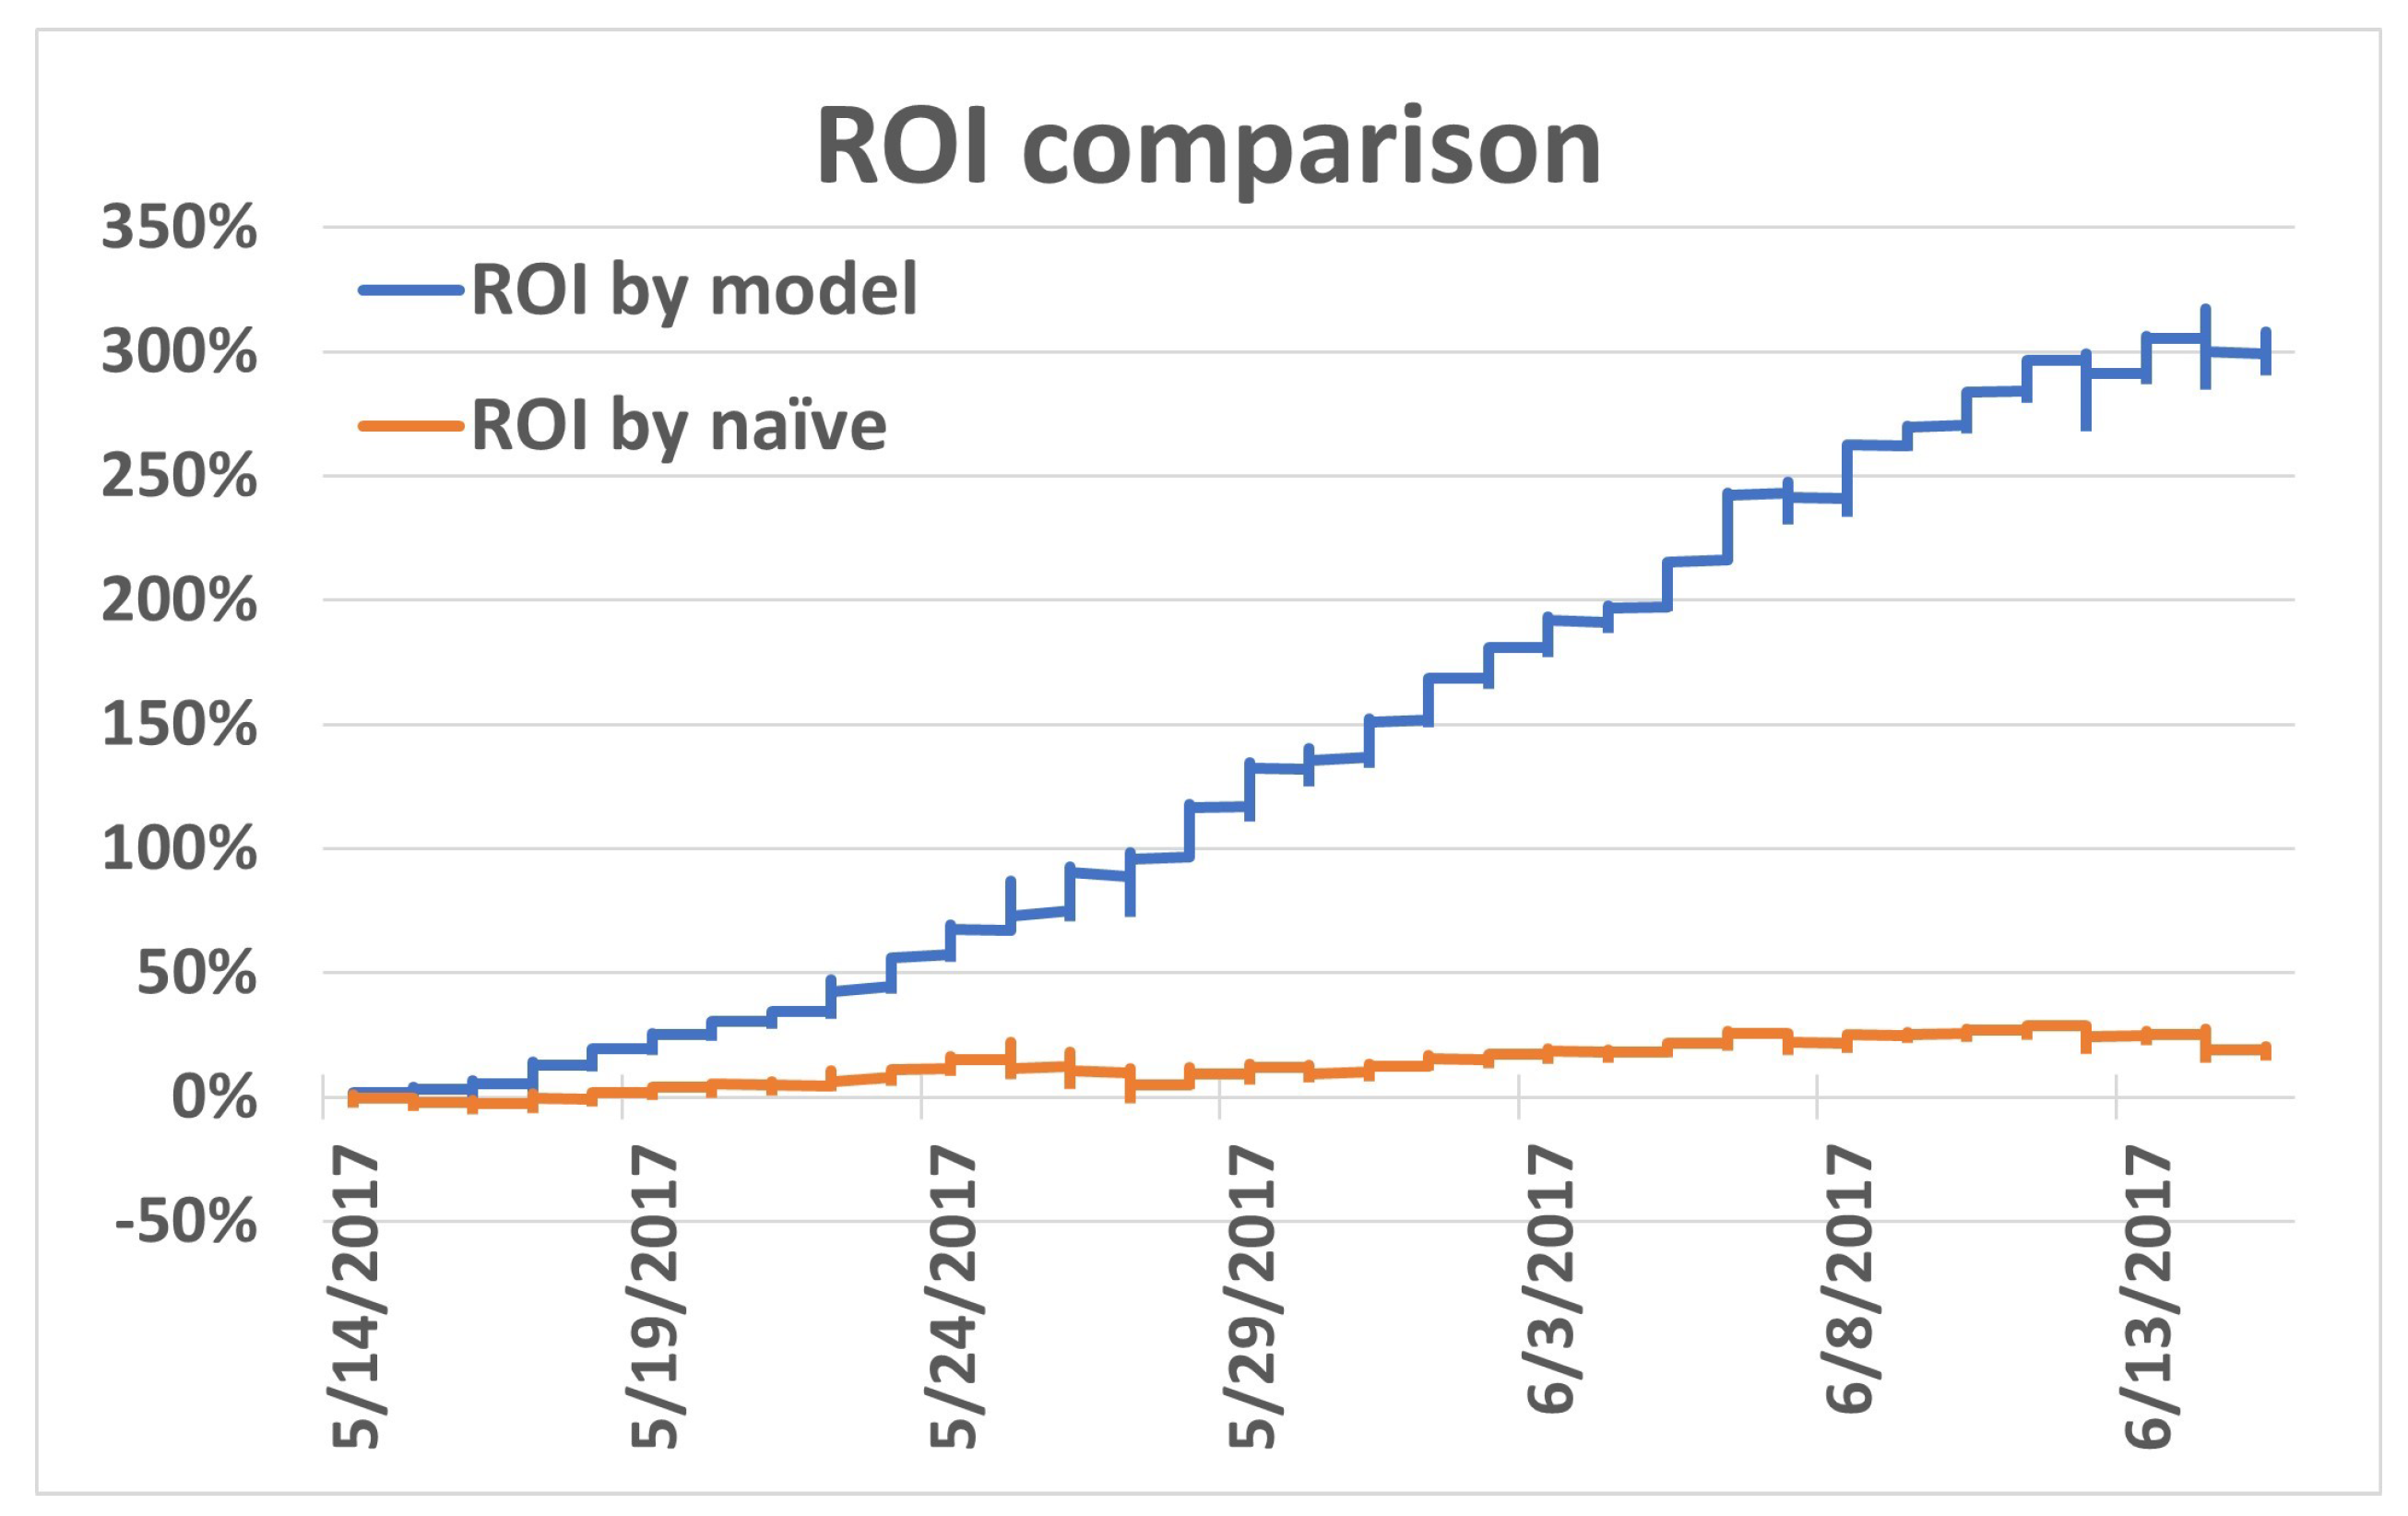
The trading strategy based on our model reached a total return on investment (ROI) of 305%, whereas the naive random-walk model only reached a total ROI of 20%, with both strategies starting with the same initial capital investment. Figure 4 shows how the ROI changed over time based on these two strategies. The x-axis in Figure 4 represents the time, and the y-axis represents the ROI percentage.
6. Conclusions and Implications
Bitcoin market price movement prediction and the dynamic relationship between price and transaction volume distribution are critical for a better understanding of Bitcoin investment, applications, and regulation. In this paper, we present a novel approach to predict Bitcoin market price movement based on the transaction volume distribution. Our results demonstrate that our models significantly improve the accuracy, precision, and recall rates compared to existing models in predicting Bitcoin price movements7. Managerially, this is an important finding to inform both investors and regulators of how publicly available transaction data in the blockchain could be utilized to understand the movement of a digital currency. While Bitcoin does benefit from its open decentralized architecture, the public availability of information could provide unfair advantages to some investors.
Author Contributions
Conceptualization, Y.Z., R.G., L.L.G. and P.L.B.; Formal analysis, Y.Z., R.G. and L.L.G.; Investigation, L.L.G.; Methodology, Y.Z., R.G., L.L.G. and P.L.B.; Resources, P.L.B.; Software, Y.Z. and R.G.; Supervision, R.G., L.L.G. and P.L.B.; Writing—original draft, Y.Z., R.G., L.L.G. and P.L.B.; Writing—review & editing, R.G., L.L.G., P.L.B. and A.S. All authors have read and agreed to the published version of the manuscript.
Funding
This research was funded by The University of Texas at Austin Blockchain Initiative and the Center for Risk Management in the McCombs School of Business at the University of Texas at Austin.
Data Availability Statement
The Bitcoin blockchain data are publicly available from multiple sources like Blockchain.com (accessed on 1 March 2020), Blockchair.com (accessed on 1 March 2020), Kaggle.com (accessed on 1 March 2020), and more.
Conflicts of Interest
The authors declare no conflict of interest. The funders had no role in the design of the study; in the collection, analyses, or interpretation of data; in the writing of the manuscript; or in the decision to publish the results.
| 1 | In fairness, it should be noted that many “fiat currencies” issued by governments may also sometimes fail to satisfy one or more of these functions. |
| 2 | However, when there is a lack of trust in the local fiat currency, which sometimes occurs in some developing or emerging economies, or when investment in foreign currency is forbidden, storing value in Bitcoin may be attractive despite its high volatility. |
| 3 | Cheah and Fry (2015) showed that Bitcoin exhibits speculative bubbles with a fundamental price of zero. |
| 4 | We consider T to be the time when a block is mined on the Bitcoin blockchain, which is approximately every 10 min. |
| 5 | Studies have shown that in many contexts neural network models outperform traditional statistical models for prediction, and that logistic regression is among the best (and easiest to explain) of the of the traditional statistical classification methods (cf., West et al. 1997; Brockett et al. 1994, 2006). |
| 6 | |
| 7 | Our dataset uses Bitcoin information from 2011 to 2017; however, much has evolved in the Bitcoin market since then (e.g., the emergence of Exchange Traded Funds for Bitcoin, El Salvador recognizing Bitcoin as legal tender for transactions, etc.). Nevertheless, there is nothing in these changes that would cast doubt on the conclusion of this paper that there is an accuracy benefit to using segmented transaction data in conjunction with Bitcoin price data to better predict the direction of Bitcoin price movement. Additionally, while we recognize that using data from 2011 to 2017 may raise questions about topicality, we note that using a newer dataset can pose additional challenges because a large number of transactions have been happening off-chain since 2018 (https://www.chainalysis.com/blog/fake-trade-volume-cryptocurrency-exchanges/ (accessed on 1 March 2020)). Many of the crypto exchanges provided a channel for investors to trade without registering the transaction on the BTC blockchain. |
References
- Aalborg, Halvor Aarhus, Peter Molnár, and Jon Erik de Vries. 2019. What can explain the price, volatility and trading volume of bitcoin? Finance Research Letters 29: 255–65. [Google Scholar] [CrossRef]
- Abraham, Jethin, Daniel Higdon, John Nelson, and Juan Ibarra. 2018. Cryptocurrency price prediction using tweet volumes and sentiment analysis. SMU Data Science Review 1. No. 3. Available online: https://scholar.smu.edu/datasciencereview/vol1/iss3/1 (accessed on 10 March 2024).
- Adrian, Tobias, and Tommaso Mancini-Griffoli. 2021. The rise of digital money. Annual Review of Financial Economics 13: 57–77. [Google Scholar] [CrossRef]
- Akcora, Cuneyt G., Asim Kumer Dey, Yulia R. Gel, and Murat Kantarcioglu. 2018. Forecasting bitcoin price with graph chainlets. In Advances in Knowledge Discovery and Data Mining: 22nd Pacific-Asia Conference, PAKDD 2018, Proceedings, Part III 22, Melbourne, VIC, Australia, June 3–6. Berlin and Heidelberg: Springer, pp. 765–76. [Google Scholar]
- Almeida, José, and Tiago Cruz Gonçalves. 2023. Portfolio diversification, hedge and safe-haven properties in cryptocurrency investments and financial economics: A systematic literature review. Journal of Risk and Financial Management 16: 3. [Google Scholar] [CrossRef]
- Alvarez, Fernando, David Argente, and Diana Van Patten. 2023. Are cryptocurrencies currencies? bitcoin as legal tender in el salvador. Science 382: eadd2844. [Google Scholar] [CrossRef]
- Amjad, Muhammad J., and Devavrat Shah. 2016. Nips time series workshop. In Trading Bitcoin and Online Time Series Prediction, Barcelona, Spain, December 9. PMLR. pp. 1–15. Available online: https://proceedings.mlr.press/v55/amjad16.html (accessed on 1 March 2024).
- Arguelles, Dennys Christian Mallqui. 2018. Predicting the Direction, Maximum, Minimum and Closing Price of Daily/Intra-Daily Bitcoin Exchange Rate Using Batch and Online Machine Learning Techniques. Master’s thesis, Universidade Federal de São Carlos, São Carlos, Brazil. Available online: https://repositorio.ufscar.br/handle/ufscar/10589 (accessed on 1 March 2020).
- Arnosti, Nick, and Matthew Weinberg. 2022. Bitcoin: A natural oligopoly. Management Science 68: 4755–71. [Google Scholar] [CrossRef]
- Atsalakis, George S., Ioanna G. Atsalaki, Fotios Pasiouras, and Constantin Zopounidis. 2019. Bitcoin price forecasting with neuro-fuzzy techniques. European Journal of Operational Research 276: 770–80. [Google Scholar] [CrossRef]
- Bakry, Walid, Audil Rashid, Somar Al-Mohamad, and Nasser El-Kanj. 2021. Bitcoin and portfolio diversification: A portfolio optimization approach. Journal of Risk and Financial Management 14: 282. [Google Scholar] [CrossRef]
- Bariviera, Aurelio F. 2017. The inefficiency of bitcoin revisited: A dynamic approach. Economics Letters 161: 1–4. [Google Scholar] [CrossRef]
- Bartolucci, Silvia, Giuseppe Destefanis, Marco Ortu, Nicola Uras, Michele Marchesi, and Roberto Tonelli. 2020. The butterfly “affect”: Impact of development practices on cryptocurrency prices. EPJ Data Science 9: 255–65. [Google Scholar] [CrossRef]
- Battey, Heather, David Cox, and Michelle Jackson. 2019. On the linear in probability model for binary data. Royal Society Open Science 6: 190067. [Google Scholar] [CrossRef]
- Blau, Benjamin M. 2017. Price dynamics and speculative trading in bitcoin. Research in International Business and Finance 41: 493–99. [Google Scholar] [CrossRef]
- Brockett, Patrick L., Linda L. Golden, Jaeho Jang, and Chuanhou Yang. 2006. A comparison of neural network, statistical methods, and variable choice for life insurers’ financial distress prediction. Journal of Risk and Insurance 73: 397–419. [Google Scholar] [CrossRef]
- Brockett, Patrick L., William W. Cooper, Linda L. Golden, and Utai Pitaktong. 1994. A neural network method for obtaining an early warning of insurer insolvency. The Journal of Risk and Insurance 61: 402–24. [Google Scholar] [CrossRef]
- Chan, Louis K. C., and Josef Lakonishok. 1995. The behavior of stock prices around institutional trades. The Journal of Finance 50: 1147–74. [Google Scholar] [CrossRef]
- Cheah, Eng-Tuck, and John Fry. 2015. Speculative bubbles in bitcoin markets? an empirical investigation into the fundamental value of bitcoin. Economics Letters 130: 32–36. [Google Scholar] [CrossRef]
- Chen, Junwei. 2023. Analysis of bitcoin price prediction using machine learning. Journal of Risk and Financial Management 16: 51. [Google Scholar] [CrossRef]
- Dimpfl, Thomas, and Stefania Odelli. 2020. Bitcoin price risk—A durations perspective. Journal of Risk and Financial Management 13: 157. [Google Scholar] [CrossRef]
- Dutta, Aniruddha, Saket Kumar, and Meheli Basu. 2020. A gated recurrent unit approach to bitcoin price prediction. Journal of Risk and Financial Management 13: 23. [Google Scholar] [CrossRef]
- Dyhrberg, Anne H., Sean Foley, and Jiri Svec. 1995. How investible is bitcoin? analyzing the liquidity and transaction costs of bitcoin markets. Economics Letters 171: 140–43. [Google Scholar] [CrossRef]
- Edelen, Roger M., Ozgur S. Ince, and Gregory B. Kadlec. 2016. Institutional investors and stock return anomalies. Journal of Financial Economics 119: 472–88. [Google Scholar] [CrossRef]
- Fischer, Thomas Günter, Christopher Krauss, and Alexander Deinert. 2019. Statistical arbitrage in cryptocurrency markets. Journal of Risk and Financial Management 12: 31. [Google Scholar] [CrossRef]
- Gabaix, Xavier, Parameswaran Gopikrishnan, Vasiliki Plerou, and Harry Eugene Stanley. 2006. Institutional investors and stock market volatility. Quarterly Journal of Economics 121: 461–504. [Google Scholar] [CrossRef]
- Gandal, Neil, J. T. Hamrick, Tyler Moore, and Tali Oberman. 2018. Price manipulation in the bitcoin ecosystem. Journal of Monetary Economics 95: 86–96. [Google Scholar] [CrossRef]
- Geuder, Julian, Harald Kinateder, and Niklas F. Wagner. 2019. Cryptocurrencies as financial bubbles: The case of bitcoin. Finance Research Letters 31. [Google Scholar] [CrossRef]
- Griffin, John M., and Amin Shams. 2020. Is bitcoin really untethered? Journal of Finance 75: 1913–64. [Google Scholar] [CrossRef]
- Gronwald, Marc. 2019. Is bitcoin a commodity? on price jumps, demand shocks, and certainty of supply. Journal of International Money and Finance 97: 86–92. [Google Scholar] [CrossRef]
- Gsell, Markus. 2008. Assessing the Impact of Algorithmic Trading on Markets: A Simulation Approach (2008). 16th European Conference on Information Systems (ECIS) 2008 Proceedings, 225. Galway, Ireland; Available online: https://aisel.aisnet.org/ecis2008/225 (accessed on 1 March 2024).
- Holden, Richard, and Anup Malani. 2022. An examination of velocity and initial coin offerings. Management Science 68: 9026–41. [Google Scholar] [CrossRef]
- Jang, Jeewon, and Jangkoo Kang. 2019. Probability of price crashes, rational speculative bubbles, and the cross-section of stock returns. Journal of Financial Economics 132: 222–47. [Google Scholar] [CrossRef]
- Ji, Li Jun, Zhiyong Zhang, and Tieyuan Guo. 2008. To buy or to sell: Cultural differences in stock market decisions based on price trends. Journal of Behavioral Decision Making 21: 399–413. [Google Scholar] [CrossRef]
- Kinderis, Marius, Marija Bezbradica, and Martin Crane. 2018. Bitcoin currency fluctuation. In Proceedings of the 3rd International Conference on Complexity, Future Information Systems and Risk—Volume 1: COMPLEXIS. Setúbal: INSTICC, SciTePress, pp. 31–41. [Google Scholar]
- Kjærland, Frode, Aras Khazal, Erlend A. Krogstad, Frans B. G. Nordstrøm, and Are Oust. 2018. An analysis of bitcoin’s price dynamics. Journal of Risk and Financial Management 11: 63. [Google Scholar] [CrossRef]
- Koutmos, Dimitrios. 2018. Bitcoin returns and transaction activity. Economics Letters 167: 81–85. [Google Scholar] [CrossRef]
- Kurbucz, Marcell Tamás. 2019. Predicting the price of bitcoin by the most frequent edges of its transaction network. Economics Letters 184: 108655. [Google Scholar] [CrossRef]
- Kyriazis, Nikolaos A. 2019. A survey on efficiency and profitable trading opportunities in cryptocurrency markets. Journal of Risk and Financial Management 12: 67. [Google Scholar] [CrossRef]
- Li, Jing-Ping, Bushra Naqvi, Syed Kumail Abbas Rizvi, and Hsu-Ling Chang. 2021. Bitcoin: The biggest financial innovation of fourth industrial revolution and a portfolio’s efficiency booster. Technological Forecasting and Social Change 162: 120383. [Google Scholar] [CrossRef]
- Lyandres, Evgeny, Berardino Palazzo, and Daniel Rabetti. 2022. Initial coin offering (ico) success and post-ico performance. Management Science 68: 8658–79. [Google Scholar] [CrossRef]
- Madan, Isaac, Shaurya Saluja, and Aojia Zhao. 2014. Automated Bitcoin Trading via Machine Learning Algorithms. Available online: https://api.semanticscholar.org/CorpusID:14217274 (accessed on 1 March 2020).
- Mai, Feng, Zhe Shan, Qing Bai, Xin (Shane) Wang, and Roger Chiang. 2018. How does social media impact bitcoin value? a test of the silent majority hypothesis. Journal of Management Information Systems 35: 19–52. [Google Scholar] [CrossRef]
- McNally, Sean, Jason Roche, and Simon Caton. 2018. Predicting the price of bitcoin using machine learning. Paper presented at 2018 26th Euromicro International Conference on Parallel, Distributed and Network-Based Processing (PDP), Cambridge, UK, March 21–23; pp. 339–43. [Google Scholar]
- Meese, Richard A., and Kenneth Rogoff. 1983. Empirical exchange rate models of the seventies: Do they fit out of sample? Journal of International Economics 14: 3–24. [Google Scholar] [CrossRef]
- Miller, Dante, and Jong-Min Kim. 2021. Univariate and multivariate machine learning forecasting models on the price returns of cryptocurrencies. Journal of Risk and Financial Management 14: 486. [Google Scholar] [CrossRef]
- Moosa, Imad, and Kelly Burns. 2014. The unbeatable random walk in exchange rate forecasting: Reality or myth? Journal of Macroeconomics 40: 69–81. [Google Scholar] [CrossRef]
- Nadarajah, Saralees, and Jeffrey Chu. 2017. On the inefficiency of bitcoin. Economics Letters 150: 6–9. [Google Scholar] [CrossRef]
- Niederhoffer, Victor, and Matthew Fontaine Maury Osborne. 1966. Market making and reversal on the stock exchange. Journal of the American Statistical Association 61: 897–916. [Google Scholar] [CrossRef]
- O’Connell, Paul G. J., and Melvyn Teo. 2009. Institutional investors, past performance, and dynamic loss aversion. Journal of Financial and Quantitative Analysis 44: 155–88. [Google Scholar] [CrossRef]
- Popper, Nathaniel. 2018. As Bitcoin Bubble Loses Air, Frauds and Flaws Rise to Surface. The New York Times. February 5. Available online: https://www.nytimes.com/2018/02/05/technology/virtual-currency-regulation.html (accessed on 1 March 2020).
- Sattarov, Otabek, Heung Seok Jeon, Ryumduck Oh, and Jun Dong Lee. 2020. Forecasting bitcoin price fluctuation by twitter sentiment analysis. Paper presented at 2020 International Conference on Information Science and Communications Technologies (ICISCT), Tashkent, Uzbekistan, November 4–6. [Google Scholar]
- Scharnowski, Stefan. 2021. Understanding bitcoin liquidity. Journal of Financial and Quantitative Analysis 38: 101477. [Google Scholar] [CrossRef]
- SEC, US Securities Exchange Commission. 2014. Investor Alert: Bitcoin and Other Virtual Currency-Related Investments. Available online: https://www.sec.gov/oiea/investor-alerts-bulletins/investoralertsia_bitcoin (accessed on 1 March 2020).
- Sin, Edwin, and Lipo Wang. 2017. Bitcoin price prediction using ensembles of neural networks. Paper presented at 2017 13th International Conference on Natural Computation, Fuzzy Systems and Knowledge Discovery (ICNC-FSKD), Guilin, China, July 29–31; pp. 666–671. [Google Scholar]
- Su, Chi-Wei, Meng Qin, Ran Tao, and Muhammad Umar. 2020. Financial implications of fourth industrial revolution: Can bitcoin improve prospects of energy investment? Technological Forecasting and Social Change 158: 120178. [Google Scholar] [CrossRef]
- Weaver, Nicholas. 2018. Risks of cryptocurrencies. Communications of the ACM 61: 20–24. [Google Scholar] [CrossRef]
- West, Patricia M., Patrick L. Brockett, and Linda L. Golden. 1997. A comparative analysis of neural networks and statistical methods for predicting consumer choice. Marketing Science 16: 370–91. [Google Scholar] [CrossRef]
Figure 1.
Bitcoin price volatility and daily transaction volume.

Figure 2.
Number of transactions by block.

Figure 3.
Bitcoin market participants and transaction patterns.

Figure 4.
ROI comparison.


Table 1.
Predicting the direction of the change in Bitcoin price.
| Ref. | Data | Prediction Method | Prediction Period | Best Accuracy |
|---|---|---|---|---|
| Madan et al. (2014) | Historical Price | Generalized Linear Model | Next 10 min | 0.57 |
| Sattarov et al. (2020) | Twitter + Historical Price | Sentiment Analysis | Next 30 min | 0.62 |
| Sin and Wang (2017) | Historical Price | Artificial Neural Network | Next Day | 0.60 |
| McNally et al. (2018) | Historical Price | Long Short-Term Memory | Next Day | 0.52 |
| Kinderis et al. (2018) | Social Media (Twitter) + Historical Price | Linear Discriminant Analysis | Next Day | 0.67 |
| Atsalakis et al. (2019) | Historical Price | Artificial Neural Network PATSOS Neuro-Fuzzy Controller Forecasting | Next Day | 0.67 |
| Arguelles (2018) | Historical Price | Support Vector Machine | Next Day | 0.62 |
| Kurbucz (2019) | Transaction Network | Single Hidden-Layer Feedforward Neural Networks | Next Day | 0.60 |
Table 2.
Transaction segmentation used in predicting the direction of the change in Bitcoin price.
| Transaction Amount Segment | Total # of Transactions | Mean # of Transactions per Block |
|---|---|---|
| (0, 0.1] BTCs | 145,731,106 | 448 |
| (0.1, 0.5] BTCs | 38,978,755 | 120 |
| (0.5, 1] BTCs | 12,944,521 | 40 |
| (1, 5] BTCs | 18,690,349 | 57 |
| (5, 10] BTCs | 5,199,054 | 16 |
| (10, 25] BTCs | 5,071,494 | 16 |
| (25, 50] BTCs | 2,677,391 | 8 |
| (50, 100] BTCs | 1,592,056 | 5 |
| (100, 200] BTCs | 887,452 | 3 |
| (200, 500] BTCs | 758,835 | 2 |
| (500, 1000] BTCs | 226,882 | 1 |
| (1000, 5000] BTCs | 150,458 | 0.5 |
| (5000, 10,000] BTCs | 37,608 | 0.1 |
| (10,000, 50,000] BTCs | 18,042 | 0.05 |
| (50,000, ∞] BTCs | 529 | 0.002 |
Table 3.
Direction of Bitcoin price movement prediction.
| Direction of Bitcoin Price Movement Prediction | ||||||
| Using Transaction Volume Changes | ||||||
| Model | Hist. Price | Trans. Volume | Month F.E. | Day/Night F.E. | Accuracy | F-1 Score |
| LSTM | Yes | Yes | No | Yes | 0.631 | 0.773 |
| LSTM | Yes | Yes | Yes | Yes | 0.631 | 0.768 |
| Logistic Regression | No | Yes | No | No | 0.599 | 0.663 |
| Logistic Regression | Yes | Yes | Yes | Yes | 0.596 | 0.652 |
| Logistic Regression | Yes | No | Yes | Yes | 0.532 | 0.585 |
| Logistic Regression | Yes | No | No | No | 0.496 | 0.497 |
| Direction of Bitcoin Price Movement Prediction | ||||||
| Using Transaction Proportion Distribution Changes | ||||||
| Model | Hist. Price | Trans. Volume | Month F.E. | Day/Night F.E. | Accuracy | F-1 Score |
| LSTM | Yes | Yes | Yes | Yes | 0.636 | 0.778 |
| LSTM | Yes | Yes | No | Yes | 0.635 | 0.777 |
| Logistic Regression | Yes | Yes | Yes | Yes | 0.538 | 0.586 |
| Logistic Regression | Yes | Yes | No | Yes | 0.535 | 0.592 |
Table 4.
Price movement by the change in the number of transactions.
| Segment | t − 1 | t − 2 | t − 3 | t − 4 | t − 5 | t − 6 |
|---|---|---|---|---|---|---|
| (0, 0.1) | *** | *** | *** | *** | *** | *** |
| (0.1, 0.5) | *** | *** | * | |||
| (0.5, 1) | *** | *** | *** | ** | ||
| (1, 5) | *** | *** | *** | *** | *** | *** |
| (5, 10) | *** | *** | *** | *** | *** | *** |
| (10, 25) | *** | * | ||||
| (500, 1000) | * | * | ||||
| (1000, 5000) | * | |||||
| (5000, 10,000) | * | * |
Significant codes: *** 0.001; ** 0.01; * 0.05.
Disclaimer/Publisher’s Note: The statements, opinions and data contained in all publications are solely those of the individual author(s) and contributor(s) and not of MDPI and/or the editor(s). MDPI and/or the editor(s) disclaim responsibility for any injury to people or property resulting from any ideas, methods, instructions or products referred to in the content. |
© 2024 by the authors. Licensee MDPI, Basel, Switzerland. This article is an open access article distributed under the terms and conditions of the Creative Commons Attribution (CC BY) license (https://creativecommons.org/licenses/by/4.0/).
Share and Cite
MDPI and ACS Style
Zhang, Y.; Garg, R.; Golden, L.L.; Brockett, P.L.; Sharma, A. Segmenting Bitcoin Transactions for Price Movement Prediction. J. Risk Financial Manag. 2024, 17, 128. https://doi.org/10.3390/jrfm17030128
AMA Style
Zhang Y, Garg R, Golden LL, Brockett PL, Sharma A. Segmenting Bitcoin Transactions for Price Movement Prediction. Journal of Risk and Financial Management. 2024; 17(3):128. https://doi.org/10.3390/jrfm17030128
Chicago/Turabian StyleZhang, Yuxin, Rajiv Garg, Linda L. Golden, Patrick L. Brockett, and Ajit Sharma. 2024. "Segmenting Bitcoin Transactions for Price Movement Prediction" Journal of Risk and Financial Management 17, no. 3: 128. https://doi.org/10.3390/jrfm17030128