
Abstract
This study presents a novel approach contributing to our understanding of the design, development, and implementation AI-based systems for conducting double-blind online randomized controlled trials (RCTs) for higher education research. The process of the entire interaction with the participants (n = 1193) and their allocation to test and control groups was executed seamlessly by our AI system, without human intervention. In this fully automated experiment, we systematically examined eight hypotheses. The AI-experiment strengthened five of these hypotheses, while not accepting three of the factors previously acknowledged in the literature as influential in students’ choices of universities. We showcased how AI can efficiently interview participants and collect their input, offering robust evidence through an RCT (Gold standard) to establish causal relationships between interventions and their outcomes. This approach may enable researchers and industry practitioners to collect data from large samples on which such experiments can be conducted with and by AI to produce statistically reproducible, reliable, and generalizable results in an efficient, rigorous and ethical way.
1 Introduction
AI-based technologies can tailor user experiences and facilitate rapid, efficient data collection. This ability enables them to harness big data and drive significant advancements across a wide range of domains, in research and beyond (Boyd & Crawford, 2012). Among these AI technologies, chatbots, also known as virtual agents and conversational assistants, have become increasingly prevalent in business operations and marketing. They are versatile tools with diverse applications, ranging from customer service and education to healthcare and public information dissemination. Their ability to drive efficiency and improve user experiences makes them invaluable assets across a plethora of fields. The healthcare sector, for example, has recognized the value of AI-driven chatbots as therapists and motivators for patients seeking mental guidance (Pandey et al., 2022). The public sector has also embraced chatbot integration, leveraging them on government websites and social media platforms to respond to customer queries and disseminate vital information. For instance, Androutsopoulou et al. (2019) found that chatbots were instrumental in conveying political and social messages effectively. What is more, the Australian Taxation Office’s chatbot, Alex, has achieved an impressive 80% resolution rate for customer inquiries without human intervention (CX Central, 2019). In education, earlier studies found that chatbots aid learners in developing critical thinking and language skills (Goda et al., 2014). Although not many studies have hitherto investigated the utility of chatbots in education (Hwang & Chang, 2023), a systematic literature review (SLR) by Wollny et al. (2021) found that education-oriented studies mainly focussed on the role chatbots play in pedagogy, mentoring (i.e., student’s personal development), and adaptation (e.g., assessing student’s knowledge, ability, interest, confidence). This was in line with another SLR which found that educational chatbots are predominantly used to improve either student learning or services provided for them (Pérez et al., 2020). According to Sidaoui et al. (2020), chatbots have the capacity to transition from their conventional passive role as information sources to proactive interviewers. In this more active role, they can collect customized data and pose questions based on the input provided by respondents. As a result, interviews conducted through AI-powered chatbots have the potential to become a widely adopted and efficient method for gathering qualitative data, particularly when exploring subjective social phenomena in depth.
Widely considered the gold standard for measuring the efficacy of interventions, RCT (Randomized Controlled Trial) is a type of experiment that encompasses randomly assigning subjects into control and experimental groups to compare the effects of given interventions. The random allocation of participants helps minimize bias and ensures that each group is representative of the overall population being studied. The strength of RCTs lies in their ability to provide strong evidence for establishing a causal relationship between the intervention and its outcomes. Building upon the interview-like survey and AI-based chatbot design developed by Cingillioglu et al. (2024), in this study, we demonstrated, compared, and validated students’ university choice factors. The data for both papers were collected from the same source. The difference of this paper from Cingillioglu et al. (2024) is twofold: (1) We showcased and compared the likelihood of students’ matriculation decision factors by Control and Experimental groups through the lenses of an AI-driven RCT, while Cingillioglu et al. (2024) used the same experiment to identify the decision factors impacting students’ matriculation decisions through the lenses of educational research. (2) We used and analyzed supporting data of all participants providing eight structured responses aligning with and validating the RCT results for each of the eight decision factors under examination, while Cingillioglu et al. (2024) used no such supporting data for validation. The methodological and scoping extension of this study not only fortifies the integrity and reliability of each hypothesis but also serves to reinforce the outcomes gleaned from the RCT. Hence, we can build upon existing knowledge by exploring the integration of AI technology in RCTs, discussing its implications for research efficiency, statistical power, and ethical conduct. Based on these new findings, we also discuss the significance of AI-driven research methodology and how we can take a leap from traditional RCTs. Finally, we provide scenarios and recommendations for future research.
2 Literature review
2.1 Chatbots in education
The integration of chatbots in education has garnered significant attention in recent years, prompting researchers to explore their impact on various facets of the learning environment. An SLR by Pérez et al. (2020) found that prior studies have explored the concept of chatbots mostly as interactive assistants, revealing their potential to support and engage students in the learning and service process. Another SLR by Okonkwo and Ade-Ibijola (2021) found that chatbot technology has been applied across diverse educational domains, encompassing teaching and learning (66%), administration (5%), assessment (6%), advisory roles (4%), as well as research and development (by students) (19%). They also identified the benefits and practical challenges associated with using chatbots in educational settings. Their findings highlighted the significance of chatbots in addressing the diverse needs of students, as well as in automating administrative tasks, alleviating the burden on educators, and allowing them to focus on more personalized interactions. By addressing challenges in education, such as resource constraints and teacher shortages, chatbots are considered to automate administrative tasks, enabling educators to focus on personalized interactions (Wollny et al., 2021).
More recently, chatbots are increasingly seen as catalysts for personalized learning, analysing individual learning patterns and preferences to tailor content delivery and adapt instructional methods (Chocarro et al., 2023). Accordingly, research by Gimhani et al. (2023) delved into the realm of student engagement, underscoring how chatbots contribute to sustained interest through natural language processing and gamification elements. In addition to allowing for real-time adjustments to individual learning paces, by simulating conversational learning experiences, chatbots were found to enhance interactivity, making the educational process not only informative but also enjoyable (Kuhail et al., 2023). The gamification aspects introduced by these studies have set a precedent for incorporating game-like elements to sustain student engagement (González et al., 2023). As the field matures, researchers have also begun to grapple with ethical considerations surrounding the use of chatbots in education (Kooli, 2023).
2.2 Chatbots for interviews
With an ability to customize user experience and allow fast and efficient data collection, AI-based technologies can generate big data to make significant progress in a plethora of research and non-research areas (Boyd & Crawford, 2012). Chatbots also commonly referred to as virtual agents and conversational assistants are a form of AI-based technology that have increasingly been used in business operations and marketing to enhance customer satisfaction by delivering simple and fast information (Arsenijevic & Jovic, 2019). Chatbots have been used in education to help learners develop their critical thinking and language skills (Goda et al., 2014). There has also been a growing demand to utilize AI-led chatbots in healthcare to provide guidance, education, and prompt behaviour change for patients (Pandey et al., 2022). Likewise, in public sector chatbots have been integrated to government websites and social media to disseminate essential information, steer users through online services such as tax return submission inquiries (Australian Taxation Office’s chatbot Alex has resolved 80% of customer inquiries without human intervention (CX Central, 2019) and communicate political and social messages (Androutsopoulou et al., 2019).
Chatbots have the potential to take up the role of an interviewer by shifting from its traditional passive role of being a source of information to a more active role of collecting customized data and asking questions based on respondent input (Sidaoui et al., 2020). Therefore, interviews conducted via AI-powered chatbots may emerge as a widely used and efficient approach for gathering qualitative data that are pertinent to exploring subjective social phenomena in depth.
Due to their AI-augmented capabilities, chatbots have evolved into so much more than not just traditional qualitative interviews but also interactive online surveys. As discussed by Sidaoui et al. (2020) and shown in Table 1, chatbot interviews possess the benefits of a combination of the advantages of both online surveys (low cost, scalable, fast deployment, flexible availability, real-time analysis) and traditional interviews (rich data collection, customized, engaging) except for being able to detect body language and ladder questions like a human interviewer.
Chatbots can interact with users and inquire about their opinions and experiences by engaging in narrative conversations leveraging algorithms based on semantic and sentiment analysis (Sarkar, 2016). Chatbot interviews, unlike traditional interviews and online surveys, can engage respondents with conversational tools and materials in multiformat (text, speech, 2D and 3D images), adapt to the personality of interviewee, and leverage data mining techniques to extract meaning and intention from responses to potentially (Park et al., 2019).
A comparative field study found that the responses obtained by a conversational chatbot guided survey were clearer, more informative, specific, and relevant than the ones collected by a web survey on Qualtrics (Ziang et al., 2020). Kim et al. (2019) concluded that a chatbot survey generated higher-quality data than a web survey and another study that compared user experience between an AI-powered chat survey and a conventional computer survey revealed that users would rather interact with the chatbot than fill in a computer questionnaire (Te Pas et al., 2020). Chatbots were found to offer a higher level of user experience than online surveys do as respondents thought that the experience of engaging and conversing with chatbots was more fun than simply filling out online questionnaires. Although users knew that they were not interacting with a human but a machine, they preferred having such an experience to being alone in front of a form.
Furthermore, advanced chatbots use customized information about respondents during conversation to build rapport and provide personalized guidance allowing respondents feel at ease and develop a sense of ownership and commitment to the study (Reicherts et al., 2022). Customized data can be anything from the name of the respondent to background info, to a number, time, to a specific experience, to a personal choice. When a respondent provides such information at some point, the chatbot records and uses them as needed throughout the conversation. Because respondents see for themselves that they are being listened to and how their responses are valued, they are more inclined to provide more in-depth, accurate and richer information whilst conversing with a chatbot than they do while completing online forms. However, current chatbot technologies are not advanced enough to recognize verbal responses as accurately as humans do.
2.3 Electronic word of mouth
In early literature, Westbrook (1987) defined word-of-mouth (WOM) as a type of communication informing other consumers about the ownership, features or usage of products or their pre- and post-purchasing experience with sellers. Research indicated that consumers consider WOM a more reliable source of information than traditional media such as radio, TV, and print ads (Steffes & Burgee, 2009). Murray (1991) posited that consumers trust WOM to lower their perceived risk in their purchase decisions. Since consumers usually rely more on other consumers than sellers (Walsh & Mitchell, 2010). WOM can significantly impact the purchasing behaviour of buyers (Villanueva et al., 2008) and is regarded as one of the most powerful sources of information shaping the decision-making of consumers (Jalilvand & Samiei, 2012; Huete-Alcocer, 2017).
Online or electronic Word-of-Mouth (eWOM), facilitated by the internet, serves as a digital counterpart to traditional offline WOM. Much like traditional WOM, eWOM involves the exchange of opinions—whether positive or negative—concerning consumers’ prior experiences with products or services (Steffes & Burgee, 2009). Despite the online nature of eWOM, which may often hinder the audience’s ability to judge the trustworthiness of information providers and their comments, research consistently showed that consumers heavily depend on eWOM in their decision-making processes (Lopez & Sicilia, 2014; Yan & Wu, 2018).
2.4 Chatbot surveys
Surveys are a robust data collection method to draw inferences to populations (Couper, 2017). Through the intermediary of emerging technology, surveys allow researchers to collect big data from massive samples. Although traditional paper-based surveys have a fixed questionnaire making respondents answer the same questions in a fixed order, interactive web surveys have the ability to validate responses, check for unacceptable answers or blank answers (Kizilcec & Schneider, 2015) and customize questions or the order of questions as per the preceding responses (Christian et al., 2009).
Interactive web surveys, however, are not built for narrative data collection like interviews are. Typically, in interviews people are asked structured, semi- or un-structured questions and their verbal answers are recorded as part of a conversation. Due to respondents being an active participant in a mutual verbal conversation containing probing, follow-up or laddering questions, interviews tend to have a higher completion rate and more potential to collect thick data (adding context as to why and how data eventuate) than interactive web surveys (Nishant et al., 2023).
Albeit powered by AI, chatbots are not equipped to understand human language unless they are specifically trained with datasets that tell them how to interpret and respond to specific words, phrases and sentences that might come up during a conversation with a human respondent (Sweeney et al., 2021). Using natural language processing (NLP) techniques such as topic modelling, aspect mining and sentiment analysis, AI-led chatbots can aim to detect and extract relevant information from sentences as every term and groups of terms used in a sentence get constantly compared against their training database (Meng et al., 2023). However, it is not uncommon where a response includes terms that have not been covered by the database. In that case, the AI fails to understand the respondent, and hence can neither record the response promptly nor provide an adequate answer to the response or generate a rational follow-up question (Ziang et al., 2020).
A vital feature of chatbot surveys is that they offer multiple choices to respondents. Due to the tree structure allowing researchers to frame the domain of their interest in accordance with a specific data collection goal, chatbots with a survey design can be more effective in terms of user experience than others that are designed to interpret open-ended/free text responses (Kuhail et al., 2023). Although the information provided by respondents with free text can lead researchers to richer insights than those collected from multiple choices, there is a trade-off. Because of the inherent complexities and challenges of interpreting free text, in cases where the chatbot fails to understand user response, users might quickly get disappointed and discontinue the conversation (Rhim et al., 2022). This results in low response and completion rates. Unlike free text interpreting chatbots, chatbot surveys that provide multiple choices do not suffer from such issues because their AI have already been trained with each choice and each chatbot response or question is logically connected to the preceding choice selected by the user. Therefore, survey design allows for a smooth transition from a chatbot question to a human response, and from a human response to a follow-up question.
Another major benefit of chatbots with survey design is that there is limited or no need for processing natural language during data collection and preparation for analysis. Since the AI of chatbot surveys has previously been trained with the terms of each choice, it does not have to apply NLP techniques to recognize and interpret the responses (Vannuccini & Prytkova, 2023). Whereas the relevancy and accuracy of collected data are subject to the performance of NLP technologies while processing open-ended text, with their tree structure via multiple choices, chatbot surveys collect and record relevant data that are immune to false recognition and misinterpretation (Park et al., 2022).
3 Methodology
3.1 Chatbot architecture
We designed an AI-led interview-like survey, powered by IBM’s virtual chatbot agent, Watson Assistant, to gather open-ended qualitative and structured quantitative data, and ran a double-blind experiment to determine the factors impacting students’ matriculation decisions (Fig. 1). The AI-led chatbot (AILC) that we built for this study (i.e., collecting data from and running an experiment on participants) has a nested tree structure comprised of conditional nodes and branches guiding the participant back to a relevant part of the conversation. It is capable of processing open-ended natural language responses, recognizing all plausible responses, reprompting implausible ones and compensating for misunderstandings. This is possible because it is equipped with a confirmation feedback mechanism (Confirmatory Feedback Loop (CFL)) allowing the AILC to guide or redirect the human respondent (RRP: Redirection via Rephrase Prompt) when needed and confirm the allocation of an identifiable and relevant response to its pre-assigned code. As a result, structured quantitative data and unstructured qualitative data are produced as final output. Structured data are utilized to draw causal inferences between each tested independent variable (IV) (e.g., Campus location (proximity to home, convenience, and comfort), safety and physical appeal, and vibe of the city) and dependent variable (DV) (Student preference (i.e., university choice)). AILC is designed to run the experiment unsupervised making double blind and random allocations, conversing with, and collecting information from participants, and storing data in structured and unstructured form to be either analysed for causal inference or passed back to its internal model for recalibrations applicable to future experiments (See Experiment Design next).

Flowchart of the training and deployment of AI-led chatbot (AILC), double-blind participant allocation, attaining causal inference through structured primary data and subsequent training of AILC with updated factors based on the initial experiment’s structured and unstructured primary data. Note. CTRL: Control Group; SSQ: Semi-structured Questions; CFL: Confirmatory Feedback Loop; NLP: Natural Language Processing; N: Total number of participants being recruited from Prolific. *: Supervised; **: Semi-supervised; ***: Unsupervised
A novel feature of the AILC is its capability to randomly assign anonymous participants to the Control and Test groups in a fully unsupervised way. Although potential participants are aware of the general context of the study (assuming they read the content provided in consent forms properly), they are unaware of to which group (i.e., CTRL or one of the Test Groups) they are allocated. Due to the unsupervised nature of this process, the researchers are also entirely unaware of this allocation. However, for post-experiment checking, we (researchers) were able to see to which groups all the participants were allocated. This was made possible with nine distinct Random Allocation (RA) codes assigned to each one of the nine groups by the AI.
AILC simulates a one-on-one interview by engaging respondents and prompting them with follow-up and laddering questions. However, unlike traditional interviews, the form of interaction capability we integrate to this chatbot is textual rather than verbal. We opted not to use a voicebot so as not to sacrifice the voice/speech recognition accuracy of verbal responses during their speech-to-text conversion. Chaves et al. (2022) demonstrated that language variation in terms of register characteristics may significantly impact user experience and understanding. Since interviews are generally expected to have a verbal nature, we do not describe our data collection methodology as an interview, but due to its textual form of interaction, we named it a chatbot-led interview-like survey.
3.2 Experiment design
We adopted a goal-oriented adaptive experiment design through which the experiment platform is run automatically by the AI and the design of a new experiment is based on the outcomes of its predecessors. Upon running the experiment, the AI produces structured output which are used to draw causal inferences and update the structure and constructs of subsequent experiments. For instance, if a decision factor (i.e., IV) is found to have no causal relationship with the DV, its ‘entity’ is removed from the new experiments’ design along with its input prompts in the dialogue. As a result, new participants will not be asked or prompted with semi-structured questions about this factor anymore unless a new experiment captures it as unstructured input and puts it back in the internal model. This logic is utilized not only to remove factors but also to introduce new factors as the AI records unstructured output, typically in free-text format, which is later explored by the AI and human researchers through content analysis. The resulting insights are then integrated into the internal model to capture further insights about the phenomenon. This cycle is adaptive and iterative in nature in a way that the constructs and parameters of new experiments are conditioned upon the collected, collated, measured, and processed results of former experiments. The adaptable nature of the AI-driven experiment design can also potentially enhance the efficient allocation of resources, such as determining the appropriate sample size, for future experiments based on the statistical measures (e.g., Cohen’s d, Power) applied to the preceding experiments.
3.2.1 Hypotheses
We developed the following hypotheses to make causal inferences regarding what factors in the form of positive eWOM from social media impact students’ university choices.
H0: Social media content in the form of positive eWOM about a university has no effect on students’ likelihood to enrol in that university.
H1: Positive eWOM on social media about a university’s reputation, image, and ranking increases the likelihood for students to enrol in that university.
H2: Positive eWOM on social media about a university’s living and study costs, availability of scholarships and access to technology, research, and facilities increases the likelihood for students to enrol in that university.
H3: Positive eWOM on social media about a university’s work and internship placements during study and job prospects upon graduation increases the likelihood for students to enrol in that university.
H4: Positive eWOM on social media about a university’s ease of admission, entrance requirements and open communication with admissions staff increases the likelihood for students to enrol in that university.
H5: Positive eWOM on social media about a university’s campus location including proximity to home, convenience and comfort, safety, physical appeal, and vibe of the city increases the likelihood for students to enrol in that university.
H6: Positive eWOM on social media about a university’s availability, flexibility and attractiveness of the course and on-campus support services increases the likelihood for students to enrol in that university.
H7: Positive eWOM on social media about students’ prior knowledge of the study destination increases the likelihood for students to enrol in that university.
H8: Positive eWOM on social media about a university’s collaboration with other universities increases the likelihood for students to enrol in that university.
3.2.2 Group formation and the constant
We adopt a true experimental research design to establish causation between independent and dependent variables. Globally recruited participants are randomly allocated to a Control and 8 Experimental (Test) Groups to prove the hypotheses. Conditions in all groups are the same except for a single condition applied to each different experimental group at a time. The participants are distributed to one of the 9 groups randomly without knowing the conditions to which they are subject, or to which group they belong (blind allocation). To maximize the benefits of a true experiment and eliminate any potential confirmation or researcher bias, thus avoid false positive conclusions, we implement a double-blind experimental design. Since simple randomization allows for complete randomness of the allocation of a participant to a specific group (Suresh, 2011), the random allocation of the participants to the groups was handled by the chatbot using a simple randomization algorithm. As a result, not only the participants, but we (researchers) are unaware of who is allocated to which group and subject to which intervention.
With this true experimental double-blind design including 1 control and 8 experimental groups, the AILC, which we named Sydn-e, randomly allocates 1193 participants to one of the 9 groups. Participants in all groups receive the same information (Constant) about studying at a university. The text of the Constant was extracted from the webpages of the top five ranked (by Times Higher Education 2022) universities in the world: University of Oxford, California Institute of Technology, Harvard University, Stanford University, and University of Cambridge. We deliberately selected general phrases that are commonly used by many other universities around the world and do not identify or distinguish these universities in any way. Furthermore, to achieve commonality and moderation, we refrain from using distinguishing words such as “leading”, “top’, and “best”. The participants are anticipated to construe the statements of the Constant as originating from a single university.
Constant:
We offer a range of precious opportunities for personal growth and professional development as well as combine rich history and tradition with the innovative and forward-thinking approach of a modern university. Our students create and apply knowledge by thinking and doing, preparing for leadership in a rapidly changing world. Courses, taught by esteemed faculty members and enhanced by our unparalleled libraries and resources, will take you as far as your imagination allows. Here, you’re going to be part of a community—one where everybody works hard, but that also takes a breather every now and then. In fact, the students who do best here already have some kind of outlet, such as theater, athletics, or the arts.
3.2.3 Interventions
We identified 9 matriculation decision factors from literature (Cingillioglu et al., 2023). One of them is eWOM which we deemed not an actual decision factor but simply a key channel for prospective students to be informed about and consider other decision factors while selecting a HEI. Therefore, we incorporated eWOM as a means to relay information during the chat about the rest of the identified factors. For example, participants who were assigned at random to Experimental Group 3 by the AI were provided with positive eWOM information regarding work and internship placements during study and job prospects upon graduation. They received the following text: “Imagine you read the following post about this University on social media:
This University helped me find a good internship while studying which led to my first full-time job at a reputable firm after graduation… Moreover, you read this message about the same University on social media: I know for a fact that this University has a great career network, plenty of opportunities …” In addition to the Constant, except for the ones in the Control group (CTRL), participants in the 8 experimental groups (EGs) were exposed to a different set of information (Intervention) presented in the form of positive eWOM on social media highlighting a distinct factor that may influence their choice about studying at a hypothetical university.
The 8 independent variables (IVs) employed as interventions for the 8 EGs comprised: IV1: University reputation, image and ranking, IV2: Living and study costs, availability of scholarships and access to technology, research and facilities (buildings, libraries, science labs, etc.); IV3: Work and internship placements during study and job prospects upon graduation, IV4: Ease of admission, entrance requirements and open communication with admissions staff; IV5: Campus location (proximity to home, convenience and comfort), safety and physical appeal, and vibe of the city; IV6: Availability, flexibility and attractiveness of the course (in line with career aspirations and earning potential) and on-campus support services; IV7: Prior knowledge of the study destination; and IV8: Collaboration with other universities. Each EG and its corresponding IV were allocated a number (from 1 to 8) and tested against the CTRL Group (Table 2).
We then tested the effect of each IV independently on a single dependent variable (DV): The likelihood of the participant to enrol in this university. We used a 5-point Likert scale (5: Absolutely; 4: Yes, why not; 3: Not sure; 2: Not really; 1: No way) to measure the decisions of participants in a hypothetical scenario assuming that they are about to make a university choice based on the information they read in the Constant and/or one of the eight Interventions (i.e., IVs) conveyed in the form of positive eWOM.
3.2.4 Interview strategy
While devising the interview questions and strategy, we programmed the AILC (Sydn-E) to ask open-ended and semi-structured questions (SSQ) to surface rich information and while staying focused on the objectives of the study. These questions have been carefully crafted to be both easily comprehensible and to maintain a sense of sensibility, relevance, and neutrality. As a strategy, we start off with questions that the respondents can easily answer such as “Are you currently studying at a university?” and “when did you start?” Then we proceed to more intricate matters such as factors that may have affected their matriculation decision and whether eWOM had any impact on their decision. We aim to put participants at ease and build up rapport and confidence with them. As a result, we aim to see that they open up and provide rich insights improving the depth and quality of the information collected.
Throughout the interviews, Sydn-E does not interfere with the respondents’ story telling at any stage even if they go off topic. However, Sydn-E utilizes confirmatory feedback loop (CFL) to bring respondents back on track if necessary. Since it is our main goal to extract information about the matriculation decision factors, respondents are prompted to not only determine the level of importance for all pre-coded and defined factors but also talk about any other non-defined factors that may impact their university choices.
3.2.5 Participant recruitment
We used Prolific to recruit participants from all around the world (Fig. 2) with an age range spanning from 18 to 30 years. The mean age of the sample was 25.6 years (SD = 2.1). The distribution of gender was balanced, with 48.5% female and 51.5% male participants. Our selection criteria included individuals who had completed high school, were using at least one social media platform, and were native English speakers. To avoid sampling participants from only a small number of countries, we posted the chat survey on Prolific at five different times. We also activated the option on Prolific allowing us to exclude participants who have already been recruited in the previous instances of the survey. As a result, we could maintain a more balanced representation of the true population covered by all habitable continents in the world and thus improve the study’s external validity.

Distribution of the count of study time (i.e., year); domestic and international students; study locations, and study status. Note (1) Study Time question: “When did you start studying there?”Note (2) Domestic/International student question: “Would you consider yourself a domestic or international student?” Note (3) Study Location question: “Where is it?” (The higher education institution). Note (4) Study Status question: “Are you currently studying at a higher education institution?” Yes: “Yes, I am.” | no_butintendto: “No, but I intend to enrol in one.” | no_infive: “No, but I was enrolled in one in the last 5 years.” | no_outfive: “No, but I was enrolled in one more than 5 years ago.” Note (5) Null values in Study Time: Since some of the participants are not current students or have not studied before but intend to enrol in a HEI (responded to the Study Status question as: “No, but I intend to enrol in one”), they did not answer “When did you start studying there?” question. In the dataset, these non-responses appear as NA (Not Available) thus have been aggregated upon one Null value
.
4 Results
In total, 1223 participants completed the chat survey. Sydn-E rejected 2.45% of them (30/1223) on the grounds of (1) intra-item inconsistency or (2) lack of attention or inadequate input. An example of (1): intra-item inconsistency is when a participant in EG1 (reputation & global ranking group) answered “Very unlikely” to the enrolment questions, but then answered “Very important” to the reputation and global ranking question. Sydn-E detected only 8 cases with this issue. When a participant entered meaningless text (e.g. just a number or nothing) or inadequate text (e.g. “ok”, “not sure”, “yes”, “of course”) in both open-ended questions, this was considered a case of (2): lack of attention or inadequate input. Sydn-E detected 22 cases with this issue.
Prolific provided Sydn-E with replacements for the participants who did not complete the survey or the ones whose submissions were rejected by Sydn-E (and confirmed by us manually). However, after we accepted the eligible participants on Prolific, we realized that 7 of them were duplicates (same participants). So, we removed their responses from analysis. As a result, our final sample size was 1193. Upon reviewing the allocation of participants to the CTRL and EGs, we observed that all of the groups met the minimum requirement of participant numbers (> 122), as determined earlier with the Power analysis.
4.1 Experiment results
4.1.1 Descriptive statistics
When we inspect the descriptive statistics pertaining to the Control (CTRL) and Experimental Groups’ (EGs) results, we notice that CTRL had the lowest mean (3.74), whereas EG1 had the highest mean (4.3) among all groups (Table 3). The EGs with the lowest means were EG4 (3.76), EG7 (3.83) and EG8 (3.91). The median of all groups was 4 except for EG1 which had a median of 5. We also notice that all groups contained between 122 and 144 participants (Table 3). This is in line with what we aspired to achieve in accordance with Power Analysis before Sydn-E ran the experiment. More importantly we found that 100% of the eligible participants were randomly allocated by Sydn-E to one of the nine groups seamlessly. This was because each participant could successfully confirm the RA code which was neither case nor whitespace sensitive and Sydn-E was capable of disambiguating, fuzzy matching, and handling typos.
4.1.2 Hypothesis testing results
As discussed earlier, we used both two-sample t-test for comparing the means between the Control Group and each one of the eight Experimental Groups, and Mann-Whitney U test (Wilcoxon rank-sum test) to determine whether there is a significant difference between the distributions of these compared groups. Importantly, the results of both tests were consistent (Table 4) indicating that the p-values of the following compared groups: CTRL & EG1, CTRL & EG2, CTRL & EG3, CTRL & EG5, and CTRL & EG6 were less than 0.001 (statistically significant); whereas the p-values of other groups, namely CTRL & EG4, CTRL & EG7, and CTRL & EG8 were larger than 0.1. Since five factors in five EGs (EG1, EG2, EG3, EG5, and EG6) were statistically significant, we can reject the Null hypothesis: H0: Social media content in the form of positive eWOM about a university has no effect on students’ likelihood to enroll in that university.
Specifically, Table 4 in tandem with Table 5 can be interpreted for each alternative hypothesis as follows:
H1: Positive eWOM on social media about a university’s reputation, image, and ranking increases the likelihood for students to enroll in that university. Since the p-values of both t-test and Mann-Whitney test for CTRL & EG1 are extremely small (< 0.001) and substantially less than the commonly used significance level of 0.05 and even 0.01, there is strong evidence against the null hypothesis (t-test: true difference in means is equal to 0; Mann-Whitney test: true location shift is equal to 0). Furthermore, the negative t-value (-4.774) suggests that EG1 has a higher mean compared to CTRL, and the 95% confidence interval (95%CI) provides the range [-0.747, -0.311] within which the true difference in means likely falls (Table 4). Therefore, we accept H1 and confirm that positive eWOM on social media about a university’s reputation, image, and ranking increases the likelihood for students to enroll in that university (Table 5).
H2: Positive eWOM on social media about a university’s living and study costs, availability of scholarships and access to technology, research, and facilities increases the likelihood for students to enroll in that university. Since the p-values of both t-test and Mann-Whitney test for CTRL & EG2 are extremely small (< 0.001) and substantially less than the commonly used significance level of 0.05 and even 0.01, there is strong evidence against the null hypothesis (t-test: true difference in means is equal to 0; Mann-Whitney test: true location shift is equal to 0). Furthermore, the negative t-value (-3.444) suggests that EG2 has a higher mean compared to CTRL, and the 95% confidence interval (95%CI) provides the range [-0.566, -0.154] within which the true difference in means likely falls (Table 4). Therefore, we accept H2 and confirm that positive eWOM on social media about a university’s living and study costs, availability of scholarships and access to technology, research, and facilities increases the likelihood for students to enroll in that university (Table 5).
H3: Positive eWOM on social media about a university’s work and internship placements during study and job prospects upon graduation increases the likelihood for students to enroll in that university. Since the p-values of both t-test and Mann-Whitney test for CTRL & EG3 are extremely small (< 0.001) and substantially less than the commonly used significance level of 0.05 and even 0.01, there is strong evidence against the null hypothesis (t-test: true difference in means is equal to 0; Mann-Whitney test: true location shift is equal to 0). Furthermore, the negative t-value (-4.482) suggests that EG3 has a higher mean compared to CTRL, and the 95% confidence interval (95%CI) provides the range [-0.647, -0.252] within which the true difference in means likely falls (Table 4). Therefore, we accept H3 and confirm that positive eWOM on social media about a university’s work and internship placements during study and job prospects upon graduation increases the likelihood for students to enroll in that university (Table 5).
H4: Positive eWOM on social media about a university’s ease of admission, entrance requirements and open communication with admissions staff increases the likelihood for students to enroll in that university. Since the p-values of both t-test and Mann-Whitney test for CTRL & EG4 are larger than the commonly used significance level of 0.05 and even 0.1, there is not enough evidence against the null hypothesis (t-test: true difference in means is equal to 0; Mann-Whitney test: true location shift is equal to 0). Furthermore, we also notice that the true difference in means falls within the 95%CI range of [-0.245, 0.206] (Table 4). Therefore, we cannot accept H4 and cannot state that positive eWOM on social media about a university’s ease of admission, entrance requirements and open communication with admissions staff increases the likelihood for students to enroll in that university (Table 5).
H5: Positive eWOM on social media about a university’s campus location including proximity to home, convenience and comfort, safety, physical appeal, and vibe of the city increases the likelihood for students to enroll in that university. Since the p-values of both t-test and Mann-Whitney test for CTRL & EG5 are extremely small (< 0.001) and substantially less than the commonly used significance level of 0.05 and even 0.01, there is strong evidence against the null hypothesis (t-test: true difference in means is equal to 0; Mann-Whitney test: true location shift is equal to 0). Furthermore, the negative t-value (-3.548) suggests that EG5 has a higher mean compared to CTRL, and the 95% confidence interval (95%CI) provides the range [-0.588, -0.168] within which the true difference in means likely falls (Table 4). Therefore, we accept H5 and confirm that positive eWOM on social media about a university’s campus location including proximity to home, convenience and comfort, safety, physical appeal, and vibe of the city increases the likelihood for students to enroll in that university (Table 5).
H6: Positive eWOM on social media about a university’s availability, flexibility and attractiveness of the course and on-campus support services increases the likelihood for students to enroll in that university. Since the p-values of both t-test and Mann-Whitney test for CTRL & EG6 are extremely small (< 0.001) and substantially less than the commonly used significance level of 0.05 and even 0.01, there is strong evidence against the null hypothesis (t-test: true difference in means is equal to 0; Mann-Whitney test: true location shift is equal to 0). Furthermore, the negative t-value (-3.681) suggests that EG6 has a higher mean compared to CTRL, and the 95% confidence interval (95%CI) provides the range [-0.595, -0.180] within which the true difference in means likely falls (Table 4). Therefore, we accept H6 and confirm that positive eWOM on social media about a university’s availability, flexibility and attractiveness of the course and on-campus support services increases the likelihood for students to enroll in that university (Table 5).
H7: Positive eWOM on social media about students’ prior knowledge of the study destination increases the likelihood for students to enroll in that university.Since the p-values of both t-test and Mann-Whitney test for CTRL & EG7 are larger than the commonly used significance level of 0.05 and even 0.1, there is not enough evidence against the null hypothesis (t-test: true difference in means is equal to 0; Mann-Whitney test: true location shift is equal to 0). Furthermore, we also notice that the true difference in means falls within the 95%CI range of [-0.310, 0.127] (Table 4). Therefore, we cannot accept H7 and cannot state that positive eWOM on social media about students’ prior knowledge of the study destination increases the likelihood for students to enroll in that university (Table 5).
H8: Positive eWOM on social media about a university’s collaboration with other universities increases the likelihood for students to enroll in that university. Finally, since the p-values of both t-test and Mann-Whitney test for CTRL & EG8 are larger than the commonly used significance level of 0.05 and even 0.1, there is not enough evidence against the null hypothesis (t-test: true difference in means is equal to 0; Mann-Whitney test: true location shift is equal to 0). Furthermore, we also notice that the true difference in means falls within the 95%CI range of [-0.375, 0.040] (Table 4). Therefore, we cannot accept H8 and cannot state that positive eWOM on social media about a university’s collaboration with other universities increases the likelihood for students to enroll in that university (Table 5).
To sum up, we accepted H1, H2, H3, H5, and H6, whereas we did not accept H4, H7, and H8. It should be noted that “not accepting” a hypothesis is not the same as “rejecting” it. We rejected the H0 because there is strong evidence that contradicts it. However, we could only “not accept” H4, H7, and H8 because there is insufficient evidence to accept them. By inspecting the interquartile range (IQR) of each group, we can also visually distinguish the experimental groups with accepted hypotheses (EG1: H1, EG2: H2, EG3: H3, EG5: H5, and EG6: H6) from the ones with non-accepted hypotheses (EG4: H4, EG7: H7, EG8: H8) (Fig. 3).
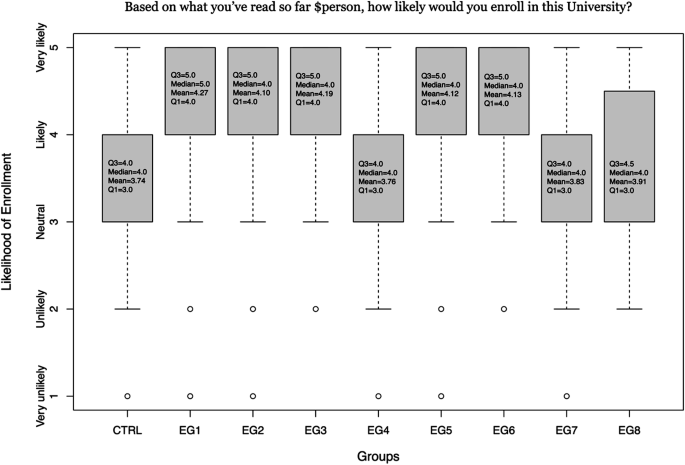
Likelihood of enrolment by control (CTRL) and experimental groups (EGs). IQR= [Q1:Q3]. Note. $person: name of the participant recorded at the beginning of the chat
4.1.3 Supporting data
As explained before, during the chat with Sydn-E after the experiment response was collected, all 1193 participants were asked to provide eight structured responses to the questions relating to all eight decision factors examined. Supporting the robustness and internal validity of each test, these responses bolster the results of the experiment. Descriptive statistics of these eight variables are shown in Table 6.
As shown in Table 5, “Uni_collab” and “Know_city” are the decision factors with the lowest Means (2.9 and 3.2 respectively), followed by “Ease_admis” (M = 4.0). These factors are the only ones that were not accepted in our hypothesis testing. Whereas the accepted factors, “Rep_rank”, “Work_opp”, “Cam_loc”, and “Cour_attr” yielded significantly higher means such as 4.2, 4.5, 4.3 and 4.4 respectively. It should be noted that the question for the “Cost” had a different structure from the rest of the questions as it was asking for “Which university would a participant prefer in terms of overall costs?” and the mean for all participants was 2.9 (slightly less than “Average” cost).
5 Discussion and implications
5.1 Students’ university choices
The pivotal juncture in the academic trajectory of prospective students lies in the discernment and selection of a university, a decision profoundly influenced by an amalgamation of multifaceted inputs emanating from diverse sources. Foremost among these influences are the unfiltered perspectives and experiences shared by both current and former students, providing an unblemished lens into the university’s value proposition. These unvarnished narratives encapsulate a spectrum of sentiments, spanning from overall satisfaction among students and faculty to contentment with academic rigor, campus life, and the pedagogical milieu. Testimonials and real-life experiences contribute substantively to a nuanced comprehension of the university’s ethos. Additionally, students’ feedback on specific courses and faculty members offers granular insights, enabling prospective students to tailor their choices in accordance with their educational preferences. Beyond the façade of embellished descriptions, there is an increasing proclivity among prospective students to seek unadulterated perspectives, ensuring well-rounded decisions aligned with both academic and personal aspirations.
In the minds of prospective students, the post-graduation landscape holds utmost significance. Information regarding the university’s provision of career services, post-graduation employment rates, the nature of employers recruiting from the institution, and the average post-graduation salary constitutes a critical determinant in the enrolment decision-making process. Furthermore, insights into placement opportunities and the intricacies of campus life bolster the appeal of a university and its programs as an efficacious springboard for a flourishing career. Equally pivotal are avenues for internships or work experiences, furnishing a practical trajectory for professional development.
Moreover, the regional, national, and global standing of a university is a salient consideration for prospective students, manifested in institutional rankings and the acknowledgment of prestige and reputation. The calibre of faculty members and their scholarly credentials contributes substantively to the overall academic milieu. Prospective students judiciously assess the educational quality of the university vis-à-vis other institutions, aspiring to align their academic pursuits with the loftiest standards and considering the societal context in which the university is situated. Financial considerations, encompassing scrutinization of scholarships, tuition costs, fees, payment modalities, and overall affordability, constitute pivotal determinants in the university selection process. Concurrently, prospects for employment while pursuing studies are sought after to navigate the financial intricacies of higher education. The geographical location of the university emerges as another fundamental consideration, as prospective students evaluate its proximity to public transportation, the safety of both the city and campus, the availability of local amenities, and the vibrancy of the town and its surroundings. Cultural and historical facets of the location further contribute to the overall allure of the university.
Contrary to earlier findings in extant literature, this study challenges established notions regarding the determinants of students’ university choices by examining three specific factors: the ease and flexibility of admission in HEIs (K. Massoud & Ayoubi, 2019), students’ pre-existing familiarity with the study destination (Shanka et al., 2006; Yet et al., 2011; Heathcote et al., 2020), and the collaborative engagements of HEIs with other institutions (Dowling-Hetherington, 2020). While prior research posited that these factors significantly influence students’ decisions in university selection, our innovative AI experiment refutes such assertions, demonstrating a lack of discernible impact. Notably, this study distinguishes itself by employing a RCT, acknowledged as the Gold Standard for establishing causation in this domain, marking a departure from conventional research methodologies. Consequently, the outcomes of this investigation prompt a re-evaluation of the aforementioned factors within the scholarly discourse, as they ought to be expunged from the canon of considerations influencing matriculation decisions in higher education.
5.2 Taking a leap from traditional RCTs
A goal-oriented adaptive AI system such as Sydn-E can substantially alleviate cost and resource limitations in conventional human-human RCTs by automating tasks, scaling up tasks, and streamlining data collection and analysis. Such AI-run experiments reduce the need for extensive human intervention and labor, offering efficient, cost-effective and quicker data collection through interviewing and experimentation, and improved data quality. AI’s adaptability and ability to replicate experiments consistently enhance the overall efficiency and reliability of research. This can allow for real-time monitoring of participants’ responses, immediate feedback, and adaptive adjustments to the experiment’s parameters, further improving the overall efficiency of data collection and analysis. Additionally, AI algorithms can uncover hidden patterns and insights within the data, contributing to a deeper understanding of the phenomena under investigation, all while minimizing the time and resource investments typically required in traditional RCTs.
AI-conducted experiments can – as demonstrated in this study - address statistical power limitations in traditional RCTs by leveraging the ability to work with larger and more diverse sample sizes. AI’s scalability allows for the engagement of a significantly higher number of participants, enhancing the statistical power of the study to detect even subtle effect sizes or differences that might be missed in smaller RCTs. Furthermore, continuous data collection facilitated by AI contributes to stronger statistical analyses by reducing measurement error and allowing for real-time trend and pattern detection. AI can also offer adaptive experimental design, dynamically adjusting parameters based on ongoing data analysis to optimize the allocation of resources, thereby further increasing statistical power. The efficiency of AI-driven data analysis and the ability to automate this process may enable researchers to analyze vast datasets, improving the study’s power to detect meaningful effects while saving time and resources. Additionally, AI’s subgroup analysis capabilities can uncover variations in treatment effects among different populations, potentially revealing insights that may be overlooked in smaller RCTs.
AI-conducted experiments can also augment statistical power through improved data quality. AI-driven data collection and analysis reduce measurement errors and ensure data accuracy, leading to more precise and reliable statistical estimates. Replicating experiments multiple times with high precision, a capability of AI, also contributes to the reliability and robustness of the findings, ultimately increasing statistical power. AI’s time efficiency accelerates the experimentation process, leading to faster data collection and analysis. This is particularly valuable for time-sensitive research questions, as quicker decisions and faster results can lead to improved statistical power. While AI’s potential to overcome statistical power limitations is significant, it’s crucial to emphasize that proper experimental design, careful consideration of confounding variables, and the elimination of potential biases remain essential to ensure that the increased statistical power translates into meaningful and valid findings. Additionally, the interpretation of results should be done with care, as larger sample sizes can lead to the detection of statistically significant effects that may not always be practically significant.
Experiments run by the AI can offer valuable means to address human biases in RCTs. Firstly, AI algorithms can automate the randomization and allocation of participants to treatment and control groups, eliminating the potential for selection bias that human researchers might introduce inadvertently. This impartial process ensures that not only the group assignments but also the allocation of interventions to groups is unbiased. AI can also play a pivotal role in preserving blinding protocols, ensuring that neither participants nor researchers are aware of their group assignments, thus reducing observer and participant biases. Such AI systems can also maintain consistency in data collection, reducing the potential for data collection biases that may arise when human researchers interpret or record data differently. Additionally, by automating data analysis, AI can identify patterns and relationships in the data objectively, minimizing confirmation bias that human researchers might introduce by seeking out data that aligns with their expectations.
Although AI systems are not influenced by experimenter biases, it is essential to acknowledge that they are not entirely free from biases, as they can inherit biases from their training data or algorithms. Therefore, careful design and oversight are crucial to ensure that AI is trained and implemented in a way that minimizes bias. Moreover, while AI can reduce certain forms of human bias, human researchers still play a pivotal role in setting the parameters, objectives, and ethical guidelines for AI-conducted experiments. The combination of AI and human oversight is critical to ensure the ethical and unbiased conduct of experiments. However, we should note that while our approach aims for efficiency and rigor, it does not inherently resolve all ethical concerns. The recruitment procedures employed in this study adhered meticulously to Prolific’s established ethical standards and regulatory guidelines and potential participants were accorded autonomy in determining their willingness to engage in the study. Nevertheless, the voluntary nature of participation introduces the potential for recruitment bias, given that individuals who opt to participate may possess distinctive characteristics or perspectives that could exert an impact on the outcomes of the study. Although conscientious efforts were undertaken to mitigate recruitment bias through transparent and impartial recruitment methodologies, it still remains an inherent potential limitation of this methodology.
AI can autonomously execute ethically sensitive decisions, such as withholding treatment from control groups, ensuring these decisions are carried out impartially. AI technology can prioritize data privacy and confidentiality, addressing concerns about the protection of sensitive participant information. However, it is necessary to design AI algorithms and systems with ethics in mind and to uphold ethical principles during their development and use. While AI plays a crucial role in addressing ethical concerns, human researchers and ethicists remain essential in setting ethical guidelines and ensuring AI technology aligns with these principles and respects participants’ rights and well-being. The collaborative effort between AI technology and human oversight is vital for conducting ethically sound experiments.
5.3 AI-driven research methodology
This study endeavours to advance the landscape of AI-driven research methodologies within the domain of education research, establishing a new trajectory that underscores AI’s profound potential in acquiring diverse forms and levels of data from a borderless and considerably large sample in an efficient, timely and rigorous manner. Circumventing human interference and biases, thus facilitating the establishment of causal relationships between interventions and their corresponding outcomes, this innovative paradigm seeks to transcend the dichotomy between technology and human perception, engendering a synergistic alliance wherein AI-driven data collection and experimentation garner widespread acceptance and confer benefits across various sectors endeavouring to glean insights from human opinions and experiences. Therefore, this approach does not emerge without the transformative capacity to empower researchers across diverse disciplines, equipping them to amass data from substantial sample sizes and yield results that are statistically reproducible, reliable, and broadly generalizable.
In the current epoch of burgeoning AI technologies, we find ourselves at a crucial juncture poised to cultivate a harmonious coexistence between AI and human elements. Together, these entities constitute the linchpin for addressing challenges and exploring the myriad possibilities not only within the sphere of human-AI interactions but also in instances where AI interfaces with human subjects. This synthesis encapsulates the quintessence of applying digital technologies to higher education research, reconciling technological innovation in empirical research with a profound understanding of human factors, thereby offering a holistic and comprehensive approach to scholarly inquiry and discovery. The significance of this novel AI-led interview-like survey architecture hence lies not merely in its operational prowess but in its potential to reshape the whole landscape of research methodologies and promote an adaptive and constantly evolving relationship between AI and human elements. In essence, this architecture represents a pioneering methodological advancement in education research and serves as a cornerstone for ushering in a new era, where the fusion of AI and human-centric insights promises to redefine the boundaries of research methodologies, offering unparalleled efficiency, objectivity, and scalability in the pursuit of knowledge.
6 Scenarios and recommendations for future research
The use of AI-based chatbots via randomized controlled trials to explore students’ university choices presents a promising avenue for enhancing academic decision-making processes. However, discerning the appropriateness of such methodologies across educational interview scenarios is imperative as they may be subject to limitations when confronted with complex emotional support needs or highly individualized circumstances necessitating personalized advice. Furthermore, considerations pertaining to accessibility, such as technological disparities or language barriers, pose notable challenges to the universal applicability of AI-based interventions, particularly in contexts where equitable access to resources is not assured.
Equally, the utility of AI-based chatbots may emerge prominently in scenarios characterized by the need for widespread dissemination of standardized information, routine query handling, and preliminary screening processes. Leveraging their capacity to efficiently provide generalized guidance and streamline initial inquiries, these chatbots facilitate efficient data collection from large samples while affording human advisors the opportunity to focus on more nuanced or personalized aspects of student support. Additionally, in the context of online interviews and RCTs, AI-powered chatbots, as demonstrated in this study, offer scalability and consistency in data collection processes, contributing to methodological robustness and facilitating the analysis of outcomes across geographically dispersed cohorts.
During the design and execution of AI-based chatbot architectures, researchers are advised to navigate multifaceted considerations to ensure methodological rigor and ethical integrity. Careful attention to the design of RCTs, including robust randomization procedures and standardized data collection protocols, is essential for generating reliable research output. Simultaneously, ethical guidelines must be upheld to safeguard participants’ rights and privacy, particularly in the context of online data collection. Furthermore, proactive measures to mitigate bias, foster inclusivity, and optimize user experience are all imperative for maximizing the effectiveness of AI-based interventions and ensure the generalizability of their outcomes. By meticulously addressing these considerations, researchers can harness the potential of AI to inform and guide decision-making processes and advance scholarly inquiry within the dynamic landscape of higher education.
7 Conclusion
With this paper, we aim to advance the field of AI-driven research methodologies in education, offering valuable insights into students’ matriculation decision factors. With an AI-augmented chatbot, we demonstrated the potential of AI in gathering data in an efficient manner and providing robust evidence via an RCT for establishing a cause-and-effect relationship between interventions and their results. By striking the right balance between technological innovation and ethical conduct, AI-driven data collection and experiments can be widely accepted and beneficial across all sectors. With the advent of progressive AI and its vast array of opportunities, the moment may have arrived to foster a harmonious relationship between AI and human factors. After all, together, they can successfully confront the challenges and embrace endless possibilities that arise from applications at not only where humans interact with AI but also where AI interacts with humans.
Data availability
Data may not be shared openly to protect study participants’ privacy. However, an anonymized version of the dataset may be made available upon reasonable request.
References
Androutsopoulou, A., Karacapilidis, N., Loukis, E., & Charalabidis, Y. (2019). Transforming the communication between citizens and government through AI-guided chatbots. Government Information Quarterly, 36(2), 358–367.
Arsenijevic, U., & Jovic, M. (2019). Artificial intelligence marketing: Chatbots. In International Conference on Artificial Intelligence - Applications and Innovations (IC-AIAI) (pp. 19–22). IEEE. https://doi.org/10.1109/IC-AIAI48757.2019.00010.
Boyd, D., & Crawford, K. (2012). Critical questions for big data information. Communication & Society, 15(5), 662–679.
Chaves, A. P., Egbert, J., Hocking, T., Doerry, E., & Gerosa, M. A. (2022). Chatbots language design: The influence of language variation on user experience with tourist assistant chatbots. ACM Transactions on Computer-Human Interaction (TOCHI), 29(2), 1–38.
Chocarro, R., Cortiñas, M., & Marcos-Matás, G. (2023). Teachers’ attitudes towards chatbots in education: A technology acceptance model approach considering the effect of social language, bot proactiveness, and users’ characteristics. Educational Studies, 49(2), 295–313.
Christian, L. M., Parsons, N. L., & Dillman, D. A. (2009). Designing Scalar questions for web surveys. Sociological Methods & Research, 37(3), 393–425.
Cingillioglu, I., Gal, U., & Prokhorov, A. (2023). Social media marketing for student recruitment: An algorithmically sequenced literature review. Journal of Marketing for Higher Education, 1–23.
Cingillioglu, I., Gal, U., & Prokhorov, A. (2024). Running a double-blind true social experiment with a goal oriented adaptive AI-based conversational agent in educational research. International Journal of Educational Research, 124, 102323.
Couper, M. P. (2017). New Developments in Survey Data Collection. Annual Review of Sociology, 43, 121–145.
CX Central (2019). How the Australian Tax Office is using a virtual assistant to improve self-service. Retrieved February 15, 2023, from https://cxcentral.com.au/advanced-technology/virtual-assistant-to-improve-self-service/.
Dowling-Hetherington, L. (2020). Transnational higher education and the factors influencing student decision-making: The experience of an Irish university. Journal of Studies in International Education, 24(3), 291–313.
Gimhani, R. M. D. G., Kumari, S., & Swarnakantha, N. R. S. (2023). Student Learning and Assessment Support System. International Research Journal of Innovations in Engineering and Technology, 7(10), 123.
Goda, Y., Masanori, Y., Matsukawa, H., & Hata, K. (2014). Conversation with a chatbot before an online EFL group discussion and the effects on critical thinking. The Journal of Information and Systems in Education, 13(1), 1–7.
González, C. S., Muñoz-Cruz, V., Toledo-Delgado, P. A., & Nacimiento-García, E. (2023). Personalized gamification for learning: A reactive Chatbot Architecture proposal. Sensors (Basel, Switzerland), 23(1), 545.
Heathcote, D., Savage, S., & Hosseinian-Far, A. (2020). Factors affecting university choice behaviour in the UK higher education. Education Sciences, 10(8), 199.
Huete-Alcocer, N. (2017). A literature review of Word of Mouth and Electronic Word of Mouth: Implications for consumer behavior. Frontiers in Psychology, 8.
Hwang, G. J., & Chang, C. Y. (2023). A review of opportunities and challenges of chatbots in education. Interactive Learning Environments, 31(7), 4099–4112.
Jalilvand, M. R., & Samiei, N. (2012). The impact of electronic word of mouth on a tourism destination choice: Testing the theory of planned behavior. Internet Research, 22(5), 591–612.
Kim, S., Lee, J., & Gweon, G. (2019). Comparing Data from Chatbot and Web Surveys: Effects of Platform and Conversational Style on Survey Response Quality. Proceedings of the 2019 CHI Conference on Human Factors in Computing Systems, 1–12. ACM Press, NY.
Kizilcec, R. F., & Schneider, E. (2015). Motivation as a lens to understand online learners: Toward data-driven design with the OLEI scale. ACM Transactions on Computer-Human Interaction (TOCHI), 22(2), 1–24.
Kooli, C. (2023). Chatbots in education and research: A critical examination of ethical implications and solutions. Sustainability, 15(7), 5614.
Kuhail, M. A., Alturki, N., Alramlawi, S., & Alhejori, K. (2023). Interacting with educational chatbots: A systematic review. Education and Information Technologies, 28(1), 973–1018.
Lopez, M., & Sicilia, M. (2014). eWOM as source of influence: The impact of participation in eWOM and perceived source trustworthiness on decision making. Journal of Interactive Advertising, 14(2), 86–97.
Massoud, K., H., & Ayoubi, R. M. (2019). Do flexible admission systems affect student enrollment? Evidence from UK universities. Journal of Marketing for Higher Education, 29(1), 84–101.
Meng, J., Rheu, M., Zhang, Y., Dai, Y., & Peng, W. (2023). Mediated Social Support for Distress reduction: AI Chatbots vs. Human. Proceedings of the ACM on Human-Computer Interaction, 7(CSCW1), 1–25.
Murray, K. B. (1991). A test of services marketing theory: Consumer information acquisition activities. Journal of Marketing, 55(1), 10–25.
Nishant, R., Schneckenberg, D., & Ravishankar, M. N. (2023). The formal rationality of artificial intelligence-based algorithms and the problem of bias. Journal of Information Technology.
Okonkwo, C. W., & Ade-Ibijola, A. (2021). Chatbots applications in education: A systematic review. Computers and Education: Artificial Intelligence, 2, 100033.
Pandey, S., Sharma, S., & Wazir, S. (2022). Mental healthcare chatbot based on natural language processing and deep learning approaches: Ted the therapist. International Journal of Information Technology, 14(7), 3757–3766.
Park, S., Choi, J., Lee, S., Oh, C., Kim, C., La, S., Lee, J., & Suh, B. (2019). Designing a Chatbot for a brief motivational interview on stress management: Qualitative case study. Journal of Medical Internet Research, 21(4), e12231.
Park, D-M., Jeong, S. S., & Seo, Y. S. (2022). Systematic review on Chatbot techniques and applications. Journal of Information Processing Systems, 18(1), 26–47.
Pérez, J. Q., Daradoumis, T., & Puig, J. M. M. (2020). Rediscovering the use of chatbots in education: A systematic literature review. Computer Applications in Engineering Education, 28(6), 1549–1565.
Prolific (2023). Prolific: A higher standard of online research. Retrieved February 22, 2023, from https://www.prolific.co.
Reicherts, L., Rogers, Y., Capra, L., Wood, E., Duong, T. D., & Sebire, N. (2022). It’s good to talk: A comparison of using voice versus screen-based interactions for agent-assisted tasks. ACM Transactions on Computer-Human Interaction (TOCHI), 29(3), 1–41.
Rhim, J., Kwak, M., Gong, Y., & Gweon, G. (2022). Application of humanization to survey chatbots: Change in chatbot perception, interaction experience, and survey data quality. Computers in Human Behavior, 126, 107034.
Sarkar, D. (2016). Semantic and Sentiment Analysis. In Text Analytics with Python: A Practical Real-World Approach to Gaining Actionable Insights from your Data (2016): 319–376. Apress, Berkeley, CA.
Shanka, T., Quintal, V., & Taylor, R. (2006). Factors influencing international students’ choice of an education destination–A correspondence analysis. Journal of Marketing for Higher Education, 15(2), 31–46.
Sidaoui, K., Jaakkola, M., & Burton, J. (2020). AI feel you: Customer experience assessment via chatbot interviews. Journal of Service Management, 31(4), 745–766.
Steffes, E. M., & Burgee, L. E. (2009). Social ties and online word of mouth. Internet Research, 19(1), 42–59.
Suresh, K. P. (2011). An overview of randomization techniques: An unbiased assessment of outcome in clinical research. Journal of Human Reproductive Sciences, 4(1), 8.
Sweeney, C., Potts, C., Ennis, E., Bond, R., Mulvenna, M. D., O’neill, S., Malcolm, M., et al. (2021). Can Chatbots help support a person’s mental health? Perceptions and views from mental healthcare professionals and experts. ACM Transactions on Computing for Healthcare, 2(3), 1–15.
Te Pas, M. E., Rutten, W. G., Bouwman, A. R., & Buise, M. P. (2020). User experience of a Chatbot Questionnaire Versus a regular computer questionnaire: Prospective comparative study. JMIR Medical Informatics, 8(12), e21982. https://doi.org/10.2196/21982.
Vannuccini, S., & Prytkova, E. (2023). Artificial Intelligence’s new clothes? A system technology perspective. Journal of Information Technology, 02683962231197824.
Villanueva, J., Yoo, S., & Hanssens, D. M. (2008). The Impact of Marketing-Induced versus Word-of-mouth customer Acquisition on customer equity growth. Journal of Marketing Research, 45(1), 48–59.
Walsh, G., & Mitchell, V-W. (2010). The effect of consumer confusion proneness on word of mouth, trust, and customer satisfaction. European Journal of Marketing, 44(6), 838–859.
Westbrook, R. A. (1987). Product/consumption-based affective responses and post-purchase processes. Journal of Marketing Research, 24(3), 258–270.
Wollny, S., Schneider, J., Di Mitri, D., Weidlich, J., Rittberger, M., & Drachsler, H. (2021). Are we there yet?-a systematic literature review on chatbots in education. Frontiers in Artificial Intelligence, 4, 654924.
Yan, Q., & Wu, S. (2018). How differences in eWOM platforms impact consumers’ perceptions and decision-making. Journal of Organizational Computing and Electronic Commerce, 28(4), 315–333.
Yet, M. L., Ching, S. Y., & Teck, H. L. (2011). Destination choice, service quality, satisfaction, and consumerism: International students in Malaysian institutions of higher education. African Journal of Business Management, 5(5), 1691–1702.
Ziang, X., Zhou, M. X., Liao, V. Q., Mark, G., Chi, C., Chen, W., & Yang, H. (2020). Tell me about yourself: Using an AI-Powered chatbot to Conduct conversational surveys with Open-ended questions. ACM Transactions on Computer-Human Interaction (TOCHI), 27(3), 1–37.
Acknowledgements
We thank all members of the ethical committee of the University of Sydney Business School for their guidance and support. We also extend our gratitude to all participants who engaged with our AI through Prolific and shared their candid opinions.
Funding
Authors received no external funding.
Open Access funding enabled and organized by CAUL and its Member Institutions
Author information
Authors and Affiliations
Corresponding author
Ethics declarations
Conflict of interest
The authors declare no competing interests.
Additional information
Publisher’s Note
Springer Nature remains neutral with regard to jurisdictional claims in published maps and institutional affiliations.
Rights and permissions
Open Access This article is licensed under a Creative Commons Attribution 4.0 International License, which permits use, sharing, adaptation, distribution and reproduction in any medium or format, as long as you give appropriate credit to the original author(s) and the source, provide a link to the Creative Commons licence, and indicate if changes were made. The images or other third party material in this article are included in the article’s Creative Commons licence, unless indicated otherwise in a credit line to the material. If material is not included in the article’s Creative Commons licence and your intended use is not permitted by statutory regulation or exceeds the permitted use, you will need to obtain permission directly from the copyright holder. To view a copy of this licence, visit http://creativecommons.org/licenses/by/4.0/.
About this article

Cite this article
Cingillioglu, I., Gal, U. & Prokhorov, A. AI-experiments in education: An AI-driven randomized controlled trial for higher education research. Educ Inf Technol (2024). https://doi.org/10.1007/s10639-024-12633-y
Received:
Accepted:
Published:
DOI: https://doi.org/10.1007/s10639-024-12633-y