


In the Maya region, inequality exists across and within communities, cities, and regions, and yet as archaeologists, we struggle to identify the nuances of inequality that impacted the daily lives of people living within in large cities. Inequality is complex and multifaceted, relating to social, political, ideological, economic, ethnic, gender, age, spatial, and other factors (e.g., Feinman Reference Feinman and Carballo2013; Hutson and Welch Reference Hutson and Welch2021). Teasing out this complexity is challenging, particularly in archaeological contexts; however, archaeological research in many areas of the world has provided insights into inequality based on various lines of contextualized evidence (e.g., Beck and Quinn Reference Beck and Quinn2022). The majority of research employs excavation, pedestrian survey, or a combination using various lines of evidence (e.g., osteological, artifact, architectural, fauna) as proxies of wealth or socioeconomic class for investigating inequality. While it is acknowledged that wealth does not equate to quality of life (e.g., Munson and Scholnick Reference Munson and Scholnick2022), it is still challenging even to make site and regional comparisons of inequality for the ancient Maya.
The goal of this Compact Special Section and its articles is to investigate the potential for geospatial analysis using Gini coefficients as an initial step to contribute to the development of new approaches for comparative analyses of inequality using settlement data encompassing vast Maya landscapes (Thompson et al. Reference Thompson, Walden, Chase, Hutson, Marken, Cap, Fries, Guzman Piedrasanta, Hare, Horn, Micheletti, Montgomery, Munson, Richards-Rissetto, Shaw-Müller, Ardren, Awe, Kathryn Brown, Callaghan, Ebert, Ford, Guerra, Hoggarth, Kovacevich, Morris, Moyes, Powis, Yaeger, Houk, Prufer, Chase and Chase2022). Traditionally, because of the nature of Maya archaeology, pedestrian surveys have occurred along transects, leaving large gaps in settlement data. However, with increasing applications of airborne LiDAR and other digital tools, in combination with ongoing fieldwork and legacy data, we are developing more “complete” sets of settlement data that are allowing us to fill in gaps (Canuto et al. Reference Canuto, Estrada-Belli, Garrison, Houston, Acuña, Kováč, Marken, Nondédéo, Auld-Thomas, Castanet, Chatelain, Chiriboga, Drápela, Lieskovský, Tokovinine, Velasquez, Fernández-Díaz and Shrestha2018; Chase et al. Reference Chase, Chase, Weishampel, Drake, Shrestha, Clint Slatton, Awe and Carter2011; Garrison et al. Reference Garrison, Thompson, Krause, Eshleman, Fernandez-Diaz, Dennis Baldwin and Cambranes2022; Thompson and Prufer Reference Thompson and Prufer2015; von Schwerin et al. Reference von Schwerin, Richards-Rissetto, Remondino, Spera, Auer, Billen, Loos and Reindel2016). By filling these gaps, we can apply methods such as Gini coefficients to begin to explore inequality not only for individual sites (Brown et al. Reference Brown, Watson, Gravlin-Beman, Liebovitch and Braswell2015; Chase Reference Chase2017; Hutson Reference Hutson2016) and polities, but also comparatively across subregions (Thompson et al. Reference Thompson, Feinman and Prufer2021a) and the greater Maya area (Thompson et al. Reference Thompson, Feinman, Lemly and Prufer2021b).
This analysis assumes that differences in household size (area and volume) reflect varying degrees of wealth, and these wealth differences may be indicative of various types of inequality (see Chase Reference Chase2017; Chase et al. Reference Chase, Thompson, Walden and Feinman2023). For example, larger residences (depending on construction materials, presence/absence of elaborate sculpture, construction sequences/additions, location, etc.) likely represent not only access to precious resources, but also a greater ability to recruit labor (Abrams Reference Abrams1994; McCurdy and Abrams Reference McCurdy and Abrams2019). While there are limitations to measuring inequality using Gini coefficients based solely on area and volume (e.g., Abrams Reference Abrams1989), this study, as part of a Compact Special Section, offers standardized measurement and analytical units, serving as an initial step for a geospatially grounded comparative analysis of wealth inequality (based on household size) between Copan and several other Maya sites and subregions. The case study is the ancient Maya city of Copan in the Late Classic (ca. a.d. 600–820). Archaeological evidence deriving from a long history of survey and excavation (e.g., Baudez Reference Baudez1983; Fash Reference Fash1983; Gonlin Reference Gonlin, Schwartz and Falconer1994; Landau Reference Landau2021; Webster et al. Reference Webster, Freter and Gonlin2000) indicates that surface architecture within the Copan Pocket serves as a representative sample of ancient Maya households during the latter half of the Late Classic period.
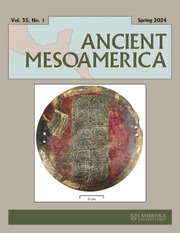
The Gini coefficient analysis employs three units of measurement: one measurement is based on area (m2) and the other two are based on volume (m3) calculations. The volume calculations rely on two different raster surfaces: a digital elevation model (DEM) comprising archaeological mounds—derived from airborne LiDAR—and an urban DEM comprising bare earth + extruded structures—based on a trigonometric formula (Figure 1; Richards-Rissetto Reference Richards-Rissetto2010, Reference Richards-Rissetto2013). Gini coefficients are calculated for these three measurement units to compare area and volume results. While this article is part of a Compact Special Section exploring the potential of Gini coefficients to compare and interrogate similarities and differences in wealth inequality based on standardized units of analysis (area and volume), derived using a DEM (see Chase et al. Reference Chase, Thompson, Walden and Feinman2023), an additional objective of this article is to introduce the potential value of 3D architectural reconstructions for refining Gini coefficients. The Gini coefficients in this article represent an initial step of integrating GIS and 3D (Richards-Rissetto Reference Richards-Rissetto2017; Richards-Rissetto and Plessing Reference Richards-Rissetto and Plessing2015), with a future goal being to incorporate construction costs for the development of an energetics Gini (Abrams Reference Abrams1994; McCurdy and Abrams Reference McCurdy and Abrams2019; Richards-Rissetto Reference Richards-Rissetto2013). Within each of these three measurement units, three units of analysis are employed: (1) individual structures (greater than 20 m2); (2) total of all structures within a plazuela group (greater than 20 m2); and (3) the entire plazuela group (including structures, plaza, and area between structures; see Chase et al. Reference Chase, Thompson, Walden and Feinman2023; Thompson et al. Reference Thompson, Chase and Feinman2023), to investigate potential variations in Gini coefficients resulting from differential analysis units that may influence measures of wealth inequality (based on architecture) within ancient Maya cities.
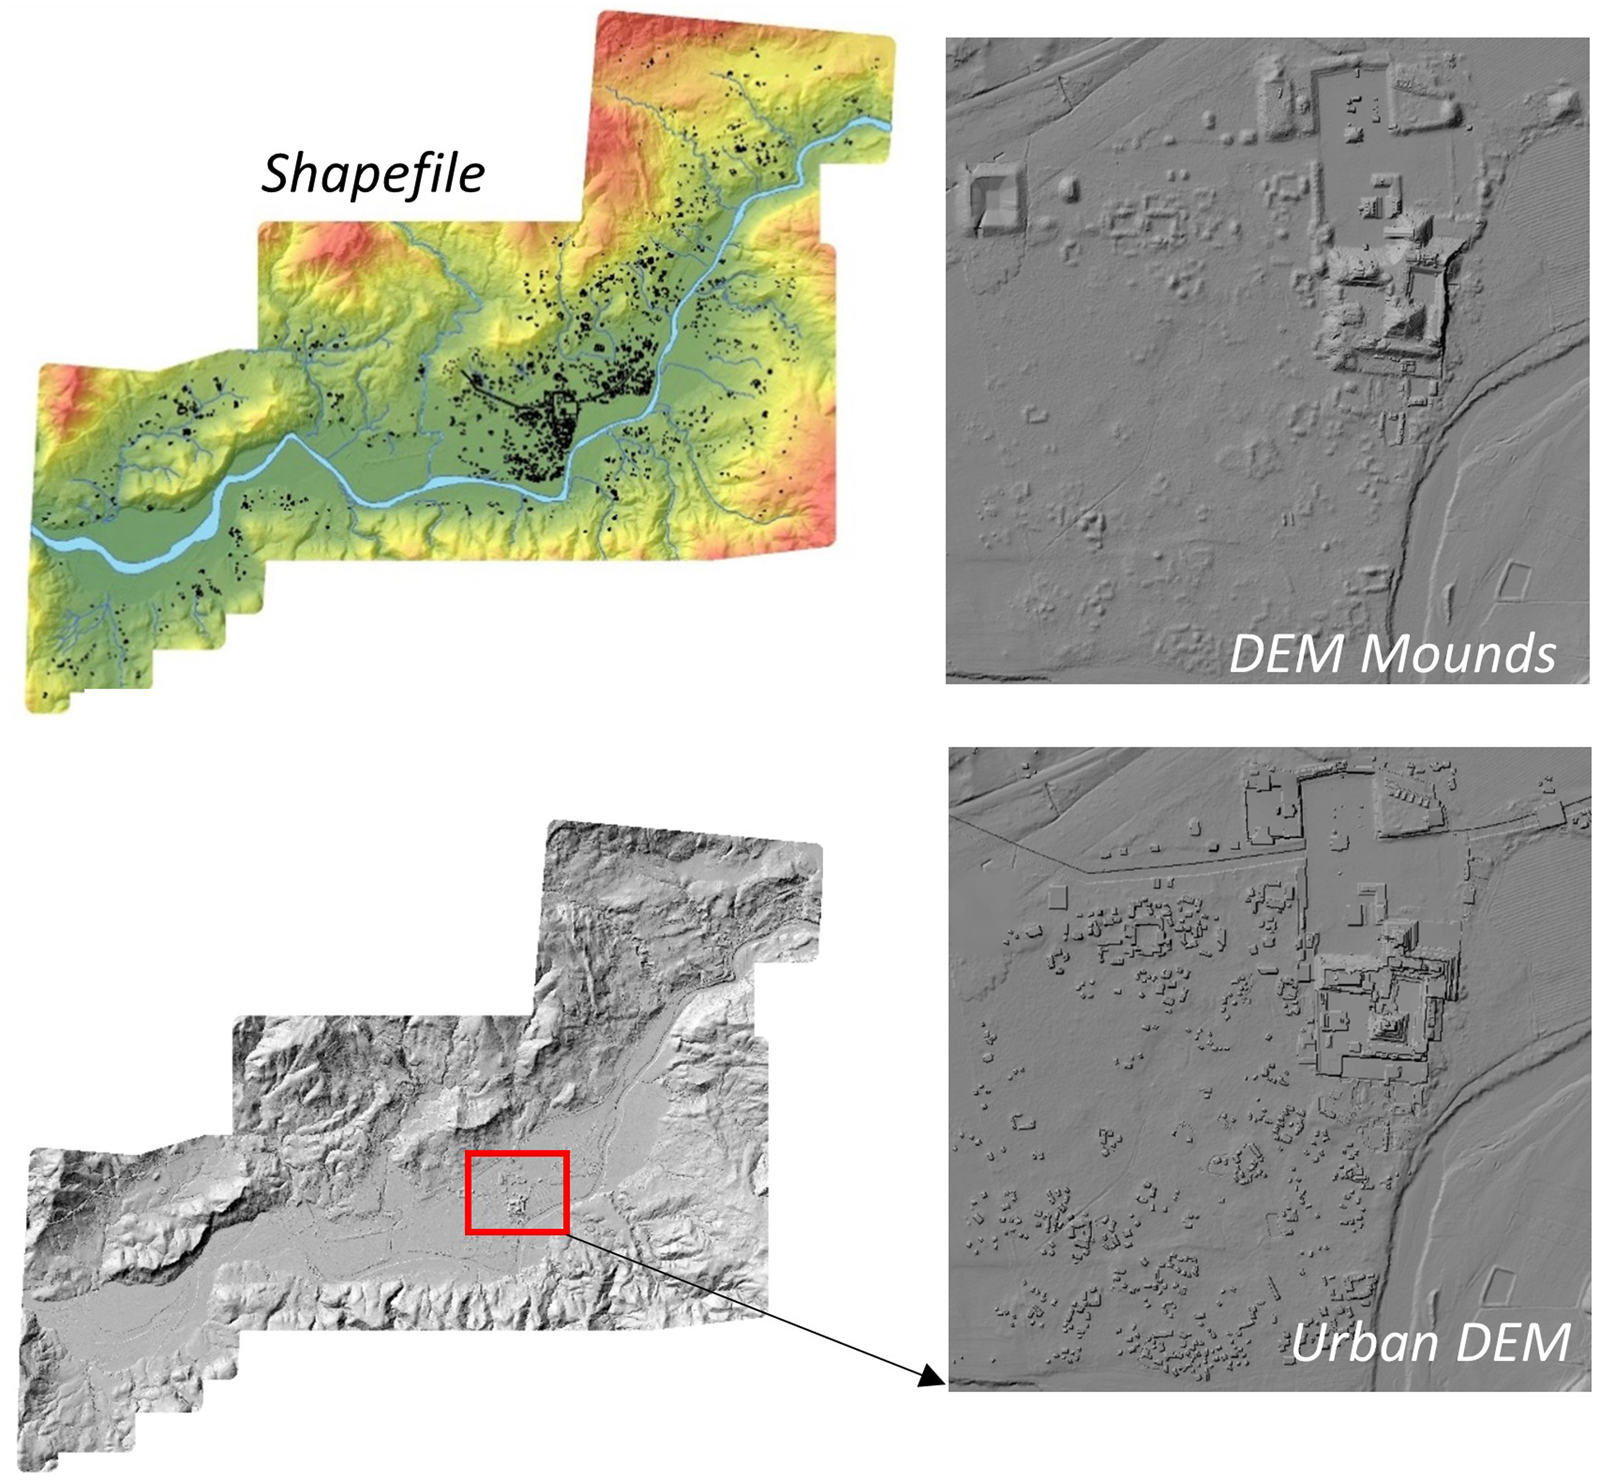
Figure 1. Datasets for Copan: area (shapefile), volume (DEM), and modified volume (urban DEM).
Case study: Copan
Today, Copan is an UNESCO World Heritage site located in northwestern Honduras. However, from the fifth to the early ninth century (a.d.) it became the center of one of the most powerful polities in the Maya world (Fash Reference Fash2001). Its deep chronology, extending back to the Preclassic (1600 b.c.; Hall and Viel Reference Hall, Viel, Bell, Canuto and Sharer2004), as well as its long history of archaeological excavation and survey, provide unique opportunities to investigate the relationships between the development of wealth inequality and social and political dynamics.
Archaeological, osteological, and paleoenvironmental evidence indicate that for most of the Preclassic, Copan's population was non-Maya until circa a.d. 150 (Canuto and Bell Reference Canuto and Bell2008, Reference Canuto and Bell2013; Gerstle Reference Gerstle and Robinson1987; McNeil Reference McNeil, Metz, McNeil and Hull2009, Reference McNeil2012; Miller Wolf and Freiwald Reference Miller Wolf and Freiwald2018; Price et al. Reference Price, Burton, Fullagar, Wright, Buikstra and Tiesler2008; see also Shaw-Müller and Walden Reference Shaw-Müller and Walden2023, for similar migration patterns in a different region). However, it is not until the arrival of K'inich Yax Kuk Mo, Copan's first dynastic ruler, in a.d. 426, that Copan becomes quintessentially Maya—at least politically (Chase and Chase Reference Chase, Chase, Stanton and Kathryn Brown2020; Helmke et al. Reference Helmke, Chase and Chase2019). The dynasty at Copan lasted almost 400 years, spanning 16 rulers, resulting in a Late Classic landscape comprising thousands of structures and hundreds of plazuela (courtyard) groups—albeit the layout of many of them more informal than in other Maya areas (Baudez Reference Baudez1983; Fash and Long Reference Fash, Long and Baudez1983)—from which to calculate Gini coefficients for initial comparisons of household wealth inequality between Copan and other Maya sites and subregions.
Copan's contemporary landscape is a mosaic resulting from ancient, historical, and modern anthropogenic modifications and environmental phenomena (Baudez Reference Baudez1983; House Reference House2007; Richards-Rissetto et al. Reference Richards-Rissetto, Sanford-Long, Kirby-Miller, Forte and Campana2016). Historical and modern agricultural practices, along with urban development, have destroyed, buried, or damaged features and resulted in variations in vegetation type and density that can make the identification of ancient residences challenging; however, by integrating two datasets—archival maps from pedestrian survey (Fash and Long Reference Fash, Long and Baudez1983) and photogrammetric maps of the main civic-ceremonial group (principal group; Hohmann and Vogrin Reference Hohmann and Vogrin1982) and Las Sepulturas, an adjacent “elite suburb” (Hohmann Reference Hohmann1995) with airborne LiDAR—a comprehensive settlement survey of the Copan Pocket in the Late Classic is available (von Schwerin et al. Reference von Schwerin, Richards-Rissetto, Remondino, Spera, Auer, Billen, Loos and Reindel2016). While not examined in this study, data from the city's main civic-ceremonial complex and household excavations can offer deeper insights into the nature of inequality indicated from the Gini coefficients (e.g., Andrews and Bill Reference Andrews, Bill, Wyllys Andrews and Fash2005; Freter Reference Freter2004; Gonlin Reference Gonlin, Schwartz and Falconer1994, Reference Gonlin, Gonlin and Lohse2007; Hendon Reference Hendon1991; Webster and Gonlin Reference Webster and Gonlin1988).
Data and methods
Copan is in a somewhat unique position, because in the late 1970s, as part of the burgeoning interest in settlement patterns, archaeologists under the direction of Gordon Willey began to map an area of 24 km2 surrounding the city's main civic-ceremonial complex, completed in the Archaeological Copan Project (PAC 1; Baudez Reference Baudez1983). They carried out a pedestrian survey of nearly 100 percent coverage and mapped archaeological mounds using plane table and alidade, resulting in 24 oversized maps, with contours, hydrological features, and archaeological structures categorized according to group types (Fash and Long Reference Fash, Long and Baudez1983). These data were georeferenced, digitized, and attributed to create several shapefiles, which were used to calculate the area and volume used in the Gini coefficient. The first dataset is a shapefile with 3,450 structures (Figure 1; Richards-Rissetto Reference Richards-Rissetto2010), excluding non-residential structures. This was used to calculate household areas.
The second dataset is from an airborne LiDAR survey carried out in 2013 as part of the MayaArch3D Project, covering 26 km2 surrounding Copan's main civic-ceremonial center. The LiDAR data provided 3D point clouds that were processed to generate a 1 m resolution DEM of bare earth, including archaeological mounds (Figure 1; von Schwerin et al. Reference von Schwerin, Richards-Rissetto, Remondino, Spera, Auer, Billen, Loos and Reindel2016). It is important to note that digitization of archaeological features is often not standardized, with differences arising in polygon shapes and sizes based on an individual's skill level and interpolation choices, as well as data visualization method (e.g., hillshade, sky view factor; Garrison et al. Reference Garrison, Thompson, Krause, Eshleman, Fernandez-Diaz, Dennis Baldwin and Cambranes2022; Hutson Reference Hutson and Pillsbury2012). Additionally, heights provided by 3D point clouds for archaeological mounds represent the contemporary landscape, not actual structure heights in the past (see Munson et al. Reference Munson, Scholnick, Mejía Ramón and Aragon2023). This second dataset was employed to calculate household volumes.
The third dataset is an urban DEM—a raster that stores surface elevations and building heights (Ratti Reference Ratti2004). To generate the urban DEM (Figure 1), first, archaeological mounds were removed from the LiDAR data, creating a bare-earth surface that simulates the terrain without archaeological mounds, allowing for reconstructed structures to be “added” to the surface. Second, estimated heights of archaeological structures were derived using a trigonometric function incorporating five variables: (1) platform height, (2) wall height, (3) roof pitch (angle), (4) wall thickness, and (5) structure width that differed based on the Harvard site typology (Willey and Leventhal Reference Willey, Leventhal, Hammond and Willey1979). At Copan, groups of archaeological features are divided into five types, four of them relevant for household analysis. These types are based on size, complexity, mound height, and construction materials and are often correlated to socioeconomic status, with Types 1 and 2 being interpreted as non-elite households, and Types 3 and 4 as elite residences. This classification is important because the urban DEM, unlike the DEM (based on LiDAR-derived extant archaeological mounds), inherently starts to consider additional variables that become embedded in the Gini analysis because the raster surface is no longer a “neutral” surface (I use that term loosely because assumptions are embedded in the generation of all geospatial data, including LiDAR-derived surfaces (Opitz and Cowley Reference Opitz and Cowley2013; Richards-Rissetto and Landau Reference Richards-Rissetto and Landau2019), but rather the urban DEM is a surface with built-in a priori assumptions about the relationship between site type and structure heights based on the Harvard site typology. The third and final step to generate the urban DEM uses map algebra to add the structures with heights to the bare-earth surface model of Late Classic Copan (Richards-Rissetto Reference Richards-Rissetto2010, Reference Richards-Rissetto2013). This third dataset was employed to calculate modified household volumes.
Measurement units
This study employs three measurement units to calculate Gini coefficients. Two of the measurement units are employed by researchers in this Compact Special Section—household area and volume; however, this case study at Copan also examines the utility of using a modified volume measure. Figure 2 illustrates the differences among these three measures.
Figure 2. Comparative illustration for measures of (a) basal area (m2); (b) volume (mounds, m3); and (c) modified volume (urban DEM, m3).
Units of analysis
To allow for standardized comparison with other Maya settlements, Gini coefficients were calculated using each of the three units of analysis from Thompson and colleagues Reference Thompson, Feinman, Lemly and Prufer2021b: (1) individual structures (area greater than 20 m2); (2) total of all structures within a plazuela group (area greater than 20 m2); and (3) the entire plazuela group (including all structures, plaza, and area between structures; Thompson et al. Reference Thompson, Chase and Feinman2023:Figure 2). Gini coefficients were calculated for each unit of analysis, using the three measurement units, resulting in comparative values within and between each Gini index (area, volume, modified volume).
Results
The results for the Gini coefficients, along with Lorenz curves, which provide a graph of wealth distribution, are presented according to unit of analysis for each Gini index.
Individual residential structures
The individual structures area Gini is 0.47 (Table 1), indicating a moderate level of social inequality. However, the individual structures volume Gini is 0.78, and the modified (urban DEM) volume Gini is 0.65; these reflect high levels of wealth inequality and are considerably higher than values seen in other applications of Gini analysis in the Maya region (Chase Reference Chase2017; Hutson Reference Hutson2016; Thompson et al. Reference Thompson, Feinman, Lemly and Prufer2021b), but align with others (Horn III et al. Reference Horn, Tran and Ford2023; Kohler et al. Reference Kohler, Smith, Bogaard, Feinman, Peterson, Betzenhauser, Pailes, Stone, Prentiss, Dennehy, Ellyson, Nicholas, Faulseit, Styring, Whitlam, Fochesato, Foor and Bowles2017).
Table 1. Basic statistics and Gini coefficients for individual structures for area, volume, and modified volume measures.

Lorenz curves for the individual structures area and modified volume (urban DEM) are relatively constant (Figure 3), suggesting a high degree of wealth variation, but no punctuated division between specific social categories. In contrast, the Lorenz curve for the individual structures volume (DEM) is steep, with the top 5 percent of the population maintaining nearly 50 percent of the wealth. This trend and the high Gini coefficient (0.78) indicate a distinction in individual structures based on a wealthiest class.
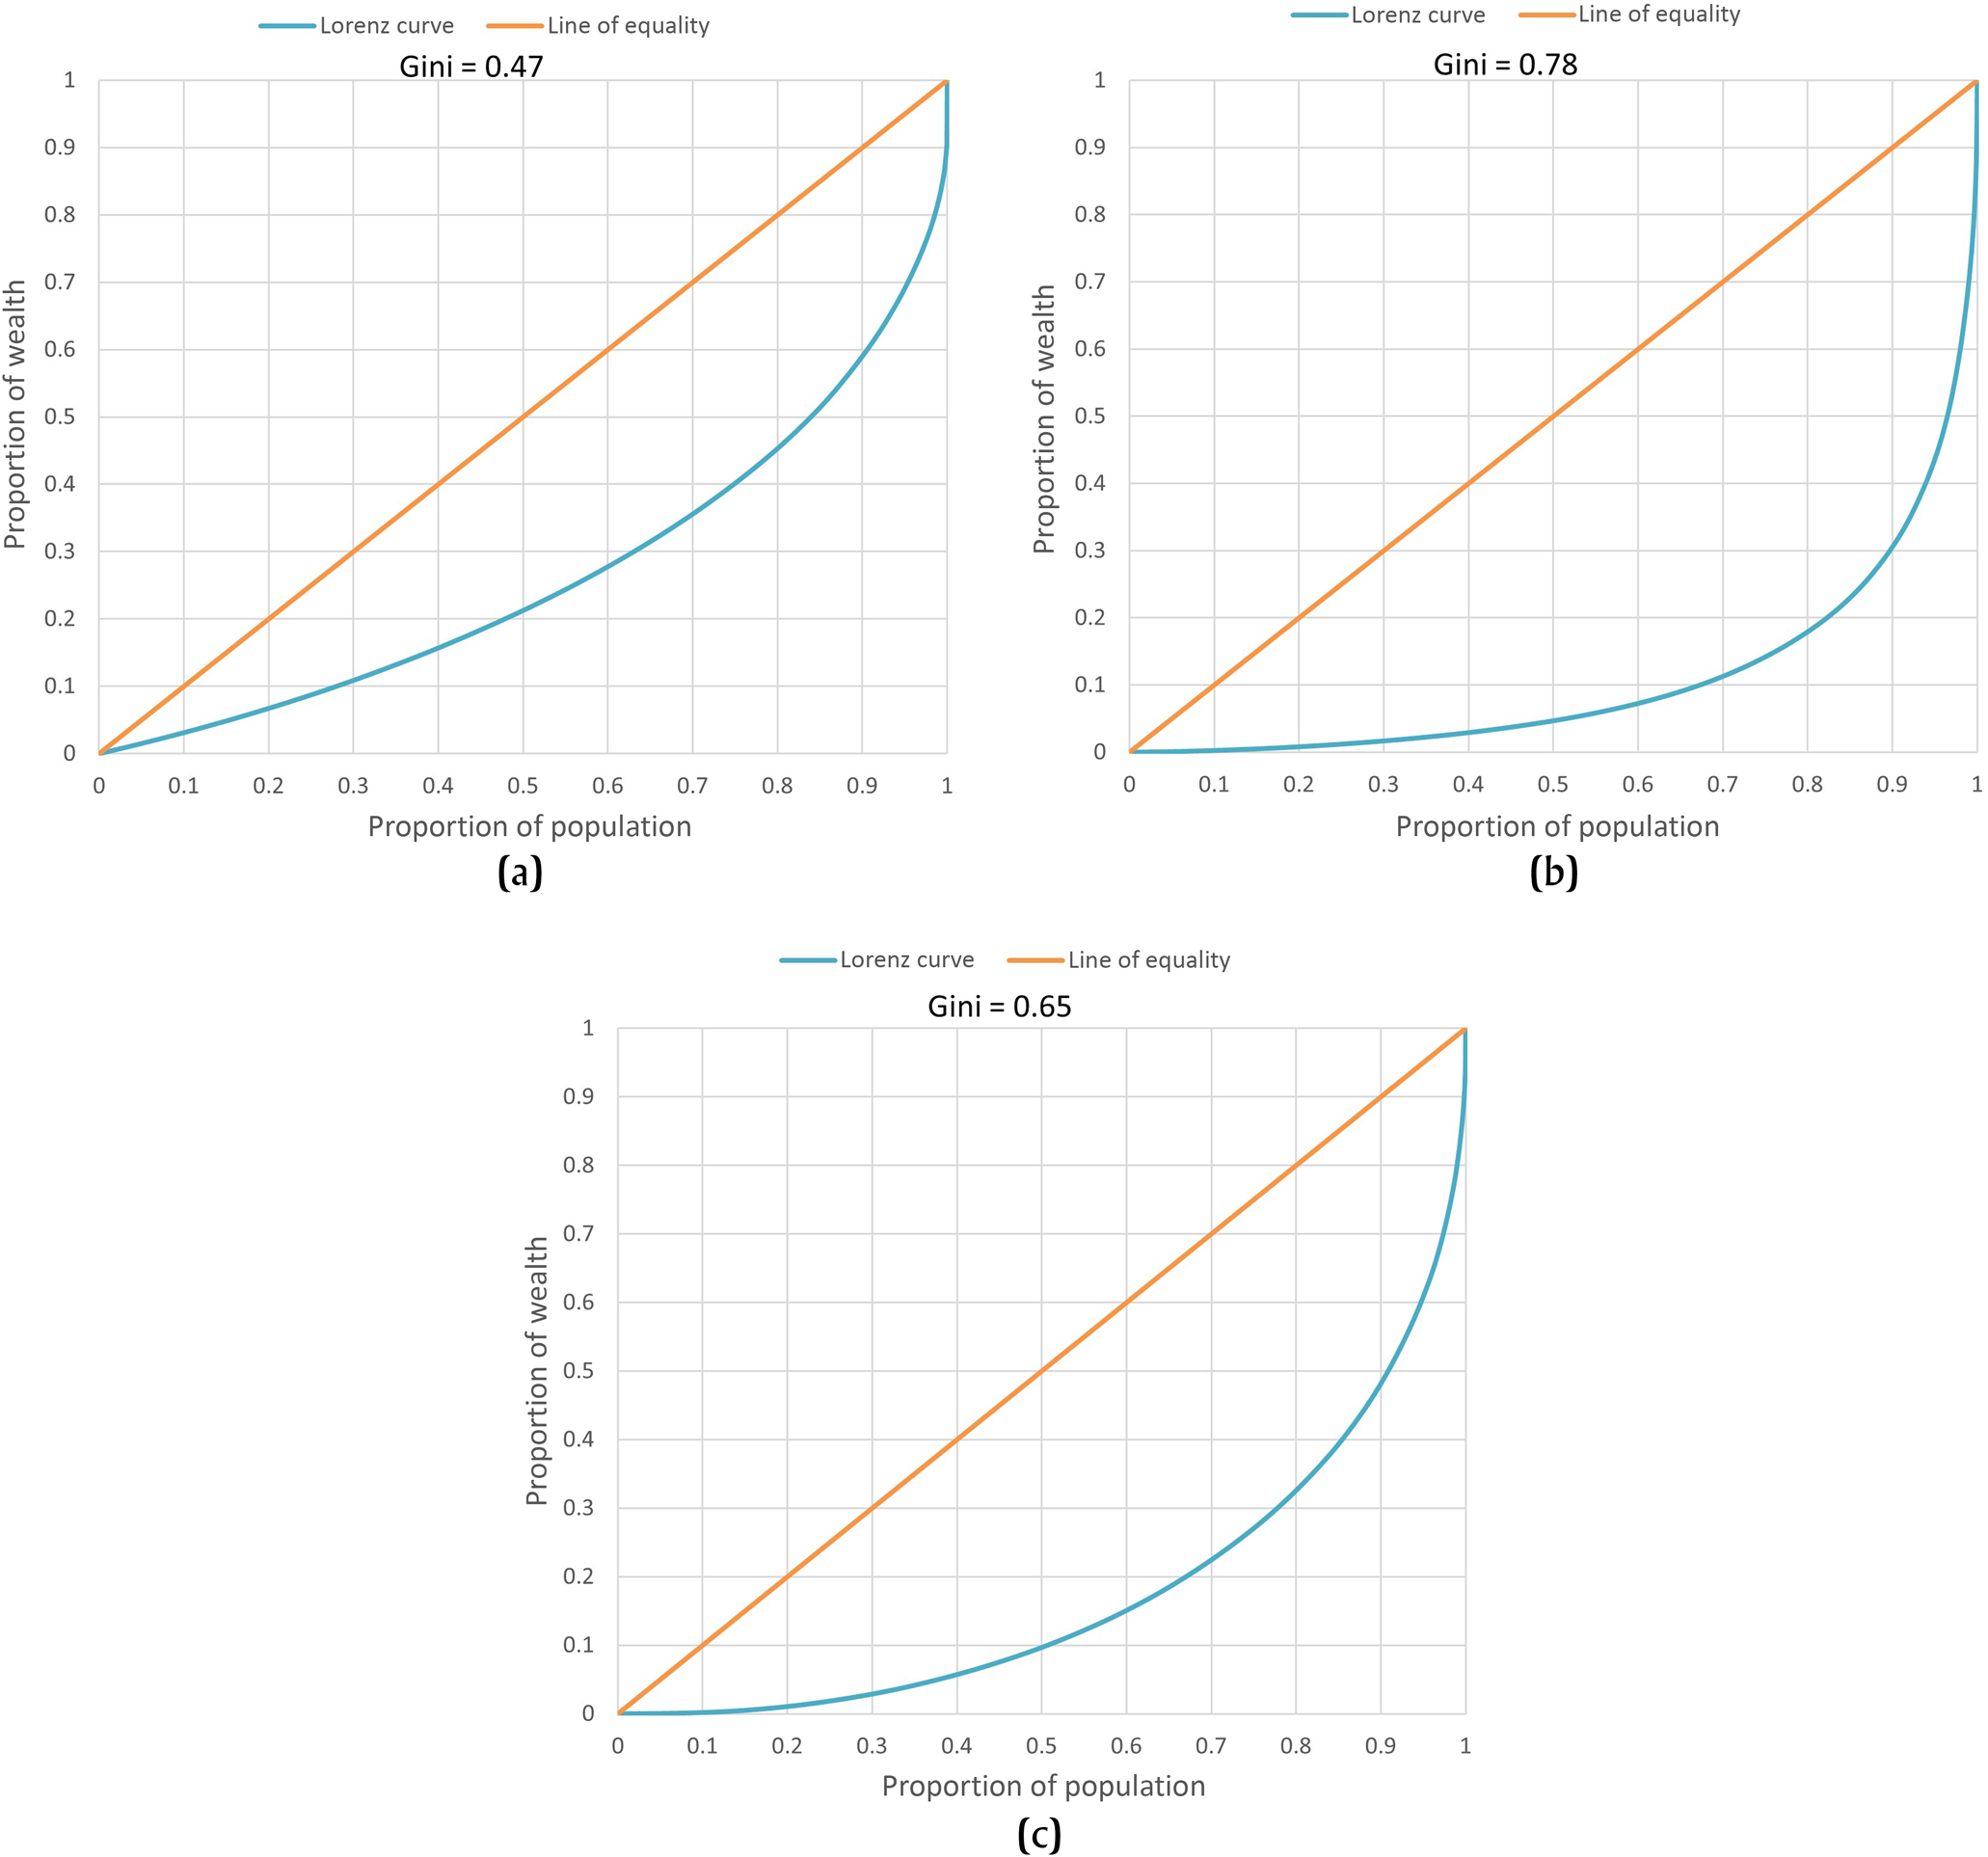
Figure 3. Lorenz curve of (a) area, (b) volume, and (c) modified volume Gini coefficient for individual structures.
Using 80 percent of population as a baseline to compare the three Gini coefficients for individual structures, the area Gini indicates that the top 20 percent of Copan's population has 65 percent of total wealth. Comparatively, the modified volume Gini indicates that the top 20 percent of Copan's population has 70 percent of total wealth, and the volume Gini indicates that the top 20 percent of Copan's population has 80 percent of the wealth.
The formula to calculate the Gini coefficient can be rearranged in terms of the ratio of average incomes of wealthier and poorer into the expression$\;{{g + 1} \over {1-g}}$ , where g = Gini coefficient (https://www.labxchange.org/library/pathway/lx-pathway:947bd402-9d3a-40f0-bcac-31c660f34459/items/lx-pb:947bd402-9d3a-40f0-bcac-31c660f34459:html:f5176875). For example, given the volume Gini coefficient of 0.78, ${{0.78 + 1} \over {1-0.78}}$
 = 8.09. This value indicates that Copan's wealthiest people are on average 8.09 times wealthier than most of the population. Using this expression, the area Gini index indicates that Copan's wealthiest people are on average 2.77 times wealthier than most of the population, and the modified volume Gini indicates that Copan's wealthiest group is on average 3.86 times wealthier than most of the city's inhabitants.
Plazuela groups (structures only)
The Gini coefficients for plazuela groups (n = 798; Table 2) have a similar distribution to the individual structures Gini coefficients: area has the lowest Gini value, at 0.61; the volume index exhibits the highest value, at 0.84; and the modified volume has a Gini of 0.71. Overall, however, the Gini coefficients for plazuela groups are higher than for individual structures.
Table 2. Basic statistics and Gini coefficients for plazuela groups (structures only) for area, volume, and modified volume measures.
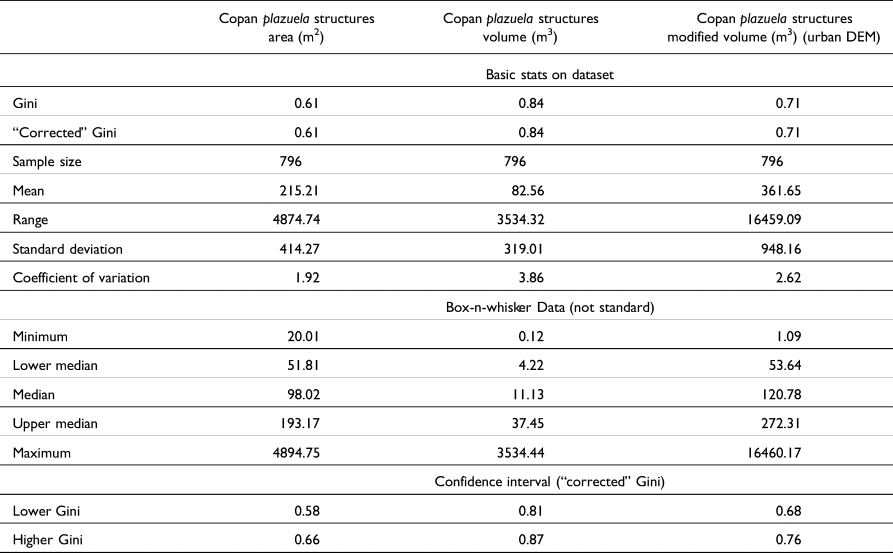
Lorenz curves for all structure per plazuela group area and modified volume Ginis are relatively constant, with substantial wealth variation, and yet no clear division indicative of social categories (Figure 4). The Lorenz curve for the volume Gini is steep, with the top 3 percent of the population maintaining 50 percent of the overall wealth, possibly reflecting a distinction in size and quality of individual structures for the wealthiest class.
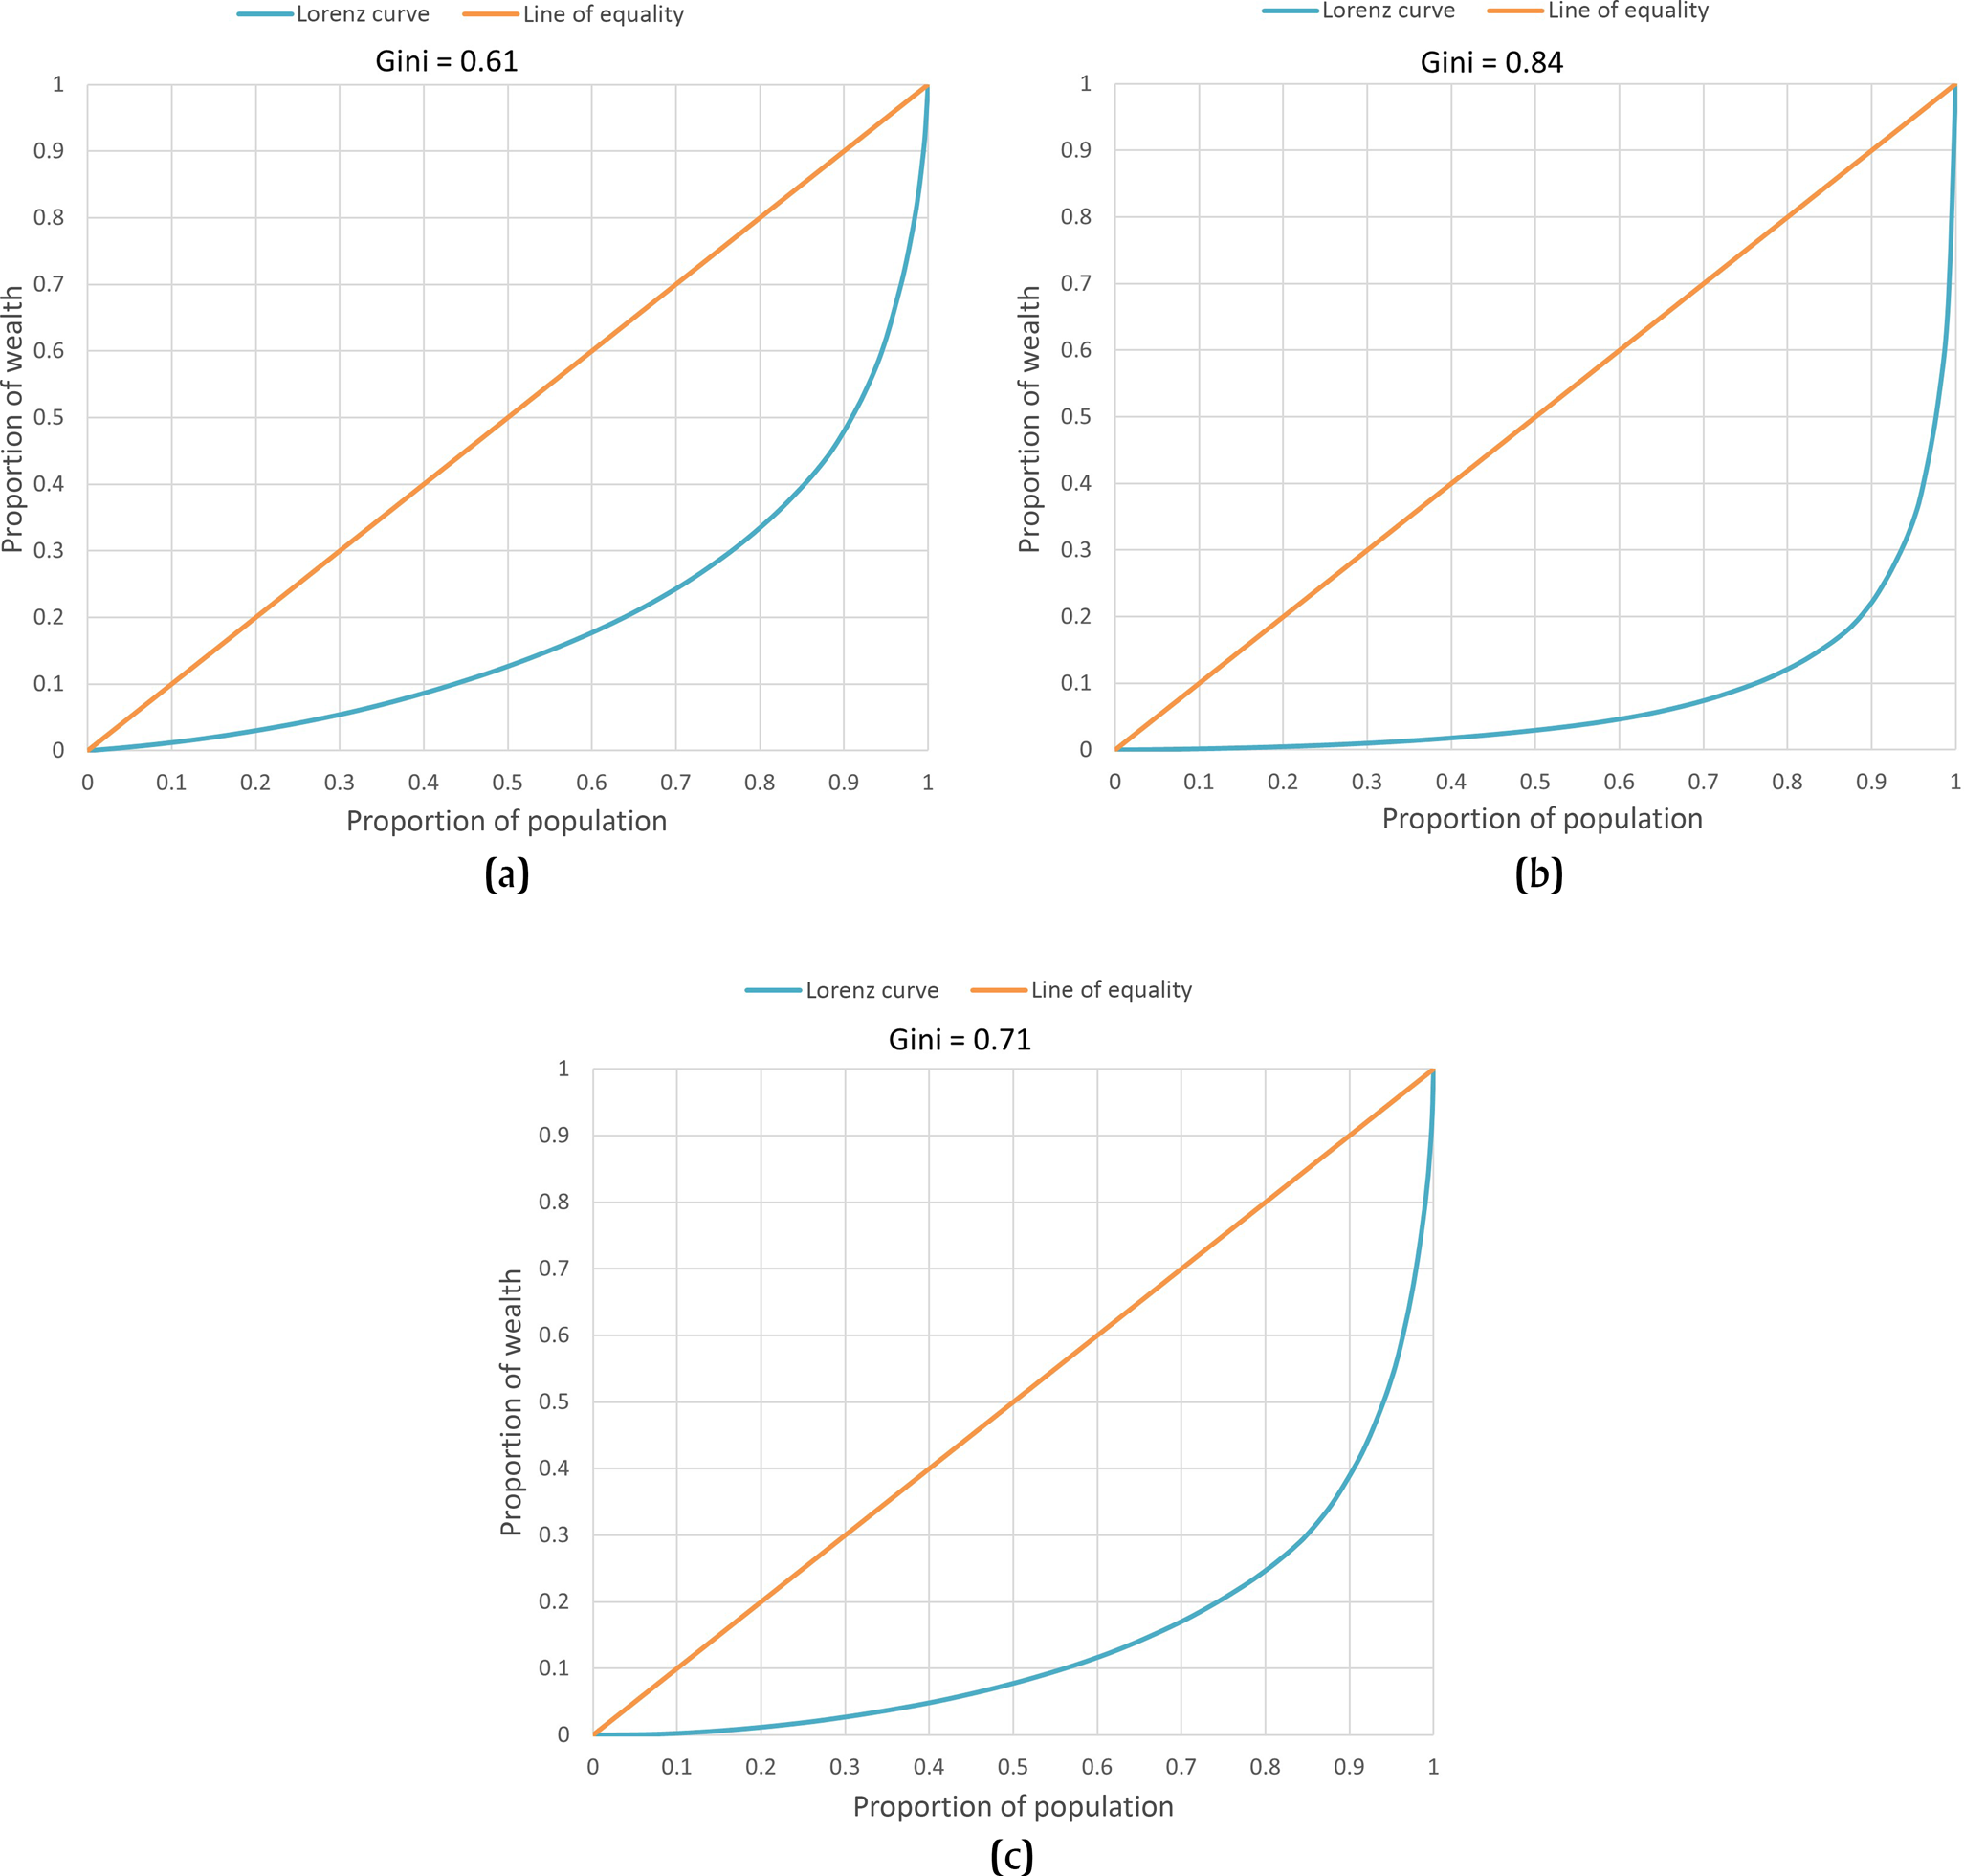
Figure 4. Lorenz curve of (a) area, (b) volume, and (c) modified volume Gini coefficient for plazuela groups (structures only).
Using 80 percent of population as a baseline to compare the three Gini indices for individual structures, the area Gini index indicates that 20 percent of Copan's population has 70 percent of total wealth; the modified volume Gini index suggests that 20 percent of Copan's population has 90 percent of total wealth; and the volume Gini index shows that 20 percent of Copan's population has 75 percent of the wealth. Applying the ratio expression for the Gini coefficient, the area Gini index indicates that Copan's wealthiest people are on average 4.13 times wealthier than most of the population; the modified volume Gini index indicates that Copan's wealthiest group is on average 5.9 times wealthier than most of the population; and the volume Gini indicates that Copan's wealthiest people are on average 11.5 times wealthier than most of the city's inhabitants.
Entire plazuela groups (structures, plaza, and area)
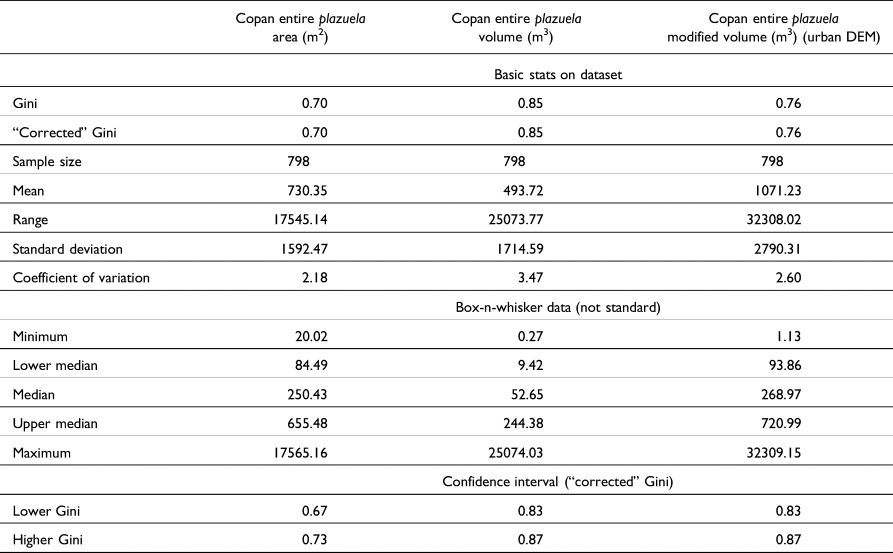
The Gini coefficients for entire plazuela groups have the highest Gini coefficient values (Table 3). The area Gini is the lowest at 0.70, and the modified volume is 0.76. Interestingly, the Gini coefficient for volume is 0.85, which is almost identical to the volume Gini coefficient for all structures per plazuela group at 0.84.
Table 3. Basic statistics and Gini coefficients for entire plazuela groups (structures, plaza, and area) for area, volume, and modified volume measures.
The Lorenz curves for the area and modified volume are relatively constant, suggesting a high degree of wealth variation, with no punctuated division between specific social categories (Figure 5). The Lorenz curve for the volume is steep, with the top 3 percent of the population maintaining 50 percent of the wealth, potentially reflecting a distinction in plazuelas based on a wealthiest class.
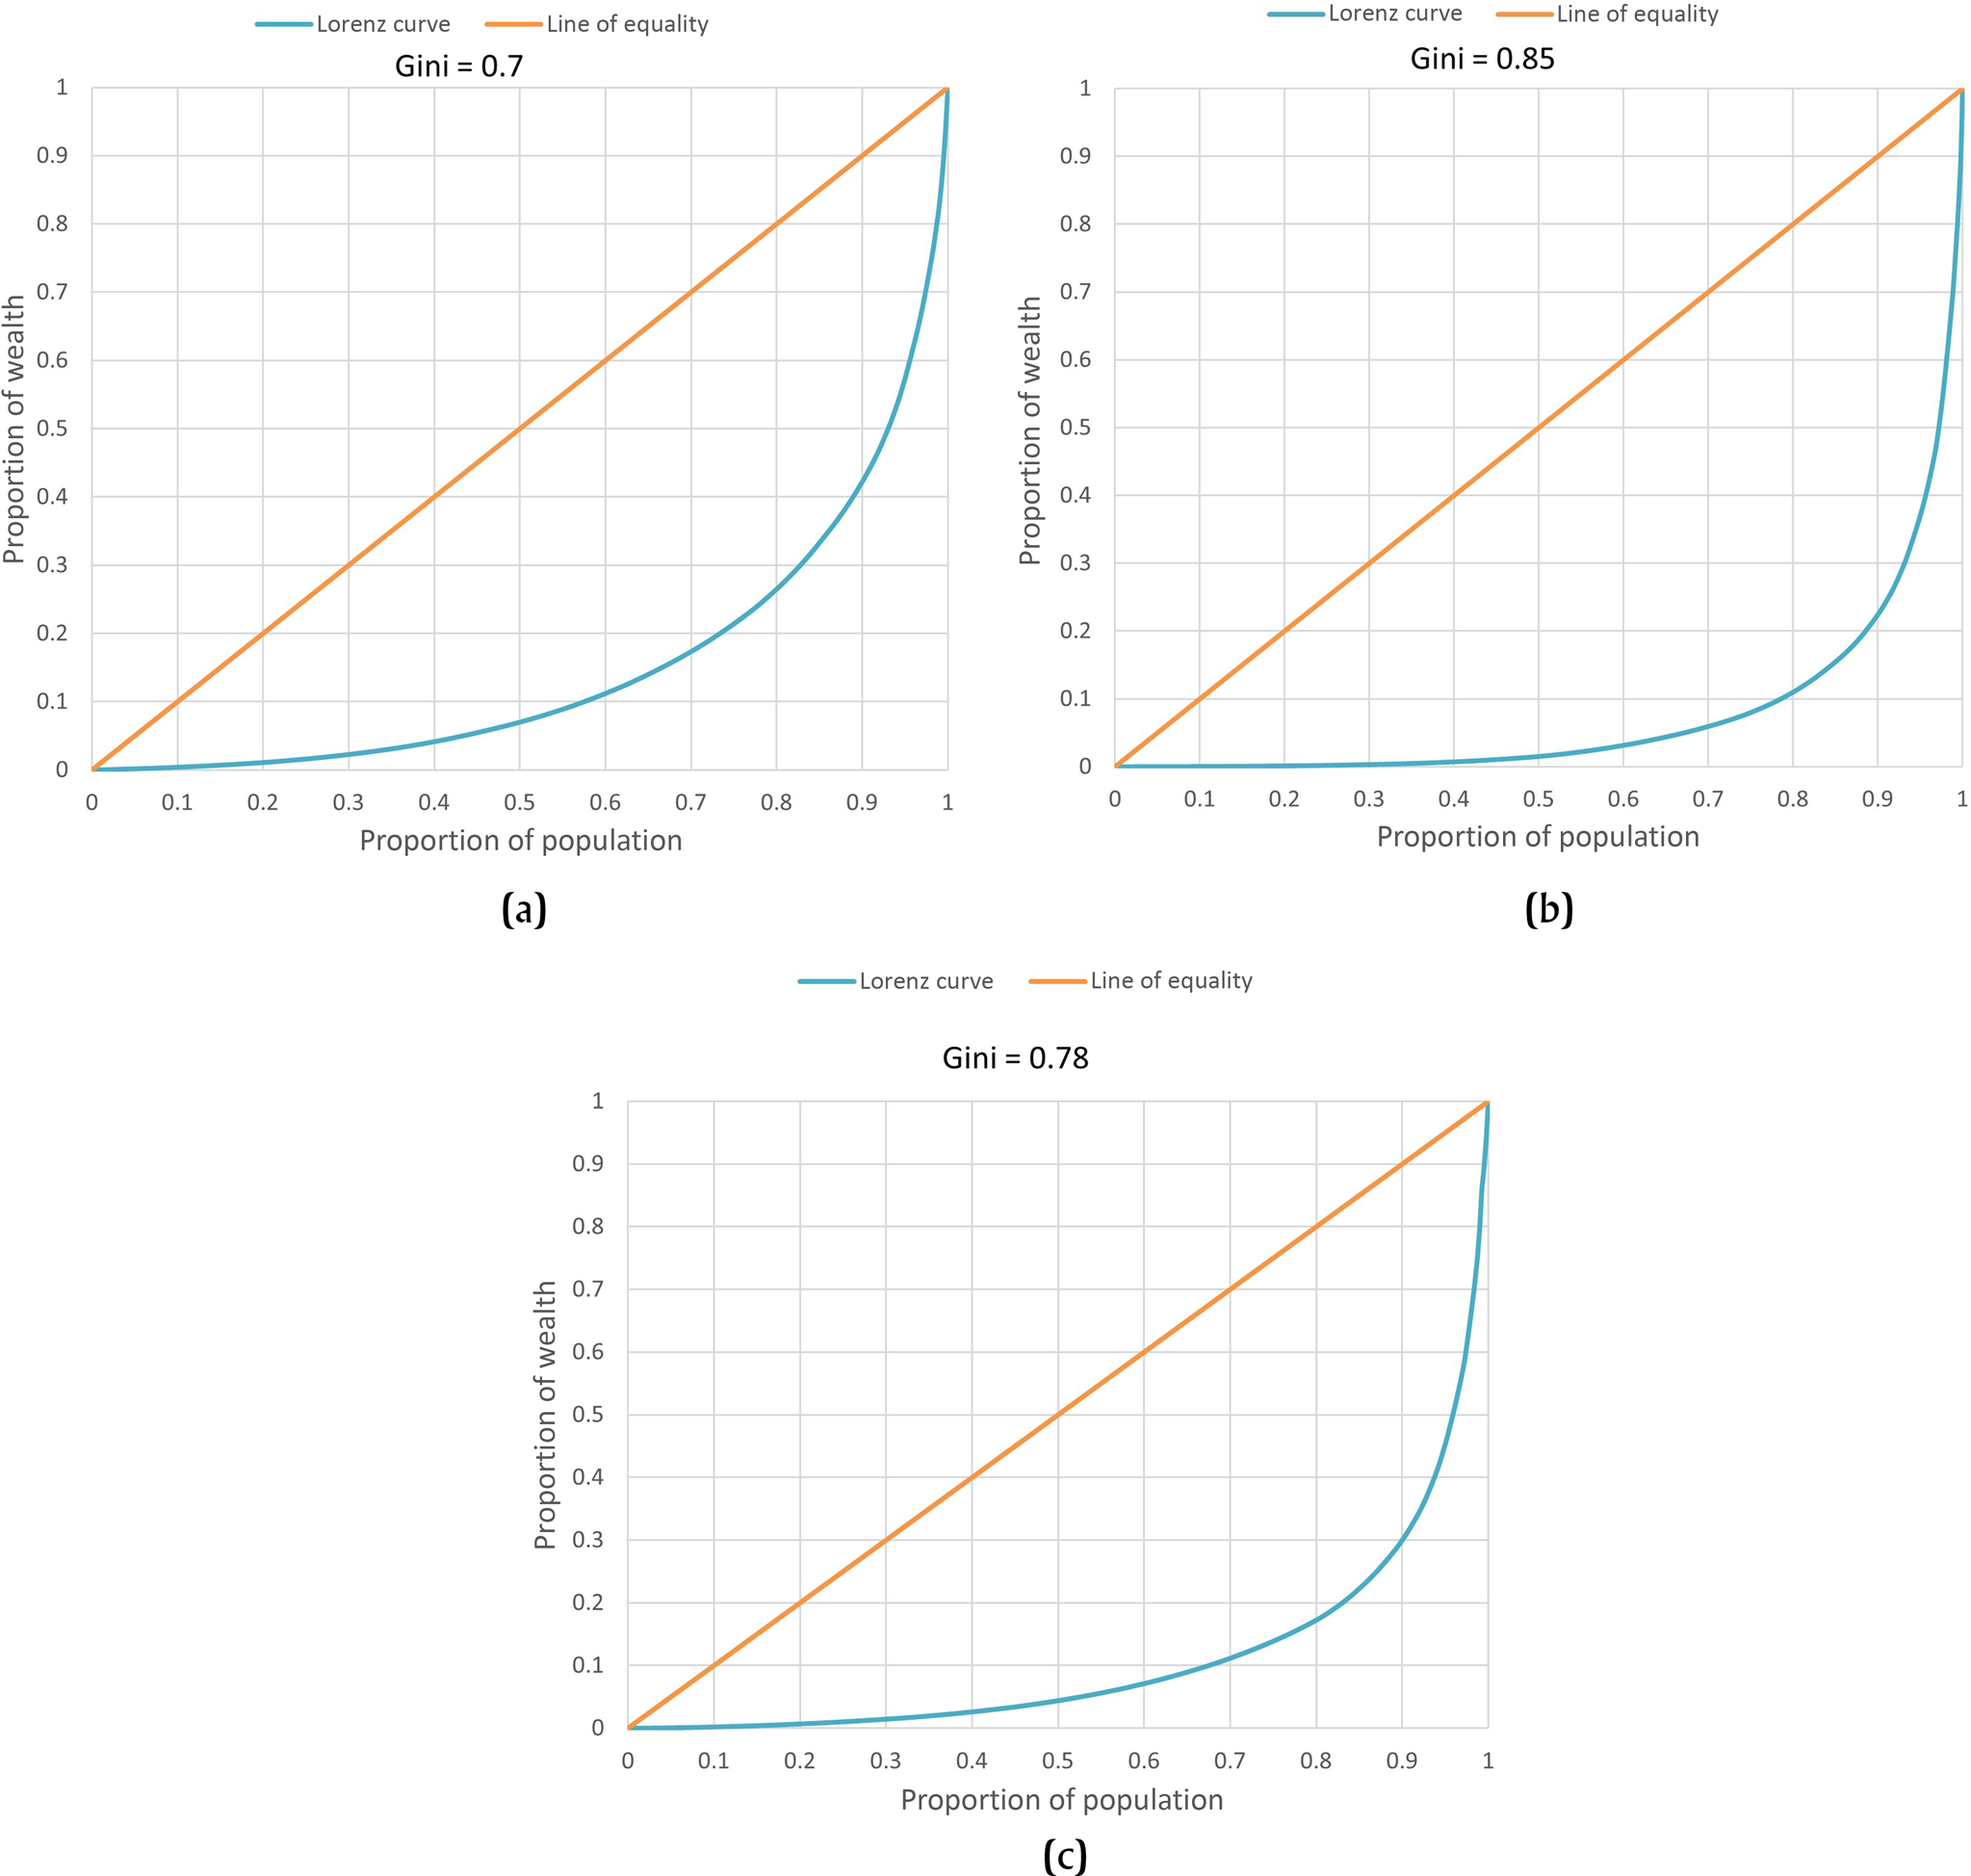
Figure 5. Lorenz curve of (a) area, (b) volume, and (c) modified volume Gini coefficient for entire plazuela groups.
Using 80 percent of population as a baseline to compare the three Gini indices for entire plazuela groups, the area Gini indicates that 20 percent of Copan's population has 75 percent of total wealth; the modified volume Gini suggests that 20 percent of Copan's population has 90 percent of total wealth; and the volume Gini shows that 20 percent of Copan's population has 85 percent of the wealth. Applying the ratio expression for the Gini coefficient, the area Gini index indicates that Copan's wealthiest people are on average 4.67 times wealthier than most of the population; the modified volume Gini index indicates that Copan's wealthiest people are on average 8.09 times wealthier than most of the population; and the volume Gini index indicates that Copan's wealthiest group are on average 11.5 times wealthier than most of the city's inhabitants.
Summary of results
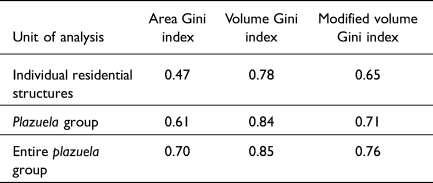
The results of the Gini coefficients illustrate patterns within and across the three units of analysis (Table 4). The area Gini indices have the lowest Gini coefficients for each unit of analysis, while the volume Ginis exhibit the highest coefficients for each unit of analysis. The ranges of the area and modified volume Gini coefficients are similarly large, 0.47–0.70 and 0.65–0.76, respectively. The large ranges of these two Gini indices between units of analysis reinforce the need to employ similar analytical units for comparative geospatial studies across the Maya region (Chase Reference Chase2017; Thompson et al. Reference Thompson, Walden, Chase, Hutson, Marken, Cap, Fries, Guzman Piedrasanta, Hare, Horn, Micheletti, Montgomery, Munson, Richards-Rissetto, Shaw-Müller, Ardren, Awe, Kathryn Brown, Callaghan, Ebert, Ford, Guerra, Hoggarth, Kovacevich, Morris, Moyes, Powis, Yaeger, Houk, Prufer, Chase and Chase2022). However, the smaller range for the volume Gini indices (0.78–0.85) and the similar Gini volume indices for all structures per plazuela group and entire plazuela groups, 0.84 and 0.85, respectively, requires deeper interrogation, especially given the different results for Copan in comparison to the other articles in this Compact Special Section, which, in contrast, illustrate more variation within volume metrics than area metrics.
Table 4. Summary comparison of Gini coefficients for individual structures, plazuela groups (structures only), and entire plazuela groups for area, volume, and modified volume measures.
Despite the wide range of Gini coefficients across units of analysis and units of measurement (0.47–0.85), all values indicate high levels of wealth inequality at Copan. Given that ancient Maya households were typically organized around plazas, reflecting a variety of daily practices (Hendon Reference Hendon1991), and the smaller difference in the range of the Gini coefficients between plazuela groups and entire plazuela groups (0.61–0.85) than the range for individual structures (0.47–0.78), a preliminary interpretation is that plazuelas are a more representative unit of analysis for household wealth.
While construction costs vary based on area, area only provides a minimal cost estimate because it does not take into account other costs, such as height, type, and quality of construction materials, internal layout (one room versus multiple rooms), among others. In contrast, volume measurements incorporate height, more closely approximating construction costs (see also Canuto et al. Reference Canuto, Auld-Thomas, Yagi and Barrientos Q.2023; Hutson et al. Reference Hutson, Stanton and Ardren2023; Munson et al. Reference Munson, Scholnick, Mejía Ramón and Aragon2023). The volume Ginis based on a LiDAR-derived DEM dataset—that is, extant archaeological mounds—were higher than the modified volume Ginis calculated using an urban DEM based on trigonometrically derived structure heights. A comparison of the output volumes between these two datasets indicates that the calculated volumes for the LiDAR-derived DEM are higher than the volumes for the urban DEM. The reason for these differences has not yet been investigated, but may result, in part, from (1) unintentional inclusion of natural topography into the LiDAR-derived volumes using extant archaeological mounds; along with the fact that (2) the urban DEM standardizes architecture into four types, likely reducing diversity in the distribution of wealth inequality; and/or (3) the urban DEM does not include any subsurface construction.
Taking these factors into consideration, individual structure Gini indices and area Gini indices were removed. The range for the Gini indices based on volume and modified volume is narrowed to 0.71–0.85. Any value within this range indicates a high level of wealth inequality at Late Classic Copan. In comparison with other Gini coefficients from the areas presented in the articles of this Compact Special Section, these values seem uniquely high, suggesting greater wealth inequality at Copan (Chase Reference Chase2017; Thompson et al. Reference Thompson, Feinman, Lemly and Prufer2021b), with only similar results from El Pilar (Horn III et al. Reference Horn, Tran and Ford2023).
Conclusion and future directions
While the Gini coefficients indicate a greater degree of wealth inequality in the Copan Pocket in the Late Classic in comparison to other Maya regions (see this Compact Special Section), the results have limitations. Two significant limitations are: (1) the Gini coefficients are derived solely from area and volume, and thus exclude other variables representative of wealth inequality; and (2) wealth inequality represents only one aspect of inequality, which is complex and multifaceted, requiring deeper interrogation not only through the development of a quantitative approach using multi-proxy Gini coefficients (applicable to Maya settlement), but, importantly, by a thorough consideration of demographic, temporal, and cultural circumstances that is contextualized in previous (or future) quantitative and qualitative archaeological research.
The first limitation can be addressed, in part, by developing new computational approaches, such as a multi-proxy Gini coefficient that incorporates additional variables, such as construction materials, labor investment (Abrams Reference Abrams1994, Reference Abrams1997; Abrams and Bolland Reference Abrams and Bolland1999; Chase and Chase Reference Chase and Chase2014), and more precise calculations based on geospatial 3D volumetric analyses (simulating the ancient landscape), rather than using 2.5D DEMs derived from contemporary surface data. In this vein, future work involves employing procedural modeling to rapidly construct 3D models of ancient Maya architecture based on georeferenced building footprints for large spatial extents (entire cities) that can be used for volumetric analysis (Opitz et al. Reference Opitz, Richards-Rissetto, Dalziel, Dussault, Tunink and Garstki2022; Richards-Rissetto and Plessing Reference Richards-Rissetto and Plessing2015), in combination with multi-proxy Gini coefficients to delve deeper into the nuances of wealth inequality among the ancient Maya (Munson and Scholnick Reference Munson and Scholnick2022; see Horn III et al. Reference Horn, Tran and Ford2023; Munson et al. Reference Munson, Scholnick, Mejía Ramón and Aragon2023). The second limitation relates to the availability of demographic, temporal, and cultural data from excavations, surveys, and other lines of evidence. In the case of Late Classic Copan, it has a long history of archeological research that is integral for interpreting not only the Gini coefficient results, but for contextualizing any geospatial analyses.
Acknowledgments
The MayaArch3D project generously provided the LiDAR data. This research would not be possible without permission and support from the Instituto Hondureño de Antropología e Historia and the staff at the Centro Regional de Investigaciones Arqueológicas to work at the archaeological site of Copan, Honduras. I am grateful to Amy E. Thompson, Adrian Chase, and Gary Feinman for inviting me to join this effort to employ Gini coefficients as part of the Spatial Analyses of Maya Settlements (SAMS) collaboration.
Competing interests declaration
There are no competing interests.
Data availability statement
The author declares none.
Funding statement
Funding for the LiDAR data collection at Copan was provided by the Gerda Henkel Foundation and the Commission for the Archaeology of Non-European Cultures at the German Archaeological Institute (DAI).


 Open access