Abstract
Predictions of the Huber–Chankin (HC) scaling for the upstream impurity fraction were verified in a series of EDGE2D-EIRENE ('code') runs for highly radiating plasmas with nitrogen injection. The main quantity extracted from the code was poloidally averaged, from X-point to X-point, separatrix impurity fraction cZ in the main scrape-off layer (SOL). Variation of the main working gas (H, D and T) revealed a qualitative agreement between the model and code results owing to the very large isotope difference in the predicted cZ values caused primarily by the inverse isotope mass dependence of the H-mode power threshold assumed in the HC model and implemented in the code. At the same time, the variation of the toroidal field and safety factor in deuterium cases yielded no correlation between the model predictions and code results. The code showed much higher local impurity fractions (fZ) in the divertor compared to the main SOL, as well as large case-to-case variations in the divertor to the main SOL ratio of impurity fractions. The analysis of code results has wide-ranging consequences not only for the HC model, but also for other similar 1D models which use simple geometry ignoring strong neutral recycling in the divertor/ Different topology makes plasma parameters in the divertor and main SOL very different, resulting in different impurity charge state composition. Missing mechanisms in 1D codes (e.g. friction and thermo-forces exerted on impurity ions by main working gas ions) lead to impurity density redistribution. Neglecting all above factors, 1D models assume a constant impurity fraction along field lines.
Export citation and abstract BibTeX RIS

Original content from this work may be used under the terms of the Creative Commons Attribution 4.0 license. Any further distribution of this work must maintain attribution to the author(s) and the title of the work, journal citation and DOI.
1. Introduction
Large tokamaks of near-reactor or reactor size, such as ITER [1] and DEMO [2], are expected to operate at high plasma densities with partially detached divertors in order to reduce power loads on divertor plates. The detachment is assisted by injecting (also 'puffing' or 'seeding') impurities (typically, light impurities such as N, Ne or Ar) radiating a large part of the power flowing to divertors. At the same time, penetration of these impurities into the main, or 'core' plasma (inside the separatrix), may present a problem for sustaining a high fusion reaction rate due to the dilution of ion species responsible for the fusion reaction (D+ and T+), as well as due to cooling of the core plasma, leading to a reduction of the fusion power. Optimal impurity concentrations required to exhaust power in the scrape-off layer (SOL) and divertor, while at the same time maintaining acceptable fusion power levels in the core, are therefore important parameters for a fusion reactor.
A number of analytical studies were recently carried out to develop scaling for impurity fractions (defined as the ratio of the total impurity density, including all ionization stages, over the electron density). The model of Kallenbach et al [3] allows the prediction of the seed impurity fraction required to achieve partial detachment for a given power flux into the SOL, PSOL
, in devices with a closed divertor similar to that of ASDEX Upgrade. The other three models use a simplified 1D geometry covering the SOL and divertor regions, assuming constant impurity fractions along magnetic field lines. They are partly [4] or fully [5, 6] based on dimensionless parameters characterizing an acceptable PSOL
(high enough for the total power input into the plasma, Pin
, to exceed the minimum power level required for the plasma to stay in the high-energy confinement mode, or 'H-mode'), sufficiently high plasma density necessary for high fusion yield, and the 'radial' decay length of the parallel power flux in the SOL in the direction perpendicular to the magnetic surfaces. In particular, the Reinke model [5] solves a complete set of equations in order to eliminate an explicit dependence on PSOL
by replacing it with the dependence on the fLH
coefficient, which is the factor of excess of Pin
over Martin's experimentally established H-mode power threshold [7]. This is justified by the link between cZ
and the impurity radiation power Prad,imp
(or Prad,N
in this paper due to the injection of nitrogen), which in detached conditions approaches the power flux into the SOL. The explicit dependence on the separatrix electron density ne,sep
is replaced by the dependence on the Greenwald density limit [8] fraction fGW
(as in [4]), here defined as ne,sep
/ne,GW
. The radial decay length of the parallel power flux in the SOL  is related to the experimentally established Eich scaling [9]. In a simple 1D SOL (and divertor) model,
  represents the SOL width.
The most recent of the models listed above is the Huber–Chankin (HC) model [6]. Among other models, the Reinke model [5] is ideologically the closest to the HC model. Unlike [5], the [6] model contains a hydrogen isotope mass scaling (covering H, D and T isotopes) of the main working gas used in the discharge. Correspondingly, Martin's scaling for the H-mode power threshold PLH
is corrected by the inclusion of the dependence on the isotope mass (inversely proportional to it) first established experimentally in [10]. Also, motivated by tracing the impurity fraction dependence on the isotope mass, the HC model uses Goldston's heuristic drift-based (HD) model for  [11] instead of Eich's model, which does not have isotope mass dependence. The HD model for
  is in a reasonable quantitative agreement both in absolute magnitude and in scaling with the experimental data [11]. Finally, the fGW
dependence in [5] is replaced by the dependence on the ratio of ne,sep
over the critical separatrix electron density ne,crit
following from Goldston's model for the density limit caused by the MHD instability in the SOL close to the separatrix [12]. Its use eliminates the need to relate the separatrix density, one of the key parameters in this study, to the Greenwald density limit, which depends on the line-averaged density. It has to be pointed out that in models [4–6] the only source of volumetric power loss is impurity radiation.
is in a reasonable quantitative agreement both in absolute magnitude and in scaling with the experimental data [11]. Finally, the fGW
dependence in [5] is replaced by the dependence on the ratio of ne,sep
over the critical separatrix electron density ne,crit
following from Goldston's model for the density limit caused by the MHD instability in the SOL close to the separatrix [12]. Its use eliminates the need to relate the separatrix density, one of the key parameters in this study, to the Greenwald density limit, which depends on the line-averaged density. It has to be pointed out that in models [4–6] the only source of volumetric power loss is impurity radiation.
The present study is dedicated to testing the impurity fraction scaling following from the HC model using the EDGE2D-EIRENE code package combining the coupled plasma 2D edge fluid code EDGE2D with the neutral Monte-Carlo solver EIRENE [13–15]. The code package covers the outer core, SOL and divertor regions. Of particular interest is the scaling for the impurity density cZ including all of its charge states, nZ , divided by the electron density ne and averaged over all cells of the first poloidal ring (of the EDGE2D grid) outside the separatrix, from X-point to X-point. In this averaging the sum of fZ cell values multiplied by the poloidal cell sizes was divided by the sum of the poloidal sizes. As pointed out in the paper on the physics basis for the first ITER tungsten divertor, containing a detailed description of simulations with the edge 2D fluid code SOLPS coupled with EIRENE [16], this is the most convenient quantity for coupling SOL to a core model, and has been the key point of the SOLPS-4.3 model for ITER since 2003. This quantity is typically quoted in percentage terms.
As will be discussed later in the paper, assumptions used in the HC and similar models based on a simple 1D geometry may come into conflict with 2D distributions of plasma parameters in the SOL and divertor. Since no experimental data are used in this paper, the present study represents a model (1D) to code (2D) comparison. Regardless of the exact assumptions of a 1D model, certain features, such as the neglect of neutral ionization processes, the very different plasma parameters in the SOL and divertor, and the absence of friction and thermo-forces exerted on impurities by the main ions potentially leading to significant differences between impurity fractions in the SOL and divertor (while a spatially constant impurity fraction is assumed in a model), can render the model results unreliable. In this respect, the present study is, more generally, a test of the ability of simple 1D models to predict impurity fractions with a certain degree of reliability when confronted with the 2D effects of a real magnetic geometry, which are omitted in 1D models but included in much more detailed 2D models.
In this paper, section 2 describes the HC model and the strategy of its verification by the EDGE2D-EIRENE code. The setup of the EDGE2D-EIRENE ('code') cases is described in section 3. The predictions of the HC model are compared with the code results in section 4. The power balance in the code cases is analyzed in section 5. Consistency between the full HC model scaling for cZ , including some of its parameters that cannot be predicted, and the code output is checked in section 6. The causes of the discrepancies between the model predictions and code results are analyzed in section 7. The results of this work are summarized in section 8.
2. HC model and strategy of its verification by EDGE2D-EIRENE
The final scaling for cZ derived in [6] (equation (37)) is replicated here without a numerical coefficient and with some re-arrangement of terms:
Here,  , and the ratio is assumed to be constant along the field lines in the model. B is the toroidal field,
  , where LZ
is the cooling rate coefficient due to impurities, Te,t
and Te,u
are the target and upstream electron temperatures, qc
is the cylindrical safety factor, and A is the hydrogen isotope mass. fLH
= Pin
/PLH
is the ratio of the input power by the H-mode power threshold, fne
= ne,sep
/ne,crit
, with the expression for ne,crit
given by equation (28) of [6]; the scaling for ne,crit
relevant to the present study is given by equation (A4) in
, where LZ
is the cooling rate coefficient due to impurities, Te,t
and Te,u
are the target and upstream electron temperatures, qc
is the cylindrical safety factor, and A is the hydrogen isotope mass. fLH
= Pin
/PLH
is the ratio of the input power by the H-mode power threshold, fne
= ne,sep
/ne,crit
, with the expression for ne,crit
given by equation (28) of [6]; the scaling for ne,crit
relevant to the present study is given by equation (A4) in  figuring in Martin's H-mode power scaling (where we add the dependence on the isotope mass A to this scaling, since it was used in the derivation of equation (1), and remove the numerical coefficient):
In the above scaling, in its second proportionality, we replace  with ne.sep
and drop the
with ne.sep
and drop the  coefficient, implicitly assuming proportionality between these two quantities. This is a reasonable assumption since the power threshold PLH
is known to be dependent on the edge rather than the line-averaged density (see e.g. [17, 18]) and because we will be using the EDGE2D-EIRENE code to verify the scaling equation (1), and this code covers only the edge plasma. Hence, retaining the fsep
coefficient cannot potentially bring any additional information. Also, in the second proportionality of equation (2) we drop the dependence on the area S of the flux surface containing the magnetic separatrix since the same EDGE2D (JET) grid will be used in all EDGE2D-EIRENE cases considered here.
coefficient, implicitly assuming proportionality between these two quantities. This is a reasonable assumption since the power threshold PLH
is known to be dependent on the edge rather than the line-averaged density (see e.g. [17, 18]) and because we will be using the EDGE2D-EIRENE code to verify the scaling equation (1), and this code covers only the edge plasma. Hence, retaining the fsep
coefficient cannot potentially bring any additional information. Also, in the second proportionality of equation (2) we drop the dependence on the area S of the flux surface containing the magnetic separatrix since the same EDGE2D (JET) grid will be used in all EDGE2D-EIRENE cases considered here.
The GA and GZ parameters in equation (1) are related to the exact composition of the ion component:
where  is the average ion mass, including all ionization stages of impurities,
  is the average ion charge, again including all ionization stages of impurities, and Zeff
has its usual meaning.
is the average ion charge, again including all ionization stages of impurities, and Zeff
has its usual meaning.
Finally, the dependencies on the major radius R, plasma elongation k and inverse aspect ratio  in equation (1) are grouped together in terms separated by the multiplication sign '×'. They will not be used in the present study, which is based on EDGE2D-EIRENE runs using only one computational grid, as was pointed out above. The dependence on these parameters will therefore be omitted in the rest of the paper.
In order to use the EDGE2D-EIRENE output results for comparison with the scaling equation (1), in this work another parameter was introduced into the set of equations, and the dependence of cZ
on it was traced in the derivations. This parameter is the ratio of the heat flux decay length (or the SOL 'power width' used in the 1D model) to that following from the HD model:  , where
  is the power decay length equal to 2/7
  , and
, and  is given by equation (6) of [11]. Since it is difficult to match
  in the code calculations to
  , the equations in [6] were re-derived to track the dependence on this additional parameter, yielding the dependence
  that has to be added to the right-hand side of equation (1); see equation (6).
Special attention should be paid to the GA
dependence in equation (1). For very low impurity concentrations,  and
and  (for hydrogen isotopes as the main gas), and the dependence of
  on
on  scales as
  against A, resulting in the scaling
  becoming much stronger:
  . For the impurity content relevant to this study,
  has a weaker dependence on A. For example, for nitrogen as the only impurity and
  (3%),
(3%),  is found, and this dependence is further weakened with the increase in the nitrogen impurity density. Nevertheless, as will be demonstrated later in the paper, the dependence of GA
on A in this study for most of the EDGE2D-EIRENE code cases is strong enough for it to be included in the main part of the cZ
scaling. We therefore include it by introducing the additional parameter dependence
is found, and this dependence is further weakened with the increase in the nitrogen impurity density. Nevertheless, as will be demonstrated later in the paper, the dependence of GA
on A in this study for most of the EDGE2D-EIRENE code cases is strong enough for it to be included in the main part of the cZ
scaling. We therefore include it by introducing the additional parameter dependence  plus a redefined correction factor
We now present the final cZ scaling to be used in this paper, including the dependence on fHD relevant to the present study:
where
Note that the dependence on fsep does not figure in equations (5) and (6) since any reference to the line-averaged density was removed in the present work, as discussed above.
Dependencies on A, B, qc, fLH
and fne
will be considered to be the main dependencies. They can be used for predictions of cZ
values. The first three parameters, A, B and qc
, will be varied in EDGE2D-EIRENE runs. Other dependencies should be considered as corrections; see equation (6). They cannot be used at the stage of setting input parameters for EDGE2D-EIRENE runs and can only be extracted from the code output. For example, despite the HC model using  as the power decay length, the exact match
  is difficult to achieve in the code modelling; hence, the correction coefficient fHD
extracted from the output of the code cases was introduced in the HC model, as explained above. This applies to all f-coefficients. As for fLH
, it cannot have the same value for all cases, because the H-mode threshold power depends on the density, which, in turn, can deviate from the aimed dependence equation (A2), hence the appearance of the case-to-case fne
variation. It has to be stressed that the actual ne,sep
value achieved in each code case cannot, strictly speaking, be 'set'; it is rather the 'target' value. The difference between these two values is given by the fne
correction factor.
is difficult to achieve in the code modelling; hence, the correction coefficient fHD
extracted from the output of the code cases was introduced in the HC model, as explained above. This applies to all f-coefficients. As for fLH
, it cannot have the same value for all cases, because the H-mode threshold power depends on the density, which, in turn, can deviate from the aimed dependence equation (A2), hence the appearance of the case-to-case fne
variation. It has to be stressed that the actual ne,sep
value achieved in each code case cannot, strictly speaking, be 'set'; it is rather the 'target' value. The difference between these two values is given by the fne
correction factor.
3. Setup of EDGE2D-EIRENE cases
The starting EDGE2D-EIRENE case (also referred to as the 'code case') in this study is a simulated radiative partially detached inter-Edge Localized Modes (ELM) H-mode JET plasma with an ITER-like wall in a vertical divertor configuration (with both strike points on vertical targets) based on one of the cases in [19]. The main working gas was deuterium, which was puffed from the inner divertor above the strike point. To cool the plasma, nitrogen (N) was evenly puffed as molecules (N2) from the outer, low magnetic field side, between the entrance to the outer divertor and the outer midplane (OMP). Beryllium (Be) sputtered from the wall was also part of the ion mix in the simulation; however, it had very little effect on the plasma dominated by D (deuterium, puffed as D2 molecules) and N puffs. The plasma density was controlled by the D puff and pumps positioned in the corners of the EDGE2D grid in the divertor, with the constant pump albedo. For neutral atoms and molecules, and impurity atoms, the Kotov-2008 EIRENE model [20] was used. Further details of the experimental data and simulations can be found in [19].
The EDGE2D grid used for the simulations can be found in [21], figures 2 and 3. The catalogued no-drift case selected from this study, ajarvin/edge2d/jet/85274/feb2116/seq#3, corresponded to a partially detached plasma with 8 MW of input power into the grid and 5 MW of nitrogen radiation. In the present study, Be was removed from the plasma ion mix and the case was re-run under the latest EDGE2D version. The case was then pushed towards the maximum nitrogen radiation Prad,N = 6.03 MW by increasing the N puff. The catalogued case is alexc/edge2d/jet/85274/jul2223/seq#1. This case is labelled as case D (for deuterium) here and is also often referred to as the reference D case.
The OMP profiles of the electron and ion temperatures, Te and Ti , and electron density ne for this case are shown in figure 1.
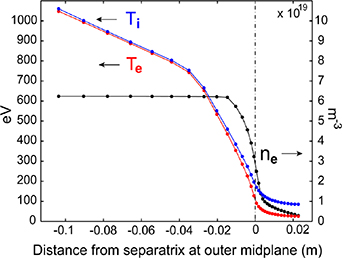
Figure 1. OMP profiles of Te, Ti and ne for the reference D case. Vertical dash-dotted line indicates the separatrix position.
Download figure:
Standard image High-resolution imageThe target profiles of power density Ptarget, Te and ne for the reference D case are shown in figure 2. Very low Ptarget and Te values around the strike points indicate that most of the input power in this case was radiated. Details of the power balance for this case will be presented in section 5.

Figure 2. Target profiles of power density, Te and ne for the reference D case. Vertical dash-dotted lines indicate strike point positions.
Download figure:
Standard image High-resolution imageFor comparison with the isotope scaling of the HC model, two more EDGE2D-EIRENE code cases were run, with deuterium replaced by hydrogen (case H) and tritium (case T). In addition, based on the D case, for comparison with B and qc
scalings of the HC model, four more cases were run; with higher and lower toroidal field B (cases HB and LB, respectively), and with higher and lower qc
than in the D case (cases Hq and Lq, respectively). The input parameters for these cases are consistent with dependences on fixed dimensionless coefficients fLH
and fne
= ne,sep
/ne,crit
. In
Variation of the input power Pin has a profound effect on the edge plasma. It was varied by a factor of 1.3, with Pin in the HB case being larger and in the LB case lower than in the D case. (Keep in mind that the HB, LB, Hq and Lq cases all had deuterium as the main working gas). According to the PLH scaling in equation (2), the factor 1.3 variation in Pin (higher and lower by this factor) requires factor 1.22 variation of B in the code cases. The cylindrical safety factor qc was varied by a factor of 1.5, again, higher and lower by this factor, in the cases Hq and Lq, respectively.
Cases with higher and lower qc used the same EDGE2D grid, but the code plasma transport equations were changed. In EDGE2D, the effect of the higher qc by a factor of 1.5 is achieved by specifying the extra namelist parameter BTHFACT, which, when set to 1.5, multiplies the ratio of poloidal to total magnetic fields by this factor in transport equations. The lower qc is achieved, correspondingly, by setting BTHFACT = 0.667.
It has to be pointed out that the value of B in all code cases by itself plays no role since, in the EDGE2D-EIRENE model described here, drifts were switched off. The influence of the B and qc
variation on the code case setups, as well as the influence of the isotope mass A variation comes via dimensionless parameters. For example, using H instead of D increases Pin
by a factor of 2 due to the inverse isotope mass scaling of the H-mode power threshold given by equation (2). Since the isotope mass A also figures in the scaling for the critical separatrix electron density ne,crit
(see equations in [6], as well as equations (A2) and (A4), where it is denoted as ne,sep
), ne,sep
must be changed by varying the hydrogen isotope gas puff (GP) level, and similarly the power decay length  , which also has dependence on A.
The decay length  cannot be easily controlled in the code run. In this study, its variation was achieved by varying anomalous perpendicular transport coefficients for electron and ion power fluxes. According to the models in [4–6], the decay length of the parallel power flux in the SOL is attributed to the decay length of the electron conductive power flux given by
  , where
  is the radial decay length of the electron temperature. In order to be able to change
  in the code, the electron perpendicular heat conduction
  has to be varied according to the scaling equation (A9) derived in
  , following from this scaling, was applied to each radial position of the EDGE2D grid. (In EDGE2D input panels, transport coefficients are specified for a few radial positions at the OMP. Linear interpolations onto cell center positions between each two successive transport coefficients are done using the code. Therefore, variation of the entered transport coefficient values by a certain factor ensures that for all cells of the EDGE2D grid, variations in transport coefficients are calculated using the same factor.) The same factor was also applied to the ion heat conduction coefficient
  , but this procedure was not extended to the particle diffusion coefficient
  since, according to models [4–6], the ne
decay length has no impact on cZ
scaling, and only
since, according to models [4–6], the ne
decay length has no impact on cZ
scaling, and only  is taken into account when defining the SOL (power) width.
Generally, using variable  coefficients is not absolutely necessary, since any deviation of
  from
from  extracted from the code output can be included in the correction factor
  . Still, varying
  makes the code case parameters and profiles closer to those of the used model, reducing the correction factor fHD
.
makes the code case parameters and profiles closer to those of the used model, reducing the correction factor fHD
.
4. cZ from EDGE2D-EIRENE cases and predictions of the HC model
In this section we compare predictions of the cZ
scaling given by equation (5), but without the fcorr
coefficient, with cZ
values extracted from the code runs for plasma parameters along the first poloidal ring outside of the separatrix (ring s01, using EDGE2D nomenclature), from the outer to inner target plates in the divertor, in line with cell counting in EDGE2D. The radial profile effects relating the code output to the simple 1D model scaling are accounted for by including the radial power decay length  at the OMP position, corresponding to the SOL width of the HC model scaling.
The separatrix density correction factor fne is also included in this predictive part of the scaling since the electron density at the OMP position is the input parameter for analytical scaling, while in the code results some deviations from the 'setup' ne values, following from equation (A4), occurred.
The input power into the EDGE2D grid Pin
in setting up the EDGE2D-EIRENE cases follows equation (A1), which, after elimination of the ne,sep
dependence, yields the scaling (A3) (which assumes that ne,sep
follows the scaling equation (A4)). Since the separatrix electron density in the code cases did not match this scaling, the correction coefficient fne
in equation (5) should also impact the fLH
coefficient via the dependence of PLH
on the separatrix density according to equation (2):  (see the discussion on the density power threshold dependence in section 2). Hence, the density correction factor fne
should also impact fLH
according to
(see the discussion on the density power threshold dependence in section 2). Hence, the density correction factor fne
should also impact fLH
according to  , since e.g. for higher code separatrix electron density compared to that following from the scaling equation (A4), the input power becomes lower compared to that used in the scaling for PSOL
; hence,
, since e.g. for higher code separatrix electron density compared to that following from the scaling equation (A4), the input power becomes lower compared to that used in the scaling for PSOL
; hence,  , giving the following total dependence on this parameter (and remembering that cZ
scales with
, giving the following total dependence on this parameter (and remembering that cZ
scales with  ):
):
The above scaling without fcorr will be used in this section to calculate the HC model predictive cZ values instead of equation (5).
Table 1 contains relevant information on the EDGE2D-EIRENE cases. The catalogued case names are given by their suffixes, which must have the same prefix 'alexc/edge2d/jet/85 748/jul'. Pin
is the input powers into the computational grid. B(T) is a toroidal magnetic field on axis, and q95 is the safety factor at 95% of magnetic flux used as a proxy for qc. Te,sep
and ne,sep
are the electron temperature and density at the OMP position. fne
is the correction factor calculated by dividing code ne,sep
by the 'target' electron density following from the density scaling in equation (A4). Since the D case is considered to be a reference case on which other case parameters are often normalized, fne
for this case is set to be equal to 1. ' HC' is the nitrogen impurity fraction calculated according to the HC model (see equation (7) without the fcorr
factor) and '
HC' is the nitrogen impurity fraction calculated according to the HC model (see equation (7) without the fcorr
factor) and ' code' is the same impurity fraction extracted from the EDGE2D-EIRENE solutions. An asterisk in '
 ' indicates that these values were normalized by those in the reference D case. It has to be acknowledged that such a normalization reflects the authors' assessment of the code's poor ability to predict absolute cZ
values owing to the number of simplifications adopted in the model, mostly related to its simple 1D geometry.
' indicates that these values were normalized by those in the reference D case. It has to be acknowledged that such a normalization reflects the authors' assessment of the code's poor ability to predict absolute cZ
values owing to the number of simplifications adopted in the model, mostly related to its simple 1D geometry.
Table 1. Main parameters of EDGE2D-EIRENE code cases and comparison between the HC model predictions and code results.
| Case label | Case name (suffix) | Pin MW | B T | q95 | Te,sep (eV) | ne,sep (109m−3) | fne |
 HC HC |
 code code |
|---|---|---|---|---|---|---|---|---|---|
| D | 2223/seq#1 | 8.0 | 2.67 | 3.20 | 89.9 | 89.9 | 1 | 1 | 1 |
| H | 1823/seq#1 | 15.1 | 2.67 | 3.20 | 140.7 | 140.7 | 1.56 | 2.45 | 2.73 |
| T | 1923/seq#4 | 5.52 | 2.67 | 3.20 | 70.6 | 70.6 | 0.94 | 0.40 | 0.24 |
| HB | 1923/seq#1 | 10.4 | 3.26 | 3.20 | 100.5 | 100.5 | 1.13 | 1.05 | 1.18 |
| LB | 1923/seq#2 | 6.16 | 2.19 | 3.20 | 64.6 | 64.6 | 0.98 | 0.78 | 1.36 |
| Hq | 2023/seq#1 | 5.90 | 2.67 | 4.80 | 64.2 | 64.2 | 0.94 | 1.32 | 1.34 |
| Lq | 1923/seq#3 | 10.8 | 2.67 | 2.13 | 91.5 | 91.5 | 1.01 | 0.84 | 1.79 |
The absolute values for (poloidally averaged along the separatrix, from X-point to X-point, along ring s01) code  values in % are (from D to Lq case): 4.47, 12.21, 1.06, 5.28, 6.08, 6.01, 8.00.
As can be seen from this table, apart from the high correlation between the model and code  values for the D, H and T cases, there is no correlation (or rather, a slightly negative correlation of −0.34, to be precise) between these values for cases in deuterium plasmas (cases D, HB, LB, Hq and Lq). In particular, between the pairs of cases HB, LB and Hq, Lq, trends of the
  values are opposite. There is also a large difference between the
  values from the HC model in cases LB and Hq, while in the code the
  values are very close to each other.
The good correlation between the model and code  values in the isotope scan (H, D and T) can be attributed to the very large difference in Pin
in these cases caused by the use of the PLH
∼ 1/mi
dependence. The Pin
variation among the isotope cases is significantly larger than that among the five cases in deuterium. Since in the modelling all cases were pushed to the maximum radiated power, mostly on N, these cases had the largest difference in N radiation (see Prad,N
values in table 2 in the next section). The large Prad,N
difference between the code cases does not necessarily guarantee a large cZ
difference, but at least it is a strong argument to consider this to be a plausible explanation for the above-mentioned correlation.
values in the isotope scan (H, D and T) can be attributed to the very large difference in Pin
in these cases caused by the use of the PLH
∼ 1/mi
dependence. The Pin
variation among the isotope cases is significantly larger than that among the five cases in deuterium. Since in the modelling all cases were pushed to the maximum radiated power, mostly on N, these cases had the largest difference in N radiation (see Prad,N
values in table 2 in the next section). The large Prad,N
difference between the code cases does not necessarily guarantee a large cZ
difference, but at least it is a strong argument to consider this to be a plausible explanation for the above-mentioned correlation.
Table 2. Parameters related to the power balance in the code cases.
| Case label | PSOL MW | Prad,N (MW), Prad,N /PSOL | Pother MW | Ptar, Pwall MW |
 (Prad,N
) (Prad,N
) |
|---|---|---|---|---|---|
| D | 7.84 | 5.42, 69% | 1.13 | 0.76, 0.56 | 1 |
| H | 14.11 | 10.71, 76% | 0.77 | 2.60, 0.14 | 1.21 |
| T | 5.46 | 2.87, 53% | 1.13 | 0.59, 0.89 | 0.89 |
| HB | 8.74 | 5.16, 59% | 2.19 | 1.12, 0.41 | 0.85 |
| LB | 5.39 | 4.44, 82% | 0.52 | 1.10, 0.32 | 1.23 |
| Hq | 4.07 | 2.59, 64% | 0.52 | 0.12, 0.85 | 0.73 |
| Lq | 8.6 | 6.28, 73% | 1.73 | 0.56, 0.09 | 1.34 |
Two cases in table 1 stand out. The first is the reference D case. One would expect its code  value to be between the HB and LB case values, as well as between the Hq and Lq case values, since the B and qc
values for the D case are between those used in the above-mentioned pairs of cases. At least, this is expected from the HC model. In reality, the code
value to be between the HB and LB case values, as well as between the Hq and Lq case values, since the B and qc
values for the D case are between those used in the above-mentioned pairs of cases. At least, this is expected from the HC model. In reality, the code  value in this case is lower than in all of the other above-mentioned deuterium cases. Significant efforts were applied to raise
  in this case by running numerous cases with different scenarios regarding the application of D and N GPs. None of them was successful, and the code
  value remained below those in all four other deuterium cases. This may be related to effects not included in the simple 1D HC model, as will be further discussed in section 7.
The second unusual case is the H case, as its density correction factor fne (=1.56) strongly exceeds unity. Despite efforts made to reduce ne,sep by gradual case-by-case increases of the input power, D and N puff levels, this case could not be driven to the domain of plasma parameters that would satisfy the conditions of fne values ∼1 together with the large radiation fraction in the power balance. Without allowing a significant increase in ne,sep it was not possible to avoid a 'burnthrough' of high-temperature plasma from upstream to the outer target, resulting in a significant fraction of the target power deposition in the power balance. This is obviously strongly at odds with the assumptions of the HC model, where the power flux through the separatrix is assumed to be radiated on nitrogen. Apparently, the input power of 15.1 MW was too high for the H case to be mostly radiated on N without allowing a significant increase in ne,sep . As will become clear below in section 6 (see table 3), the H case plasma had a very high content of N ions of various ionization stages. The ionization of nitrogen neutrals and ions creates too many electrons, leading to the uncontrolled ne,sep rise.
Table 3. Output code parameters figuring in the full HC model scaling for detailed comparison between the model and the code.
| Case label |
 mm mm |

|

|

| GAA |

|

|

|

|
|---|---|---|---|---|---|---|---|---|---|
| D | 8.2 | 1 | 2.58 | 1.22 | 1.16 | 2.01 | 0.83 | 1 | 1 |
| H | 6.6 | 0.81 | 4.52 | 2.25 | 2.78 | 4.22 | 0.61 | 1.18 | 0.69 |
| T | 10.7 | 1.31 | 3.08 | 1.03 | 1.01 | 1.17 | 0.97 | 1.09 | 1.20 |
| HB | 7.7 | 0.94 | 2.74 | 1.28 | 1.20 | 2.23 | 0.77 | 0.88 | 1.07 |
| LB | 8.6 | 1.05 | 2.99 | 1.33 | 1.28 | 2.31 | 0.79 | 1.19 | 0.88 |
| Hq | 13.2 | 1.61 | 2.87 | 1.30 | 1.25 | 2.26 | 0.80 | 1.57 | 1.03 |
| Lq | 5.7 | 0.69 | 3.86 | 1.79 | 1.38 | 3.77 | 0.64 | 0.68 | 1.01 |
Failure to achieve the expected positive correlation of cZ
values between the model predictions and EDGE2D results may indicate that contributions from the quantities contained in the  term of equation (6), initially considered to be of secondary importance, may have a significant impact on the code predicted cZ
values. At the same time, in the code there exist several power loss channels, and the radiated power on N impurities is only one of them. In the next two sections, an analysis of power loss channels in the EDGE2D cases is performed, and the relative contribution of the impurity radiation is assessed, singling out this particular power loss and testing whether the model can reasonably describe cZ
code values when in the analysis the total power through the separatrix is replaced with the radiated power on N impurities (section 5). This analysis, together with the inclusion of the
term of equation (6), initially considered to be of secondary importance, may have a significant impact on the code predicted cZ
values. At the same time, in the code there exist several power loss channels, and the radiated power on N impurities is only one of them. In the next two sections, an analysis of power loss channels in the EDGE2D cases is performed, and the relative contribution of the impurity radiation is assessed, singling out this particular power loss and testing whether the model can reasonably describe cZ
code values when in the analysis the total power through the separatrix is replaced with the radiated power on N impurities (section 5). This analysis, together with the inclusion of the  multiplier in equation (6), is carried out in the following section 6.
5. Power balance in EDGE2D-EIRENE cases and related parameters
Before moving to extraction from the code cases and/or calculations based on them of a number of parameters figuring in the fcorr
factor equation (6), with the aim of achieving a better match between  values in the code and in the HC model, we would like to present some information regarding the power balance in the code cases in table 2. This is important since the code cases have a number of power loss channels that are not included in the HC model; for example, power losses on D (referred to as 'hydrogen' in EDGE2D) radiation or losses to the targets and the wall. If these power losses were to dominate the power balance, any comparison between the code and the (simple 1D) model would not make sense.
PSOL in table 2 is the power flux actually delivered to the SOL and divertor regions from the core through the separatrix. Prad,N is the nitrogen radiated power in the SOL and divertor. It, together with other power channels, can be extracted from the 'print' file created after the completion of each EDGE2D case, for each 'macro-zone' (SOL, inner and outer divertors connected to SOL along field lines, etc). It is this power that, strictly speaking, should be considered as PSOL in the framework of the HC model's equations, since all power losses in this model are attributed to the radiation of impurities. As one can see from the third column of the table, Prad,N accounts for more than 50% of the total power input through the separatrix; hence, the HC model, although not being detailed enough to cover all power losses, should at least be approximately applicable to the code case results.
Pother in the print files contains other volumetric power losses: atomic processes (neutral ionization and energy carried by neutrals), excited molecular states and dissociation energy, charge exchange energy, and 'hydrogen' (in our case deuterium) radiation. The remaining power losses are power fluxes to the target plates and the wall. None of the above power losses except for Prad,N are included in the HC model.
 is the normalized (on its value in the D case) coefficient
  , defined as the ratio of Prad,N
inside the SOL and divertor over Pin
in table 1. The Pin
values in all cases ensure the same PLH
when taking into account only A, B and qc
variations, but ignoring the actual ne,sep
in code cases that may differ from scaling equation (A4) by the correction factor fne
. Since in this and the next sections we use Prad,N
inside the SOL and divertor instead of Pin
as an input power,
, defined as the ratio of Prad,N
inside the SOL and divertor over Pin
in table 1. The Pin
values in all cases ensure the same PLH
when taking into account only A, B and qc
variations, but ignoring the actual ne,sep
in code cases that may differ from scaling equation (A4) by the correction factor fne
. Since in this and the next sections we use Prad,N
inside the SOL and divertor instead of Pin
as an input power,  is proportional to the ratio of Prad,N
over Pin
:
is proportional to the ratio of Prad,N
over Pin
:
The dependence of cZ
on  (or
(or  ) must be considered as part of the main dependence in the cZ
scaling, since, in the framework of the HC model, here we assume Prad,N
= PSOL
, where Prad,N
variation over cases can strongly deviate from that of Pin
. The dependence on the correction factor fne
was already included in the main part of the cZ
scaling; see equation (7). The cZ
scaling one should use when assuming Prad,N
= PSOL
can therefore be expressed as
) must be considered as part of the main dependence in the cZ
scaling, since, in the framework of the HC model, here we assume Prad,N
= PSOL
, where Prad,N
variation over cases can strongly deviate from that of Pin
. The dependence on the correction factor fne
was already included in the main part of the cZ
scaling; see equation (7). The cZ
scaling one should use when assuming Prad,N
= PSOL
can therefore be expressed as
where fcorr is given by equation (6) as before.
6. Consistency between the full cZ scaling from the HC model and EDGE2D-EIRENE output
We now proceed with the calculation of parameters figuring in the expression for fcorr in equation (6), which are entered in table 3. Parameters figuring in fcorr , as was pointed out earlier, cannot be used for the prediction of cZ values following from the HC model since their calculation requires more output from EDGE2D-EIRENE runs. It is of interest, however, to check whether their inclusion in the cZ scaling may improve its match with the code output. As with all other earlier calculated parameters, those figuring in table 3 are calculated at the OMP position.
 is calculated assuming exponential Te
decay at the OMP position between poloidal rings s01 and s05 separated by 4.4 mm.
is calculated assuming exponential Te
decay at the OMP position between poloidal rings s01 and s05 separated by 4.4 mm.  is given by equation (A7), GAA
by equation (4) and GZ
by equation (3). GAA
and GZ
require calculation of
is given by equation (A7), GAA
by equation (4) and GZ
by equation (3). GAA
and GZ
require calculation of  ,
,  and
and  dependent on the composition of the ion component, and both the hydrogen isotope and N ions, including their charges and masses.
The average ion mass  in table 3 is highest in the H case, where one would normally expect the lowest value due to the low mass of hydrogen. However, the very high impurity (N) content in this case, as was pointed out in section 4, makes the
  value highest in this case. Also, the average ion charge
  and
and  are highest in the H case. Using the values of these parameters, the calculation of GAA
and
are highest in the H case. Using the values of these parameters, the calculation of GAA
and  is straightforward. Together with A, B, qc
and ne,sep
from table 1, they allow one to calculate
is straightforward. Together with A, B, qc
and ne,sep
from table 1, they allow one to calculate  and then
  , which is entered in table 3 in its normalized form as
  .
.
The last parameter required for the calculation of fcorr
is  , which will be entered in table 4 in its normalized form as
  . The integral for calculating LINT
was presented in section 2. Here, this integral was taken from zero up to the highest Te
along the poloidal ring s01, which is quite close to Te
at the OMP positions in table 1 (Te,sep
). The radiative cooling rate coefficient LZ
figuring in the integral as a function of Te
was taken from [22] for the case of coronal equilibrium. This publication contains LZ
values for a number of impurities, including nitrogen, taken from the Atomic Data and Analysis Structure database. Figure 5 of [22] shows the Lz
(Te
) curve for nitrogen, with table 9 of this reference providing the polynomial fit coefficients. As can be seen in table 4,
. The integral for calculating LINT
was presented in section 2. Here, this integral was taken from zero up to the highest Te
along the poloidal ring s01, which is quite close to Te
at the OMP positions in table 1 (Te,sep
). The radiative cooling rate coefficient LZ
figuring in the integral as a function of Te
was taken from [22] for the case of coronal equilibrium. This publication contains LZ
values for a number of impurities, including nitrogen, taken from the Atomic Data and Analysis Structure database. Figure 5 of [22] shows the Lz
(Te
) curve for nitrogen, with table 9 of this reference providing the polynomial fit coefficients. As can be seen in table 4,  shows quite moderate variation across code cases, with the maximum deviation from the D case being higher by a factor of 1.22 for the H case. For deuterium cases HB, LB, Hq and Lq, the largest difference from the D case is for the LB and Hq cases; for them,
  is lower than in the D case by a factor of 1.15.
Table 4. The impact of the radiative cooling parameter LINT and other parameters, considered to be of secondary importance and collected in the correction coefficient fcorr , on the comparison between cZ values in the HC model and the EDGE2D-EIRENE code.
| Case label |

|
 HC without fcorr HC without fcorr
|

|
 HC with fcorr HC with fcorr
|
 code code |
|---|---|---|---|---|---|
| D | 1 | 1 | 1 | 1 | 1 |
| H | 1.22 | 2.45 | 0.56 | 1.37 | 2.73 |
| T | 0.90 | 0.40 | 0.95 | 0.38 | 0.24 |
| HB | 1.06 | 1.05 | 0.87 | 0.97 | 1.18 |
| LB | 0.87 | 0.78 | 1.24 | 0.69 | 1.36 |
| Hq | 0.87 | 1.32 | 1.04 | 1.37 | 1.34 |
| Lq | 1.01 | 0.84 | 0.8 | 0.74 | 1.79 |
Table 4 also presents the model  values copied from table 1 and labelled as '
 HC without fcorr
', for easy comparison with other similar quantities, and the fcorr
coefficient following from the dependence in equation (6). It is clear that, apart from the non-deuterium cases H and T, fcorr
, similarly to LINT
, does not exhibit significant variations compared to the D case, varying by a maximum factor of 1.14, being lower in the LB case.
HC without fcorr
', for easy comparison with other similar quantities, and the fcorr
coefficient following from the dependence in equation (6). It is clear that, apart from the non-deuterium cases H and T, fcorr
, similarly to LINT
, does not exhibit significant variations compared to the D case, varying by a maximum factor of 1.14, being lower in the LB case.
Multiplication of ' HC without fcorr
' values by fcorr
gives the full
HC without fcorr
' values by fcorr
gives the full  values, calculated according to equation (9) with fcorr
calculated according to equation (5), and labelled '
values, calculated according to equation (9) with fcorr
calculated according to equation (5), and labelled ' HC with fcorr
' in the table. For easy comparison with the code, the values of
HC with fcorr
' in the table. For easy comparison with the code, the values of  , labelled '
 code', were copied into table 4 from table 1.
Summarizing the results of this section, it is clear that using even the full cZ scaling derived in model [6] does not provide a positive correlation (in fact, a small negative correlation of −0.38, similar to that when using model cZ values without fcorr ) between the model and code cZ for cases with deuterium as the main working gas. As for the subset of cases with different hydrogen isotopes (D, H and T cases), they exhibit at least a qualitative correlation between the model and code cZ values.
7. Causes of discrepancies between the model and code cZ
In all code cases, a large difference in the local (inside each cell) ion impurity density fractions fZ
= nN
/ne
between the main SOL and divertor regions can be seen (in this paper the notation cZ
is reserved for the poloidal average of fZ
in the main SOL region). The poloidal profiles of the nitrogen ion density fraction fZ
in cases D, HB and LB are presented in figure 3. Despite having a small difference in  of just a factor of 1.15 between the HB and LB cases, they have the largest difference in the average impurity fraction between the divertor and main SOL plasmas (see below) among deuterium cases. The impurity fractions are plotted against cell numbers from the outer to inner target instead of against the poloidal distance for the sake of better spatial resolution. The profiles in figure 3 show large drops in the fZ
values near the entrances to the inner and outer divertors. Such a strong difference between the fZ
values in the main SOL and in the divertor could be caused by the very different composition of impurity ions by charge states, with lower ionization states N+Z dominating in the divertor. According to the EDGE2D output, the dominant contribution to fZ
in the divertor comes from singly ionized N ions, while in the main SOL N+ charge states 5–7 dominate.
of just a factor of 1.15 between the HB and LB cases, they have the largest difference in the average impurity fraction between the divertor and main SOL plasmas (see below) among deuterium cases. The impurity fractions are plotted against cell numbers from the outer to inner target instead of against the poloidal distance for the sake of better spatial resolution. The profiles in figure 3 show large drops in the fZ
values near the entrances to the inner and outer divertors. Such a strong difference between the fZ
values in the main SOL and in the divertor could be caused by the very different composition of impurity ions by charge states, with lower ionization states N+Z dominating in the divertor. According to the EDGE2D output, the dominant contribution to fZ
in the divertor comes from singly ionized N ions, while in the main SOL N+ charge states 5–7 dominate.

Figure 3. Impurity fractions vs cell number for cases D, HB and LB. Vertical dash-dotted lines indicate entrances to divertor.
Download figure:
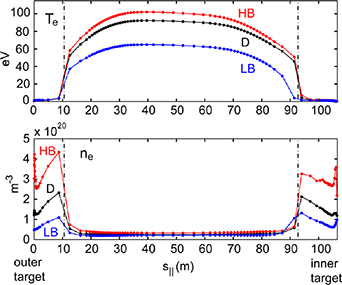
Standard image High-resolution imageThe strong difference between plasma parameters in the main SOL and divertor can be seen in the parallel (along B) profiles of Te and ne in figure 4 for the same cases as presented in figure 3. In these cases, which were aimed at achieving the maximum impurity radiation power, steep jumps in the Te and ne values across the boundary between the main SOL and divertors can be seen. The divertor plasma is, as usual, much 'colder' and 'denser' owing to the high neutral recycling at the target plates. The steepness of the transition is exacerbated by large cell volumes on both sides of the boundary, having a common node at the X-point position. For the LB case, which has one of the (two) lowest input powers among the deuterium cases, the transition is shifted towards the main SOL at the inner (high B) side by one cell.
Figure 4. Te and ne profiles along field lines for cases D, HB and LB. Vertical dash-dotted lines indicate entrances to divertor.
Download figure:
Standard image High-resolution image
The total ion (nitrogen) impurity content along ring s01 in the divertor is calculated by multiplying the nitrogen impurity density nN by cell volumes and summing up all cell contributions inside the inner and outer divertor regions to give NN,div . The same is done for the electron density, giving the total number of electrons in the divertor along ring s01, Ne,div . The ratio fZ,div = NN,div /Ne,div gives the average ion impurity fraction in the divertor. The same is done for the main SOL region, giving fZ,SOL = NN,SOL /Ne,SOL . The ratio Rdiv/SOL
will be used to characterize the difference between the average impurity fractions in the divertor and main SOL. Its values are given in table 5 (left column, for ring s01).
Table 5. cZ values and divertor to main SOL ratios of impurity fractions.
| Case label |
 ring s01 ring s01 |
 ring s02 ring s02 |

|
 ring s01 ring s01 |
 ring s02 ring s02 |
|---|---|---|---|---|---|
| D | 7.91 | 6.95 | 4.29 | 4.47 | 4.95 |
| H | 2.53 | 2.32 | 1.44 | 12.21 | 11.9 |
| T | 18.2 | 15.1 | 6.50 | 1.06 | 1.32 |
| HB | 1.93 | 2.99 | 1.92 | 5.28 | 4.45 |
| LB | 4.15 | 5.15 | 2.78 | 6.08 | 7.51 |
| Hq | 2.38 | 5.02 | 4.38 | 6.01 | 5.80 |
| Lq | 2.10 | 2.66 | 3.19 | 8.00 | 7.65 |
Apart from the  values being significantly above unity (with the average value for ring s01 among deuterium cases being 3.7), they also exhibit large case-to-case variations, ranging from 1.93 in the HB case to 7.91 in the D case, among deuterium cases, giving a factor of up to 4.1 variation. This is a significantly larger variation than that in the code cZ
(or
values being significantly above unity (with the average value for ring s01 among deuterium cases being 3.7), they also exhibit large case-to-case variations, ranging from 1.93 in the HB case to 7.91 in the D case, among deuterium cases, giving a factor of up to 4.1 variation. This is a significantly larger variation than that in the code cZ
(or  ) values, with a maximum difference between them, when comparing D and Lq cases, of factor 1.79 (see table 4, right column). The higher case-to-case variation of impurity fraction ratios
  among deuterium cases, compared to the variation of impurity fractions cZ
, further indicates a high degree of decoupling between the main SOL and divertor regions regarding impurity content.
among deuterium cases, compared to the variation of impurity fractions cZ
, further indicates a high degree of decoupling between the main SOL and divertor regions regarding impurity content.
Ratios  > 1 should contribute to the shift of the radiation power towards the divertor, in addition to the plasma parameters being more favourable for radiating low Z impurities there (higher density, lower temperature) compared to those in the main SOL. In the EDGE2D cases, the calculated nitrogen radiation is found to come predominantly from the divertor (summing up contributions from both the inner and outer divertors) plus two large volume cells in the main SOL with one of their nodes coinciding with the X-point. For cases D to Lq, as listed in the left column of table 5 for example, the fraction of the N radiation coming from this region, when divided into the total N radiated power from the whole s01 ring, is (in %): 98.6, 97.9, 99.0, 98.9, 87.3, 53.4, 98.5. Note the relatively low fraction of 53.4% in the Hq case compared to other cases, which must be related to the expansion of the high-density, low-temperature plasma from the divertor onto the main SOL cell adjacent to the X-point.
Despite the use of only one ring s01 parameters for comparison with the HC model being in agreement with the logic of the 1D HC model, as it yields the important (for the core plasma) cZ
quantity at the separatrix in the main SOL, it is of interest to check whether results based on this ring can be applied, at least qualitatively, to a wider region outside the separatrix. One might for example argue that, regarding the differences in impurity fractions between the main SOL and divertor, it is more relevant to use some more outward ring with cells positioned at a distance of ∼ from the separatrix, better representing the middle of the 1D 'grid', since its width is determined by
  in the HC model. The average
  for all cases is 2.5 mm. The position of the center of the OMP cell belonging to ring s02 is 2.86 mm outside of the separatrix. This ring may therefore be regarded as an alternative to ring s01 in representing the impurity density distribution between the main SOL and divertor. The
  values for ring s02 are shown in table 5. They exhibit a very similar case-to-case variation as for ring s01. The correlation of
  ratios between these two rings is 98.0%.
Calculation of the  ratio covering the whole grid (SOL width at the OMP position is 23.2 mm) requires multiplication of the total nitrogen ion density, as well as the electron density, by cell volumes inside of the divertor region, with the consequent division of the sum of the products over these cells by the same quantity calculated in the main SOL, yielding the ratio
  (for the whole EDGE2D grid). These ratios are also presented in table 5. The correlation between these values and those for ring s01 is 83.3%, with the average value being 3.50 for the whole grid, significantly below the 5.70 value for ring s01. Still, this indicates that the impurity ion distribution between the divertor and main SOL can to some extent be applied to the whole divertor and main SOL regions.
Finally, table 5 also presents cZ values calculated for ring s02, together with those for s01. The correlation between the two sets of data, covering all cases, is 97.6%.
8. Summary
A reasonably good match between the predictions of the HC model and code (EDGE2D-EIRENE) results on the poloidally averaged impurity fraction cZ
along the separatrix in the main SOL for D ('reference D case'), H and T cases has been obtained. The match can be explained by the inverse dependence of the H-mode power threshold on the hydrogen isotope mass of the main working gas, which in the code cases was set to be proportional to the input power into the EDGE2D computational grid, Pin
. The difference in Pin
among isotope (H, D, T) cases is significantly larger than among the five deuterium cases. For a higher Pin
, a higher impurity density, achieved by higher nitrogen puffing, is required to radiate the input power, which is a precondition for detachment. A higher impurity content is associated with a larger impurity fraction  . This may explain the positive correlation between
  values in the D, H and T cases and the predictions of the HC model.
At the same time, no correlation was found between the model and code  values among the deuterium cases: the (reference) D case, cases with higher and lower toroidal magnetic field (HB and LB cases, respectively), and cases with higher and lower cylindrical q (Hq and Lq cases, respectively). The code cases exhibited larger, by a factor of 3.7 on average (using
  values in deuterium cases), impurity fractions in the divertor than in the main SOL along poloidal ring s01. With the dominant part of the nitrogen impurity radiation coming from the divertor and two cells in the main SOL adjacent to the X-point, the model, which uses the assumption of a spatially (along field lines) constant impurity fraction, defined as the ratio of the sum of impurity species' densities over the electron density, and aiming to predict cZ
in the main SOL, becomes inadequate to describe the plasma parameters in the SOL and divertor. In addition to the large average ratio of the divertor to the main SOL impurity fractions, the code also gives a large (factor 4.1) case-by-case variation of this ratio (taking deuterium cases with the lowest and highest ratios).
values in deuterium cases), impurity fractions in the divertor than in the main SOL along poloidal ring s01. With the dominant part of the nitrogen impurity radiation coming from the divertor and two cells in the main SOL adjacent to the X-point, the model, which uses the assumption of a spatially (along field lines) constant impurity fraction, defined as the ratio of the sum of impurity species' densities over the electron density, and aiming to predict cZ
in the main SOL, becomes inadequate to describe the plasma parameters in the SOL and divertor. In addition to the large average ratio of the divertor to the main SOL impurity fractions, the code also gives a large (factor 4.1) case-by-case variation of this ratio (taking deuterium cases with the lowest and highest ratios).
The ultimate cause of the discrepancies between the model and code cZ values must be the effects of the real magnetic equilibrium consisting of the main SOL and divertor regions, which have quite different plasma parameters created mostly by high neutral recycling in the divertor, plus the totally unjustified assumption that fZ = const along field lines. The HC model and other similar models assume the simplest possible geometry and the absence of neutrals. Neutrals, apart from cooling the divertor plasma and raising the electron density by their ionization, create parallel plasma flows in both the main SOL and divertor, which is a 2D effect (see e.g. [23] chapter 15: 'Ionization-driven flow reversal', p 471). The friction force exerted on impurities by the main ions, together with the thermo-force caused by parallel ion temperature gradients, are known to strongly influence impurity density distributions along field lines.
Going back to the comparison of D, H and T cases, it is worth pointing out that the positive correlation between cZ
fractions in the model and the code could be achieved owing to exceptionally large differences in  values following from the code, ranging by a factor of 11.5 when comparing the H and T cases. This variation is even larger than the factor 7.2 variation in the
  ratio (again comparing the H and T cases), characterizing the difference between impurity fractions in the main SOL and divertor, which could be considered as 'scatter' influencing the cZ
values. Hence, the
ratio (again comparing the H and T cases), characterizing the difference between impurity fractions in the main SOL and divertor, which could be considered as 'scatter' influencing the cZ
values. Hence, the  variation may not have dramatically affected the positive correlation of cZ
values mentioned above. Still, in terms of the predicted power of the HC model's scaling for the H, D and T plasmas (and leaving aside the usefulness of such a prediction, since tokamak reactors considered presently are supposed to operate with only one, approximately 50/50% D–T mixture), it is still unacceptable because of the strong difference in impurity fractions between the highly radiating divertor plasma, to which the HC and other 1D models largely apply, and the main SOL plasma at the separatrix position, for which 1D models aim to predict
variation may not have dramatically affected the positive correlation of cZ
values mentioned above. Still, in terms of the predicted power of the HC model's scaling for the H, D and T plasmas (and leaving aside the usefulness of such a prediction, since tokamak reactors considered presently are supposed to operate with only one, approximately 50/50% D–T mixture), it is still unacceptable because of the strong difference in impurity fractions between the highly radiating divertor plasma, to which the HC and other 1D models largely apply, and the main SOL plasma at the separatrix position, for which 1D models aim to predict  .
.
Retrospectively, conclusions on the origin of the large mismatches between the predictions of the 1D model and the results of the 2D code EGDE2D-EIRENE seem obvious, and may not have warranted such a detailed analysis as was performed in this work. However, the situation could have been different if, suppose, EGDE2D-EIRENE had incidentally produced an acceptable correlation between the model and code  values, since the amount of data for the statistical analysis is very limited. The detailed analysis performed here therefore seems justified since it focusses attention on the fact that 1D models to a large extent describe high-radiation plasmas in the divertor and close to the X-point in the main SOL, while what is required are predictions for
  at the separatrix in the main SOL far away from the X-point, and there is a large degree of decoupling between impurity fractions in the two regions, judging by the large variation of
  ratios obtained in the code despite them being connected by power conduction from the main SOL to the divertor. In addition, important physics related to the poloidal distributions of impurity ions influenced by the balance between the friction and thermal forces between the main ions and impurities are absent in 1D models, and are replaced by a simplistic assumption of constant local impurity fraction fZ
along field lines. The 1D models could possibly be improved by accounting for the variation of local impurity fractions fZ
due to electron temperature variation along field lines via the different composition of impurity ions by their ionization states. This, however, would require also introducing the density dependence of the impurity composition (at present, the electron density does not explicitly figure in the 1D models). However, to account for parallel plasma flows and the friction force on impurities would require the introduction of neutrals in the models, ultimately pushing them towards becoming 2D models.
ratios obtained in the code despite them being connected by power conduction from the main SOL to the divertor. In addition, important physics related to the poloidal distributions of impurity ions influenced by the balance between the friction and thermal forces between the main ions and impurities are absent in 1D models, and are replaced by a simplistic assumption of constant local impurity fraction fZ
along field lines. The 1D models could possibly be improved by accounting for the variation of local impurity fractions fZ
due to electron temperature variation along field lines via the different composition of impurity ions by their ionization states. This, however, would require also introducing the density dependence of the impurity composition (at present, the electron density does not explicitly figure in the 1D models). However, to account for parallel plasma flows and the friction force on impurities would require the introduction of neutrals in the models, ultimately pushing them towards becoming 2D models.
Acknowledgments
This work has been carried out within the framework of the EUROfusion Consortium, funded by the European Union via the Euratom Research and Training Programme (Grant Agreement No. 101052200—EUROfusion). Views and opinions expressed are however those of the author(s) only and do not necessarily reflect those of the European Union or the European Commission. Neither the European Union nor the European Commission can be held responsible for them.
Data availability statement
All data that support the findings of this study are included within the article (and any supplementary files).
Appendix:
In this section we derive scalings for setting up the input parameters for the EDGE2D-EIRENE cases. The HC model's equations are derived using dimensionless parameters, such as the ratio of the input power by the H-mode power threshold and the ratio of the separatrix electron density by the critical electron density ne,crit following from Goldston's model for the density limit caused by the MHD instability in the SOL [12]. The code cases' input parameters should, ideally, keep the dimensionless parameters unchanged, so that correction factors 'f' would not be too different from unities.
We start with the scaling for Martin's H-mode power threshold corrected for the isotope dependence, equation (2), leaving only parameters relevant for the case setups and ignoring the difference between the line-averaged and separatrix electron densities, as discussed earlier:
Equation (28) of [6] provides the scaling for the separatrix electron density:
Substituting the ne,sep scaling into equation (A1), one obtains
Substituting the PSOL scaling equation (A3) back into equation (A2) yields
As pointed out above, this separatrix density can be reached by varying the D GP. At the same time, since the ultimate goal is to reach the maximum radiated power in the code cases, the exact match of ne,sep
by varying both deuterium and nitrogen puffs may be difficult when problems such as the failure of code cases or the appearance of oscillations of plasma parameters are encountered. In such cases correction factors  normalized to the reference case D, are used. They account for the deviation of code separatrix electron density from the scaling (A4).
In the derivations of [6], the power decay length  , following from the HD model, was used. This decay length is given by equation (35) of [6]:
The dimensionless variable  above is defined as
  , while the parallel connection length
  itself is proportional to
  . Hence,
  does not change when varying
  , and we can assume it to be constant. Using parameters GA and GZ, the above equation can be written as
Substituting  from equation (A1) into the above equation and replacing the GA dependence with the more relevant
  dependence equation (4), as discussed in section 2, gives
Here, the multiplication sign '×' separates the most important dependencies from the weaker dependencies.
In setting up new cases it is impossible to match the  scaling in the code case, and potentially large correction factors
  are inevitable. They may, however, be partly reduced by varying perpendicular transport coefficients, aiming at approaching the scaling
To satisfy equation (A8), electron perpendicular heat conduction  has to be varied in each code case. According to [23], equations (5.62) and (5.66), the relation between
  and
and  obeys the scaling
  . Apart from this dependence, there is also the square root dependence of
  on the product of upstream Te
and ne
, which is more difficult to include before knowing the output of the code run. In the present EDGE2D-EIRENE modelling, for the purpose of setting up individual cases, only the dependence
on the product of upstream Te
and ne
, which is more difficult to include before knowing the output of the code run. In the present EDGE2D-EIRENE modelling, for the purpose of setting up individual cases, only the dependence  was used, giving for the
  setup values