

Abstract
A rapid phase-out of unabated coal use is essential to limit global warming to below 2 °C. This review presents a comprehensive assessment of coal transitions in mitigation scenarios consistent with the Paris Agreement, using data from more than 1500 publicly available scenarios generated by more than 30 integrated assessment models. Our ensemble analysis uses clustering techniques to categorize coal transition pathways in models and bridges evidence on technological learning and innovation with historical data of energy systems. Six key findings emerge: First, we identify three archetypal coal transitions within Paris-consistent mitigation pathways. About 38% of scenarios are 'coal phase out' trajectories and rapidly reduce coal consumption to near zero. 'Coal persistence' pathways (42%) reduce coal consumption much more gradually and incompletely. The remaining 20% follow 'coal resurgence' pathways, characterized by increased coal consumption in the second half of the century. Second, coal persistence and resurgence archetypes rely on the widespread availability and rapid scale-up of carbon capture and storage technology (CCS). Third, coal-transition archetypes spread across all levels of climate policy ambition and scenario cycles, reflecting their dependence on model structures and assumptions. Fourth, most baseline scenarios—including the shared socio-economic pathways (SSPs)—show much higher coal dependency compared to historical observations over the last 60 years. Fifth, coal-transition scenarios consistently incorporate very optimistic assumptions about the cost and scalability of CCS technologies, while being pessimistic about the cost and scalability of renewable energy technologies. Sixth, evaluation against coal-dependent baseline scenarios suggests that many mitigation scenarios overestimate the technical difficulty and costs of coal phase-outs. To improve future research, we recommend using up-to-date cost data and evidence about innovation and diffusion dynamics of different groups of zero or low-carbon technologies. Revised SSP quantifications need to incorporate projected technology learning and consistent cost structures, while reflecting recent trends in coal consumption.
Export citation and abstract BibTeX RIS

Original content from this work may be used under the terms of the Creative Commons Attribution 4.0 license. Any further distribution of this work must maintain attribution to the author(s) and the title of the work, journal citation and DOI.
1. Introduction
The Paris climate goal aims to keep global warming well below 2 °C—or possibly 1.5 °C—and thus requires a rapid and sustained reduction in global CO2 emissions towards net zero. Only a structural shift away from unabated fossil fuels across all sectors of the world economy can deliver this (Hallegatte et al 2016, Rockström et al 2017, IPCC 2018). The carbon budget available for organizing the transition towards a carbon neutral economy is very limited in comparison to current annual emissions: At 2019 rates of about 43(±3.5) Gt CO2 yr−1 (Friedlingstein et al 2020) these budgets would be exhausted between 2028 (1.5 °C limit) and 2045 (2 °C limit).
However, in the absence of adequate climate action at the global scale, CO2 emissions are still on the rise globally, further locking societies into a fossil fuel-based energy system (Jackson et al 2018). National-level 2030 emission reduction pledges (nationally determined contributions—NDCs) do not yet break the sustained upward trajectory in global emissions and are incompatible with meeting the Paris goal (Vrontisi et al 2018, Höhne et al 2020, United Nations Environment Programme 2023).
Phasing out coal rapidly is of utmost importance to achieve the sustained emission cuts required by the Paris Agreement. The coal phase-out is one of the lowest hanging fruits for climate mitigation due to four main reasons (figure 1). First, coal accounts for roughly a third of global CO2 emissions (Friedlingstein et al 2019) and is the most carbon-intensive fossil fuel. Depending on type, coal is associated with 20%–45% more carbon per unit of heat content than the average fossil fuel (EIA 2016).

Figure 1. Four common arguments why phasing-out coal should be a priority of climate change policy.
Download figure:
Standard image High-resolution imageSecond, committed CO2 emissions (Davis and Socolow 2014) from existing and planned coal power plants jeopardize the 1.5 °C and also possibly the 2 °C goal, depending on assumed lifetimes and utilization rates (Edenhofer et al 2018, Tong et al 2019). Meeting the Paris climate goal therefore depends upon early retirements of the existing coal fleet, the cancellation of new plans for capacity extensions (Cui et al 2019, Tong et al 2019, Fofrich et al 2020) as well as shifts in financing trends away from coal (Gallagher et al 2021).
Third, more than 80% of coal is consumed in the power sector and the substitution of coal in the power sector is substantially easier from a technological and financial point of view compared to other fossil fuel phase-outs, even if challenges remain regarding the integration of variable renewable energies into power systems (Luderer et al 2018). Thus, economic efficiency considerations would suggest that a coal phase out would take first priority ahead of other fossil fuel phase-outs. In fact, a robust insight from integrated climate change mitigation scenarios is that the power sector is decarbonized first due to the availability of a variety of technological alternatives (Clarke et al 2014, Riahi et al 2022).
Fourth, coal-fired power generation is a significant threat to human health. Burning coal is a strong contributor to air pollution and a major cause of morbidity and premature death across the globe. In fact, recent analysis suggests the local environmental and health benefits of a coal phase-out could outweigh the direct policy costs (Rauner et al 2020a). Black-lung disease (coal Workers' Pneumoconiosis) continues to plague coal miners (Finkelman et al 2020), along with occupational health problems such as silicosis and the risk of mine collapses, especially in China (Zhang et al 2020). One study estimates that phasing out coal would save more than 50 million disability adjusted life-years by 2050 (Gibon et al 2017). Moreover, pollution from coal gives rise to many of the preexisting health conditions, such as asthma and respiratory diseases, which contribute to the morbidity and mortality from Covid (Pozzer et al 2020).
Even though an accelerated phase-out of coal has received growing attention by policymakers around the globe, the overall policy successes are still limited. In 2017, the Powering Past Coal Alliance (PPCA) formed to leverage early coal phase-out commitments in international climate change negotiations. As of 2023, its membership comprises 50 countries (covering 6.1% of global coal capacity), 49 subnational governments and 71 other organizations (PPCA 2023). Despite its steady growth, Blondeel et al (2020) question the effectiveness of the PPCA and also note that many coal dependent countries are unlikely to ever join it. Similarly, Jewell et al (2019) estimated that early retirement commitments pledged by PPCA members would only lead to a reduction of 1% of the globally committed emissions from existing coal power plants. Dynamic long-term scenario analysis suggests that the Alliance is 50% likely to capture 80% of today's coal market, but just ∼5% likely to realize the global phase-out of coal power by 2050, and this sector-specific action may conceivably induce an overall increase in emissions and coal use through various leakage effects if loopholes and laggards remain unaddressed (Bi et al 2023). Moreover, NDCs of major coal-producing and -consuming countries generally allow some growth of coal power generation capacity and still do not include clear clauses for a coal exit (Cui et al 2019, Edenhofer et al 2018, Kalkuhl et al 2019). Hence, there is a real urgency to dealing with coal when ratcheting-up NDCs to keep the Paris climate goal within reach.
In this review, we provide a first systematic assessment of coal-transition pathways in mitigation scenarios that are consistent with the global ambition of the Paris Agreement to limit warming to well below 2 °C and 1.5 °C. We use comprehensive, publicly available scenario results data that were collected for assessments by the IPCC for this purpose (Krey et al 2014b, Huppmann et al 2018). They contain comprehensive scenario information across a large range of variables on technology deployments, emissions by sectors and species, socio-economic background conditions, and investment expenditures. Thus, these data resources are much richer than what IPCC assessments have presented regarding coal trajectories. The main contribution of this review is therefore threefold: First, we provide a comprehensive and systematic analysis of coal consumption pathways across a large range of baseline and mitigation scenarios and identify typical pathways that we call 'archetypes' using a data-driven clustering approach. Second, we investigate what drives differences between and within the identified coal transition archetypes. To do so, we look at the composition of clusters with respect to their model families (model fingerprinting) as well as their scenario vintage. Third, we use historical data on energy technology upscaling and compare them to upscaling dynamics in models to investigate what drives the strong reliance on coal in some models.
2. The role of coal exits in climate change assessments
Assessments of the state of scientific knowledge by the Intergovernmental Panel on Climate Change have been fundamental for progress in international climate policy. Particularly, syntheses of evidence from model intercomparison exercises have been of key importance for understanding the role of humans in causing climate change, how climate impacts may play out in alternative futures or what alternative pathways to climate stabilization are available, what they cost and what they require technologically (Edenhofer and Kowarsch 2015, Kowarsch et al 2017, Minx et al 2017, 2019).
To date, IPCC reports have not comprehensively assessed coal phase-out scenarios. Mitigation scenarios are a central backbone of IPCC assessments and act as an integrative element across the different Working Groups (Moss et al 2010, Riahi et al 2017, van Vuuren et al 2017). At the highest level of the Summary for Policymakers (SPM), the Fifth Assessment Report (AR5) of IPCC Working Group III on climate change mitigation contained two findings highlighting the role of coal in baseline scenarios, as well as reduced revenues of coal producers from climate policy (IPCC 2014b). More substantially, the Special Report on Global Warming of 1.5 °C specifically highlights the steep reductions in CO2 emissions from coal use required in the power sector by mid-century in order to limit warming to 1.5 °C (IPCC 2018). The most recent Sixth Assessment Report provides some dedicated discussion of current coal phase-out policies as well as large ranges for coal consumption in 2030 and 2050 in different classes of scenarios (Clarke et al 2022). However, all of these reports do not provide insights into the underlying scenario assumptions which drive differences between models leading to these large ranges in coal use.
The lack of more attention devoted to coal transitions in IPCC reports is a direct reflection of the underlying literature on long-term scenarios in the integrated assessment modeling community. IPCC assessments do not carry out new research, but synthesize available evidence and literature (Kowarsch et al 2017, Minx et al 2017). Key tools in integrated assessment modeling for identifying robust insights in long-term mitigation scenarios are model intercomparison projects (Duan et al 2019, Minx et al 2019).
Model intercomparison exercises are powerful tools to systematically analyze variation in model results based on a study protocol and harmonized model inputs and scenario designs. So far, these projects have focused on broader decarbonization issues to inform key aspects of IPCC and other climate change assessments. For example, for IPCC AR5 a lot of attention was given to assessing the viability and requirements of 2 °C scenarios, in particular the implications of delayed climate policy and the role of individual technologies in climate goal achievement (e.g. Clarke et al 2009, Kriegler et al 2013, 2014b, Krey et al 2014a, Riahi et al 2015, Kriegler and Mouratiadou 2016).
Similarly, for the SR1.5, efforts were directed towards providing new evidence on mitigation pathways consistent with the more ambitious 1.5 °C limit and how they differ from 2 °C pathways (e.g. Vrontisi et al 2018, Rogelj et al 2018a, Kriegler et al 2018b); the particular role of carbon dioxide removal (Smith et al 2016, Bauer et al 2018, Strefler et al 2018b, Hanssen et al 2019); as well as addressing mitigation in the broader context of the sustainable development goals (McCollum et al 2018, Luderer et al 2019, van Soest et al 2019; von Stechow et al 2016).
So far, not one model comparison exercise in the integrated assessment community has been specifically designed to assess coal-transition dynamics in the context of climate change mitigation comprehensively. In fact, the second model intercomparison by the Stanford Energy Modeling Forum in the late 1970s looked at coal transitions, but with a focus on air pollution limited to the study period 1980–2000 (Energy Modeling Forum 1978). Many of the recent model intercomparison exercises have implicitly and explicitly dealt with a fossil fuel phase-out more generally in light of the net-zero emissions requirement, but have not specifically focused on the role of coal within those transitions in any detail (see table 1). This is rather surprising given that single-model fossil fuel analyses have routinely motivated the phase-out of coal well ahead of oil and gas (McGlade and Ekins 2015, Bauer et al 2016, McJeon et al 2021). Most recently, Welsby et al (2021) made the striking assertion that 90% of current coal reserves must remain underground to respect the 1.5 °C target, and Tong et al (2021) found that air pollution-related deaths can be cut by half if the decarbonization pathway entails very early retirement of coal power plants.
Table 1. Model intercomparison projects covered in the database.
| Study name | Description (incl. policy case) | # number of scenarios (# model frameworks) | References |
|---|---|---|---|
| Scenarios from SR1.5 (Huppmann et al 2018) and other post-AR5 databases | |||
| SSP | Development of new community scenarios based on the full SSP framework limiting end-of-century radiative forcing to 1.9 W m−2. | 126 (6) | (Riahi et al 2017, van Vuuren et al 2017, Rogelj et al 2018a) |
| ADVANCE | Aggregate effect of the INDCs, comparison to optimal 2 °C/1.5 °C scenarios ratcheting up after 2020. Decarbonization bottlenecks and the effects of following the INDCs until 2030 as opposed to ratcheting up to optimal ambition levels after 2020 in terms of additional emissions locked in. Constraint of 400 Gt CO2 emissions from energy and industry over 2011–2100. | 55 (6) | (Luderer et al 2018, Vrontisi et al 2018) |
| CD-LINKS | Exploring interactions between climate and sustainable development policies, with the aim to identify robust integral policy packages to achieve all objectives. Evaluating implications of short-term policies on the mid-century transition in 1.5 °C pathways linking the national to the global scale. Constraint of 400 Gt CO2 emissions over 2011–2100. | 36 (6) | (McCollum et al 2018) |
| EMF-33 | Study of the bioenergy contribution in deep mitigation scenarios. Constraint of 400 Gt CO2 emissions from energy and industry over 2011–2100. | 86 (5) | (Bauer et al 2018) |
| Scenarios from individual studies | 97(12)) | (Bertram et al 2018, Grubler et al 2018, IEA 2017, IEA and IRENA, 2017, Kriegler et al 2018a, Liu et al 2018, Luderer et al 2013, Marcucci and Panos 2017, Rogelj et al 2015, Rogelj et al 2013a, Rogelj et al 2013b, Shell International 2018, Strefler et al 2018a, van Vuuren et al 2018, Zhang et al 2018) | |
| Overall number of models in SR 1.5 | 13 (23) | ||
| Scenarios from AR5 (Krey et al 2014b) and related databases | |||
| ADAM | Model intercomparison on economic costs and technical feasibility of low stabilization pathways. | 15(1) | (Edenhofer et al 2010) |
| AME | Assessment of the role of Asia in addressing climate change looking at the development of Asia with and without climate policy. | 83 (16) | (Calvin et al 2012) |
| AMPERE | Exploration of possible pathways toward medium- and long-term climate targets at the global and European levels analyzing cost implications of policy delay, technology availability and unilateral action in a fragmented international policy landscape. | 395 (11) | (Kriegler et al 2015, Riahi et al 2015) |
| EMF-27 | Assessment of the importance of individual mitigation technology options such as energy intensity improvements, carbon capture and storage (CCS), nuclear power, solar and wind power and bioenergy for climate mitigation. | 359 (16) | (Blanford et al 2014, Krey et al 2014a, Kriegler et al 2014b, Weyant and Kriegler 2014) |
| LIMITS | Advancing the understanding of the implementation of climate policies consistent with 2 degrees Celsius: (i) to provide an assessment of the emissions reductions strategies at the level of the world and the major global economies, and (ii) to disseminate this scientific knowledge in a form useful for climate and energy policy making. | 60 (6) | (Kriegler et al 2013, Tavoni et al 2013) |
| POeM | Assessment of long-term impacts of the international pledges for China and India based on a comparison of a least-cost pathway with a pathway starting from the Copenhagen pledges. | 4 (1) | (Lucas et al 2013) |
| RECIPE | Model intercomparison on economic costs, technical feasibility, delayed participation and the role of sectors on 450 ppm and 410 ppm CO2 only stabilization scenarios. | 18 (2) | (Luderer et al 2012) |
| RoSE | Assessing the feasibility and costs of climate mitigation goals across different models, different policy regimes, and different reference assumptions relating to future population growth, economic development and fossil fuel availability. | 101 (3) | (Kriegler et al 2016, Kriegler and Mouratiadou 2016) |
| Scenarios from individual studies | 53 (4) | (Leimbach et al 2010, Matsuo et al 2011, Prinn et al 2011, Riahi et al 2012, Riahi et al 2011) | |
| Overall number of models in AR5 | 28 (46) | ||
Individual coal phase-out topics, meanwhile, have been addressed in dedicated contributions to some intercomparison exercises with some of this work highlighting the role of coal. For example, the ROSE intercomparison looked more generally at the implications of economic growth and fossil fuel scarcity for climate change mitigation (Kriegler et al 2016). In AMPERE (Riahi et al 2015), Bertram et al (2015) highlight the role of coal assets in their analysis of carbon lock-in. Bauer et al (2015) show the robustness of coal phase-out across AMPERE scenarios and analyze carbon leakage and provide a differentiated treatment of coal, oil and gas use across different climate policy regimes. Using data from the LIMITS model intercomparison project (Kriegler et al 2013), Steckel et al (2015) compare coal phase-out pathways across models and highlight differences between Annex-1 and non-Annex 1 countries to the UNFCCC. In CD-LINKS, McCollum et al (2018) highlight the stopping of investments in unabated coal by 2030 in most 1.5 °C pathways. The ADVANCE model intercomparison analyzes pathways to limiting warming well below 2 °C by explicitly quantifying residual fossil fuel emissions across sectors and resulting CDR requirements (Luderer et al 2018). Several model intercomparison outputs have also assessed air pollution co-benefits of climate policies and discussed the role of coal in this context (Schwanitz et al 2015, Rao et al 2017). However, these pieces of evidence remain scattered across the literature.
Finally, there is a growing number of individual studies using IAMs to analyze different aspects of coal transitions. One set of studies highlights substantial needs for early retirement of carbon intensive infrastructures—particularly for coal-fired power plants and in the case of delayed climate policy (Bertram et al 2015, Johnson et al 2015, Spencer et al 2018). By linking the integrated assessment model GCAM to detailed coal power plant-level data, Cui et al (2019) quantify these lifetime reductions for coal power plants in the context of 1.5 °C and 2 °C scenarios and establish an important link to the literature on committed carbon accounting (Davis et al 2010, Davis and Socolow 2014, Tong et al 2019). They find that the lifetime of a coal power plant is reduced to 20 and 35 years in 1.5 °C and 2 °C scenarios, if no plants are added to the current fleet (see also Fofrich et al 2020). Recent work by Rauner et al (2020a, 2020b) highlights that a global coal phase-out is a 'no-regret' option, where policy costs are outweighed by (monetized) local environmental and health benefits. Coal phase-outs thus appear to be a viable means for ratcheting up NDCs in regions with high levels of air pollution (Tong et al 2021), but the remaining coal plant pipeline (Global Energy Monitor 2021) and dedicated research on the political feasibility of coal phase-outs (Bi et al 2023, Muttitt et al 2023) suggest it remains a considerable challenge to realize this.
3. Data and methods
Rather than offering a conventional literature review, we provide a comprehensive quantitative review of evidence on coal transitions from long-term mitigation scenarios. Publicly available repositories of climate mitigation scenarios contain more than 1500 scenarios each reporting on dozens of variables. We use this information to provide the most comprehensive and in-depth assessment of coal transition dynamics in model scenarios to date.
For major climate change assessments like those by the IPCC or UN Environment comprehensive scenario evidence is collected from the scientific community and subsequently published in an open data repository to foster transparency and reproducibility (Krey et al 2014b, Huppmann et al 2018). We distinguish between scenarios from the IPCC Fifth Assessment Cycle and Sixth Assessment Cycle. Ensemble data from model intercomparison exercises are a major source of these collections, but also scenarios from individual studies are included. We focus on scenario data collections that are relevant to the central goal of the Paris Agreement to limit global warming to well below 2 °C (see table S1 in the supplementary materials for further details). Note that we combine the two sub-groups of 1.5 °C consistent scenarios with no or low overshoot and high overshoot and analyze them jointly.
We acknowledge the difficulty in clearly defining what Paris-consistent scenarios might be, given the intentionally imprecise wording of Article 2 in the Paris Agreement (UNFCCC 2015). For example, some interpretations might not consider higher 2 °C scenarios as being in line with a 'well below 2°C' pathway. However, we add also those scenarios into our ensemble of Paris-consistent scenarios, as there is no clear case for excluding them based on Article 2. Following broadly the scenario categorization introduced in the IPCC SR1.5 (see table 2.SM.11 therein), we use the 1.5 °C and 2 °C warming exceedance probabilities in 2100 and the maximum value over the period 2020–2100 to define the 1.5 °C and 2 °C categories. For instance, the 1.5 °C scenario category in this review includes scenarios for which the probability to exceed 1.5 °C of warming in 2100 is lower or equal to 50%. This information is available for most of the scenarios assessed in this review including AR5 and SR1.5 scenarios. For harmonization purposes we only use data from MAGICC6. Because the climate information between the AR5 and SR1.5 assessment has been revised (Rogelj et al 2016, 2019), we cannot ensure full harmonization across the entire dataset. However, we observe that more stringent definitions do not change any of the major conclusions of this study.
We supplement the broad and curated scenario resources provided by the IPCC and its collaborating institutions with additional scenario data from individual model intercomparisons exercises 23 . In particular, we extend the IPCC scenario resources with additional scenarios that are not covered by the IPCC. For example, we include scenario evidence published after SR1.5 or not covered in the AR5 database. We also add additional variables that are not provided in the IPCC resources. For example, the IPCC AR5 scenario database does not report on CO2 removals from carbon dioxide removal technologies, but some of the underlying scenario resources like the AMPERE and LIMITS databases do. Table 1 provides an overview of the scenarios from different model intercomparison studies contained in our dataset.
Overall, we build our dataset from a total of 1508 scenarios produced by about 30 different modeling frameworks and about 70 different model versions. The AR5 data is more extensive both regarding the number of scenarios contained as well as the number of different models covered. Our final dataset covers 309 baseline scenarios, 94 1.5 °C scenarios and 498 2 °C scenarios. Note that 1.5 °C scenarios were not available for AR5 and have only been provided by more recent studies. We note that the ensemble is dominated by a few individual models as highlighted in figure 6. The five most represented models REMIND, MESSAGE, IMAGE, GCAM and AIM jointly cover 55% of the scenarios in the database, i.e. 68% of 1.5 °C scenarios, 57% of 2 °C scenarios and 48% of baseline scenarios.
We analyze coal-consumption dynamics both in baseline scenarios as well as in Paris-consistent mitigation scenarios. While noting that comprehensive analysis of baseline scenarios has been carried out previously (Ritchie and Dowlatabadi 2017a, 2017b) we update this analysis to include the most recent scenario evidence.
We apply k-means clustering to group scenarios with similar coal-consumption trajectories in our ensemble data. K-means clustering partitions n observations into k clusters based on similarity. Each observation is assigned to the cluster with the nearest mean, leading to groupings that favor low variance and similar scales. We apply the clustering on observations of coal consumption at different points in time (each decade from 2010 to 2100), hence grouping scenarios by the overall shape of their coal consumption trajectories in the 21st century. Methodological details are provided in the supplementary material.
We identify four distinct clusters of coal-consumption trajectories (detailed in results section) and characterize them with a broader set of indicators of scenario characteristics. While the choice of the number of clusters remains essentially subjective, we check different numbers for robustness and note that this does not alter the results of our analysis significantly. We investigate the specific role of socio-economic conditions, the influence of technological availability as well as the timing of mitigation policies through scenario selection. We further analyze the influence of individual models on our findings (model fingerprinting) and control for the age of scenarios (scenario vintage). Additionally, we look at coal consumption pathways in baseline scenarios, compare them to historically observed dynamics and analyze their influence on coal consumption in mitigation scenarios and their associated policy costs. Finally, we compare additional historical data on technology upscaling with the upscaling observed in model scenarios to critically reflect on key technology dynamics and their underlying assumptions in models. To measure growth of energy technologies in both scenarios and historical data, we fit logistic functions to the shares of electricity by a specific technology and compare the estimated logistic growth rates between scenarios and historical data from BP (2021). Ranges of estimates for the historical data are obtained by using different types of fitting methods as well as different onsets of the historical data. These additional analyses facilitate model diagnostics of what drives coal use in scenarios and a discussion on more or less realistic pathways based on the most recent knowledge on technological innovation and diffusion.
4. Coal transitions in Paris-consistent mitigation scenarios
4.1. Diversity of coal transitions in Paris-consistent mitigation scenarios
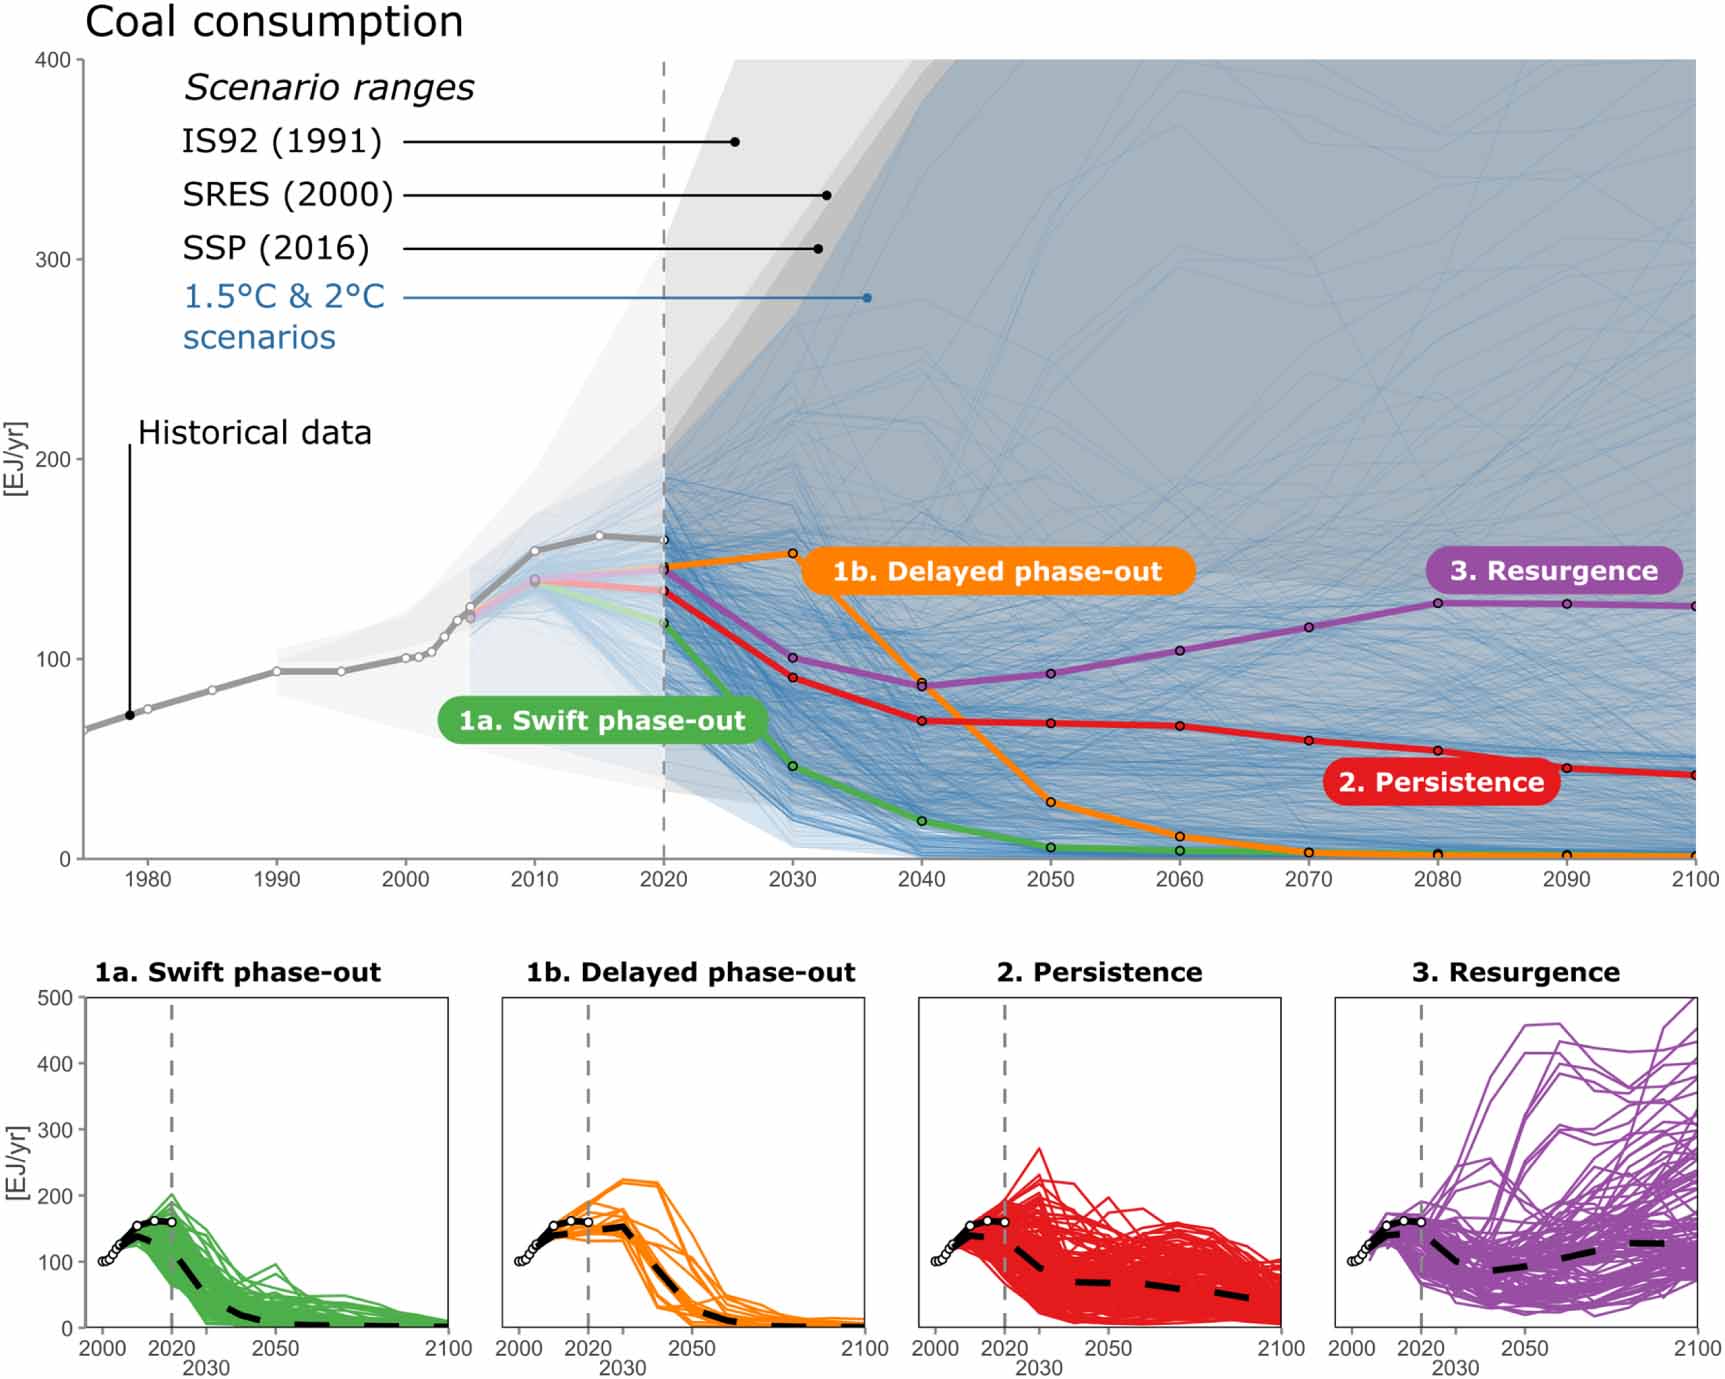
There is great diversity across coal-consumption pathways in Paris-consistent mitigation scenarios. Figure 2 shows historical coal-consumption patterns and subsequent coal phase-out dynamics across our ensemble of Paris-consistent mitigation scenarios. Cumulative coal consumption for the period 2020–2100 ranges from 700-8400 EJ in below 1.5 °C scenarios, 650-25000 EJ in low 2 °C scenarios (66% probability) and 600-30200 EJ in higher 2 °C scenarios (50% probability). Two major storylines emerge: The first is a rapid phase-out of all coal consumption represented by the lower end of these ranges. In this context our data suggest a hard limit in the cumulative amount of unabated coal consumption in energy transitions. These numbers at the lower end of the range are considerably smaller than the remaining cumulative coal consumption implied by the current coal power fleet assuming average historical lifetimes and capacity factors (Edenhofer et al 2018, Tong et al 2019). This points towards limited new construction, early retirements and constrained use of the existing fleet (Cui et al 2019, Fofrich et al 2020). The second storyline develops around a 'clean coal' narrative (Aeschbach-Hertig 2009, Nature 2009). Levels of coal consumption at the middle and upper end of these ranges are only possible due to the assumed widespread availability of rapidly scalable and effective carbon capture and storage technology (Bui et al 2018).

Figure 2. Coal transition pathways in Paris-consistent climate mitigation scenarios by climate policy stringency and scenario vintage. Black lines show levels of coal consumption over time. Red lines on the split axis pointing downwards show coal consumption in combination with carbon capture and storage, where the CO2 from burning coal is captured and stored underground. Upper panels cover scenarios from AR5 period and lower panels from post-AR5 period.
Download figure:
Standard image High-resolution imageMost Paris-consistent mitigation scenarios start phasing out coal rapidly during the first half of the 21st century (figure 2). Coal consumption declines between 2020 and 2050 are homogenously substantive and swift across the ensemble with the exception of the older AR5 ensemble (upper panels). Broadly in line with the findings of IPCC SR1.5 (IPCC 2018), we find consistent coal phase-out behavior in Paris-consistent mitigation scenarios across models until mid-century in the SR1.5 ensemble. Coal phase-out behaviors are most pronounced in the most stringent 1.5 °C scenarios. Coal consumption is reduced in these scenarios by 2.7% (1.9%–3.3%) per year. This is well within what has been observed historically in individual countries. For example, the average coal phase-out rate in the U.S. between 2009 and 2019 was 6.7% percent (EIA 2020) 24 . In 2050, the share of coal in primary energy supply is 0%–11% (full range) and in electricity generation 0%–8% (full range) in these scenarios. For lower and higher 2 °C scenarios the primary energy share of coal is between 0% and 17% as well as 0% and 16% for the share of coal in electricity generation with average annual reductions of 2.2% (−0.3%–3.3%) and 2.0% (−0.6%–3.3%). We observe similar consistency in coal phase-out dynamics in the older AR5 ensemble, but also witness some very extreme 2 °C scenarios that further expand coal consumption after 2020 – to between 200 and 500 EJ.
Coal transition dynamics in Paris-consistent mitigation scenarios diverge during the second half of the 21st century as some models extensively use CCS technology to mitigate emissions. In particular, after 2050 there is no common trend observable anymore in coal consumption across the scenario ensemble with rates of change varying between −2% and +7.3%. 24% of the available 1.5 °C scenarios and 40% of 2 °C scenarios have higher coal consumption levels in 2080/2100 than in 2050, while 68% and 53% remain at similar levels (i.e. ±20EJ), respectively. Note that some of these scenarios involve a rebound after an initial phase-out, as we discuss below. Exclusively focusing on coal transition dynamics during the first half of the 21st century as done in IPCC SR1.5 (IPCC 2018), therefore, paints an incomplete picture of the diversity of distinct pathways that exist in the ensemble regardless of scenario vintage.
However, figure 2 also suggests that scenario vintage might in general play a role. There is considerably less variability in the more recent post-AR5 ensemble than in the older AR5 ensemble. But despite the absence of very extreme coal-consumption scenarios in the more recent post-AR5, 37% and 65% of the 1.5 °C and 2 °C scenarios still have coal consumption levels higher than 20 EJ in 2080—a threshold used in SR1.5 for the identification of CCS-dependent scenarios. Reduced variability in the SR1.5 scenarios may be due to specific features of the ensemble: it contains fewer models, includes more high-ambition scenarios and was more actively curated (Huppmann et al 2018).
4.2. Two out of the three major coal transition archetypes heavily rely on CCS technology
The dense scenario ensemble in figure 2 makes it impossible to observe any clear coal transition patterns: what groups of scenarios follow similar trajectories? Hence, it is important to analyse whether there are clusters of coal-transition scenarios that behave in similar ways. We apply k-means clustering to identify coal-transition archetypes, i.e. patterns of coal consumption in Paris-consistent mitigation scenarios (see Data and methods section). The analysis highlights three major coal-transition archetypes of which one has two variations as shown in figure 3:
- Coal Phase-out (archetypes 1a and 1b): In about 38% (224 of 592) of mitigation scenarios coal is swiftly and comprehensively phased out. Due to important policy questions around carbon lock-in we further distinguish variant 1a that starts the phase-out by 2020 named swift phase-out (33%) and variant 1b with some further delay named delayed phase-out (5%).
- Coal Persistence (archetype 2): About 42% (251 of 592) of mitigation scenarios feature a much more gradual decline in coal consumption and often remain with substantial levels of coal in the system across the 21st century—e.g. 50% and 30% relative to current levels in the median pathway. Pathways typically stick to coal consumption with associated CO2 emissions that are larger than what could be freely emitted.
- Coal Resurgence (archetype 3): About 20% (117 of 592) of mitigation scenarios involve a resurgence of coal characterized by a sustained period of growth in coal consumption during the second half of the 21st century—after a period of initial decline.

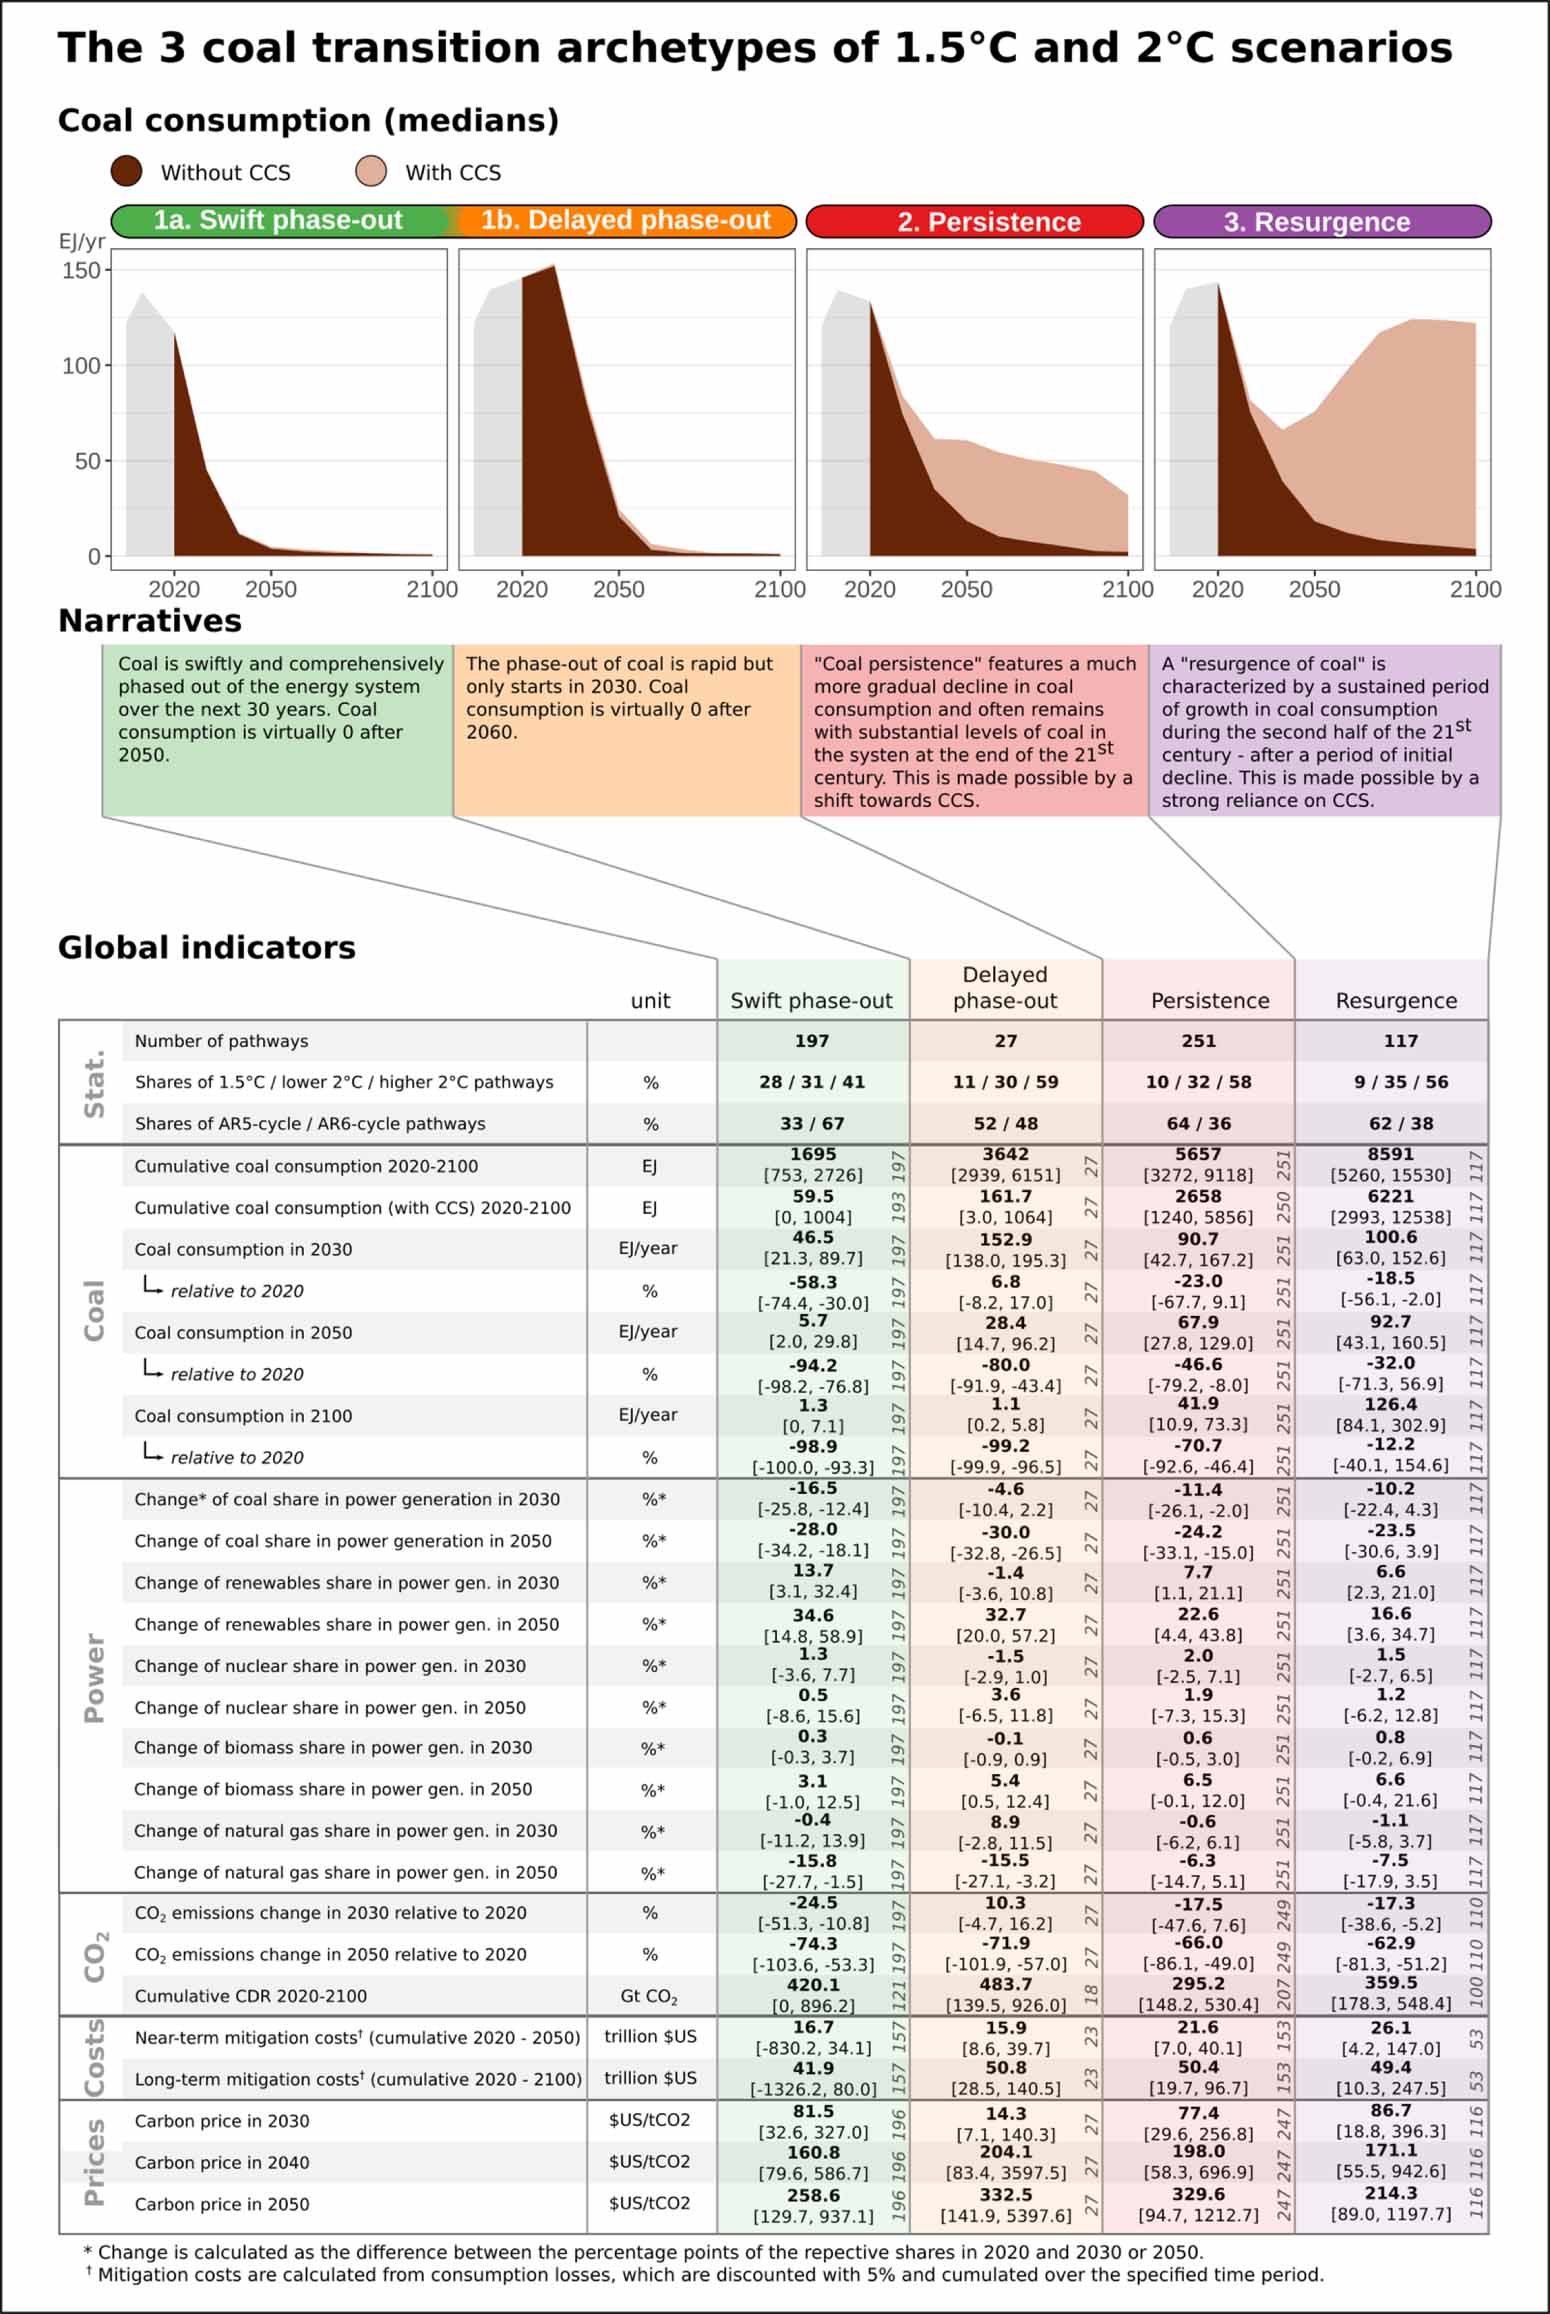
Figure 3. Coal transition archetypes in Paris-consistent mitigation scenarios across the 21st century in exajoule per year [EJ/yr]. The upper panels show all 592 coal transition pathways in 1.5 °C and 2 °C scenarios contained in our scenario ensemble. The grey shaded areas show the extended range of coal consumption in baseline scenarios (i.e. no or current policies) of key scenario ensembles: IPCC IS92 emission scenarios and shared socio-economic pathways (SSPs) (Riahi et al 2017). The colored pathways show median scenarios of four archetypical scenario clusters in the lower panels. The lower panels show all member scenarios of the respective coal transition pathway clusters: swift (n = 197) and delayed (n = 27) phase-out scenarios (n = 251), coal persistence and coal resurgence (n = 117).
Download figure:
Standard image High-resolution imageFigure 4 provides an overview of these coal-transition archetypes, outlines the implied narratives and characterizes their major features in the dashboard underneath. In general, we find that coal-transitions archetypes are not fundamentally determined by scenario vintage and climate policy stringency: all archetypes exist across levels of climate policy stringency and in AR5 as well as post-AR5 samples of the data. However, high climate policy ambition increases the share of coal phase-out pathways. For example, 61% of 1.5 °C scenarios feature coal phase-out trajectories, but we still find coal persistence (27%) and coal renaissance (11%) pathways within those stringent policy scenarios. For likely 2 °C scenarios, the share of persistence and renaissance pathways already increases to 42% and 22% respectively, while persistence scenarios dominate across higher 2 °C pathways with 47%. Note that we look at potential sample bias issues related to very different numbers of scenarios by different models in the next section.
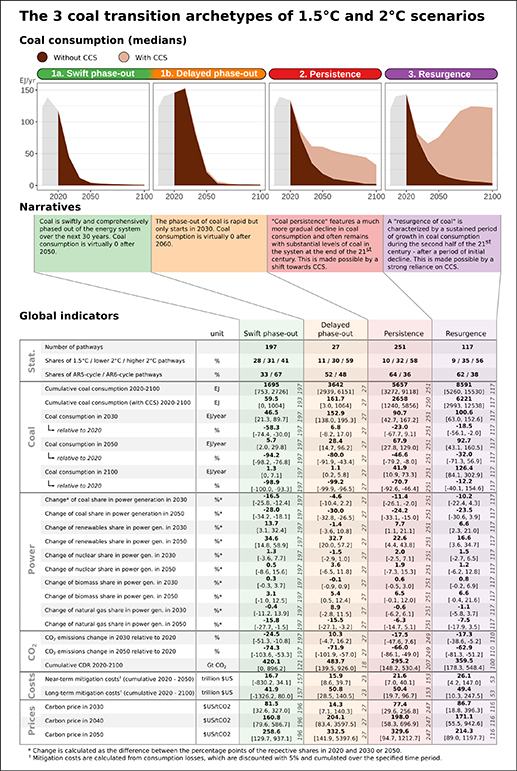
Figure 4. Three coal transition archetypes, their underlying narrative and characteristics: swift (1a) and delayed (1b) coal phase-out, coal persistence (2) and coal resurgence (3). The global indicators table shows medians (bolded numbers), 10 to 90th percentile ranges (numbers in brackets) and number of observations (vertical numbers in italics).
Download figure:
Standard image High-resolution imageOverall, we find a total number of 224 coal phase-out trajectories within our set of 592 Paris-consistent mitigation scenarios. This is a share of 35% for those scenarios published before IPCC AR5 and 65% for the set of more recent scenarios. Furthermore, 26% of coal phase-out pathways come from 1.5 °C scenarios, while 31% and 43% come from lower and higher 2 °C scenarios, respectively. Coal phase-out scenarios feature cumulative coal use between 2020 and 2100 with a median of 1800 EJ. A delay in adequate climate policy ambition to 2030 increases this to 3600 EJ, with a 10th to 90th percentile range of 2900–6200 EJ, highlighting considerable path dependencies from continued investment in coal infrastructure for an additional 10–20 years. For swift phase-out, this range is considerably lower at 750–2700 EJ. Coal phase-out pathways typically feature rapid near-term transitions. By 2030, coal consumption is reduced by about 120 EJ from today's levels (i.e. 170 EJ) to 50 EJ for the median pathway (10th to 90th percentile range: 20–90 EJ). By 2050, the coal phase-out is largely completed for most pathways with coal consumption levels tracking at 10 (2–30) EJ. In the case of delayed phase-out, 2050 levels track higher in most scenarios at 30 (15–96) EJ. Average annual reductions in coal consumption between 2020 and 2050 are −3.1% (−3.3%–−2.5%) for phase-out, −2.7% (−3.0%–−1.4%) in the case of delay. Phase-out speed is faster in 1.5 °C compared to 2 °C scenarios. Coal power in combination with carbon capture and storage (CCS) does not play any or a comparatively small role in phase-out scenarios with a total of 57 (0–1000) EJ of coal being used with CCS across the century (2020–2100). Delay in climate policy does not majorly influence these results: 90% of scenarios use less than 1000 EJ of coal with CCS.
We find a total of 251 coal persistence pathways in our sample of Paris consistent mitigation scenarios, implying a very large deployment of CCS in most cases (figure 4). Of these, 64% were published before and 36% after AR5. Most coal-addiction pathways occur in lower (31%) and higher (58%) 2 °C scenarios, but there are also some pathways (10%) featuring in very stringent 1.5 °C scenarios. At 5700 EJ, the median cumulative coal consumption between 2020 and 2100 is three times higher for the median coal persistence pathway than the median for phase-out scenarios, but values are lower for the post-AR5 sample with 4400 EJ. Coal persistence scenarios feature a more gradual decline in coal consumption from 91 (42–167) EJ in 2030 to 68 (28–129) EJ in 2050 to 42 (11–73) EJ in 2100 with average annual reductions of −1.6% (−2.6%–−0.3%). CCS plays a large role in most coal persistence pathways: The median cumulative coal use in combination with CCS between 2020 and 2100 with 2700 (1200–5700) EJ is 47% of the overall coal consumption in that period. The respective median for the post-AR5 scenarios is lower with 2100 EJ.
Finally, the 117 coal-resurgence scenarios, of which 62% were published before AR5, feature in lower 2 °C (35%), higher 2 °C (56%) as well as 1.5 °C (9%) scenarios—and all of them use thousands of exajoules of coal with CCS (figure 4). Coal-resurgence pathways feature the largest cumulative coal consumption patterns across the archetypes with 8600 (5300–15 500) EJ for the entire sample. Note the maximum values of the entire range of coal consumption in this archetype project more coal consumption in Paris-consistent scenarios than the proven coal reserves today (BGR 2019). However, scenario vintage plays the most important role for this archetype with substantially lower median values for post-AR5 scenarios of 6700 EJ. Even 1.5 °C scenarios of this coal consumption archetype still consume comparatively large amounts of coal (4500 EJ). Coal resurgence scenarios tend to start phasing out coal initially to 100 (63–153) EJ in 2030 and 93 (43–160) EJ in 2050, except for extreme cases at the upper end of the range where coal consumption continues to be expanded. It is the characteristic feature of coal resurgence scenarios that coal consumption in 2100 with 126 (84–303) EJ is higher than in 2050 despite the most ambitious climate policy at the end of the century. Note that this pattern is even more pronounced for post-AR5 scenarios with median values of 80 EJ in 2030, 50 EJ in 2050 and 100 EJ in 2100 and without the extreme values at the upper end of the range. By mitigation-necessity, CCS is a central feature of coal- resurgence pathways with a 2020–2100 median cumulative capacity of 6200 (3000–12 500) EJ for the full and 3700 EJ for the post-AR5 sample.
We also look at how the coal transition archetypes differ with respect to technology shifts in the power system, CO2 emissions, mitigation costs and carbon prices (see table in figure 4). Overall, ranges in these indicators within each archetype are much higher than differences between archetypes. However, we can observe patterns in the medians: While phase-out pathways feature a strong increase in the share of renewables in the electricity mix (median increase of 35 percentage points by 2050), this is less the case in persistence and resurgence pathways (median increase of 23 and 17 percentage points by 2050). For nuclear the changes are much smaller, with all median changes between −2 and 4 percentage points. The median changes observed for the shares of biomass and natural gas are slightly larger, with biomass shares increasing by 3–7 percentage points and natural gas shares decreasing by 6–16 percentage points by 2050.
Regarding CO2 emissions in 2030, we only see one remarkable deviation from the other archetypes for delayed phase-out scenarios. This is the direct result of the types of scenarios in this group, which assume that stringent climate policy only kicks in after 2030, reflected in much lower modeled CO2 prices in 2030. The median CO2 emission reductions in 2050 are much more similar than those in 2030 across all coal archetypes, with persistence and resurgence scenario medians showing slightly lower reductions. Their higher share of 2 °C scenarios in phase-out scenarios can explain this. In addition, all archetypes feature similar medians for cumulative carbon dioxide removal by the end of the century. While mitigation costs in the near term tend to be lower for phase-out pathways compared to persistence and resurgence, they are very similar in the long term, except for swift phase-out. CO2 prices in 2040 and 2050, i.e. after delayed climate policies take effect, are slightly lower for swift phase-out and resurgence pathways. However, it is difficult to draw conclusions from these tendencies because mitigation costs also depend on model dynamics in other sectors, which makes it difficult to relate these costs directly to the costs of the coal transition.
4.3. Coal transition archetypes are robust across sub-samples and tightly connected to model fingerprints
This section analyses how distinct factors such as the age of scenarios (scenario vintage) or the particular structure of models impact our results. Models have unique signatures based on their distinct structures, data inputs and assumptions that have consequences for the results and that we therefore call 'model fingerprints'. Figure 2 already hints towards the influence that scenario vintage—i.e. whether it belongs to the AR5 sample or the post-AR5 sample—has on results of our analysis. The most extreme scenarios belong to the older AR5 scenario ensemble. But is this driven by a greater diversity in the AR5 ensemble, by a more active approach to scenario curation or by dynamic improvements in individual models?
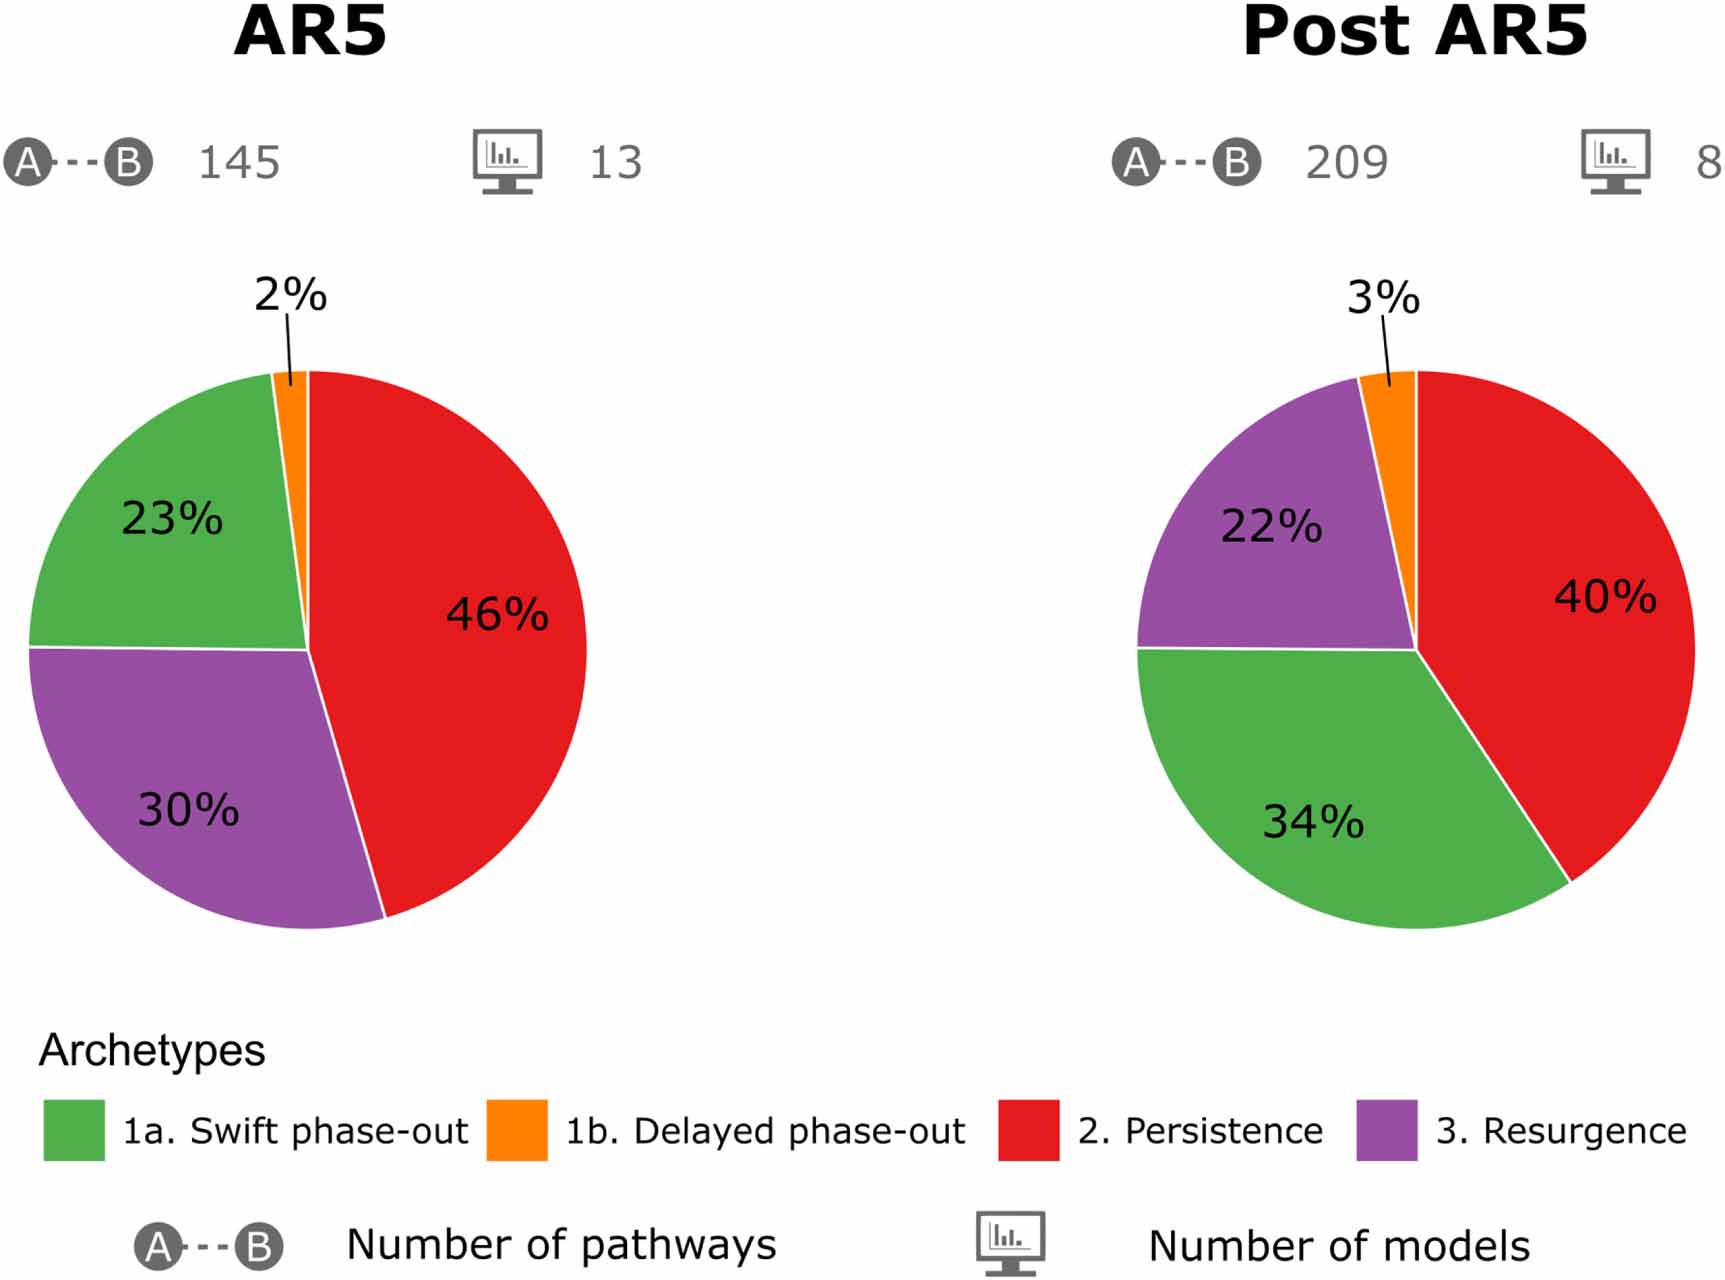
We first focus on comparing scenario membership in the IPCC ensembles that have underpinned the two most recent assessments of mitigation pathways (IPCC 2014a, 2018) and observe noticeable differences (see figure 5). In both scenario ensembles coal persistence scenarios are most prevalent, but the share slightly declined from 46% in the AR5 to 40% in the SR1.5 ensemble. Similarly, the share of resurgence scenarios dropped from 30% to 22%. In contrast, the share of coal phase-out scenarios grows considerably from 25% in AR5 to 37% in SR1.5. This is largely explained by the higher average policy stringency of post-AR5 scenarios as stringency drives the prevalence of phase-out scenarios (see additional figures in the supplementary material). Nevertheless, we find all archetypes across policy stringency levels as well as databases pointing towards idiosyncrasies of each model.

Figure 5. Changes in composition of major coal transition archetypes in Paris-consistent mitigation scenarios within the two most recent scenario ensembles used by the Intergovernmental Panel on Climate Change: Fifth Assessment Report (AR5) and Special Report on Global Warming of 1.5 °C.
Download figure:
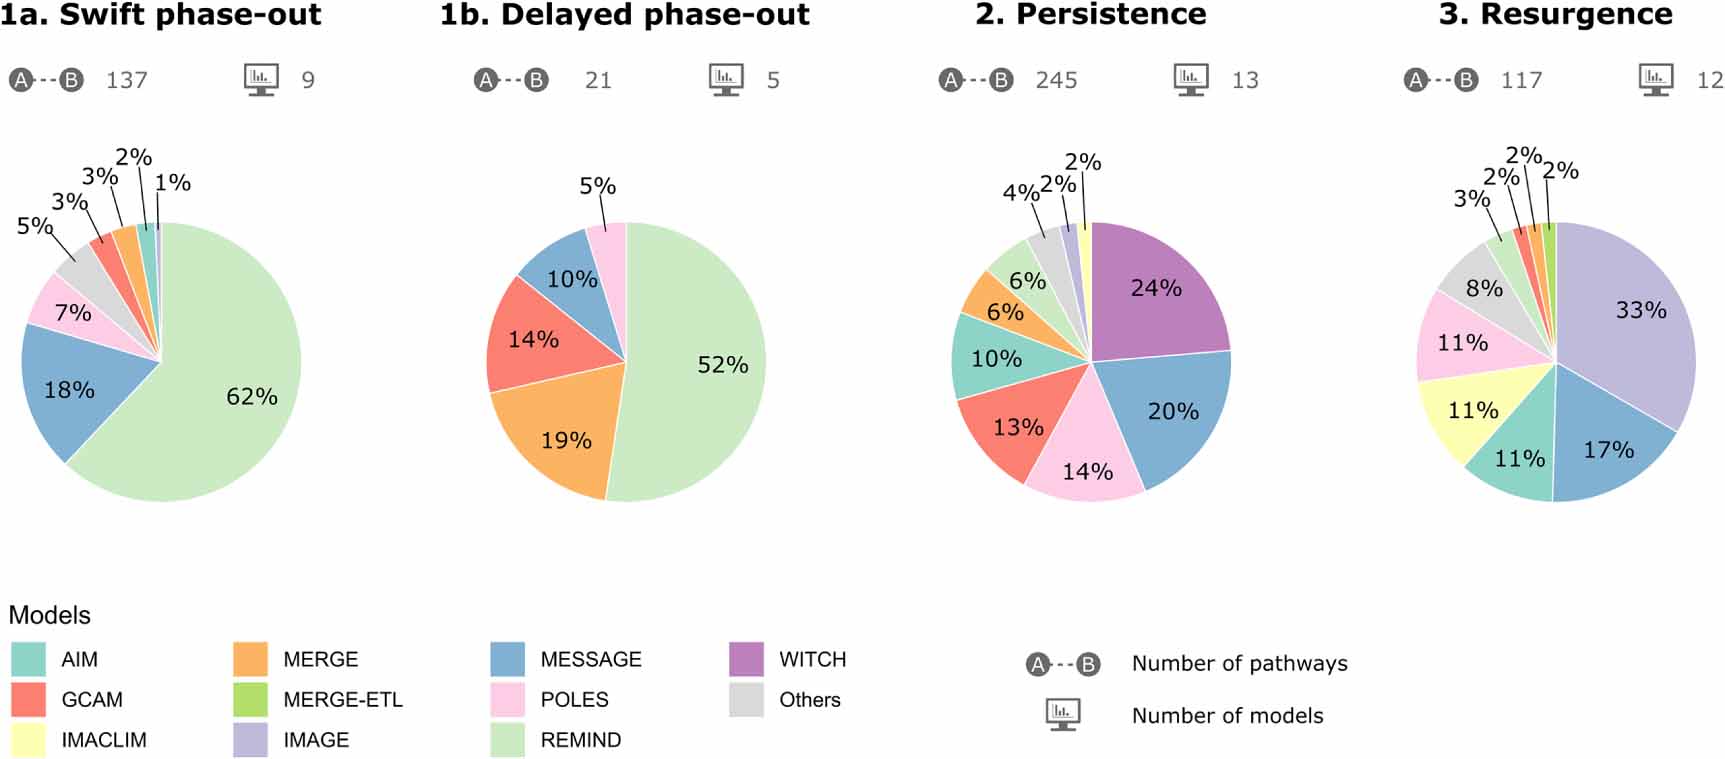
Standard image High-resolution imageWe find distinct model fingerprints with regard to coal transitions: many models themselves favor particular coal-transition archetypes based on, e.g. model structures and assumptions about future costs and substitution patterns (figure 6). On the one hand, there are some models leaning towards swift and sustained coal phase-out such as REMIND. In fact, 74% and 63% of all swift and delayed coal phase-out scenarios are from REMIND. Hence, much of the growth observed in the coal phase-out archetype between AR5 and post-AR5 ensembles is related to an overall growth in the share of REMIND scenarios from 55% to 83%. On the other hand, IMAGE and IMACLIM, for example, strongly favor coal resurgence pathways, while WITCH or GCAM often more gradually phase-out of coal—all heavily relying on the rapid scale-up as well as widespread and large-scale availability of carbon capture and storage. Some other models like MESSAGE seem to favor coal persistence and resurgence pathways, while featuring in all major transition archetypes in both assessment cycles. We provide detailed model specific plots for the most prominent model families in the supplementary material.
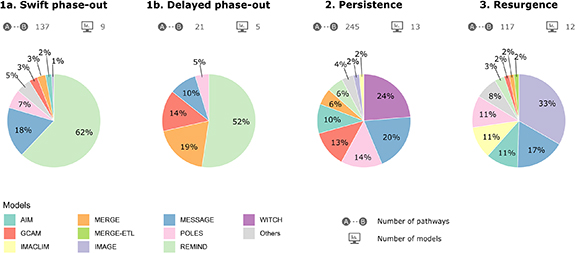
Figure 6. Model fingerprints for coal transition archetypes in Paris-consistent climate mitigation scenarios.
Download figure:
Standard image High-resolution imageThere is little evidence documenting fundamental changes of models' preferences for certain coal-transition archetypes. The narrower range of coal-transition pathways in the SR1.5 ensemble is driven by the absence of very extreme coal resurgence scenarios. In AR5, those extreme pathways were produced exclusively by the IMAGE and IMACLIM models. While the absence of such extreme scenarios in IMAGE in post-AR5 ensembles point to changes in the model that have reduced coal consumption substantially, there are no IMACLIM submissions in post-AR5 ensembles yet. We do not find other evidence for a prominently changing 'coal-transition fingerprint' of individual models.
5. Strong appetite for coal in scenario baselines compared to long-term historical observation
How coal transitions turn out in Paris-consistent mitigation scenarios also crucially depends on reference developments in scenario baseline. For example, the timely availability of cost-competitive alternative energy sources and the amount of coal in reference scenarios has impact on how difficult it is to phase out coal. This crucially determines the scale and costs of the transition in models.
Baseline scenarios do not try to forecast the future under business-as-usual. Instead, they quantify narratives about alternative futures. Those futures can differ substantially from dynamics observed historically. In this sense it is impossible to validate baseline scenarios through comparison with historic trends. However, we still map baseline scenarios against historic trends in coal consumption, to assess how much change from the present they assume, to discuss their underlying assumptions, and to reflect on what this might imply for the challenges associated with coal transitions in Paris-consistent mitigation scenarios.
Scenario baselines are defined in very different ways in the scientific literature. We analyse the whole breadth of available baseline scenarios, but focus much of the discussion on the representation of future coal use in the marker scenarios of the shared socio-economic pathways (SSPs) (Bauer et al 2017, Riahi et al 2017). For example, a baseline scenario might assume no new climate policies, a continuation of the existing level of climate policy ambition in the future, or even anticipate enhanced future ambition, such as through the implementation of NDCs in the context of international climate policy. While some baseline scenarios can be rather ad hoc in nature, SSPs have been developed methodically in a long and extensive community-driven process with the aim to systematically explore alternative socio-economic futures by linking research in climate physics, climate change mitigation as well as impacts, adaptation and vulnerability within one coherent framework (Moss et al 2010, Ebi et al 2014, van Vuuren et al 2014). Within the SSP framework, baseline scenarios are defined as 'reference pathways that would occur in a hypothetical case without new climate policy interventions (mitigation or adaptation) and without being influenced by future climate change' (van Vuuren et al 2014, p. 378) as this allows researchers and policy makers to relate socio-economic future pathways to different climate outcomes (Kriegler et al 2012, Neill et al 2017). Any anticipated future climate policies are instead defined and introduced into the analysis as a shared policy assumption (Kriegler et al 2014a).
Historically, global per capita coal consumption has been remarkably stable over the past 60 years (Ritchie and Dowlatabadi 2017a) fluctuating between 16 and 18 GJ/cap (see red line in figure 7). Only during China's latest industrialization surge in the 2000s with persistent GDP growth at around 10%/yr did global per capita coal consumption grow—by about 3.5% per year across the decade to about 21 GJ/cap and despite the 2009–11 global financial crisis. There is emerging evidence that coal consumption may have peaked; coal consumption was highest in 2013 at 22 GJ/cap or 162 EJ and declined subsequently. This trend persists as annual fluctuations are smoothed out using 5 year moving averages. However, during 2017 and 2018 global coal use grew again but remained below 2013 levels at 158EJ or 21 GJ/cap. Moreover, a substantial share of countries' future plans to extend coal capacities have been scrapped reflecting growing competitiveness of renewable alternatives (Shearer et al 2020).
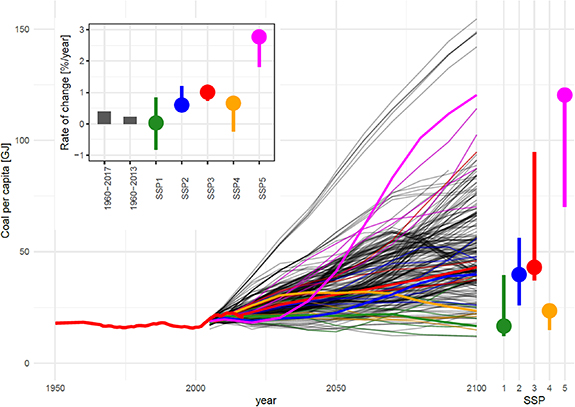
Figure 7. Per capita coal consumption in climate change baseline scenarios. SSP are the five shared socio-economic pathways (SSPs). Circles identify the chosen marker scenarios within the range of other SSP quantifications.
Download figure:
Standard image High-resolution imageBaseline scenarios tend to deploy much more coal than what historical long-term evidence and recent trends indicate would be plausible. Most available scenario baselines envision a sustained revival of coal consumption growth across the rest of the century. In the context of most scenario baselines, the recent period of stalled coal consumption growth would just appear as a rather short anomaly along a pattern of persistent long-term growth. Overall, less than 4% of the baseline scenarios show lower coal per capita levels in 2100 than in 2018. 93% of the scenarios show average annual per capita growth rates higher than historic ones across the 21st century. More than 60% of baseline scenarios show per capita coal consumption levels that are about twice as high as today. More than 10% of all scenarios are 'very high coal consumption baselines' that project the unusual, one decade of rapid growth in coal consumption during the 2000s driven by China's continued coal-powered industrialization as an average for the next eight decades into the future. These scenarios end up with per capita coal consumption levels in 2100 that are 3.9–7.5 times larger than today.
Looking at SSP marker scenarios (i.e. those chosen by the development community as representative for the broader development of a particular SSP narrative (Riahi et al 2017)) highlights the finding that two out of five baselines are broadly in line with historical coal consumption trends, while three marker scenarios envision a sustained resurgence of coal. There is, however, considerable variation in dynamics and coal consumption within the wider SSP ensemble, which we report in brackets. SSP2 is the middle-of-the-road scenario that continues most historical trends, but it certainly does not for coal with 1.9 (1.3–2.7) times higher levels of per capita coal consumption by 2100. The SSP3 marker around the narrative of 'regional rivalry' ends up at similar levels (2.1 (1.9–4.6) times higher levels of per capita coal consumption). SSP5 describes 'fossil fuelled development' in a globalized, highly trade-connected world characterized by rapid economic and low population growth as well as fossil fuel abundance. Despite the relatively stable long-term historical pattern, per capita coal consumption is 5.8 (3.4–5.8) times larger in SSP5 than today driven by technological progress geared towards fossil fuels and CCS ultimately inducing a regime shift in liquid fuels towards coal (Kriegler et al 2017). In contrast, the 'green growth' marker of SSP1 as well as SSP4 marker of a highly unequal world reflect per capita coal consumption patterns that are roughly in line with long-term historical trends (Ritchie and Dowlatabadi 2017a, 2017b). Remarkably, there is no SSP scenario that projects reductions in coal consumption independent of climate policy.
However, we do not find evidence in our data that the level of coal consumption in baselines strongly impacts the coal transition dynamics in associated mitigation scenarios. In our dataset of 592 mitigation scenarios, which we attributed to the three different coal transition archetypes above, only 48 are based on SSP scenarios. The different SSP baselines are distributed across several archetypes without a clear tendency that SSPs with more coal are attributed to a particular archetype (see table S2). Such a tendency is neither observable for the entire set of mitigation scenarios: the range of coal consumption in baselines is quite similar for all archetypes (cp. figure S3). These results suggest that models are quite flexible in reducing coal consumption when policies (i.e. high implicit carbon prices) take effect.
6. Coal transition scenarios optimistic about cost and scalability of CCS technologies and pessimistic about renewables
Transitions away from coal require growth in alternative low carbon technologies. The competitiveness of other energy fuels and technologies (including nuclear power, gas, and renewables) determines how swift and at what cost a transition away from coal can take place (Turnheim and Geels 2012). Hence, it is crucial to assess the historical scaling dynamics of alternative low carbon technologies and compare those to what we observe in scenarios. Such 'learning from the past' can contribute to the assessment and verification of technology dynamics observed in future scenarios (Wilson et al 2013). Moreover, it is equally important to reflect on learning and scaling observed in climate change mitigation literature in the light of what we know from the growing body of literature on innovation and diffusion of low carbon technologies (Wilson et al 2013, 2020, Grübler and Wilson 2014, van Sluisveld et al 2015, Wilson 2018, Nemet 2019).
In contrast to coal consumption, for which baseline scenarios tend to exceed historical long-term trends, renewable energy deployments are lower than historical capacity expansions. In figure 8, we compare historical growth rates to future growth in scenarios for seven key low-carbon technologies. The upper panel shows baseline scenarios and the lower mitigation scenarios. Here we exclude all AR5 scenarios from the set because their vintages precede the rapid recent expansion of and cost reductions in renewables. We do not find a single scenario baseline that reaches the growth rates in solar PV deployments that have been historically observed (figure 8, upper panel). For wind, only 8% (5 out of 61) of the baseline scenarios are within the range of historical growth rates. Even SSP1 implementations, which are supposed to describe a world of green economic development, describe lower growth rates than observed in recent years. Growth rates for gas and coal are substantially higher than historical observations over the last 70 years in a number of scenario baselines.

Figure 8. Violin plots show growth rates in the share of electricity supply for key technologies in baseline scenarios (upper panel) and Paris-consistent mitigation scenarios (lower panel). Each dot represents annual growth of that technology in a scenario. Gray shaded areas show historical growth for each technology. The three CCS technologies on the right do not show historical growth since so few plants have been built.
Download figure:
Standard image High-resolution imageMore strikingly, even in the case of stringent climate policy in line with the Paris goals, scenarios project growth in solar and wind—key competitors to coal in the power sector—to significantly slow over the next 20 years to much lower rates of growth than in recent years (figure 8, lower panel). Estimates for the historical logistic growth rate for solar as a share of electricity supply range from 25% to 36% per year, depending on the estimation method. For wind, the growth rates range from 14% to 29% per year. Of 217 stabilization scenarios, including 1.5 °C and 2 °C targets, and 20 distinct IAMs, only five scenarios showed a logistic growth rate for solar in line with historical data; for wind 82 scenarios were below the range of historical estimates (i.e. 38%). Only 2% and 41% of all IAM scenarios included logistic growth rates for solar and wind within or above the historical range, respectively, despite the presence of many highly stringent 1.5 °C scenarios.
Many of the Paris-consistent mitigation scenarios—particularly within the coal persistence and coal resurgence clusters—rapidly deploy substantial amounts of coal-CCS. In contrast to observations for solar and wind, average growth rates in IAMs for CCS—biomass, coal, and gas—are between 15%–20%—despite the big problems faced in scaling CCS (von Hirschhausen et al 2012, Oei and Mendelevitch 2016). Historical data for CCS electricity generation are scarce because only two full-scale plants have ever been built. Taking all 20 CCS plants built over the past 20 years produces a growth rate of 7%, less than half of the average across scenarios. Note that we do not plot this CCS growth rate because only two of those 20 plants generate electricity, both from coal. The overall pattern that emerges shows that, on average, IAMs expect growth in renewables to fall to less than half of their recent pace and CCS to more than double from its current best estimate. These results are notable for their robustness across models, stabilization targets, and other scenario characteristics.
A further observation from assessing the scenarios is that the fastest 10 year period of growth generally happens early in solar and 15 years later in CCS (figure 9). In fact, almost all scenarios have growth in solar fastest in the recent past, i.e. between 2010 and 2020, than in the future. This observation is remarkable in that most of that period occurred before the Paris agreement 2 °C target was set and before global emissions began to fall. Even for stringent stabilization targets like 1.5 °C, in which emissions become net zero by mid-century, almost all scenarios have solar growing slower than in the last decade. In contrast, coal CCS sees a much more extended range of maximum scale up—the highest rates of growth occur from 2020 to 2050, with 1.5 °C targets generally earlier, and spread between 2020 and 2040. To be sure, this result for CCS is consistent with other work showing that a 2 °C scenario requires 11% annual growth in stored CO2 sustained over six decades (Zahasky and Krevor 2020). Nonetheless, the pattern that emerges across a range of IAMs, targets, and scenarios is that solar's maximum growth is over. Instead scenarios indicate we will see maximum growth of coal CCS in the 2020s through mid-century and beyond—a very questionable model observation that is in distinct contrast with real-world evidence. In summary, these findings suggest that the 'coal phase-out' pathways appear more feasible than the other CCS-dependent 'persistence' and 'resurgence' archetypes from the perspective of technology scaling.

Figure 9. Timing of period of fastest growth in Paris-consistent climate mitigation scenarios. X-axis is the last year of the 10 year period with highest annual growth rate from 2015 to 2100. Left panel is for solar and right panel is for coal combined with CCS. Colors indicate climate stabilization target.
Download figure:
Standard image High-resolution image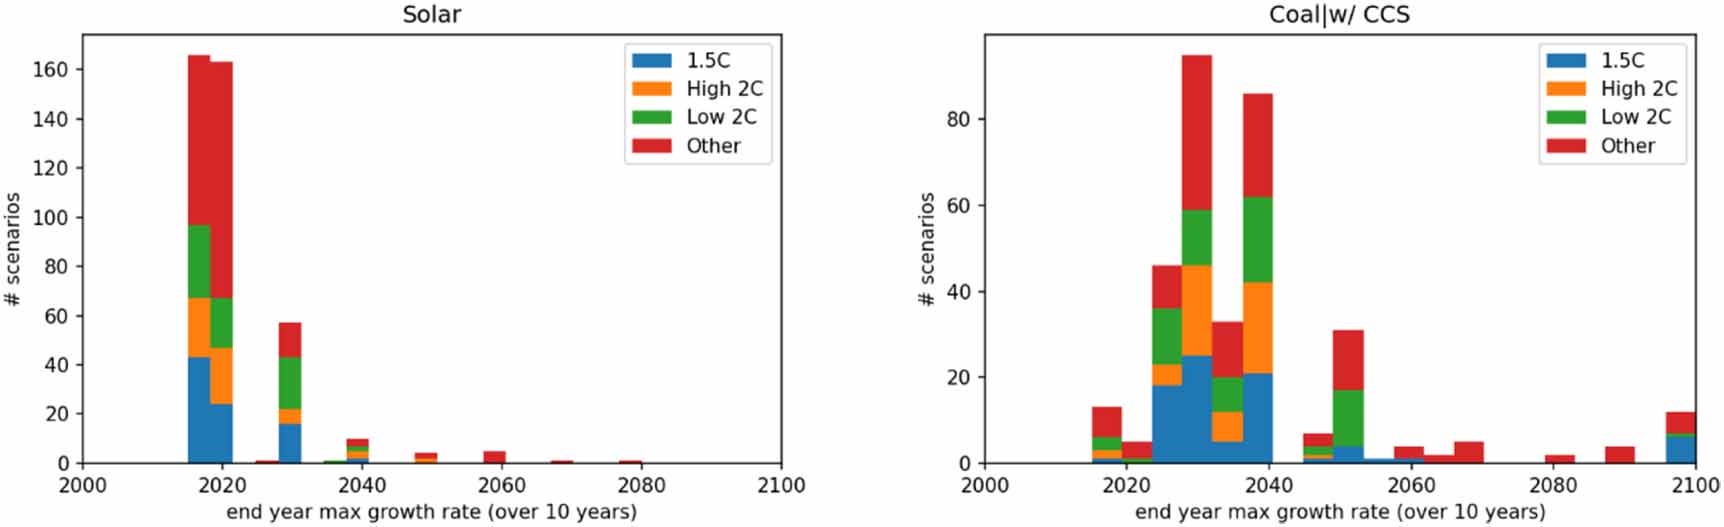
7. Discussion
Phasing out unabated coal is the elephant in the room of climate change mitigation. Results from a large ensemble of mitigation scenarios suggest that an early coal phase-out is cost-effective. It has to happen earlier and faster than the other major fossil fuel transitions away from oil and gas (Luderer et al 2018, Kriegler et al 2018a). Keeping the Paris climate goals within reach requires the organization of a swift global phase-out of unabated coal. It is surprising that evidence on coal phase-out dynamics in long-term mitigation scenarios has not been assessed comprehensively in IPCC reports and only few older studies look at these dynamics in more detail (Ritchie and Dowlatabadi 2017a, 2017b).
In this paper, we provide a comprehensive quantitative synthesis of scenario evidence on coal transitions across the 21st century in scenarios that limit global warming to 2 °C or below. The key contribution of our analysis is its synthetic character. Rather than deriving our insight from a single study design performed by one or a very limited number of models, we consider the broad scenario evidence comprising many different study designs, scenarios and modeling frameworks. Such 'research on research results' in the broad tradition of meta-analysis and ensemble analysis aims to identify robust findings across comprehensive evidence bases. However, we acknowledge that more evidence is not necessarily better. Many review questions are very specific in nature and would not be well answered with a comprehensive dataset as provided here. For more specific questions, model intercomparison setups are the most robust methodological approach (Duan et al 2019). For broad review questions like here—as, for example, commonly raised in IPCC assessments—it is the appropriate choice. From this comprehensive evidence base we derive a series of robust insights that are discussed further below.
We use publicly available scenario ensembles from IPCC reports and augment these with additional data from model intercomparison exercises. This approach neglects a number of scenarios from individual studies on coal phase-outs in the literature. We discuss historical case studies on coal phase-outs in part 1 of this review (Diluiso et al 2021). However, corresponding scenario data can usually not be easily accessed, often do not report the same wealth of variables, do not span across the entire 21st century, or are not linked to a climate module that enables modeling of cost-effective pathways to keeping global warming below 2 °C. Ultimately, we argue that our dataset comprising more than 1500 scenarios from more than 30 different model frameworks covers the entire range of coal transition pathways in the literature; additional studies would not add coal transition dynamics that are not similar to pathways in our dataset and would therefore not alter our findings qualitatively. We include evidence across a variety of different study designs (see table 1). All have in common that they explore Paris-consistent pathways and involve a successful coal transition, but focus in their scope on very different aspects. For example, while some studies focus on interactions between climate and sustainable development policies (e.g. CD-LINKS), others look at the effects of delayed climate action (e.g. AMPERE). This richness of study designs is a feature of our data and analysis that tries to understand the breadth of possible coal transitions.
A focus on coal transitions until mid-century has biased the messaging on coal phase-out dynamics towards a single narrative. Recent discussions of Paris-consistent mitigation pathways in science and policy emphasize the rapid and comprehensive phase-out of all coal as the key feature of Paris-consistent scenarios (IPCC 2018, Rogelj et al 2018b). We apply formal cluster analysis across a set of about 600 Paris-consistent mitigation scenarios and identify two further coal transition archetypes that have largely remained ignored: First, coal persistence pathways phase out coal only very gradually and often only partly. Second, coal resurgence pathways even feature a period of sustained increases in coal consumption during the second half of the 21st century. These archetypes comprise more than 60% of all Paris-consistent mitigation scenarios and can be observed across the AR5 and post-AR5 samples as well as for 1.5 °C and 2 °C scenarios.
We find that coal consumption in baseline scenarios does not have a discernible impact on the archetypical coal transition pathway that the corresponding mitigation scenario follows. The ranges of coal consumption in baselines are very similar across archetypes. Our results rather suggest that the coal transition archetypes are related to climate policy stringency and 'model fingerprints', i.e. specific assumptions in individual models. For example, we find that about 80% of all 'coal phase-out' scenarios come from only two models: REMIND and MESSAGE. These model assumptions may include carbon removal options in other sectors or coal use that is difficult to substitute, for example in the industry sector. Furthermore, some models are more flexible in replacing coal as a primary energy source for electricity generation. For example, some models have constraints on the integration of variable renewables, which favors base-load technologies such as coal power plants. However, more specific information about model constraints and dynamics would be needed to systematically investigate their impact on coal use in mitigation scenarios.
The state of knowledge in the literature on technology innovation and diffusion suggests that the different coal consumption archetypes identified here are not equally plausible. Coal persistence and resurgence pathways heavily depend on large quantities of CCS technologies (figure 4). In contrast, coal phase-out pathways can adopt a wide portfolio of alternative low and no carbon technologies including much more granular wind and solar technologies that have shown rapid diffusion and cost declines over the past decades (Nemet 2019).
The empirical data suggests that large scale technologies such as CCS tend to be adopted more slowly (Wilson et al 2020) and have lower learning rates (Sweerts et al 2020). Hence, the simulated growth in CCS of two orders of magnitude in just 10–20 years is not frequently observed in the historical evidence shown above—even for modular technologies that lend themselves more easily to economies of scale as well as rapid cost reductions and diffusion (Wilson et al 2013). Scaling CCS at the pace and to the scale undertaken in many coal resurgence and coal persistence pathways is currently difficult to perceive—or imagine—in the real world (Zahasky and Krevor 2020). Taking this literature suggests that the large dependence on CCS makes persistence and resurgence pathways more uncertain and potentially more costly than coal phase-out archetypes.
Many IAMs tend to favor larger energy system technologies against the claim—rooted in historical evidence—that granular technologies have advantages in accelerating decarburization due to quicker lead times, fewer delays, and faster learning rates (Sovacool et al 2014, Sweerts et al 2020, Wilson et al 2020). A significant body of literature since AR5 has focused on the point that rapid change can occur as a result of technology improvement (Haegel et al 2019) and supportive policy (Farmer et al 2019), and that the structure of IAMs may be leading them to dismiss these outcomes (Creutzig et al 2017, Lovins et al 2019). Part of the divergence between future scenarios and recent reality may be due to cost assumptions which can be opaque (Krey et al 2019) and in some cases, such as PV, overstated (Creutzig et al 2017, Vartiainen et al 2020). It is further unclear what drives the use of CCS in IAMs, particularly whether there are any structural modeling issues which may favor certain pathways (Koelbl et al 2014). For example, discount rates (Emmerling et al 2019) and target formulation (Johansson et al 2020, Strefler et al 2021) can have a pronounced impact on IAM outputs. Future IAM work would benefit from using more robust and plausible cost data as well as being informed by more up to date research and evidence about innovation and diffusion of low carbon technologies sharing similar characteristics (Nemet 2019, Shiraki and Sugiyama 2020). In addition, future IAM work could focus more on understanding the underlying drivers of certain pathways to determine what role costs and learning may have in relation to other structural aspects of IAMs.
We acknowledge that some energy system models with a higher resolution on energy technologies, and higher resolution in time and space, have performed very well at describing fossil fuel phase-outs and upscaling of renewable energies technologies consistent with historical observations (Jacobson et al 2015, Löffler et al 2017, Bogdanov et al 2019, Hansen et al 2019). However, these models are only sparsely represented in IPCC databases, and thus remain insufficiently reflected in this review. There are also models of fossil fuel extraction that provide more detailed and complementary evidence on coal transitions that are not covered in our data (Mendelevitch et al 2019, Ansari et al 2020, Yanguas Parra et al 2021).
Our analysis therefore points towards potential biases when it comes to the analysis of such diverse scenario ensembles, for example due to the unequal distribution of scenarios by individual models in the underlying database. This is not specific to our database, but commonly observed when large numbers of scenarios are collected, for example, for IPCC assessments. We highlight the need for a discussion of how to deal with scenario bias in large scenario ensembles—a discussion that has been largely neglected so far. We also point towards the potential learnings from other scientific fields like meta-regression analysis, where statistical procedures have been developed to treat the bias from the inclusion of different numbers of effect sizes from individual studies (Stanley and Jarrell 2005).
We identify coal archetypes based on cluster analysis, but acknowledge some arbitrariness in the decisions required for aggregating the 13 resulting clusters. For example, some scenarios with growing rates of coal consumption during the second half of the 21st century are included in the persistence (rather than the resurgence) archetype. Similarly, the persistence scenarios with relatively low levels of coal use are not substantially different to some of the coal phase-out scenarios. During our analysis we imposed different thresholds and aggregation rules that affected the assignment of individual scenarios to particular archetypes. This did not significantly affect the relative sizes or general characteristics of the archetypes.
We believe that this more formal approach of identifying representative coal transition pathways in Paris-consistent mitigation scenarios could also be applied in scientific assessment. For example, IPCC SR1.5 as well as AR6 identified and discussed 'illustrative emissions pathways' (IPCC 2018, 2022) that are used to show typical transition pathways in the scenario ensemble. However, it remained unclear how these were selected and how they relate to the whole range of scenarios assessed in the report. Our approach could address this problem by assigning each scenario to one particular archetype. However, we acknowledge at the same time that our method may in some cases be not very sensitive to identifying policy relevant pathways that are not widely featured in the ensemble.
Our results further suggest that many models might over-estimate the efforts and costs of coal transitions in Paris-consistent mitigation scenarios. We find correlations between baseline coal consumption and mitigation costs for the associated policy scenario which suggests that assumptions leading to high coal consumption in baselines increase mitigation costs (figure S4). The majority of baselines expand coal consumption far beyond what would be expected from historical long-term trends. Similarly, coal use in the SSP baselines are not centered around historical developments: in fact, the middle of the road scenario (SSP2) already more than doubles and even the 'green growth' scenario (SSP1) features coal consumption at today's per capita coal consumption levels. In contrast, solar and wind power are consistently below observed growth rates and deployment levels in the scenarios, despite the fact that they are already cost-competitive with coal for new installations in many places and their continued real-world reductions in costs and improvements in complementary energy storage systems. Hence, we argue that there is an inherent bias towards coal intensive pathways in scenario baselines despite the construction of SSPs as baselines without additional climate policies (van Vuuren et al 2017). With regard to the SSPs, our results suggest either the need for new scenario quantifications based on updated technological specifications or the addition of more optimistic narratives about the transition from coal to renewable energy to avoid biasing towards coal-dependent future worlds.
This review focused on global coal consumption dynamics. But there are important regional differences to consider with respect to the availability of alternative energy sources and technologies, as well as political capacities to manage a phase-out (Steckel and Jakob 2022). One major obstacle for scaling down results from IAMs for regional comparison is that many cost-effective analyses assume uniform carbon pricing regimes across countries. This implies a broad and quick phase-out of coal but also leads to regressive income losses. Fairness considerations are key requirements of the Paris Agreement calling for common but differentiated responsibilities in mitigation measures. This can be addressed by differentiating carbon prices across regions, leading to different rates of coal phase-out across countries (Bauer et al 2020). In order to provide a comprehensive analysis of regionalized coal phase-out scenarios, future research needs to incorporate such regional differentiation.
Based on this extensive review of quantitative scenario evidence and benchmarking against historical evidence, we conclude that the costs and technical difficulty of coal transitions may be exaggerated in Paris-consistent climate mitigation scenarios as typically used in IPCC and other climate change assessments. However, this statement has a specific meaning in the context of this study: baselines are biased towards coal and key renewable alternatives are already today much cheaper and much more competitive than suggested in most scenarios (Creutzig et al 2023). This gets further support by rapid developments in electricity storage (Mauler et al 2021).
There are many reasons why phasing out coal might be much easier than phasing out oil or gas. But we do not say—after all—that phasing-out coal in the real world will not be complicated. The difficulty arises from a political economy that lies largely outside the realm of what is modeled in scenarios. In fact, divergent interests within and across countries as well as very different institutional capabilities lead to a range of political economy constraints and drivers that make such a transformation extremely challenging (Lamb and Minx 2020, Jakob and Steckel 2022). Overcoming these social, political and economic challenges is likely to require a strong emphasis on 'just transition' policies and strategies (Jakob et al 2020). Part 1 of this review (Diluiso et al 2021) therefore synthesizes experiences made across the globe with organizing coal transitions, their economic, social and environmental outcomes as well as barriers and opportunities.
Acknowledgments
J C M, F D, J C S, N M, S L B and N B acknowledge funding from the German Federal Ministry of Education and Research within the PEGASOS project (Grant Reference: 01LA1826A). P O acknowledges funding from the German Federal Ministry of Education and Research within the FFF (01LA1810A) and CoalExit project (01LN1704A). W F L acknowledges funding from the German Federal Ministry of Education and Research (IPCC-AR6-III- 2, Grant Reference: 01LG1910A). S L B also acknowledges funding from Horizon Europe (RESCUE, Grant Reference: 101056939). J C M, F M H and W F L also acknowledge funding by the European Research Council (ERC) under the European Union's Horizon 2020 Framework Programme as part of the project 'GeoEngineering and NegatIve Emissions pathways in Europe' (GENIE) (Grant agreement No. 951542). R M A and G P P acknowledge funding from the European Union's HORIZON EUROPE Research and Innovation Programme under Grant Agreement No. 101056306 (IAM COMPACT).
Data availability statement
No new data were created in this study. The data analysed in this study is available from the sources indicated in section 3.
Footnotes
- 23
All the databases are publicly available: IPCC AR5 database (https://tntcat.iiasa.ac.at/AR5DB/), AMPERE (https://tntcat.iiasa.ac.at/AMPEREDB/dsd?Action=htmlpage&page=about), LIMITS (https://tntcat.iiasa.ac.at/LIMITSDB/dsd?Action=htmlpage&page=about), Rose (www.rose-project.org/database), SSP database (https://tntcat.iiasa.ac.at/SspDb/), IPCC SR1.5 database (https://data.ene.iiasa.ac.at/iamc-1.5c-explorer/), ADVANCE (https://db1.ene.iiasa.ac.at/ADVANCEDB/dsd?Action=htmlpage&page=welcome), CD-LINKS (https://data.ene.iiasa.ac.at/cd-links/#/workspaces).
- 24
We provide a detailed assessment of historical coal phase-out experience in Part 1 of this review (Diluiso et al 2021).
Supplementary data (1.5 MB PDF)