

Abstract
To better support wildfire predictions and risk assessment, multiple fire danger rating indices (FDRIs) have been developed but their credibility in China remains obscure. Compared with the satellite fire observations, 13 FDRIs are evaluated for the historical (2003–2021) forest fire frequency in China from four different time scales: active seasons, trends, interannual variations (IAVs) and discrimination of fire/non-fire days (DFDs). Most FDRIs effectively capture the double active seasons over Southwest China and the dominant active season over Northeast and South China but fail over the other regions. FDRIs with cloud cover perform better in capturing climatological fire seasonality. All FDRIs fail to reproduce the significant decreasing trend of forest fires speculatively due to local fire management and discordant changes in meteorological elements. Most FDRIs have the advantages of the IAVs and DFDs over Southwest China but exhibit deficiencies over the other regions. FDRIs incorporating wind speed perform best in representing both IAVs and DFDs, indicating the indispensable effect of surface wind on the interannual/daily variation of fire danger. This study provides a credible reference for utilizing FDRIs in China, as well as offers insights for developing better regional FDRIs to represent different time-scale variations.
Export citation and abstract BibTeX RIS

Original content from this work may be used under the terms of the Creative Commons Attribution 4.0 license. Any further distribution of this work must maintain attribution to the author(s) and the title of the work, journal citation and DOI.
1. Introduction
Wildfires are devastating natural hazards with wide-ranging threats to ecology and human societies (Bowman et al 2009, Giglio et al 2013, Reardon 2018). There is an urgent need for monitoring and future prediction of wildfire occurrences (Guo et al 2023). The likelihood of wildfire ignition and spread is closely tied to local fuel availability and flammability, which is directly influenced by weather and climate (Reinhard et al 2005). High temperatures, rainfall deficit, dry air and strong winds are all favorable meteorological conditions for wildfires (Flannigan et al 2009). To quantify wildfire danger, numerous fire danger rating indices (FDRIs) have been developed by integrating critical weather variables (Erickson et al 2016). These FDRIs provide valuable information for short-term forecasts and long-term prediction/projection of wildfires, helping the preparation of fire management resources and strategies in advance on different time scales (Di Giuseppe et al 2020).
Since the 1920s, fire-related meteorological factors have been combined to construct FDRIs based on simple algorithms (Sharples et al 2009). For instance, Canadian scientists employed air relative humidity as a proxy of FDRI in 1928 (Stocks et al 1989). After that, based on combustion principles and field experiments, more advanced indices integrating local fuel information have been released. These indices can estimate not only the probability of fire ignition but also the spread rate and severity after a fire breakout, such as indices in the Canadian Forest Fire Danger Rating System (CFFDRS) (Van Wagner and Pickett 1985, Van Wagner 1987, Stocks et al 1989), the Australian McArthur Mark 5 Rating System (Mark5RS) (McArthur 1967, Noble et al 1980), and the U.S. Forest Service National Fire-Danger Rating System (NFDRS) (Deeming et al 1977). Compared to meteorological variables, FDRIs provide more comprehensive and standardized assessments of wildfire danger and have been broadly used worldwide for decades (Taylor and Alexander 2006, De Jong et al 2016). However, as the original genesis of these indices is based on some empirical parameters over specific regions, whether they are suitable over other regions has not been clarified (Tian et al 2005, Arpaci et al 2013, Pinto et al 2020, Yang et al 2021).
Forest fires are a frequent phenomenon in China, posing considerable danger to the safety and well-being of the population. Although firefighting has effectively reduced forest fire occurrence, their average number still exceeds 2000 per year (Wang et al 2022). Under climate change with more frequent extreme weather events and growing forest stock volume (Nüchel and Svenning 2017), China is facing more severe wildfire danger (Yang et al 2010), demonstrating the importance of fire danger prediction. In China, the research on the forest FDRI developed rapidly after the late 20th century. For example, Zhang and Huo (1995) forecasted Southwestern forest fire danger based on the relationship between weather conditions and local fuel moisture. Xiao et al (1996) applied a fuel drought index as a FDRI for boreal forests in China. The National Meteorological Center of China (CNMC) developed a countrywide forest fire danger weather index (FFDWI) (Niu et al 2006), which sums the scores corresponding to the ratings of temperature, relative humidity, wind speed and rain-free days and is currently applied in operational use. However, the relationship between wildfire and meteorology is complicated among regions and seasons (Flannigan et al 2009, Pan et al 2023). For instance, low precipitation and large diurnal temperature differences were the major causes of wildfire occurrence over Southeastern China, whereas warm conditions were the primary drivers over Southwestern China (Fang et al 2021). Precipitation is the main driver of spring wildfire burned area over southern China, while wind speed is more important in winter (Wang et al 2021). Wildfire frequency over Southwestern China has a high correlation with consecutive dry days rather than with total rainfall amount on an interannual scale (Xing et al 2023). These studies highlight the need to select suitable FDRIs to represent the wildfire danger over different regions of China.
Therefore, in this study, utilizing 12 globally recognized FDRIs along with the Chinese FFDWI, we first evaluate their credibility in identifying forest fire danger across diverse target regions and seasons within China at different time scales. On this basis, we attempt to detect the dominant meteorological factors along with different regions and different time scales, as well as provide the potential best FDRI over each region for different time-scale predictions.
2. Dataset and method
2.1. Fire data
The Moderate Resolution Imaging Spectroradiometer (MODIS) active fire points (Giglio et al 2018) are derived from Fire Information for Resource Management System (https://firms.modaps.eosdis.nasa.gov), which has proved to be a reliable source for monitoring vegetation fires (Justice et al 2002) and provides global daily fire points with information of locations, date/time and confidence. Forest fire points with confidence greater than 80% during the period of 2003–2021 were selected by applying a forest coverage mask provided by the National Tibetan Plateau/Third Pole Environment Data Center (http://data.tpdc.ac.cn). We built 0.25-degree rectangles and calculated the number of fire points within the rectangles for each day to represent the forest fire frequency (figure S1). The daily 0.25-degree forest fire frequencies were further aggregated by different seasons and regions.
2.2. FDRI
Thirteen FDRIs that have been broadly used are selected to be evaluated, and their information is depicted in table 1. The CNMC FFDWI (Standardization Administration of the People's Republic of China 2018) was constructed based on the modified Brown-Davis method from the Los Angeles Forestry Experimental Station. Among the Mark5RS, the Fire Danger Index (FDI) (McArthur 1967, Noble et al 1980) assesses fire danger by combining temperature, relative humidity, and wind speed, as well as a drought factor representing fuel availability. The Keetch–Byram drought index (KBDI) (Keetch and Byram 1968), an estimate of soil moisture deficit, is used to derive the drought factor and is often employed as a FDRI itself. The Canadian forest service fire weather index rating system (CFWIRS) (Van Wagner and Pickett 1985, Van Wagner 1987) is a component of the CFFDRS, which consists of three fuel moisture indices (fine fuel moisture code, FFMC; duff moisture code, DMC; and drought code, DC), two fire behavior indices (initial spread index, ISI; Build-up Index, BUI), and a final index (fire weather index, FWI). The NFDRS estimates dead and live fuel moisture at different depths and provides four output indices (Deeming et al 1977): spread component (SC), ignition component (IC), energy release component (ERC), and burning index (BI). Meanwhile, to better recognize the impact of different meteorological variables, the FDRIs are classified into four types: Type I solely includes temperature, precipitation, and/or relative humidity. Besides those elements in Type I, Type Ⅱ additionally includes wind speed, Type Ⅲ additionally includes cloud cover, and Type IV has both wind speed and cloud cover.
Table 1. Description of 13 fire danger rating indices evaluated in this study.
| System | Index | Role | Meteorology | Type | References | ||||
|---|---|---|---|---|---|---|---|---|---|
| T | P | H | U | C | |||||
| Chinese National Meteorological Center (CNMC) | Forest Fire Danger Weather Index (FFDWI) | Fire behavior potential; reflecting the danger of forest fire occurrence and its spread | ☑ | ☑ | ☑ | ☑ | Ⅱ | Standardization Administration of the People's Republic of China (2018) | |
| Australian McArthur Mark 5 Rating System (Mark5RS) | Keetch–Byram drought index (KBDI) | Drought indicator; metric of seasonal drought severity and fuel availability | ☑ | ☑ | I | Keetch and Byram (1968) | |||
| Fire danger index (FDI) | Fire behavior potential; chances of fire starting, rate of spread, intensity, and difficulty suppression | ☑ | ☑ | ☑ | ☑ | Ⅱ | McArthur (1967), Noble et al (1980) | ||
| Canadian forest service fire weather index rating system (CFWIRS) | Fine fuel moisture code (FFMC) | Fuel moisture content; representative of the litter and fine fuels | ☑ | ☑ | ☑ | ☑ | Ⅱ | Van Wagner and Pickett (1985), Van Wagner (1987) | |
| Duff moisture code (DMC) | Fuel moisture content; representative of the loosely compacted organic layers | ☑ | ☑ | ☑ | I | ||||
| Drought code (DC) | Fuel moisture content; representative of the compact organic layers | ☑ | ☑ | I | |||||
| Initial spread index (ISI) | Fire behavior potential; rate of fire spread, combines FFMC and wind speed | ☑ | ☑ | ☑ | ☑ | Ⅱ | |||
| Build-up index (BUI) | Fire behavior potential; fuel available for combustion, combines DMC and DC | ☑ | ☑ | ☑ | I | ||||
| Fire weather index (FWI) | Fire behavior potential; general fire intensity, combines ISI and BUI | ☑ | ☑ | ☑ | ☑ | Ⅱ | |||
| U.S. Forest Service National Fire Danger Rating System (NFDRS) | Energy release component (ERC) | Fire behavior potential; potential available energy at the head of the fire | ☑ | ☑ | ☑ | ☑ | III | Deeming et al (1977) | |
| Spread component (SC) | Fire behavior potential; rate of fire spread | ☑ | ☑ | ☑ | ☑ | ☑ | IV | ||
| Ignition component (IC) | Fire behavior potential; probability of fire ignition, combines SC and wind speed | ☑ | ☑ | ☑ | ☑ | ☑ | IV | ||
| Burning index (BI) | Fire behavior potential; metric of the difficulty of fire suppression, combines SC and ERC | ☑ | ☑ | ☑ | ☑ | ☑ | IV | ||
Note: T represents temperature, P is for precipitation, H is for relative humidity, U is for wind speed, and C is for cloud cover.
The historical daily FFDWI was calculated driven by the fifth-generation European centre for medium-range weather forecasting climate reanalysis (ERA5) (Haiden et al 2022), following the national standard (Standardization Administration of the People's Republic of China 2018). The other indices were derived from the copernicus emergency management service driven by ERA5 at a spatial resolution of 0.25° implemented by Vitolo et al (2020), which is an updated version of Di Giuseppe et al (2016).
2.3. Methods
Considering that there is a fair amount of zero values and discontinuities in fire datasets, the Spearman rank correlation coefficient is employed to measure the strength and direction of the year-to-year time series between fire frequency and different FDRIs during 2003–2021. Theil–Sen slope (Theil 1950, Sen 1968) is employed to examine the long-term trend of forest fire frequency and FDRIs. The significance of the trend is tested using the Mann-Kendall trend test in the Python package pyMannkendal (Hussain and Mahmud 2019).
We analyzed the performance of FDRIs within four seasons, respectively, i.e. December–January–February (winter), March–April–May (spring), June–July–August (summer), and September–October–November (autumn). To examine whether these indices are credible in the discrimination of fire/non-fire days, we employed the intercept of the ranked percentile curve (Andrews et al 2003, Eastaugh et al 2012) as a validation metric. First, we convert daily values for each index to percentiles across all geographical days for each season and region during 2003–2021. Each day within a 0.25-degree rectangle is then categorized as a fire day (fire is present) or a non-fire day. Then, the percentiles on all fire days are ranked in ascending order. The intercept of the curve, determined by the median of all of the possible individual intercepts of the Theil–Sen slope, is used to represent the skill in discriminating fire/non-fire days. A perfect FDRI would have an intercept of 100, as its values on all fire days should fall within the upper tail of the frequency distribution. Note that a FDRI with an intercept over 50 is regarded as credible in this study.
3. Selection of fire danger regions and active seasons over China
To distinguish intra-regional homogeneity and inter-regional differences, the study area was divided into nine subregions (figure 1(a)), basically considering climate conditions, land cover and provincial boundaries according to numerous previous studies (Piao et al 2009, Yi et al 2017). Figure 1(b) shows that forest fires mainly occur over eastern and southern areas but rarely over Northwestern areas in China from 2003 to 2021, with a resolution of 0.25° (about 28 km), derived from the quality-controlled MODIS active fire archive (see methods). To facilitate the assessment as well as consider the significance of fire impact, we first select the forest fire danger regions (called danger regions hereafter) following the criteria that both the ratio of regional forest area and the density of regional fire frequency exceed the corresponding national averages (20% and 2.13 times per year, respectively). As a result, five danger regions, namely Northeast, Central, Southeast, South and Southwest China, are eventually identified as shown in figure 1(c). Subsequently, it is found that each danger region experiences double fire active seasons (called active seasons hereafter) (figure 1(d)). In detail, spring is the dominant active season and autumn is the secondary active season over Northeast China, while winter is the dominant active season and spring is the secondary active season over Central, Southeast, South and Southwest China. Here, the fire active seasons are defined as the seasons when the seasonal mean of fire frequencies exceeds the annual mean over each danger region.
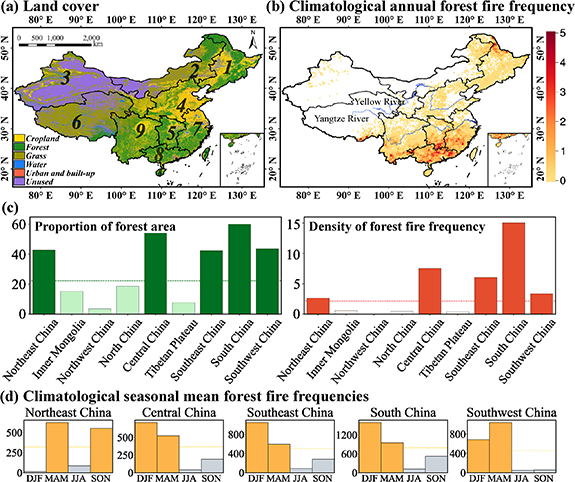
Figure 1. (a) Land cover and nine subregions over China. 1-Northeast China, 2-Inner Mongolia, 3-Northwest China, 4-North China, 5-Central China, 6-Tibet Plateau, 7-Southeast China, 8-South China, 9-Southwest China. (b) The climatological annual forest fire frequencies (units: per month) from 2003 to 2021 with a resolution of 0.25° (about 28 km). (c) The proportion of forest area (units: %; left green bar) and regional forest fire frequency densities (units: per year per 0.25° grid; right red bar). Here, the density is calculated as the proportion of the total fire frequencies over the regional grid count. (d) Climatological seasonal mean forest fire frequencies over each fire danger region (units: per month). The dashed line represents the annual mean frequencies, and the deep yellow bar indicates the fire active seasons over each region.
Download figure:
Standard image High-resolution image4. Credibility of FDRIs over China
To choose the optimum FDRIs aiming at different time-scale variations, we intentionally examine them from four perspectives: climatological active seasons, trends, interannual variations (IAVs), and the discrimination of fire/non-fire days (DFDs). Considering regional and seasonal differences, we examine the performance of FDRIs for individual active seasons within each danger region identified in section 3.
4.1. Climatological fire active seasons
Compared with the observation, there are different performances for the climatological fire seasonality among the FDRIs. The best performance of these indices appears over Southwest China (figure 2(a)), in which almost all FDRIs accurately exhibit the realistic double active seasons in winter and spring, except for KBDI, FDI and SC which fail to capture the winter. Over Northeast China, five indices (FFDWI, FDI, FFMC, BUI and ERC) can successfully identify double active seasons in spring and autumn, while the others only capture either spring (DMC, ISI, FWI, SC, IC and BI) or autumn (DC and KBDI). In contrast, the FDRIs exhibit relatively poor performance over the other three danger regions. Over South China, though all FDRIs successfully identify the dominant active season in winter, only the SC index can capture the secondary active season in spring. Over the middle and lower Yangtze River areas (Central and Southeast China), fewer than 30% of FDRIs are able to capture their active seasons.
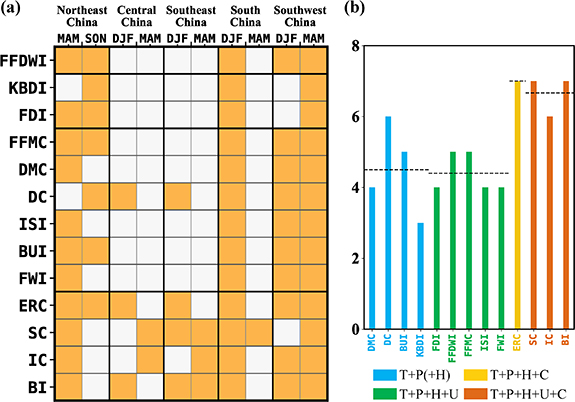
Figure 2. (a) Heatmap to depict whether the fire active seasons can be captured or not by each fire danger rating index (FDRI) over each fire danger region (shading denotes the FDRI can well capture the corresponding seasons). (b) The total number of active seasons that each FDRI can capture measured by different types. T represents temperature, P is for precipitation, H is for relative humidity, U is for wind speed, and C is for cloud cover.
Download figure:
Standard image High-resolution imageFurthermore, we attempted to compare the behavior differences among different types of FDRIs with inclusions of distinct meteorological variables. The most remarkable feature is that the FDRIs incorporating cloud cover exhibit the best performance, which can well capture the percentage ranging from 60% to 70% for all active seasons over all of the danger regions, while the other indices only obtain 30%–60% as shown in figure 2(b). Note that the performance of DC is an exception even though it only includes temperature and precipitation.
4.2. Trend change
We further evaluate the credibility of FDRIs in depicting the trend of regional averaged fire frequencies from 2003–2021. In observation, the most evident feature for long-term change in forest fire frequency is that there are significantly decreasing trends in double active seasons (winter and spring) over Southeast, South and Southwest China, and in the dominant active season (winter) over Central China (figure 3(a)), consistent with previous studies (Yi et al 2017, Fang et al 2021, Wang et al 2021). However, none of the FDRIs capture the significant declines in forest fire frequency over the above four regions, although most FDRIs display negative slopes (figure 3(b)). Additionally, all FDRIs present positive slopes of long-term change in spring over Southwest China. Over Northeast China, no significant trends are found after 2003 in both observation and all FDRIs (except for DC in autumn). However, this may be the result of stringent fire prevention rules implemented in response to the 1987 Black Dragon Fire tragedy in China, resulting in the annual forest fire frequency declining significantly. On the other hand, the long-term changes of the associated meteorological elements exhibit different trends, which could have opposite impacts on fire danger (figure S3).

Figure 3. (a) Time series of 0–1 standardized forest fire frequency over each danger region and active season over China from 2003–2021. The dashed line denotes the Theil–Sen regression line. (b) Long-term trend slopes of 0–1 standardized year-to-year forest fire frequency and each fire danger rating index. * denotes the slope is significant at the 95% confidence level.
Download figure:
Standard image High-resolution image4.3. IAVs
There are large year-to-year variations of fire frequencies in the active seasons over the danger regions (figure S2). After removing the linear trend, we examine how well the FDRIs capture the IAVs for regional mean forest fires in China using Spearman rank correlation. Generally, FDRIs exhibit good abilities to capture the IAVs in the dominant active season over all of the danger regions (figure 4(a)). In detail, most FDRIs successfully capture the IAVs in two active seasons over Southwest China. However, almost all FDRIs can only capture the IAVs for the dominant active season over Northeast China, Central, Southeast and South China but fail for their secondary active season. The exceptions are DC and KBDI over Central, Southeast and South China, together with FFDWI, DC and SC over Northeast China, which are inadequate for representing the IAVs for double active seasons over these regions.
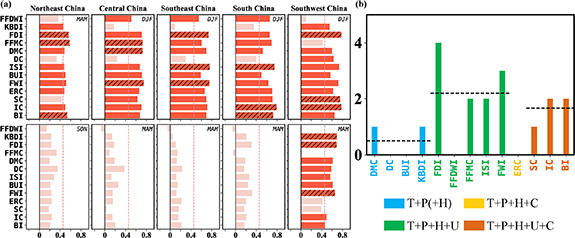
Figure 4. (a) Spearman rank correlation coefficients between the detrended regional mean forest fire frequency and each fire danger rating index (FDRI) for each danger region and active season over China from 2003–2021. The red dashed line denotes the 95% confidence level, and the hatch denotes the FDRI ranking in the top three. (b) The total number of instances each FDRI can rank in the top three for capturing the interannual variation. Note that only the FDRIs with significant correlation coefficients are counted. T represents temperature for short, P is for precipitation, H is for relative humidity, U is for wind speed, and C is for cloud cover.
Download figure:
Standard image High-resolution imageWe further compare the FDRIs that rank the top three in each active season and danger region. Different from the results obtained in section 4.1 that the FDRIs with cloud cover show the best performance in capturing active seasons, here the inclusion of wind speed is more important for capturing the IAVs in forest fire frequency. As shown in figure 4(b), the FDRIs with wind speed exhibit the best performance, even better than those incorporating both cloud cover and wind speed.
4.4. DFDs
We further examine whether the FDRIs can effectively discriminate fire/non-fire days at the grid level. Here, we employ the intercept of the curve obtained by ranking the percentile corresponding to FDRI in each fire day (see methods in detail) to measure their ability in the DFDs. As shown in figure 5(a), the most remarkable feature is that most FDRIs have the advantage of discriminating the fire/non-fire days over Southwest China, particularly in its dominant active season (spring). In comparison, most FDRIs are not able to well separate the fire and non-fire days over all other regions, except that some indices are distinguishable for the dominant fire active season over Central China. Additionally, we found that the FDRIs integrating wind speed have the strongest ability to identify the fire and non-fire days (figure 5(b)), indicating that wind speed is crucial for the day-to-day change of fire danger. One possible explanation is that wind speed becomes a critical factor in reflecting rapid weather changes and high fire danger (Yu et al 2023).

Figure 5. (a) Intercept of the curve obtained by ranking the percentile corresponding to each fire danger rating index (FDRI) on all fire days for each danger region and active season over China from 2003–2021, respectively. Note that any FDRI with an intercept below 50 is regarded as having no skill, and the hatch denotes the FDRI ranking in the top three. (b) The total number of instances each FDRI can rank in the top three for the discrimination of fire/non-fire days. Note that only the FDRIs with skill are counted. T represents temperature, P is for precipitation, H is for relative humidity, U is for wind speed, and C is for cloud cover.
Download figure:
Standard image High-resolution image5. Discussion
This study aims to evaluate the effectiveness of different FDRIs in identifying the temporal variations of forest fires over different regions of China. The evaluation results indicate that different meteorological factors could affect the performance of the FDRIs. For instance, the FDRIs incorporating wind speed (e.g. FFMC) perform better, especially for identifying IAVs and DFDs. It aligns with previous studies (Arpaci et al 2013, Steinfeld et al 2022), suggesting that the FDRIs could respond readily to the changing fire danger conditions by taking winds into account (figures S4 and S5). Yu et al (2023) also demonstrated that wind speed is a critical factor under high-fire danger conditions. However, we found that the winds-included FDRIs may also have limited skills in capturing the fire danger (e.g. FFDWI) due to the inadequate consideration of the non-linear relationship between climate and wildfire, since the impact of winds on fire behavior can also be influenced by other factors (e.g. fuel, weather and topography) (Di Giuseppe et al 2016, Jones et al 2022). Thus, future works associated with the development and application of FDRIs should carefully consider the internal response between meteorological factors and fire activities, as well as the interactions among meteorological factors.
In our analysis, the focused target variables were the forest fire frequency and presence when assessing the credibility of FDRIs. Fire intensity is also essential as it relates to fire outcomes like loss of life and property (Keeley 2009). Considering the fire frequency is generally proportional to the total fire intensity, measured by fire radiated power (FRP), on an interannual scale (Sun et al 2022), the ability of the FDRIs to capture the IAVs in fire intensity could be deduced from the results of capturing the IAVs in fire frequency (figure 4). To further investigate their performance in identifying high-intensity fire days, we intentionally chose two known large forest fire cases in China here and compared the day-by-day FDRI percentiles with total FRP values preceding, during and after the fires for approximately one month at a 0.25° resolution. The first forest fire event was in Xichang City, Sichuan Province (Southwest China), on 30 March 2020 (figure S4), which burned more than 1000 hectares and 19 firefighters killed. The second event was in Sanming City, Fujian Province (Southeast China), on 12 February 2009 (figure S5), spreading quickly to more than seven villages. As a result, we found that the FDRIs, which are effective in DFDs, can also indicate high-intensity fires (figures S4 and S5). Future investigation of the ability of FDRIs to identify fire intensity could benefit from constructing a finer wildfire growth dataset (McClure et al 2023) at a finer spatiotemporal resolution.
6. Conclusion and outlook
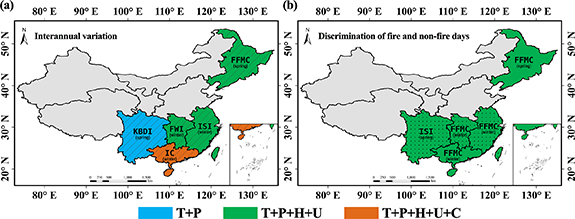
This study comprehensively examined the ability of 13 FDRIs to capture the China forest fire danger across four time scales: active seasons (climatological fire seasonality), trends, IAVs (year-to-year) and DFDs. For seasonality, most FDRIs can effectively capture the double active seasons over Southwest China and the dominant active season over Northeast and South China, but fail over Central and Southeast China. However, all FDRIs fail to capture the long-term decreasing trends of forest fire frequency over China, posing a challenge to the future projections of wildfire danger. Since the year-to-year variation of wildfire frequency and DFDs are essential for the operational forecast and prediction of wildfire danger, the results exhibit that most FDRIs are able to effectively capture the IAVs and DFDs in double active seasons over Southwest China but only do well in the dominant active season over other danger regions. The evaluation framework aiming at different time-scale variations developed in this study provides a set of objective metrics for the comparison of different fire danger rating systems over some regions. Though the strict fire-prevention practices do have a lot of influence on wildfires (mainly the long-term trend changes) in China (Xiong et al 2020, Hayes 2021, Zhou et al 2022), the IAVs in forest fire frequency and DFDs can be reproduced by a number of FDRIs in most danger regions and active seasons. Figure 6 demonstrates the best FDRIs for capturing the IAVs and DFDs during the dominant active seasons over all of the Chinese forest fire danger regions, providing an objective reference for the users concerning different time-scale variations of fire danger. Most importantly, we found that the meteorological parameters used to construct the index impact their performance. Note that FDRIs incorporating cloud cover have the advantage of capturing the fire active season in climatology. In contrast, those including wind speed are able to acquire more accurate IAVs and DFDs. This indicates the meteorological dominant factors for fire occurrence could be distinct along with different time-scale variations, which sheds light on promoting future FDRI constructions.
Figure 6. The best fire danger rating indices (FDRIs) for representing (a) the interannual variation and (b) the discrimination of fire/non-fire days in the dominant active seasons over each danger region over China from 2003–2021. Hatch in (a) denotes that the corresponding Spearman rank correlation coefficient is positive and significant at the 95% confidence level, and dots in (b) denote that the FDRI with an intercept over 50. T represents temperature, P is for precipitation, H is for relative humidity, U is for wind speed, and C is for cloud cover.
Download figure:
Standard image High-resolution image
This study demonstrates the evident dependence of FDRIs on both geographical regions and time scales, indicating that the dominant factors affecting fire frequency and presence vary among different regions and time scales. The results strongly suggest that users should pay attention to the fidelity of FDRIs over a specific region for a specific time-scale variation when using them. e.g. Seasonal prediction focuses on the IAVs, daily forecast emphasizes the day-by-day discrimination, and future projection concerns the long-term trend. Meanwhile, this study implies that, on the one hand, it is necessary to further identify and understand the contributors to the fire variation over different time scales; on the other hand, it is urgent to develop suitable FDRIs for the target region and the target users using more detailed datasets about fuel, meteorology, and fire management policy.
Acknowledgments
The authors appreciate the editors and anonymous reviewers for their constructive comments and suggestions. This research was supported by funding from the National Natural Science Foundation of China [Grant 42261144671, 42175161, 32201573, 31971667]. Stacey New was supported by the UK-China Research & Innovation Partnership Fund through the Met Office Climate Science for Service Partnership (CSSP) China as part of the Newton Fund. The authors would like to thank the high-performance computing support from the Center for Geodata and Analysis, Faculty of Geographical Science, Beijing Normal University [https://gda.bnu.edu.cn/]
Data availability statement
All data that support the findings of this study are included within the article (and any supplementary files).
Supplementary data (6.1 MB DOCX)