

Abstract
The upper-tropospheric carbonaceous aerosol layer (TCAL) represents the increase of aerosols in the upper-troposphere. It was first discovered over Asia but was found in this study to also occur over South America and Africa. The TCALs over three regions typically exist during the strong deep convection season, with the Asian, South American, and African TCALs showing peak intensity during July–August, October–December, and November–December, respectively. Over Asia, the TCAL has the highest altitude and widest spread due to strongest deep convection and upper-troposphere anticyclonic system. TCAL intensity is highest in South America maybe due to heaviest pollutant emissions. Anthropogenic pollution from India and western China produces two Asian TCAL centers, whereas widespread wildfires result in single centers over South America and Africa. TCAL radiative effect at the top of the atmosphere has warming effects over Asia (+0.23 W m−2), whereas cooling effects perform over South America (−0.54 W m−2) and Africa (−0.20 W m−2) owing to its altitude and the divergent strengths of black-carbon absorption and organic-carbon scattering.
Export citation and abstract BibTeX RIS

Original content from this work may be used under the terms of the Creative Commons Attribution 4.0 license. Any further distribution of this work must maintain attribution to the author(s) and the title of the work, journal citation and DOI.
1. Introduction
The upper-tropospheric aerosol layer defines the accumulation and concentration of aerosols in the upper troposphere even lower stratosphere (Lau et al 2018, Bian et al 2020), contrasting with the decreasing concentration of aerosols in the lower troposphere as altitude increases (Yu et al 2010, Liu et al 2021). The phenomenon was first discovered over Asia during the boreal summer through satellite retrieval and model simulation and was known as the Asian tropopause aerosol layer (ATAL) (Vernier et al 2011, Yu et al 2017). The presence of the ATAL can significantly alter precipitation (Fadnavis et al 2017), deplete stratospheric ozone (Salawitch and McBride 2022, Solomon et al 2022), and inhibit surface warming (Fadnavis et al 2019), resulting in considerable impacts on the environment, hydrology, and even human life in Asia (Yuan et al 2019b, Liu et al 2020, Usha et al 2022).
The ATAL is formed by the joint effects of atmospheric dynamics (deep convection activities and anticyclonic system) and surface pollutant emission (Yu et al 2017, Lau et al 2018, Lelieveld et al 2018). Specifically, local emissions and long-range transport by prevailing southwesterly winds lead to high concentrations of surface pollutants over South and East Asia (Neely et al 2014, Zhang et al 2019, Wu et al 2022b). During the Asian summer monsoon period, deep convection and strong updrafts occur, forcing surface pollutants to penetrate into the stratosphere (Bucci et al 2020, Lau and Kim 2022). Anticyclonic circulation in the upper troposphere acts as a trap, causing the pollutants to accumulate over the Tibetan Plateau rather than spreading globally (Vernier et al 2011, Yuan et al 2019a). In view of this formation mechanism, the upper-tropospheric aerosol layer may exist over other areas such as the Australian–Asian, African, and American monsoon regions (Geen et al 2020). If so, the spatial features of each upper-tropospheric aerosol layer may be different because each regional atmospheric dynamic has unique characteristics of intensity, extent, and prevailing period (Zhisheng et al 2015, Li et al 2016). Previous studies have suggested the possible existence of upper-tropospheric aerosol layer over North America and Africa, but considerable uncertainty remains (Vernier et al 2015, Yu et al 2015), so it is necessary to examine the possible existence of upper-tropospheric aerosol layer worldwide to evaluate their potential atmospheric and climatic effects.
Interactions between aerosols and short-wave radiation significantly impact atmospheric thermodynamic and dynamic states, with notable effects on the radiation budget and climate system (Zhang et al 2020). In the ATAL, the aerosols have considerable radiative effect, with radiation perturbations of +0.15 W m−2 at the top of the atmosphere and −0.72 W m−2 at the surface (Gao et al 2023), despite their relatively small amounts compared with surface loading. carbonaceous aerosols (CAs), are prevalent in the ATAL and are particularly important due to their high capacity for solar radiation absorption (Ding et al 2016, Tao et al 2020). Radiative effect induced by CAs is approximately twice that of mass-equivalent sulfate aerosol (Liu et al 2022). Further, the interactions between CAs and radiation can effectively disturb atmospheric stratification and circulation by heating atmosphere (Ding et al 2016), and accelerate glacier and snow melting due to darkening effect (Pu et al 2021, Niu et al 2022). In ATAL, atmospheric warming induced by CAs causes increased precipitation over Asia through strengthening the monsoon Hadley circulation (Fadnavis et al 2017). Therefore, the CAs play a key role in the atmosphere. It is vital to examine the existences of CAs in the upper-tropospheric aerosol layer and assess its radiative effects globally because of their widespread distribution in the world, particularly in strong deep convection regions.
This study aimed to provide a global perspective on the upper-tropospheric carbonaceous aerosol layer (TCAL) phenomenon by considering its existence in different strong deep convection regions (monsoon prevailing regions). Data from multiple sources including satellite retrievals, reanalysis, and model simulations were used to elucidate processes that influence the formation and evolution of a TCAL, particularly the impact of atmospheric dynamics and surface pollutants. Our results provide innovative insights into the interactions between aerosols and atmospheric dynamics, thus contributing to a deeper understanding of these complex phenomena.
2. Data and methods
2.1. Satellite retrieval
The ozone mapping and profiler suite (OMPS) limb profiler (LP) aboard the Suomi National Polar-orbiting Partnership satellite was launched in October 2011, aiming to retrieve vertical profiles of ozone, aerosol extinction, and cloud-top height (Chen et al 2018, 2020). The instrument measures limb-scattering radiance at six wavelengths (510, 600, 675, 745, 869, and 997 nm) in the 0–80 km altitude range. The relatively high vertical and spatial sampling allow detection and tracking of sporadic events when aerosol particles are injected into the tropopause (Wu et al 2022a). In studying the TCAL, this work used the Level-2 swath observation product of the OMPS/LP (Taha et al 2021). We note that the OMPS/LP retrieved the signals of total aerosols components, which was only utilized to verify the existences of this phenomenon.
In addition, aerosol optical depth (AOD) from CALIPSO (Winker et al 2010), land cover and fire monitoring product from the moderate resolution imaging spectroradiometer (MODIS) instrument (Justice et al 2002), outgoing longwave radiation (OLR) from US National Oceanic and Atmospheric Administration (NOAA) satellite observations (Gruber and Krueger 1984), and global precipitation climatology project (GPCP) combined the satellite retrieval and rain gauge observation (Huffman et al 1997) were also applied.
2.2. Reanalysis
The modern era retrospective analysis for research and applications version 2 (MERRA2) atmospheric reanalysis generated by the US NASA global Modeling and Assimilation Office provides traditional atmospheric products and chemical compositions for aerosols and greenhouse gases (Buchard et al 2017, Gelaro et al 2017). MERRA2 modeling and assimilation have allowed many advances in the understanding of atmospheric chemistry, ozone, and stratosphere processes (Randles et al 2017). Aerosol and ozone products have proved very helpful in the study of global air pollution, from the troposphere to the stratosphere (Che et al 2019, Wang et al 2021). Moreover, the tropopause aerosol layer phenomenon has been revealed by several studies utilizing MERRA2 reanalysis (Yuan et al 2019a, Lau and Kim 2022, Wu et al 2022b, Bresciani et al 2024). The MERRA2 has been employed to recognize CAs trend in the upper troposphere and lower stratosphere linked to the anticyclone, and the aerosol components including CAs, dust and sulfate have also been widely utilized to explore the formation, source, transport, and variability of tropopause aerosol layer with the validation of observation including CALIPSO and in-situ measurements (Yuan et al 2019a, Lau and Kim 2022, Wu et al 2022b). The vertical profiles of aerosol from MERRA2 have also been validated against CALIPSO satellite retrieval and in-situ observation (Mahnke et al 2021) as shown in figure S1. Therefore, the aerosol and meteorology-related products were thus used here to explore atmospheric dynamics influences on the TCAL.
The fifth generation European re-analysis (ERA5) was developed by the European Centre for Medium-Range Weather Forecasts to model data, physics, and core dynamics to provide a detailed description of the global atmosphere, land surface, and ocean waves (Hersbach et al 2020). ERA5 meteorological data were also used in this study.
2.3. Model output
Models of the sixth phase of the coupled model inter-comparison project (CMIP6) enable long-term simulations and various experiments in reconstructing the historical evolution and future projection of climate change and air pollution (Eyring et al 2016, Bauer et al 2020, Zanis et al 2020). CMPI6 model outputs were used to verify the occurrence of TCALs.
2.4. WMMEM
Weighted multi-model ensemble means (WMMEMs) were used in model bias correction to reduce errors associated with the inter-model spread of CMIP6 data as follows (Shen et al 2021):
where  is the output time series of each model,
  is the weighting of each model error relative to a MERRA2 reference, and
  is the corrected CMIP6 output.
2.5. NASA Langley Fu–Liou radiative transfer model
The NASA Langley Fu–Liou radiative transfer model computes broadband solar shortwave and thermal longwave profiles of down-welling and up-welling flux accounting for gas absorption, and absorption and scattering by aerosols and clouds (Balmes et al 2021, Natarajan et al 2012). It is a highly modified version of the original model developed by Fu and Liou (Fu and Liou 1993). Atmospheric profiles (1000–0.1 hPa) of pressure (hPa), temperature (K), water vapor (g g–1), and ozone (g g–1) from MERRA2, surface albedo and emission from MODIS, and AOD and vertical profiles (1000–0.1 hPa) of black carbon (BC) and organic carbon (OC) from MERRA2 were served as the key input parameters. The Langley Fu–Liou radiative transfer model was adopted for rough evaluation of radiative effect caused by TCAL.
3. Results
3.1. TCALs formation in Asia, South America, and Africa
Based on the formation mechanism of the ATAL, the two primary factors causing the appearance of a TCAL are atmospheric dynamics (deep convection, upper-tropospheric anticyclone) and surface pollutants. Strong deep convection -controlled regions characterized by heavy precipitation are shown in figure 1(a), mainly over the land and ocean in the region 30° N–30° S, with South and East Asia including India and China having the most severe anthropogenic pollution (figures 1(b) and S2). In contrast, South America, Africa, and Southeast Asia are covered mainly by forest and grassland with pollution arising mainly from natural wildfires (figures 1(c) and (d)). There is relatively little atmospheric pollution over the Caribbean and other ocean areas. As shown in figure 1(b), the forest and grassland over South America and Africa would emit large amount of CAs through wildfire burning, with the considerable anthropogenic emission for CAs over Asia. The CAs, as one of aerosol components, have been adopted to identify features of ATAL (Yuan et al 2019a, Lau and Kim 2022). The presence of upper-tropospheric CAs, as indicated by multiple data from MERRA2 reanalysis, CMIP6 simulation, and OMPS/LP satellite retrieval (figures 2 and 3), indicates the occurrence of TCALs over Asia, South America, and Africa. Deep convections are strong in these areas, and surface pollution levels are high (figures 1(e)–(m) and 4).

Figure 1. Accumulation regions of carbonaceous aerosols (CAs) and atmospheric dynamics. (a) Spatial distribution of the GPCP precipitation anomaly (mm d−1) between June–September and December–March, 2012–2021. (b)–(d) Spatial distributions of MERRA2 CAs AOD, MODIS land-cover type, and fire frequency, during 2012–2021. (e)–(f) Spatial distribution of CAs AOD over Asia during July–August, 2012–2021 (MERRA2 and CMIP6, respectively). (g) Spatial distribution of smoke AOD over Asia, during July–August, 2012–2021 (CALIPSO). (h)–(j) As for (e)–(g), but for South America during October–December, 2012–2021. (k)–(m) As for (e)–(g), but for Africa during November–December, 2012–2021. In (a) the color bar represents land cover as follows: 0, water; 1, evergreen needle-leaf forest; 2, evergreen broadleaf forest; 3, deciduous needle-leaf forest; 4, deciduous broadleaf forest; 5, mixed forest; 6, closed shrubland; 7, open shrubland; 8, woody savannah; 9, savannah; 10, grassland; 11, permanent wetland; 12, cropland; 13, urban and built-up; 14, cropland/natural vegetation mosaic; 15, snow and ice; and 16, barren or sparsely vegetated. The precipitation anomaly between boreal summer and winter represents the strong deep convection regions. AOD was adopted as a proxy for near-surface CA emission.
Download figure:
Standard image High-resolution image
Figure 2. The seasonal cycles of the upper-tropospheric carbonaceous aerosols layer (TCALs) and its influencing factors over Asia, South America, and Africa. The altitude-month cross sections of CAs mixing ratio (units: ppbm; from MERRA2) over (a) Asia (15° N–30° N), (b) South America (15° S–5° N), and (c) Africa (10° S–10° N), during 2012–2021. The monthly variations of regional mean OLR (units: W m–2; bars; from NOAA) and precipitation (Pre; units: mm; green dotted line; from GPCP) over (d) Asia, (e) South America, and (f) Africa. (g)–(i) The same as (d)–(f), but for CAs AOD (bars; from MERRA2) and CAs emission (units: kg m–2 s–1; green dotted line; from MERRA2).
Download figure:
Standard image High-resolution image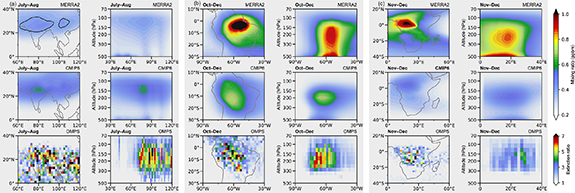
Figure 3. The upper-tropospheric carbonaceous aerosols layer (TCALs) over Asia, South America, and Africa. (a) Spatial distribution at 80–200 hPa and cross-section over 15° N–30° N for the CAs mixing ratio (ppbm; from MERRA2 and CMIP6) and aerosol extinction ratio (OMPS) over Asia, during July–August, 2012–2021. (b) Spatial distribution at 150–250 hPa and cross-section over 15° S–5° N for the CAs mixing ratio (ppbm; MERRA2 and CMIP6) and aerosol extinction ratio (OMPS) over South America, during October–December, 2012–2021. (c) Spatial distribution at 150–300 hPa and cross-section over 10° S–10° N for the CAs mixing ratio (ppbm; MERRA2 and CMIP6) and aerosol extinction ratio (OMPS) over Africa, during November–December, 2012–2021.
Download figure:
Standard image High-resolution image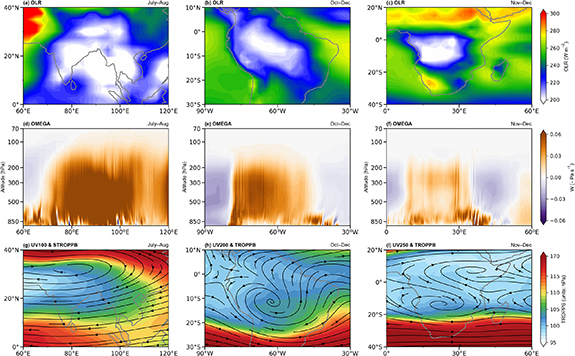
Figure 4. Atmospheric dynamic conditions contributed to TCALs formation over Asia, South America, and Africa, during 2012–2021. (a)–(c) Spatial distributions of OLR (W m−2; from NOAA) during July–August over Asia, October–December over South America, and November–December over Africa. (d)–(f) Cross-sections of vertical velocity (−Pa s−1; from ERA5) in July–August over 15° N–30° N (Asia), October–December over 15° S–5° N (South America), and November–December over 10° S–10° N (Africa). (g)–(i) As for (a)–(c), but for wind field (vectors; from ERA5) at 100 hPa (UV100), 200 hPa (UV200), and 250 hPa (UV250), and tropopause pressure based on a blended estimate (TROPPB; hPa, shaded) from MERRA2. OLR was selected as a proxy for deep convection.
Download figure:
Standard image High-resolution imageThe appearance of a TCAL follows a distinct seasonal pattern (figure 2). In Asia, the TCAL typically occurs during the strongest deep convection season, reaching its peak in July–August (figure 2(a)), as previously demonstrated (Yuan et al 2019a). However, during other seasons such as March–May, which are characterized by large biomass burning and weak deep convection, the TCAL phenomenon is absent over Asia, despite the presence of higher surface pollutant emissions compared to July–August (figures 2(d) and (g)). On the other hand, in South America, the TCAL is observed between October–March, when deep convection is strong and there is extensive surface emissions of CAs (figures 2(b), (e) and (h)). The intensity of the South American TCAL peaks during October–December due to variations in location and intensity of surface emission and deep convection (figures S3–S6). It is important to note that the TCAL does not occur during the weak deep convection season. The results in Africa are similar to those in South America. The African TCAL appears from November to March, which coincides with the deep convection season, rather than May–September (figures 2(c), (f) and (i)). During November–December, the African TCAL reaches its highest intensity. It should be mentioned that the peak intensities of the TCAL over South America and Africa do not align with the strongest deep convection season. In January–April, the region of accumulated CAs emissions over South America and Africa is not concentrated in the central area of strong deep convection (figures S4–S6). As a result, the deep convection fails to transport a substantial amount of CAs from the surface to the upper troposphere during this period. Therefore, this study will primarily focus on the seasons of July–August over Asia, October–December over South America, and November–December over Africa to explore the detailed characteristics of TCALs and the factors influencing their formation, despite these seasons not coinciding with the peak deep convection period (monsoon peak).
3.2. Divergent spatial features of TCALs
Spatial distributions and cross-sections of TCALs over Asia, South America, and Africa are shown in figure 3 for July–August, October–December, and November–December, respectively. Here, features of TCALs were examined mainly on the basis of MERRA2 and CMIP6 datasets, rather than the OMPS/LP dataset, owing to the low signal/noise ratio caused by cloud cover in the latter. Corresponding CAs AOD is shown in (figures 1(e)–(m)), and OLR, OMEGA, and the ∼200 hPa atmospheric circulation fields are shown in figure 4, indicating features of deep convention, vertical motion, and anticyclones (centers) in the upper troposphere.
Among these regions, South America exhibits the most intense surface CAs pollution, and Asia the least (figures 1(e)–(m)). There are two pollution centers in Asia: in India and China. During the strong deep convection period, upward vertical motion induced by deep convection carries surface pollutants into the upper troposphere and even the lower stratosphere (Yu et al 2017, Yuan et al 2019a). The highest TCAL intensity (concentration) was thus observed in South America, while intensity was weakest in Asia (based on MERRA2). TCAL concentrations in South America were 2–3 times those in Asia and Africa, consistent with patterns of surface pollution. Among the three regions, South America may not have the strongest deep convection activity, but it features the largest surface emission in comparison to the other two regions, which may play a dominant role in determining the intense intensity of TCAL. In order to quantitatively assess the impact of surface emission and deep convection on TCAL formation, further model simulations will be conducted. However, TCAL altitude was highest in Asia, centered at ∼120 hPa, followed by South America (∼200 hPa), and Africa (∼220 hPa). This is due to the Himalayas and the Tibetan Plateau causing the strongest deep convection in South Asia (Boos and Kuang 2010, Zhang et al 2012) with the upward vertical motion and upwelling velocities exceeding −0.06 Pa s−1 in the core ascent zone. Deep convections in the other areas are relatively weak, even negligible in Africa relative to Asia. It follows that updrafts account for the suspended height of TCALs, and tropopause height alone does not determine the rising altitude of the TCAL (figures 4(g)–(i)).
Another interesting distinction between TCALs in different areas is their three-dimensional shape. The TCAL in Asia has the widest spatial coverage, spanning from the Iranian Plateau to eastern China through an extended upper-tropospheric anticyclonic circulation spanning >60° of longitude. This circulation is strengthened by the heating effect of the Himalayas and the Tibetan Plateau, as documented by Wu et al (2015). In contrast, anticyclonic circulation over South America and Africa is relatively weak, covering only ∼30° of longitude. This acts as a barrier, constraining the TCAL to a limited spread, mainly over central South America and Central Africa. Of the two TCAL centers in Asia, the stronger is over the Tibetan Plateau and the weaker is over southwest China, due to anthropogenic pollution (the primary emission source) being centered over small areas of dense population in India and western China and producing two narrow vertical transport conduits, consistent with Lau et al (2018). In comparison, surface pollutants in South America and Africa are derived mainly from widespread wildfires across forest and grassland, resulting in one broad vertical transport conduit and a single peak TCAL center. Overall, TCALs in Asia, South America, and Africa thus exhibit divergent spatial features owing to the combined effects of atmospheric dynamics and surface pollutant emissions.
3.3. Divergent radiative effect of TCALs
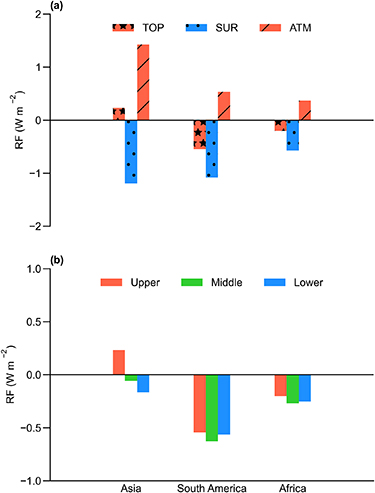
The remarkable features of the TCALs result in divergent radiative effects. Based on MERRA2 reanalysis, we evaluated radiative effect during clear sky induced by CAs in the upper troposphere (TCAL) in Asia, South America, and Africa utilizing the Langley Fu–Liou radiative transfer model. As shown in figure 5(a), TCAL over Asia have warming effects on the climate system of +0.23 W m−2 at the top of the atmosphere, whereas there are cooling effects of −0.54 and −0.20 W m−2 over South America and Africa, respectively. These differences are related to CA composition, which includes BC and OC; the former has a high light-absorption capacity and the latter a predominantly light-scattering capacity. The relative CA contents of BC and OC determine RF magnitude and sign. The amount of BC in TCAL over Asia (AOD 0.0031) was higher than that in the South American (AOD 0.0017) and African (AOD 0.001) TCALs. The OC content (AOD 0.004) over Asia was roughly equivalent to the BC content, but it was much higher over South America (AOD 0.009) and Africa (AOD 0.004). Therefore, TCAL BC warming effects over South America and Africa were offset by OC cooling effects. In contrast to results at the top of the atmosphere, TCAL caused negative radiative effect at the surface for all three regions owing to absorption and scattering of sunlight by CA leading to less shortwave radiation reaching the surface. Among three regions, the surface radiative effect of TCAL was lowest in Africa. In the atmosphere, Asian TCAL had the strongest warming effect because of their higher BC contents. Consistent with the results of Gao et al (2023), our simulation indicated a positive Asian TCAL radiative effect at the top of the atmosphere rather than the negative values reported by Vernier et al (2015). We found that CA-induced warming effects were stronger than those caused by scattering and absorbing aerosols (total aerosol components; +0.15 W m−2; Gao et al 2023). These results thus reflect the importance of TCAL in climate systems relative to other types of aerosol. Moreover, we note that larger amounts of CAs will likely be released to the atmosphere by more frequent and intense wildfires caused by favorable meteorological conditions under global warming (Pu et al 2021, Xie et al 2022, Huang et al 2023, Zheng et al 2023). More attention should thus be paid to CAs or smoke from wildfires to evaluate their source, transport, radiation, and climate effects.
Figure 5. Radiative effect induced by TCALs. (a) The radiative effect (RE, units: W m−2) at the top of the atmosphere (TOP), at the surface (SUR), and in the atmosphere (ATM) induced by TCALs over Asia, South America, and Africa. (b) The RE at the top of the atmosphere induced by equivalent CAs in the upper troposphere (upper; red bars), middle troposphere (middle; green bars), and lower troposphere (lower; blue bars). TCALs CAs mixing ratio (ppbm; CMPI6) over Asia, South America, and Africa were processed for the regions of 15°–30° N and 60°–120° E during July–August over Asia; 15° S–5° N and 70°–35° W during October–December over South America; and 10° S–10° N and 0°–40° E during November–December over Africa.
Download figure:
Standard image High-resolution image
The intensity of solar shortwave radiation varies with altitude, leading to diverse radiative effect of equivalent CA concentrations at different altitudes (figure S7). The aerosol usually distributed in the lower troposphere, this study however found it can also be effectively transported to the upper troposphere. To highlight the importance of TCAL in the upper troposphere and emphasize the differences in radiative effects of TCAL at different altitudes, we then examined equivalent CAs at three altitude levels: upper troposphere (300–100 hPa), middle troposphere (600–400 hPa), and lower troposphere (900–700 hPa) (figure 5(b)). In Asia, the equivalent CA levels changed from warming to cooling effects with decreasing altitude, indicating the relative importance of competitive scattering and absorption of radiation by BC and OC at different altitudes, which was consistent with the conclusions from Ban-Weiss et al (2012). However, in South America and Africa, equivalent CAs at different altitudes exhibited consistently negative radiative effects, but with different intensities. These changes from warming to cooling, and radiative effect intensity, result from competition between BC absorption and OC scattering (figure S7). However, when only one type of aerosol (BC or OC) is considered, radiative effect increases with altitude because of the stronger solar shortwave radiation at higher altitudes, thus highlighting the importance of TCALs to the climate system.
4. Discussion
This study of the TCAL phenomenon in South America and Africa followed the discovery of the ATAL (Vernier et al 2011) and involved multiple data sources including MERRA2 reanalysis, CMIP6 simulations, and OMPS/LP satellite retrieval. Our findings highlight the critical role of atmospheric dynamics and surface pollutant emissions in the formation of TCALs, which together cause their divergent spatial features and drive their evolution across these three areas. We emphasize the importance of including natural emissions in future TCAL studies owing to the increasing frequency and intensity of wildfires under a global warming scenario (Abram et al 2021, You and Xu 2022, Huang et al 2023). Although our results are robust, the inconsistency in TCAL seasonality among the OMPS/LP, MERRA2, and CMIP6 datasets indicates uncertainties due to imperfections in cloud removal in satellite retrieval and limitations in the modeling of stratospheric processes. Moreover, our results are mainly based on the MERRA2 reanalysis, which has been widely used to recognize the aerosol signals from troposphere to stratosphere. Especially, it has been employed to reveal the tropopause aerosol layer successfully, reflecting its good performance in the study of TCAL. However, further in-situ observations are required for improvement of understanding of TCALs. Overall, this study provides new insights into TCALs and should aid further study of interactions between aerosols and atmospheric dynamics, especially concerning their impact on stratospheric chemistry and climate change (Bian et al 2020, Salawitch and McBride 2022, Solomon et al 2022).
5. Conclusions
This study aimed to investigate the TCAL phenomenon by analysis of CAs using multiple data sources including MERRA2 reanalysis, CMIP6 model outputs, and OMPS/LP satellite retrieval. Results indicate that TCALs occur not only in Asia, but also in South America and Africa. Atmospheric dynamics and surface pollutant emissions are the two prime factors involved in TCAL formation. The TCAL in Asia peaks during July–August and has the highest altitude and widest spatial coverage due to the effects of strongest deep convection, updrafts, and a largest anticyclonic system in the upper troposphere, all of which may be caused by strong deep convection. Whereas, TCALs in South America and Africa peak during October–December and November–December, respectively, influenced by varying locations and intensities of surface emission and deep convection. The intensity was highest in South America maybe due to heaviest surface CAs emissions. In Asia, anthropogenic pollution is concentrated over small areas of dense population in India and western China, producing two narrow vertical transport conduits and two TCAL centers. In contrast, surface pollutants in South America and Africa are derived mainly from widespread wildfires across forest and grassland, resulting in a broad vertical transport conduit and single TCAL peak centers. The divergent features of TCALs among the three regions cause distinct radiative effect. Those at the top of the atmosphere cause warming over Asia (+0.23 W m−2) and cooling over South America (−0.54 W m−2) and Africa (−0.20 W m−2). These opposing radiative effect result from the different CA compositions of anthropogenic and natural emissions, where the relative amounts of absorbing BC and scattering OC determine the magnitude and sign of the radiative effect. In addition, equivalent CAs at higher altitudes induce larger radiative effect. These results indicate the important divergent climate effects of TCALs over Asia, South America, and Africa.
Acknowledgments
This research was supported by the National Key Research and Development Program of China (2019YFA0606801), the National Science Fund for Distinguished Young Scholars (42025102), the National Natural Science Foundation of China (42375068), the Natural Science Funds of Gansu Province, China (22JR5RA418, 21ZDKA0017), the Fundamental Research Funds for the Central Universities (lzujbky-2022-it05), and China Postdoctoral Science Foundation (2023M731456). The calculation was supported by the Supercomputing Center of Lanzhou University.
Data availability statement
The aerosol extinction ratio from OMPS/LP aboard the S-NPP can be retrieved from https://doi.org/10.5067/CX2B9NW6FI27. The MERRA2 reanalysis is available at https://disc.gsfc.nasa.gov/datasets?project=MERRA-2. The ERA5 reanalysis is obtained from https://doi.org/10.24381/cds.6860a573. The CMIP6 models' outputs can be found at https://esgf-node.llnl.gov/search/cmip6/. The CALIPSO satellite retrieval is available at https://opendap.larc.nasa.gov/opendap/CALIPSO/LID_L3_Tropospheric_APro_CloudFree-Standard-V4-20/contents.html. The fire count can be downloaded from the Fire Information for Resource Management System (FIRMS; https://firms.modaps.eosdis.nasa.gov/download/create.php). The land cover from MODIS is available at https://ladsweb.modaps.eosdis.nasa.gov/search/order/1/MCD12C1–6. The OLR from NOAA and precipitation from GPCP can be obtained from https://psl.noaa.gov/data/gridded/data.olrcdr.interp.html and https://psl.noaa.gov/data/gridded/data.gpcp.html, respectively. The NASA Langley Fu-Liou radiative transfer model can be accessed from https://cloudsgate2.larc.nasa.gov/cgi-bin/fuliou/lflcode/accesslfl.cgi after registration. All data used in this paper are available at the time of submission. Figures in this manuscript were made with python version 3.9 and this software is available from www.python.org/.
All data that support the findings of this study are included within the article (and any supplementary files).
Conflict of interest
The authors declare no conflicts of interest relevant to this study.
Supplementary data (6.3 MB DOCX)