

Abstract
The Brazilian Atlantic Forest (AF) covers 13% of Brazil but retains only 26% of its original forest area. Utilizing a Morphological Spatial Pattern Analysis (MSPA), we generated 30 m spatial resolution fragmentation maps for old-growth and secondary forests across the AF. We quantified landscape fragmentation patterns and carbon (C) dynamics over 35 years using MapBiomas data between the years 1985 and 2020. We found that from 1985 to 2020 the forest suffered continuous fragmentation, losing core (nuclei forest fragments) and bridge (areas that connect different core areas) components of the landscape. About 87.5% (290 468.4 km2) of the remaining forest lacked core areas, with bridges (38.0%) and islets (small, isolated fragments) (35.4%) being predominant. Secondary forests (1986–2020) accounted for 99 450.5 km2 and played a significant role in fragmentation pattern, constituting 44.9% of the areas affected by edge effects (perforation, edge, bridge, and loop), 53.7% of islets, and comprising only 1.4% of core forest. Additionally, regeneration by secondary forests contributed to all fragmentation classes in 2020. Even with the regrowth of forests, the total forested area in the biome did not increase between 1985 and 2020. Deforestation emissions reached 818 Tg CO2, closely paralleled by edge effects emissions at 810 Tg CO2, highlighting a remarkable parity in C emissions between the two processes. Despite slow changes, AF biome continues to lose its C stocks. We estimated that around 1.96 million hectares (19 600 km2) of regenerated forest would be required to offset the historical C emissions over the analysed period. Hence, MSPA can support landscape monitoring, optimizing natural or active forest regeneration to reduce fragmentation and enhance C stocks. Our study's findings are critical for guiding land-use policies focusing on minimizing emissions, promoting forest regrowth, and monitoring its permanence. This study offers biome scale, spatially explicit information, critical for AF conservation and management.
Export citation and abstract BibTeX RIS

Original content from this work may be used under the terms of the Creative Commons Attribution 4.0 license. Any further distribution of this work must maintain attribution to the author(s) and the title of the work, journal citation and DOI.
1. Introduction
The main contributors to fragmentation of remaining forests globally are deforestation and degradation (Taubert et al 2018). Understanding landscape structure overtime and its impacts on carbon (C) stocks is critical for the sustainable management of tropical forests (Turner and Gardner 2015, McDowell et al 2020) The patch–corridor–matrix model (Forman 1995) efficiently characterizes landscape spatial structure. It serves as a foundational framework for studying ecological processes over space and time. (Wiens 1995, Schröder and Seppelt 2006, Turner and Cardille 2007, Haddad et al 2015).
The Brazilian Atlantic Forest (AF), recognized as a significant biodiversity hotspot (Myers et al 2000) and currently an area of global restoration priority (Strassburg et al 2019), has a history of extensive fragmentation. Studies have utilized metrics such as fragment size, edge area, and isolation-related approaches to characterize fragmentation status (Vos et al 2001, Urban 2005). Additionally, landscape metrics have been employed to assess AF fragmentation by analysing the spatial distribution of forest remnants at biome scale (Ribeiro et al 2009, Rezende et al 2018, Rosa et al 2021).
However, to understand how changes in landscape configuration affect the integrity of remaining forests and their capacity to maintain ecosystem services, such as C storage, biodiversity and water cycle, time continuous fragmentation assessment must necessarily be associated with deforestation monitoring information.
The latest deforestation report for the AF showed that over 300 km2 (30 012 ha) of forests were lost in 2022. In that year alone, there were 7905 verified deforestation alerts, marking a significant increase of 53.7% in relation to 2021. Alarmingly, 99.8% of these alerts exhibited signs of illegality. The 'Mata Atlântica em Pé' operation monitored 1279 alerts in 17 states, leading to fines totalling over R$ 48 million (MapBiomas 2023).
Furthermore, recent proposed legislative changes, such as MP 1150/2022, pose an additional risk by relaxing restrictions on the removal of native vegetation, potentially bypassing crucial environmental assessments, and ecological compensation requirements. This could undermine efforts that resulted in a sharp decrease in deforestation rates in the past decades, from an average loss of 1000 km2 per year during the 1990s to a reduction below 120 km2 by 2018 (SOS Mata Atlântica 2022). During the same timeframe, there was a significant rise in regeneration rates (Rosa et al 2021), especially post-2006 with the enactment of the AF Law (11.428/2006) and later with the New Forest Code (12.651/2012) introducing the Rural Environmental Registry (CAR). The CAR is a mandatory registry that obliges the disclosure of environmental data from private rural properties, serving as a tool for guiding vegetation preservation and restoration initiatives (da Silva et al 2023).
The current decade, referred by the United Nations as the restoration decade (Gnacadja and Vidal 2022), emphasizes the importance of regeneration of secondary forests, mainly in the tropics, for increasing forest C stocks and enhancing ecosystem services provision (Chazdon et al 2016, 2019, Heinrich et al 2021, 2023). Despite important legislative measures aiming the protection of remaining forests, the AF continues to be degraded and deforested (Mohebalian et al 2022), resulting in reduced connectivity and ecosystem functionality in this biodiversity hotspot (Faria et al 2023).
To support the efforts required for increasing the integrity of AF biome in storing C and providing other ecosystem services, the aim of this study was to evaluate the dynamics of forest fragmentation, accounting for the contribution of secondary forest regrowth on the fragmentation status, and to quantify the impact of deforestation, degradation, and forest regrowth on the C budget of the fragmented AF biome. Given the extensive fragmentation in the AF, surpassing that of the Amazon, and considering significant C loss solely caused by deforestation in the Amazon, our study predicts that the combined effects of edge degradation and deforestation in the AF will markedly impact C stocks, potentially outweighing C removals from regenerating forests.
This analysis can provide valuable insights for supporting decision-makers and stakeholders on the elaboration of better choices for effective national and regional landscape management initiatives, focusing on the conservation of biodiversity and ecosystem services, contributing to the ambitious national and global restoration goals of 350 million hectares of deforested and degraded areas by 2030.
2. Methods
2.1. Categorizing landscape fragmentation
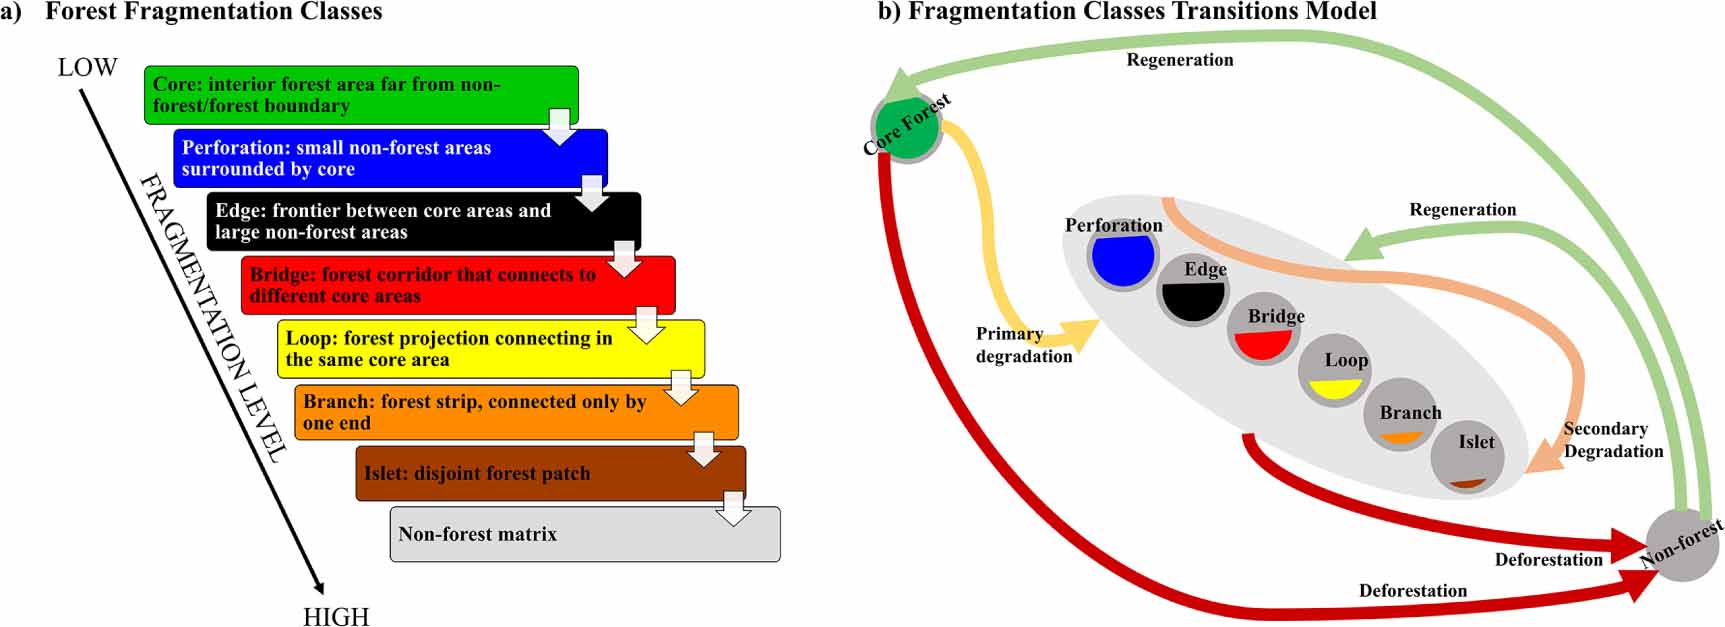
We used MapBiomas forest maps to assess fragmentation status of AF landscape in 1985 and 2020 at a 30 meter spatial resolution. We categorized forest landscape into seven fragmentation classes (Vogt et al 2007, Soille and Vogt 2009, Riitters and Vogt 2023): core, perforation, edge, bridge, loop, branch, and islet, ranging from lowest to highest fragmentation level (figure 1(a)). Core is the interior forest area excluding the perimeter, islets are small, disjointed forest patches, edges constitute the external forest perimeter, and perforation refers to the internal forest perimeter. The connection classes include bridge, loop, and branch. Bridges connect different core areas, loops connect the same core area, and branches are forest areas linked at one end to perforation, edge, bridge, or loop.

Figure 1. Main fragmentation classes derived from.Soille and Vogt (2009). (b) Conceptual representation of forest transitional pathways leading to forest change process over time. The color ramp to represent fragmentation classes aligns with the standard set by Soille and Vogt (2009).
Download figure:
Standard image High-resolution imageAfter define fragmentation classes, we developed a temporal pathway outlining forest processes. Shifting from core to more fragmented classes indicate primary degradation, while non-core classes into higher fragmentation indicate secondary degradation. Any class transitioning to non-forest is deforestation, while the opposite trend, regeneration. 'Unchanged' forests remained in the same class over time. (figure 1(b)).
2.2. Study area
Located in a complex landscape formed by heterogeneous environmental conditions and rich forest composition (figure 2). This region is home to over 72% of the Brazilian population and three major South American urban hubs, contributing with approximately 70% of the Brazilian GDP (SOS Mata Atlântica 2022). According to the MapBiomas, there were 337 663 km2 of AF cover in 1985 (MapBiomas 2023). Most remaining forests exist as fragments, often smaller than 1 km2, and occasionally isolated. Large forest patches persist in areas historically unsuitable for agriculture and human habitation (Ranta et al 1998, Ribeiro et al 2009).

Figure 2. Brazilian Atlantic Forest along with its distinct forest formations. Forest types include Open Rainforest, Dense Rainforest, Araucaria-Mixed Rainforest, Seasonally Dry Semideciduous Forest, Seasonally Dry Deciduous Forest, and Ecotone regions (areas of ecological transition, occur between different vegetation types and pioneering formations like Restingas, Savannas, Steppes, Inselbergs). Source data for forest formations: IBGE 3rd edition (2004).
Download figure:
Standard image High-resolution image2.3. Inputs preparation
We used MapBiomas Collection 6.0 (https://brasil.mapbiomas.org/en/downloads/) Land-use and Land-cover data from 1985 and 2020 (MapBiomas 2023). Based on Silva-Junior et al (2020b) method, we mapped the extent of secondary forests (1986–2020) (https://github.com/celsohlsj/gee_brazil_sv). We then produced maps depicting the old-growth and secondary forests cover between the years 1985 and 2020.
We considered secondary forests as forest pixels that were replaced by anthropic classes (e.g. agriculture and pasture) and then classified again as forest during the period 1986–2020. Old-growth forests were defined as forests that remained in the forest class throughout the time series. Consequently, we created three binary maps: one representing the forest in 1985, another for 2020, both inclusive of old-growth and secondary forests. The third map was built using the map algebra approach by removing the standing secondary forests accumulated between 1986 and 2020 in the 2020 forest map (figure 3, step 1). This approach allowed us to evaluate the impact of secondary forests on fragmentation metrics and connectivity within the AF landscape.
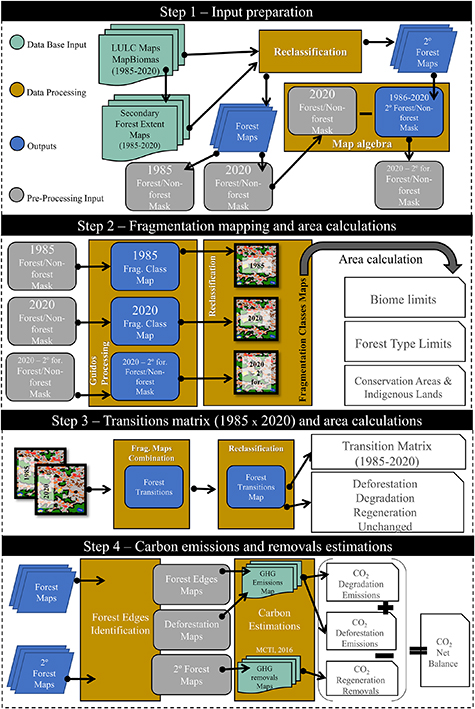
Figure 3. Workflow diagram of method steps. Acronyms/abbreviations: Frag. = fragmentation; GHG = Greenhouse gas emissions; LULC = Land use and land cover.
Download figure:
Standard image High-resolution image2.4. Fragmentation mapping and area calculations
To access fragmentation across the entire AF biome boundary, we classified the binary maps with GUIDOS Toolbox MSPA program (Soille and Vogt 2009, Vogt and Riitters 2017). This method utilizes mathematical morphological operators to describe image component connections and geometry. The software automatically assigned each pixel to one of seven exclusive fragmentation types, as depicted in figure 1(a). The MSPA identifies fragmentation classes based on the "edge width," measured from the forest's edge to its interior, in pixels. This determines the spatial configuration of the other classes across the landscape. Based on previous studies, we adopted a 300 meter edge width 9 in the MSPA to account for significant edge effects, such as increased tree mortality, forest disturbance, wind turbulence, altered tree recruitment, reduced canopy height, and forest fires in the understory (Broadbent et al 2008, Laurance et al 2011, Numata et al 2011, 2017).
After producing maps containing the fragmentation classes, we calculated the area of each class by forest types (IBGE 2004), protected areas, defined as Strict Use: designated only for biodiversity conservation; Sustainable Use: allows limited resource exploration while designating biodiversity conservation. Furthermore, we analysed these conservation units by jurisdiction responsible for protecting these areas (municipal, state, or federal) (MMA 2023). We also accounted for Regularised Indigenous Lands (FUNAI 2023) (figure 3, step 2).
2.5. Fragmentation class transition matrix (1985-2020), mapping forest changes over time and area calculations
Based on the 1985 and 2020 fragmentation maps with old-growth and secondary forests, we generate a transition map using mapping algebra functions. This process enabled the pixel-by-pixel evaluation of the fragmentation classes and the quantification of their respective areas (figure 3, step 3).
We use the direct matrix approach (Bucki et al 2012) to identify and map dynamic degradation, tracking transitions between fragmentation classes over time. This approach uses fragmentation to access degradation processes, revealing typical paths of change, providing information about forest conditions.
2.6. Estimates of forest carbon emissions and removals
We applied the method used by Silva-Junior et al (2020a) to identify forest edges using all maps from 1986 to 2020. 34 forest edge maps were created, with a 120 meter edge width 10 . Using annual MapBiomas maps, changes from forest to non-forest cover since 1986 were identified, enabling deforestation mapping since 1986 (figure 3, step 4) (Silva-Junior et al 2020b, Silveira et al 2022) (https://github.com/celsohlsj/amazonia_deforestation).
Our study showed at the biome-scale estimates of C emissions and removals using the map from Brazil's 3rd Greenhouse Gas Emissions Report (MCTI 2016) processed by Google Earth Engine platform. These calculations accounted for emissions from forest edges, deforested areas, and removals from regenerating secondary forests.
3. Results
3.1. Forest fragmentation extent
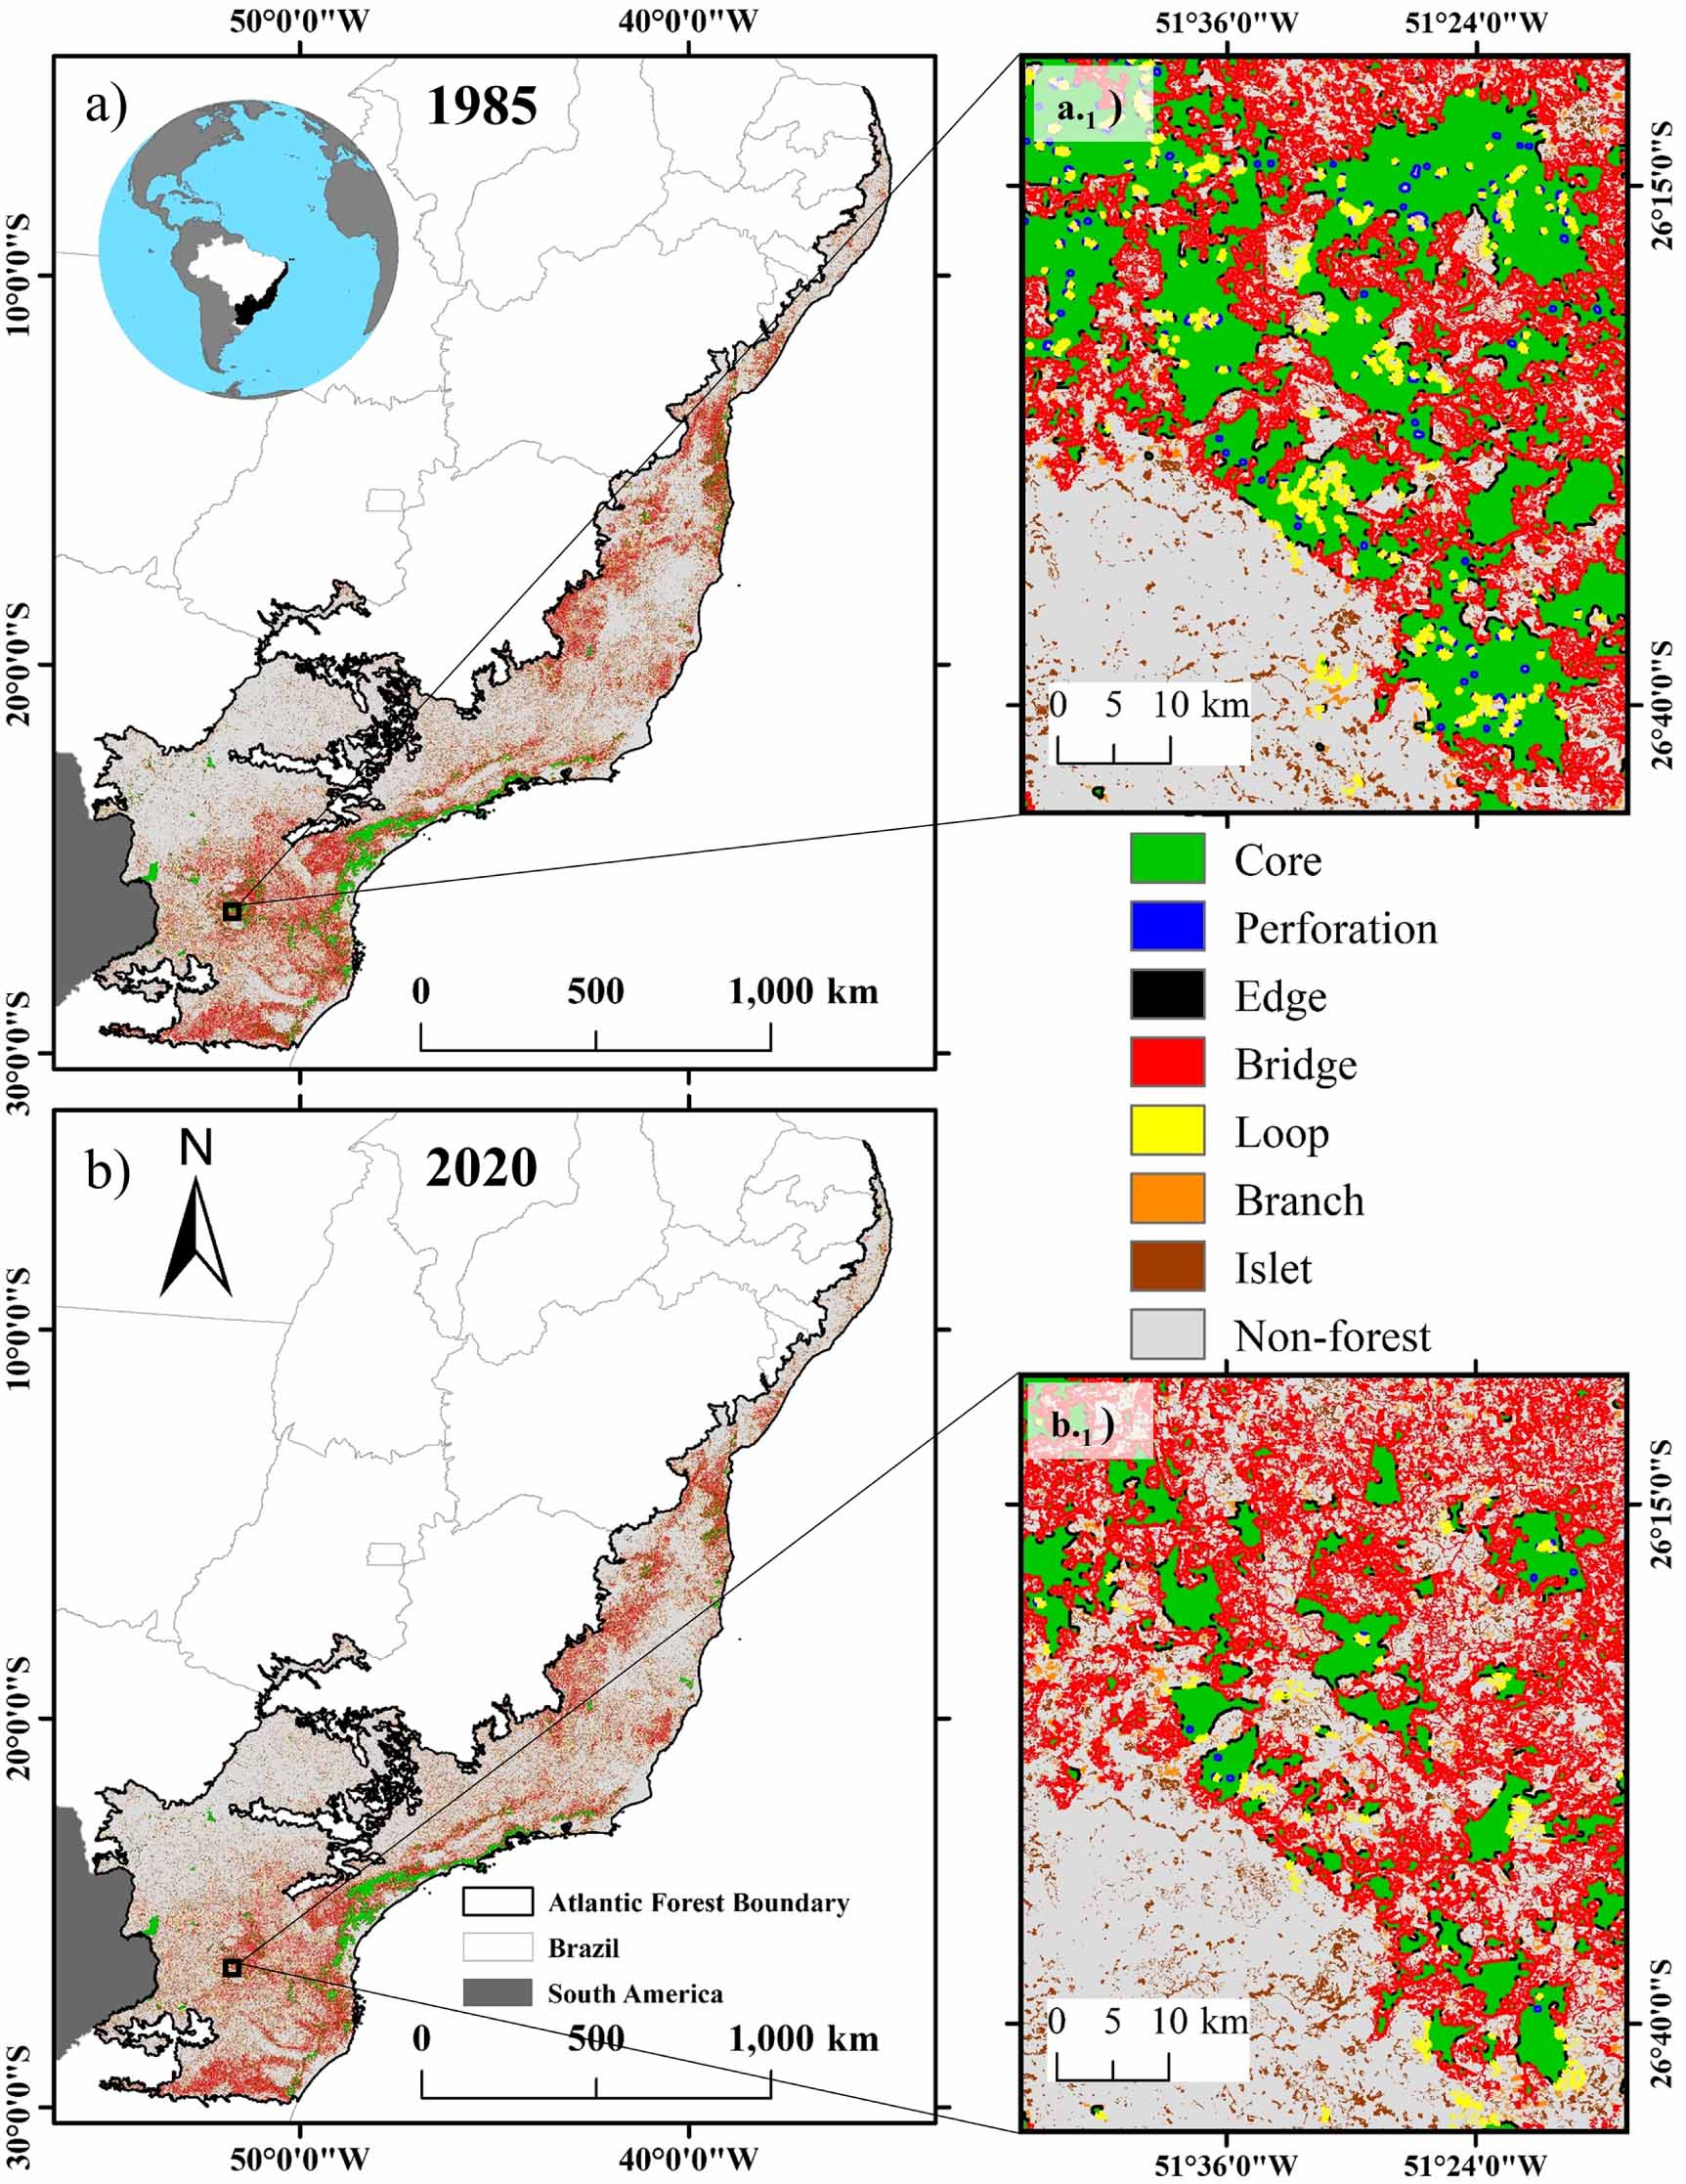
In 1985, only 14% (47 195.4 km2) of the remaining forests had core areas. These areas were reduced to 12.5% (40 436.7 km2) by 2020 (see figure 4 for a visual depiction of the forest landscape). The predominant categories in both years remained bridge and islet, making up 72.5% (244 684.8 km2) of the remaining forest in 1985 and 73.5% (238 004.4 km2) in 2020, respectively. The remaining forests, categorized as non-core areas (perforation, edge, loop, and branch), collectively comprised 13.6% (45 783.6 km2) of the remaining forest area in 1985, with a minor rise to 14% in 2020 (45 374.0 km2) (figure 4, table 1).
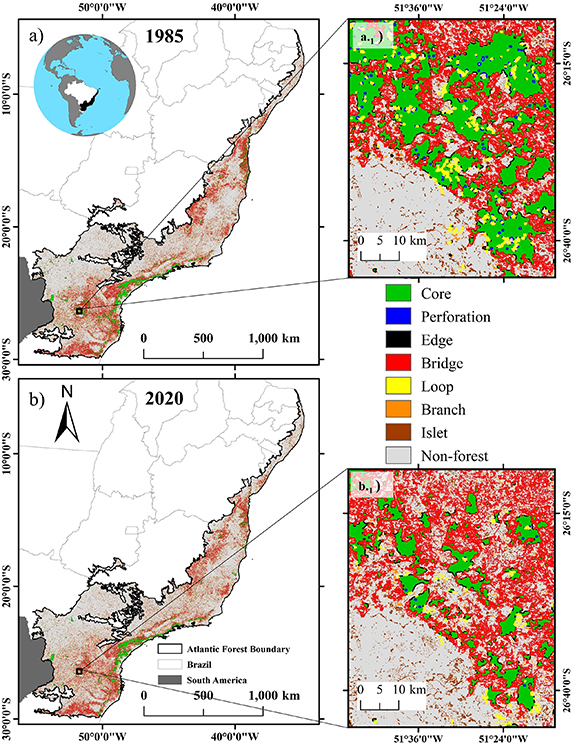
Figure 4. Brazilian Atlantic Forest (AF) map classified into forest fragmentation classes: core, perforation, edge, bridge, loop, branch and islet (high to low connectivity). (a) Fragmentation map of AF in 1985, (a.1) fixed zoom in black square showing forest remnants in 1985. (b) Fragmentation map of AF in 2020, (b.1) same fixed zoom area in a black square, evidencing forest landscape change in fragmentation classes 2020.
Download figure:
Standard image High-resolution imageTable 1. Atlantic Forest fragmentation classes for: 1985, 2020, and secondary forest from 1986 to 2020. Percentage distribution of fragmentation classes and the total forest area (km2).
| 1985 | 2020 | Secondary forest (1986–2020) | |||||
|---|---|---|---|---|---|---|---|
| Fragmentation class | km2 | % of forest | km2 | % of forest | km2 | % of secondary forest regarding total | % of secondary forest contribution to 2020's fragmentation classes |
| Core | 47 195.4 | 14.0 | 40 436.7 | 12.5 | 1,419.5 | 1.4 | 3.5 |
| Perforation | 1,091.2 | 0.3 | 923.1 | 0.3 | 53.7 | 0.1 | 5.8 |
| Edge | 11 979.0 | 3.5 | 10 751.7 | 3.3 | 1,118.3 | 1.1 | 10.4 |
| Bridge | 137 829.3 | 40.8 | 123 477.0 | 38.1 | 32 014.4 | 32.2 | 25.9 |
| Loop | 16 190.0 | 4.8 | 15 735.3 | 4.9 | 4,503.2 | 4.5 | 28.6 |
| Branch | 16 523.4 | 4.9 | 17 963.9 | 5.5 | 6,980.8 | 7.0 | 38.9 |
| Islet | 106 855.5 | 31.6 | 114 527.4 | 35.4 | 53 360.5 | 53.7 | 46.6 |
| Total forest | 337 663.8 | 323 815.1 | 99 450.5 | ||||
Between 1986 and 2020, secondary AF area accounted for 99 450.5 km2. The core class represented 1.4% of the forest, whereas bridge and islet classes dominated with 88.8%, leaving 12.7% for the remaining classes (table 1). Secondary forests contributed to all fragmentation classes (table 1).
3.2. Dynamics of forest fragments loss and recovery (1985-2020)
Tables 2(a) and (b) detail pixel-based transitions from 1985 to 2020. Core forest areas often shift to the bridge class, while the bridge class tend to shift to deforestation or to transition to the islet class. Bridge class emerges as a crucial transition target, transitioning to classes like perforation and edge, as well as classes like loop and branch (table 2(a)). The islet class exhibits limited potential for transitioning to non-forest compared to other fragmentation classes. Similarly, the background class frequently transitions to the islet class over other fragmentation classes (table 2(a)).
Table 2. Transition matrices quantifying shifts in the Atlantic Forest area across fragmentation classes over the period from 1985 to 2020. The transitions are provided in both percentage values (a), and corresponding area in square kilometres (km2) (b). The values in bold remained within the same fragmentation class in the period.
| Area in 2020 (%) | |||||||||
|---|---|---|---|---|---|---|---|---|---|
| (a) | Core | Perforation | Edge | Bridge | Loop | Branch | Islet | Background | |
| Area in 1985 (%) | Core | 66.4 | 0.7 | 3.0 | 17.9 | 2.0 | 0.7 | 0.8 | 8.4 |
| Perforation | 32.7 | 17.2 | 6.6 | 23.2 | 10.7 | 0.9 | 0.3 | 8.4 | |
| Edge | 7.6 | 0.7 | 31.5 | 30.9 | 7.0 | 3.1 | 3.5 | 15.6 | |
| Bridge | 4.3 | 0.1 | 2.5 | 54.2 | 3.1 | 4.2 | 7.2 | 24.4 | |
| Loop | 6.0 | 0.7 | 5.4 | 26.7 | 17.0 | 4.7 | 15.9 | 23.6 | |
| Branch | 0.3 | 0.0 | 1.3 | 27.7 | 4.5 | 20.6 | 16.5 | 29.1 | |
| Islet | 0.1 | 0.0 | 0.3 | 7.1 | 2.7 | 2.7 | 55.2 | 31.9 | |
| Background | 0.1 | 0.0 | 0.1 | 2.3 | 0.4 | 0.5 | 4.6 | 92.1 | |
| Area in 2020 (km2) | |||||||||
| (b) | Core | Perforation | Edge | Bridge | Loop | Branch | Islet | Background | |
| Area in 1985 (km2) | Core | 31 338.1 | 337.6 | 1,420.0 | 8,449.1 | 952.2 | 323.8 | 387.7 | 3,987.0 |
| Perforation | 356.5 | 187.7 | 71.6 | 253.5 | 116.9 | 9.9 | 3.4 | 91.7 | |
| Edge | 909.3 | 79.3 | 3,772.0 | 3,707.2 | 841.9 | 375.0 | 423.1 | 1,871.2 | |
| Bridge | 5,907.7 | 168.3 | 3,428.8 | 74 762.5 | 4,319.0 | 5,791.5 | 9,861.7 | 33 589.5 | |
| Loop | 979.0 | 116.5 | 873.2 | 4,326.0 | 2,746.1 | 761.9 | 2,572.7 | 3,814.6 | |
| Branch | 43.7 | 4.8 | 210.5 | 4,580.0 | 745.6 | 3,396.3 | 2,734.4 | 4,808.1 | |
| Islet | 134.6 | 0.2 | 292.3 | 7,608.8 | 2,896.3 | 2,909.0 | 58 931.4 | 34 082.8 | |
| Background | 767.7 | 28.7 | 683.4 | 19 789.8 | 3,117.2 | 4,396.4 | 39 612.8 | 796 136.2 | |
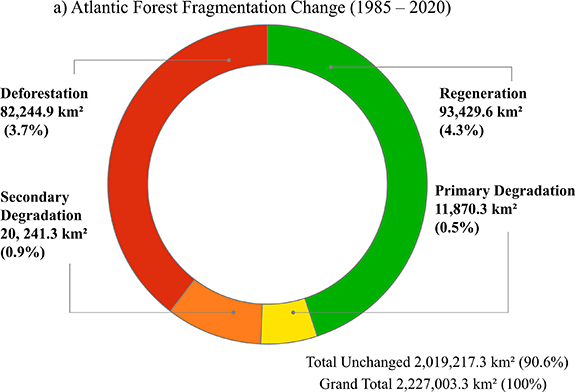
We analysed forest change processes using fragmentation class transitions: primary degradation, secondary degradation, deforestation, regeneration, and unchanged areas (figure 5(a)). Additionally, we mapped forest change across the entire biome extent (figure 5(b)). Of the forest transitions occurring in about 10% of the total biome extent (20 227 003.3 km2), regeneration covered the largest extent, corresponding to 4.3%, followed by deforestation at 3.7%, secondary degradation at 0.9%, and primary degradation at 0.5% (figure 5(a)).
Download figure:
Standard image High-resolution image
Figure 5. (a) Atlantic Forest Chart proportions of forest change areas. Values are reported in both percentage and the corresponding area in square kilometres (km2), relative to the total biome area. (b) Atlantic Forest change map from 1986 to 2020, displaying categories derived from the transition matrix. These categories encompass Non-Forest, Unchanged, Regeneration, Primary Degradation, Secondary Degradation, and Deforestation. The map includes zoomed-in red squares that highlight distinct dynamics of the forest landscape: Frontiers of Regeneration (b.1), Fragmentation Frontiers dominated by deforestation and secondary degradation (b.2), Stability Frontiers dominated by areas of no change with minor instances of deforestation and regeneration (5(b.3)), Fragmentation Frontiers dominated by deforestation and primary degradation (b.4).
Download figure:
Standard image High-resolution imageObserved transition classes vary across the biome, showing degradation and deforestation frontiers, regeneration frontiers, and stable frontiers in different AF locations (figures 5(b1)–(b4)). Examples include forest regeneration areas (figure 5(b.1)), consolidated secondary degradation and deforestation areas (figure 5(b.2)), small-scale deforestation and primary degradation within an unchanged forest matrix (figure 5(b.3)), and primary degradation areas with secondary degradation and deforestation (figure 5(b.4)).
3.3. Characterizing fragmentation patterns across forest types and protected areas
We assessed fragmentation classes in strict use, sustainable use, and indigenous conservation units. Strict use mainly includes core, edge, and bridge forests. Sustainable use and indigenous lands contain core, bridge, and islet classes. Regularized Indigenous Lands preserve more core forest (42.9%) than Sustainable Use Conservation Units (26%) (table 3(a)). The analysis of protected areas showed that federal conservation units had 47.1% of core forests, 27.9% of bridges, and 9.1% of islets. State conservation units exhibit 38.8% of core forests, 36.5% of bridges, and 11.5% of islets. Municipal conservation units had 44.2% of bridges, 22.6% of core forests, and 16.6% of islets (table 3(b)).
Table 3. (a) Total forest fragmentation classes for 1985, 2020 and secondary forest (1986–2020) separated by environmental conservation areas. Strict Use: designated only for biodiversity conservation; Sustainable Use: allows limited resource exploration while designating biodiversity conservation; Indigenous Lands: protected territories for the exclusive use of indigenous communities. (b) Total forest fragmentation classes for 1985, 2020 and secondary forest (1986–2020) separated by public administration jurisdiction in the Atlantic Forest biome.
| (a) | |||||||||
|---|---|---|---|---|---|---|---|---|---|
| Environmental Conservation Areas | |||||||||
| Strict Use | Sustainable Use | Indigenous lands | |||||||
| Fragmentation Class | km2 | % | % of secondary forest regarding 2020's total | km2 | % | % of secondary forest regarding 2020's total | km2 | % | % of secondary forest regarding 2020's total |
| Core | 14 323.6 | 62.7 | 35.4 | 10 527.6 | 28.8 | 26.0 | 898.3 | 42.9 | 2.2 |
| Perforation | 388.7 | 1.7 | 42.1 | 284.1 | 0.8 | 30.8 | 23.8 | 1.1 | 2.6 |
| Edge | 1,212.3 | 5.3 | 11.3 | 1,656.2 | 4.5 | 15.4 | 154.5 | 7.4 | 1.4 |
| Bridge | 4,810.8 | 21.1 | 3.9 | 15 015.6 | 41.1 | 12.2 | 577.8 | 27.6 | 0.5 |
| Loop | 1,115.4 | 4.9 | 7.1 | 1,720.9 | 4.7 | 10.9 | 154.5 | 7.4 | 1.0 |
| Branch | 377.4 | 1.7 | 2.1 | 1,634.7 | 4.5 | 9.1 | 73.4 | 3.5 | 0.4 |
| Islet | 614.6 | 2.7 | 0.5 | 5,737.6 | 15.7 | 5.0 | 213.0 | 10.2 | 0.2 |
| Total forest | 22 842.9 | 100.0 | 36 576.7 | 100.0 | 2,095.2 | 100.0 | |||
| (b) | |||||||||
| Authority responsible for Conservation Areas | |||||||||
| Federal | State | Municipal | |||||||
| Fragmentation Class | km2 | % | % of secondary forest regarding 2020's total | km2 | % | % of secondary forest regarding 2020's total | km2 | % | % of secondary forest regarding 2020's total |
| Core | 8,742.2 | 47.1 | 21.6 | 14 149.6 | 38.8 | 35.0 | 656.2 | 22.6 | 1.6 |
| Perforation | 212.0 | 1.1 | 0.5 | 406.9 | 1.1 | 44.1 | 17.5 | 0.6 | 1.9 |
| Edge | 1,142.3 | 6.2 | 2.8 | 1,510.6 | 4.1 | 14.0 | 143.8 | 5.0 | 1.3 |
| Bridge | 5,167.6 | 27.9 | 12.8 | 13 320.4 | 36.5 | 10.8 | 1,279.9 | 44.2 | 1.0 |
| Loop | 969.3 | 5.2 | 2.4 | 1,626.0 | 4.5 | 10.3 | 179.9 | 6.2 | 1.1 |
| Branch | 626.0 | 3.4 | 1.5 | 1,251.5 | 3.4 | 7.0 | 139.7 | 4.8 | 0.8 |
| Islet | 1,688.6 | 9.1 | 4.2 | 4,197.6 | 11.5 | 3.7 | 480.6 | 16.6 | 0.4 |
| Total forest | 18 548.1 | 100.0 | 36 462.7 | 100.0 | 2,897.7 | 100.0 | |||
We found that Bridge and islet classes were dominant in 1985 and 2020. In the AF biome, Rainforests had the largest core area (26.7% Dense Rainforest, 8.3% Araucaria-Mixed Rainforest, 7.1% Open Rainforest), while Seasonally Dry formations had the lowest (5.8% Seasonally Dry Semideciduous Forest, 3.7% Seasonally Dry Deciduous Forest). Over 35 years, proportions of the different fragmentation classes stayed almost stable. The core area of Open Rainforest class increased by 4.4%, Araucaria-Mixed Rainforest reduced by 3.7%. The bridge class area in Araucaria-Mixed Rainforest and Seasonally Dry Deciduous Forest shrank (4.9% and 2%, respectively), while this fragmentation class in Open Rainforest expanded by 3%. Islet area increased for Seasonally Dry Deciduous Forest (2.2%) and Araucaria-Mixed Rainforest (7.9%) but was reduced by 16.7% in Open Rainforest. Secondary forests contributed to all fragmentation classes, expanding the area of bridges and islets (table 4).
Table 4. Total forest fragmentation classes for Atlantic Forest formations for 1985, 2020 and secondary forest from 1986 to 2020, with percent of fragmentation classes and total forest.
| Fragmentation Class | Seasonally Dry Semideciduous Forest | Seasonally Dry Deciduous Forest | Ecotone regions | |||||||||||||||
|---|---|---|---|---|---|---|---|---|---|---|---|---|---|---|---|---|---|---|
| 1985 | 2020 | secondary forest (1986–2020) | 1985 | 2020 | secondary forest (1986–2020) | 1985 | 2020 | secondary forest (1986–2020) | ||||||||||
| km2 | % of forest | km2 | % of forest | km2 | % of forest | km2 | % of forest | km2 | % of forest | km2 | % of forest | km2 | % of forest | km2 | % of forest | km2 | % of forest | |
| Core | 5,686.7 | 6.9 | 4,894.4 | 5.8 | 270.8 | 0.8 | 624.6 | 3.7 | 614.1 | 3.7 | 26.0 | 0.5 | 5,098.2 | 10.2 | 4,428.6 | 9.1 | 155.3 | 1.1 |
| Perforat. | 56.9 | 0.1 | 55.5 | 0.1 | 2.8 | 0.0 | 7.8 | 0.0 | 0.0 | 0.0 | 0.3 | 0.0 | 118.1 | 0.2 | 105.7 | 0.2 | 5.5 | 0.0 |
| Edge | 3,109.8 | 3.8 | 3,095.3 | 3.7 | 366.5 | 1.1 | 308.0 | 1.8 | 282.6 | 1.7 | 30.4 | 0.6 | 1,560.9 | 3.1 | 1,422.8 | 2.9 | 126.9 | 0.9 |
| Bridge | 25 748.8 | 31.3 | 24 680.2 | 29.3 | 7,745.4 | 23.3 | 5,776.3 | 34.3 | 5,133.1 | 31.2 | 1,379.8 | 26.8 | 20 891.7 | 41.7 | 20 434.2 | 41.8 | 4,566.4 | 31.9 |
| Loop | 4,143.6 | 5.0 | 4,626.3 | 5.5 | 1,613.3 | 4.9 | 1,009.1 | 6.0 | 1,001.2 | 6.1 | 244.6 | 4.8 | 2,283.2 | 4.6 | 2,024.6 | 4.1 | 516.9 | 3.6 |
| Branch | 4,305.3 | 5.2 | 4,895.6 | 5.8 | 2,009.8 | 6.1 | 753.1 | 4.5 | 646.8 | 3.9 | 246.5 | 4.8 | 2,429.5 | 4.9 | 2,546.5 | 5.2 | 868.4 | 6.1 |
| Islet | 39 211.7 | 47.7 | 42 123.3 | 49.9 | 21 191.7 | 63.8 | 8,366.3 | 49.7 | 8,750.8 | 53.3 | 3,213.5 | 62.5 | 17 685.5 | 35.3 | 17 931.2 | 36.7 | 8,088.9 | 56.5 |
| Total forest | 82 263.0 | 100.0 | 84 370.6 | 100.0 | 33 200.2 | 100.0 | 16 845.2 | 100.0 | 16 428.6 | 100.0 | 5,141.2 | 100.0 | 50 067.1 | 100.0 | 48 893.7 | 100.0 | 14 328.4 | 100.0 |
| Fragmentation Class | Dense Rainforest | Open Rainforest | Araucaria-Mixed Rainforest | |||||||||||||||
| 1985 | 2020 | secondary forest (1986–2020) | 1985 | 2020 | secondary forest (1986–2020) | 1985 | 2020 | secondary forest (1986–2020) | ||||||||||
| km2 | % of forest | km2 | % of forest | km2 | % of forest | km2 | % of forest | km2 | % of forest | km2 | % of forest | km2 | % of forest | km2 | % of forest | km2 | % of forest | |
| Core | 26 158.9 | 27.2 | 24 651.8 | 26.7 | 702.9 | 3.3 | 43.3 | 2.7 | 112.4 | 7.1 | 17.1 | 2.1 | 9,252.8 | 12.0 | 5,593.4 | 8.3 | 239.5 | 1.2 |
| Perforat. | 696.6 | 0.7 | 665.5 | 0.7 | 37.6 | 0.2 | 0.6 | 0.0 | 1.2 | 0.1 | 0.3 | 0.0 | 208.7 | 0.3 | 88.6 | 0.1 | 7.1 | 0.0 |
| Edge | 4,009.0 | 4.2 | 3,861.1 | 4.2 | 389.6 | 1.8 | 21.5 | 1.3 | 74.7 | 4.7 | 18.6 | 2.3 | 2,674.8 | 3.5 | 1,840.3 | 2.7 | 169.3 | 0.8 |
| Bridge | 42 484.1 | 44.1 | 39 326.5 | 42.6 | 9,821.5 | 45.8 | 366.0 | 22.8 | 405.7 | 25.8 | 194.8 | 24.4 | 39 353.5 | 50.9 | 31 170.8 | 46.0 | 7,802.6 | 37.9 |
| Loop | 4,957.0 | 5.2 | 4,623.9 | 5.0 | 1,118.8 | 5.2 | 103.8 | 6.5 | 128.5 | 8.2 | 56.3 | 7.0 | 3,091.1 | 4.0 | 2,776.3 | 4.1 | 797.9 | 3.9 |
| Branch | 3,883.7 | 4.0 | 4,201.5 | 4.6 | 1,695.6 | 7.9 | 59.5 | 3.7 | 123.6 | 7.9 | 59.7 | 7.5 | 4,257.0 | 5.5 | 4,795.6 | 7.1 | 1,901.3 | 9.2 |
| Islet | 14 040.0 | 14.6 | 14 947.4 | 16.2 | 7,660.2 | 35.8 | 1,008.0 | 62.9 | 726.6 | 46.2 | 452.6 | 56.6 | 18 409.2 | 23.8 | 21 440.2 | 31.7 | 9,664.9 | 47.0 |
| Total forest | 96 229.4 | 100.0 | 92 277.7 | 100.0 | 21 426.1 | 100.0 | 1,602.7 | 100.0 | 1,572.7 | 100.0 | 799.4 | 100.0 | 77 247.2 | 100.0 | 67 705.2 | 100.0 | 20 582.6 | 100.0 |
3.4. Quantifying and mapping the carbon balance due to fragmentation in the Atlantic Forest (1985-2020)
Our estimates show that secondary forest regeneration removed 1346 TgCO2, from 1985 to 2020, offsetting around 82.62% of the total emissions in the AF biome during the analysed period. This estimate excluded all emissions from deforestation before this period. Our findings demonstrated parity between C emissions from deforestation (818 TgCO2) and those arising from the forest edge effect (810 TgCO2) (figure 6(a)), emphasizing the substantial impact of both processes on C emissions. This suggests that despite long-term trends of deforestation reduction, the AF continues to lose C stocks due to the edge effect. Consequently, if fragmentation continues, the dominant source of emissions may no longer be attributed to deforestation, but rather to edge effects.
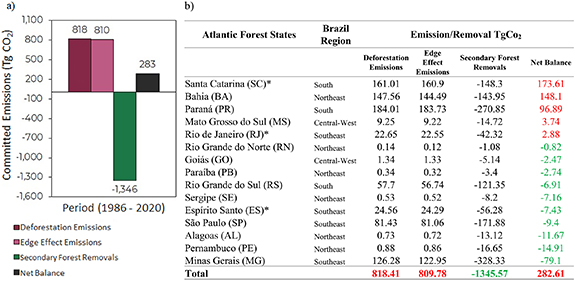
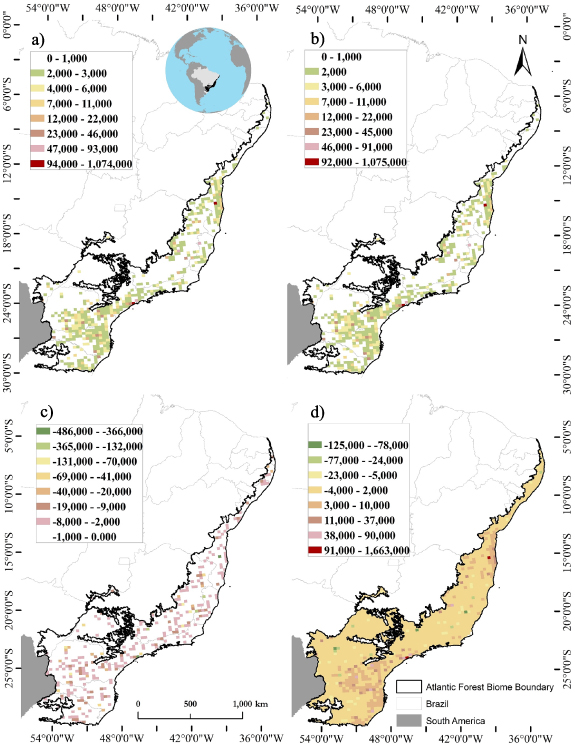
Figure 6. (a) Atlantic Forest Total Carbon committed emissions (Tg CO2) from 1986 to 2020. (b) Total Carbon committed emissions (TgCO2) presented by AF States. * States whose boundaries are entirely within the AF Biome.
Download figure:
Standard image High-resolution imageWe calculated net emissions by considering emissions from both deforestation and edge effects, and removals from secondary forests in each AF state. The consistent pattern of equivalence between deforestation and edge emissions held for each State (figure 6(b)). We showed the overall net balance, for the period analysed, indicates a source of 283 TgCO2 to the atmosphere. Individually assessing each state, only five (from a total of 15)—Santa Catarina, Bahia, Paraná, Mato Grosso do Sul, and Rio de Janeiro—were unable to have secondary forest removals completely offsetting emissions from deforestation and edge effects. In contrast, Pernambuco, Alagoas, and Minas Gerais outperformed other states in offsetting recent deforestation emissions (figure 5(b)).
We spatially analysed emissions from deforestation, edge effect, removals from regeneration, and the resulting net balance (figures 7(a)–(d)). Net emissions were characterized by the dominance of removals in low latitudes in the northeast region, in the central part of the biome, mainly in the Midwest portion and in the southern regions. We observed prominent emissions in the southern region of Bahia, the northeast region of Minas Gerais, and in eastern São Paulo, Paraná, Santa Catarina, and Rio Grande do Sul, which are areas near metropolitan regions. (figure 7(d)).
Figure 7. Total Carbon committed emissions map (1986–2020). Carbon estimation (MgCO2) was calculated by 0,25° Grid cell resolution. Values range from more positive (green) to more negative (red). Deforestation emissions (a), Edge effects emissions (b), Secondary Forest removals (c) and, Net Balance (d).
Download figure:
Standard image High-resolution image
4. Discussion
4.1. Atlantic Forest fragmentation status and dynamics
We provided a comprehensive biome-scale perspective on AF fragmentation using the MSPA approach (Vogt et al 2007), updating the previous assessment by Ribeiro et al (2009) and Rezende et al (2018). Our results show a decrease in total mapped forest cover from 1985 (337 663.8 km2) to 2020 (323 815.1 km2) (table 2). Although the proportions of the fragmentation classes remained consistent, there was a loss of 6758.7 km2 in the core area, a reduction in the bridge area of 14 352.3 km2 and an increase of 7671.9 km2 in the islet area (table 1).
Core areas provide essential habitats that support larger populations, enabling species to thrive and maintain healthy population dynamics (Gaston et al 2006, Belote et al 2017). These large, mature fragments are vital for preserving taxonomic, genetic, and functional diversity (Smith et al 2021, Schweizer et al 2022). Moreover, old-growth forests enhance seed input and facilitate the recolonization of neighbouring fragments (Rodrigues et al 2009).
The bridge class comprises most remaining forests (38%), prone to converting into loops, branches, or islets, intensifying fragmentation, and deforestation. Bridges serve as transitional boundaries, offering opportunities for regeneration into core forests. They aid in countering fragmentation effects by reducing isolation and enhancing connectivity (Bennett 2003, Wickham and Riitters 2019).
Islets constitute 35.3% of AF and face threats from both nature- and human-related causes. Our transition matrix reveals a risk of substantial loss of forests, as only around 13% transitioned to classes with low fragmentation level. Islets are vital for mitigating the non-forest matrix's impact on ecosystem processes.
Strategically using islets as stepping stones enhances population permeability through the matrix, benefiting endangered species in fragmented forests. This approach strengthens landscape resilience against fragmentation and degradation threats (Baum et al 2004, Antongiovanni and Metzger 2005, Pardini et al 2009, Brancalion et al 2018, Cardoso et al 2022).
Isolation and patch size significantly influence biodiversity in fragmented landscapes (Fahrig 2013). Prioritizing islet integrity and ecological restoration can enhance structural connectivity, benefiting conservation, C goals, and cost reduction (Strassburg et al 2019, Grantham et al 2020, de la Sancha et al 2021).
Around 86% of mapped secondary forests belong to the bridge and islet categories. Their contribution to the 2020 fragmentation classes increases progressively from core to islet, enhancing landscape connectivity. Secondary forests contributed 3.5% of the entire core area mapped in 2020. They serve as crucial stepping stones, aiding species movement (Crouzeilles et al 2017, Matos et al 2020). Strategic placement of secondary forests near remnant patches or creating corridors can further reduce isolation and enhance connectivity (Marshall et al 2022, Schweizer et al 2022, Wills et al 2022).
Landscape planning in the AF should prioritize spatial configuration, connectivity promotion, and core area enhancement and preservation. Understanding fragmentation spatial patterns and processes leading to temporal changes can help identifying highly vulnerable areas, informing effective conservation strategies (Lira et al 2012, Maxwell et al 2020).
Our results underscore the importance of protected areas for core forest preservation and landscape connectivity. Secondary forests play a vital role in the mosaic of Protected and Indigenous areas, highlighting their significance. However, concerns raised due to recent trends in deforestation that were identified following our mapping in 2020. These findings emphasize the necessity for collaboration among federal, state, and municipal authorities in effective forest resource management.
Our findings revealed marked alterations in AF's landscape due to shifts in land use. Native vegetation decreased from 360 000 km2 in 1985–333 000 km2 by 2022. Activities such as agriculture, and expansion of urbanized regions can be associated to this decline. Pasture areas reduced from 390 000 km2 to 300 000 km2, while agricultural land doubled from 120 000 km2 to 240 000 km2. Native vegetation predominantly regrew in former pasture areas (MapBiomas 2023).
Landscape planning is crucial to address declining forest areas. Observing the changes in land cover in AF highlights extensive transitions from pastures to agriculture, mosaic of uses, and native vegetation. These three classes dominated the shifts from pastures to other uses from 1985 to 2022 (MapBiomas 2023). Approximately 65.6% of Brazil's pastures (2010–2018) showed signs of mild, moderate, or severe degradation (Santos et al 2022). Utilizing MSPA to map fragmentation classes is advantageous for managing the AF landscape. Leveraging the regrowth potential in degraded pastures near bridge, loop, and branch areas, which serve as connectors, can facilitate the expansion of connections between forest fragments through natural regeneration.
AF has the potential to adopt crop-livestock-forest systems, replacing degraded pastures and monocultures across extensive areas. These combined systems can prevent additional fragmentation or deforestation (Rodrigues et al 2023). Recognized for its integrated role in enhancing water, energy, and food security, this approach is becoming a crucial strategy to engage stakeholders and local communities in seeking nature-based solutions (Melo et al 2021).
4.2. Fragmentation impact on Atlantic Forest carbon balance
Our analysis also permitted a comprehensive understanding of the components of the net C emissions in the AF biome. Secondary forest regeneration offsets around 82.62% of total emissions. From this total C emissions, deforestation and edge effect contributes equally. In Amazonian forests, edge areas contribute to 37% of deforestation (Silva-Junior et al 2020a), underscoring that the Atlantic Forest exhibits an even more pronounced influence from edges, approaching nearly 50%. This highlights the ongoing C stock loss, despite nearly 90% of the forest land use remained unchanged over the last 35 years. This pattern is mainly associated to the extensive fragmentation of AF landscape, which allows edge effect to become a major contributor to C loss in this biome. Therefore, urgent efforts are needed to reduce deforestation to nearly zero, with forest regeneration aiming at reducing fragmentation and forest edge area, contributing positively to the stability of biome's functions in the future. An additional area of approximately 1.96 million hectares (19 600 km2) of forests would be required to grow in the coming years to offset carbon emissions from 1985 to 2020 in the AF. An area about a third of Belgium.
It is a challenge to reduce emissions from deforestation in tropical forests. Smith et al (2021) found a strong negative relationship between the loss of primary forests and the recovery of secondary forests for countries in the Amazon region. AF stands as a hope spot for regeneration (Rezende et al 2018), with its natural regrowth forests being a cost-effective strategy for restoration goals (Crouzeilles et al 2020).
Our study demonstrates that secondary forests are dominant in the classes bridge and islet, which are more susceptible to deforestation than others with better connectivity. This result confirms the vulnerability of secondary forests to subsequent deforestation. Factors such as steeper slopes, proximity to rivers and existing forests, higher agricultural productivity areas, and lower rural-urban population ratios increases the persistence of regenerated forests (Piffer et al 2022).
Another important point is the need for not only preserve forests in lower fragmentation class, but also those in higher fragmentation classes to increase the resilience of AF functions to climate change. A recent model predicting the impact of climate change on AF above-ground biomass (AGB) showed that the most significant loss of AGB, up to 40%, compared to the baseline value, is likely to occur between latitudes 13° and 20° south (Ferreira et al 2023). Our results showed deforestation and degradation leading to core area loss in southern and south-eastern forests at these latitudes, which may decrease the capacity of forests to counteract the effects of changes in climate.
4.3. Policy implications
Over the past 35 years, our findings reveal that despite the AF's success in preserving much mature forest and expanding secondary forest coverage until 2020, deforestation, edge effects, and degradation have eroded connectivity and reduced core areas (Rosa et al 2021). This scenario jeopardizes Brazil's commitment to reforesting 12 million hectares. Additionally, MP 1150/2022 (National Congress 2022), aiming to relax restrictions on native vegetation removal placing core, bridge, and islet classes at risk, protected only by AF law.
If implemented, this measure could authorize deforestation for infrastructure projects, bypassing environmental assessments and ecological compensation requirements (Ribeiro et al 2023). The proposed law might also extend the timeframe for environmental restoration, obstructing financing agencies from enforcing restoration as a precondition for credit (Disclosures 2017).
4.4. Uncertainties and validations
The dataset used as input to fragmentation mapping relies on MapBiomas Collection 6.0, which maintains an overall accuracy for AF biome by 90,6% ± 2,9% (https://brasil.mapbiomas.org/en/analise-de-acuracia/). No changes to the spatial resolution of the input were made in any steps of the methods. Since Guidos toolbox can be settled to work in the same resolution of the input that is provided, we guarantee the same accuracy for our fragmentation mappings of 1985, 2020 and secondary forests. The method used to map secondary forests based on MapBiomas was validated by comparing secondary forest areas with TerraClass secondary forest map using a bootstrap approach with 10 000, resulted in an R2 = 0.6(0.03) and p < 0.001 (Silva-Junior et al 2020b).
The model used to estimate carbon loss due to edge effect was proposed by Silva-Junior et al (2020a)—the model was built based on light detection and ranging data, which provides information on the forest structure in high detail. The model in question corresponds to a Michaelis–Menten kinetic equation, which was applied to the average carbon loss stratified by the chronosequence of the age of the forest edges, having an R2 = 0.780 and a mean squared error of 5.767 Mg C.
5. Concluding remarks
Our study conducts a spatiotemporal analysis of the entire Brazilian Atlantic Forest landscape using MSPA, contributing to valuable insights to the field. Beyond comparing changes in seven fragmentation classes over three decades, we explored the role of secondary forests. We also updated fragmentation status for main Forest formations, Protected Areas, and Indigenous Lands. Our results explicitly accounted for impact of deforestation and fragmentation on carbon dynamics across the entire biome and individual AF states.
5.1. Key findings
Continuous Fragmentation: Over the last 35 years, the AF biome witnessed the loss of crucial core (33.6%) and bridge (38.9%) areas (table 2(a)).
Contribution of Secondary Forests: Regeneration by secondary forests significantly contributed to all fragmentation classes from 1986 to 2020.
Parity in Carbon Emissions: Deforestation (818.41 TgCO2) and edge effects (809.78 TgCO2) almost equally contribute to carbon emissions, requiring the growth of approximately 1.96 million hectares of forest for offsetting.
5.2. Conservation priorities, management and next steps
Reach zero deforestation: Even with 90% stability in forest change, deforestation impacted the reduction of total forest, reflecting the loss of important fragmentation classes.
Core and bridge preservation: Essential classes to maintain the structural integrity of the existing forest. We Mapped 40 436.7 km2 of total core forest, those, only 25 749.5 km2 are within conservation units, leaving 36.3% unprotected. And might face the imminent risk of degradation or deforestation.
Islet preservation and management: It is the second largest class (35.4%). In Seasonally Dry formations, this class dominates, representing mainly what is left of them. The use of these areas in the implementation of restoration projects to enhance forest connectivity is urgent.
Promoting Sustainable Forest Management: Orientate secondary forests growth potential aiming on the replacement of degraded pastures with agroforestry systems highlighting non-forest matrix integration. Reducing turnover rates and ensuring long-term sustainability of regenerated forests.
These actions are central in sustaining AF's persistence and regeneration, aligning with Brazil's dedicated sustainable development strategies.
Acknowledgments
We thank the support of Agência Espacial Brasileira (AEB). We thank MapBiomas for providing the data used as inputs in this work. Our thanks to the referees for their valuable review contributions. We also thank TREES lab (INPE) and LCA (UENF).
Data availability statement
The data that support the findings of this study are openly available at the following URL/DOI:
Funding
L E O C A was in part supported by FAPESP 20/15230-5 and CNPq/PQ Grant 314416/2020-0. Conselho Nacional de Desenvolvimento Científico e Tecnológico (CNPq) and Fundação Carlos Chagas Filho de Amparo à Pesquisa do Estado do Rio de Janeiro (FAPERJ) provided Grant to M T N (CNPq: 312567/2021-9; FAPERJ: E-26/201.007/2022) and D M V (CNPq: 315112/2020-4; 460778/2014-5; FAPERJ: E-26/211.978/2021). C H L S-J was supported by CNPq (Grant 401741/2023-0). This study was financed in part by the Coordenação de Aperfeiçoamento de Pessoal de Nível Superior—Brasil (CAPES)—Finance Code 001.
Author contributions
Igor S Broggio (Conceptualization, Methodology, Formal analysis, Data Curation, Writing - Original Draft, Writing — review & editing); Celso H L Silva-Junior (Conceptualization, Methodology, Formal analysis, Data Curation, Writing — review & editing); Marcelo T Nascimento (Conceptualization, Writing — review & editing); Dora M Villela (Conceptualization, Project administration, Supervision, Writing — review & editing); Luiz E O C Aragão (Conceptualization, Methodology, Resources, Project administration, Supervision, Writing - Original Draft, Writing — review & editing, Funding acquisition).
Conflict of interest
The authors declare no conflicting interests.
Footnotes
- 9
The choice of a limit of 300 m for mapping fragmentation classes was designed to cover a broader spectrum of edge effect phenomena, which may vary depending on the penetration edge distance (Laurance et al 2017). We aimed to ensure a more comprehensive and diverse representation of impacts, associated with varying degrees of edge penetration.
- 10
We adopted a more conservative approach in mapping edges to calculate carbon emission and removal estimates, employing a narrower threshold (120 m). Here, our aim was to specifically target carbon dynamics in tropical forests. The 120 m threshold was selected based on the understanding that the most substantial loss of aboveground carbon stocks typically occurs within a 100 m distance in Tropical Forests (Laurance et al 1997, Melito et al 2018). Considering the spatial resolution of our data at 30 m, we opted for a width of 120 m, equivalent to four pixels, as defined by Silva-Junior et al (2020a), to accurately delineate forest edges, same method used for our analyses. This approach ensures a precise focus on carbon dynamics within our dataset constraints.