

Abstract
The ecological conservation and restoration of drylands is a global challenge, which is always under resources constraints and in competition with land developments. Here, we aim to identify ecological conservation and restoration priority areas based on the objectives of maximizing ecological values and minimizing opportunity costs with zonation as a heuristic spatial optimization tool. We take the Inner Mongolia (IM) of China as a typical dryland region. Results reveal that the efficiency of multi-objectives for ecological restoration is often better than a single objective. IM should focus on ecological conservation supplemented by restoration. Conserving 36.9% and restoring 13.1% of IM can provide an average of 72% of ecosystem functions while consuming 20% of opportunity costs. Our framework aligns with the need for nature-based solutions and rationalizes the allocation of resources for ecological conservation and restoration projects in complex dryland regions.
Export citation and abstract BibTeX RIS

Original content from this work may be used under the terms of the Creative Commons Attribution 4.0 license. Any further distribution of this work must maintain attribution to the author(s) and the title of the work, journal citation and DOI.
1. Introduction
Drylands are critical regions for achieving the UN Decade of Ecosystem Restoration and the sustainable development goals (Yao et al 2021). Dryland landscapes cover 41% of the world's terrestrial area and provide over a trillion dollars in ecological benefits to nearly two billion people worldwide (Yao et al 2020), with more than 45% of the global terrestrial carbon and over a third of the hotspots of global biodiversity (Pravalie 2016). It is the expression of a complex combination of social-ecological systems. However, resource constraints, climate change, and human disturbance have resulted in approximately 20% of the world's drylands currently being considered severely degraded (Reynolds et al 2007, D'Odorico et al 2013). Ecological restoration of drylands has become a global challenge (Shryock et al 2017). The United Nations has declared the basic need for ecological restoration of degraded ecosystems a major global priority, but recovery success in many dryland regions remains very limited (Kildisheva et al 2016).
The conservation of existing natural ecosystems remains a priority for the protection of biodiversity and ecosystem services. And large-scale restoration of ecosystems is key to limiting the impacts of climate change and reducing species extinction (Strassburg et al 2019, Dinerstein et al 2020). For areas with greater ecological value as well as higher human needs, the general principle should be to protect the undegraded and restore the degraded. Effective and sustainable implementation of ecological conservation and restoration, as the common approaches of ecosystem management, is an important channel to achieve multiple protection goals (Cristofoli and Mahy 2010, Neeson et al 2016).
Due to resource, financial, time, and manpower constraints (Vogler et al 2015, Weidlich et al 2021), the identification of priority areas is regarded as an important basis for ecological conservation and restoration (Dinerstein et al 2019, Weidlich et al 2021). Prioritization can assure that we maximize the benefit gained from limited resources (Hyman and Leibowitz 2000). Some scholars have utilized different methods to identify priority areas for ecological restoration from different perspectives according to the characteristics of drylands. For example, Wang et al (2023) took water resource constraints as the background and constructed a spatially explicit framework of 'Constraint-Pattern-Benefit' to plan the ecological restoration mode. Li et al (2024) used the normalized vegetation index (NDVI) to determine the priority location, area, and type of vegetation around the terminal lakes in drylands and generated a framework for the conservation priority sequence. And some research used the change of ecosystem services to judge the effect of restoration (Du et al 2022, Jia et al 2022, Rong et al 2022). However, most of the identification of priority areas used to rely on natural endowments, and the potential benefits of restoration are often measured using different indicators, which may make it difficult for policymakers to assess trade-offs between competing objectives. We aim to optimize the value of priority area selection by combining ecosystem service mapping tools and multi-objective methods with ecological degradation to delineate conservation and restoration priority areas for drylands. Based on the land community theory, diversity conservation theory, ecosystem stability theory, and community construction (Pearl 2005, Standish et al 2014, Wainwright et al 2018), an ecosystem with rich biodiversity and complete ecosystem structure and function is the target focus of ecological conservation and restoration. Besides, it is worth noting that almost all current studies have selected ecological features, but only a few have chosen to include socioeconomic objectives (Castillo-Mandujano and Smith-Ramirez 2022). Conservation and restoration benefits and costs vary markedly. If costs are not included in priority zoning metrics, it usually leads to costly failures (Manning et al 2006, Hobbs 2007). Therefore, both ecosystem functions and opportunity costs need to be considered in the identification of priority areas. Our work enables finding the optimal strategy for maximizing benefits and minimizing costs, and to apply different ecological practices to suitable different regions by combining the identification of ecologically degraded areas. Ecosystem degradation has diminished or lost resilience, which requires human assistance (Unsworth et al 2015, Vivekanandan et al 2016, Gladstone-Gallagher et al 2019), and is therefore classified as a restoration area.
We use Inner Mongolia (IM), a typical arid and semi-arid region in northern China, as an example to maximize ecosystem functions while minimizing opportunity costs for stakeholders, combining multi-objectives and degraded ecosystem analysis to delineate priority areas for ecological conservation and restoration. Then, to support the development of ecological management strategies for adaptation to drylands under resource constraints.
2. Data and method
2.1. Study area
Previous studies have shown that 45.76% of China's dryland has improved or become statistically green with vegetation since the implementation of the restoration projects (Li et al 2021). But at the same time, it has also caused problems of water stress and desertification. And the IM region, located in the north of China, is facing such a situation. The ecosystems in IM showing obvious zonal pattern from northeast to southwest along a precipitation gradient which spans semi-humid, semi-arid, and arid regions (appendix figure A1). Since the 1980s, IM has implemented many ecological restoration projects and policies, such as the Three Northern Protection Forest Project (Moore and Russell 1990), the no-grazing policy, and the Beijing–Tianjin Wind and Sand Source Control Project (Zhang et al 2017). These projects have effectively curbed land degradation in some areas, but the overall situation of land degradation prevention and ecological conservation and restoration still has very serious problems.
2.2. Data source
In this study, five ecological indicators (biomass carbon, species richness, soil conservation, wind prevention and sand fixation and water yield) and one economic indicator (opportunity cost) were used for a multi-objective decision-making simulation, and the top 30% of the ranked areas were regarded as key ecological conservation and restoration areas. Then, combined with the identification of degraded areas, the degraded part is regarded as a priority restoration area and the non-degraded part as a priority conservation area. Species distribution maps were accessed from the IUCN Red List. Biomass carbon and net primary productivity (NPP) data were obtained from the published literature (Chen et al 2021, Xu et al 2021). NDVI product (MOD13C2) was derived from NASA LAADS. The climate data, including precipitation, wind speed, temperature, and relative humidity, were provided by meteorological stations, and the data was spatialized using the Kriging method. Soil data were obtained from the Harmonized World Soil Database. Livestock distribution data were download from FAO website. Crop distribution maps were derived from data sets published in scientific data (Qiu et al 2022). The product price statistic data were from the yearbook of chinese agricultural product price survey. Other statistic data were accessed from the statistical yearbook of IM. See table A1 in the appendix for data details.
2.3. Priority ranking by multi-objectives
The multi-objectives optimization approach has been widely used to determine priority areas (Lopes Cavalcante et al 2022, Mu et al 2022). The systematic conservation planning tool of zonation has certain advantages in unit priority spatial visualization and monitoring restoration benefits, which can deal with large scale priority ranking problems (Maxwell et al 2019). It can take species, ecosystem, ecosystem service or other biodiversity characteristics as the restoration target, and complete spatial prioritization by evaluating the importance of subunits under certain constraints (Lehtomaki and Moilanen 2013), which has a wide range of applications in the development of regional conservation planning strategies. Zonation works by iteratively sorting different units, prioritizing the removal of space units that lead to the least marginal loss of target features. The units with the least advantage rank lowest (near 0), while the units with the most value rank highest (near 1). This ranking can be used to identify the priority order of any location within the landscape and visualized as a priority ranking map. At the same time, according to the feature curves, the proportion of each target retained when there are smaller units remaining can be quantified (Lehtomaki and Moilanen 2013).
Setting conservation targets is the first step in zonation's workflow. This study targeted multi-objectives of ecosystem functions as a priority screening requirement, including biomass carbon, species richness, and ecosystem services. The ecosystem services include soil conservation, wind prevention and sand fixation, and water yield, which has been regarded as the most important in IM (Feng et al 2022). The importance of each service is quantified by the NPP indicator method (MEE and NDRC 2017). The details for the NPP indicator method are shown in part two of the appendix.
The cost of ecological conservation and restoration is also one of the factors to be considered in the multi-objective optimization. Costs mainly include opportunity costs and implementation costs, where 87% of the total cost change is caused by opportunity costs (Strassburg et al 2019). Therefore, this study focuses on computerized opportunity costs as an influencing factor for prioritization. Crop and livestock production opportunity costs are included.
Crops in IM mainly include corn, wheat, soybeans, and potatoes (Shen et al 2019). The method of calculating the opportunity cost of crop production is based on the crop's spatial distribution and the production and market prices of each commodity in each county in 2020. The formula is as follows:


 is the total agricultural production opportunity cost;
  ,
,  , and
, and  are the production values of corn, wheat, and soybeans and potatoes for each cell, respectively; C, W and bt are the total production of corn, wheat, soybeans and potatoes in a city in 2020, respectively (t);
  ,
,  and
and  are the number of spatially distributed units of corn, wheat, soybean and potatoes, respectively, in a city;
  ,
,  and
and  are the prices of corn, wheat, soybean and potato agricultural products in 2020 (USD/t), respectively.
The opportunity cost of livestock production mainly considers cattle and sheep and is calculated based on the number of each type in different cells and the production of beef and sheep meat in each city in 2020 as well as the market price. We assume a constant trend in livestock spatial distribution from 2010 to 2020. The formula is as follows:

 is the total livestock production opportunity cost;
  and
and  are the production values of beef and lamb, respectively, for each cell in 2020;
  and
and  are the number of cattle and sheep in each cell of the original data;
  and
and  are the total number of cattle and sheep in a city in 2010;
  and
and  are the total production of beef and lamb at municipality scale in 2020;
  and
and  are the national average unit prices for beef and lamb in 2020, respectively. Finally, the sum of the opportunity cost of crop and livestock production is used as the total opportunity cost.
We put the biomass carbon, species richness, ecosystem services, and cost maps into the zonation model, targeting 30% restoration area as mentioned in UN Biodiversity Conference (COP 15), and calculating the ranking priority results with different setting weights. The weights set to the different layers represent the bias of the recovery target. Firstly, by setting one of the layers to a weight of 1 and the others to 0, it is possible to obtain how much ecosystem function is available when restoring the top 30% of the ranked land in the case of a single objective, and how much opportunity cost needs to be paid. Secondly, by setting each layer to an equal weight, it is possible to get how much ecosystem function is covered when restoring the top 30% of the ranked land under the multi-objectives, and how much opportunity cost needs to be paid.
2.4. Distinguishing priority areas for conservation and restoration
We defined the degraded portions of the identified priority areas as restoration areas and the non-degraded portions as conservation areas. This study characterized ecosystem degradation by the trend of vegetation coverage (FVC) indicator in the last 20 years. FVC is the percentage of the vertical projected area of vegetation (including leaves, stems, and branches) on the ground to the total area of the statistical area. It is calculated using the pixel dichotomy method with the following equation:
NDVI is the normalized vegetation index;  is the NDVI value of the pixel with pure soil cover;
  is the NDVI value of the pixel with pure vegetation cover; the upper and lower thresholds of NDVI intercepted using 5% confidence level are used as
  value and
  value, respectively. The higher the FVC, the higher the vegetation coverage of the site.
Temporal and spatial change trends of the FVC were analyzed using a Theil–Sen (Sen) slope (An et al 2022). Statistical significance of the Sen slope trend was tested using the Mann—Kendall significance test, which is widely applied to long-time series trend analysis with non-normal data (Huang and Kong 2016). The result is shown in the appendix (appendix figure A3).
3. Results
3.1. Spatial distribution of different potential objectives' values
There is spatial heterogeneity across different potential targets in the region (figure 1). Biomass carbon showed a distinct dominance in the northeast. Species richness, soil conservation and water yield showed a gradual decrease from east to west. Sand fixation was higher in the east part, but the heterogeneity was not significant. The opportunity cost is greatest in the west with high agricultural production. These trends suggest that conservation or restoration in a particular region may not provide the same efficiency for each objective.
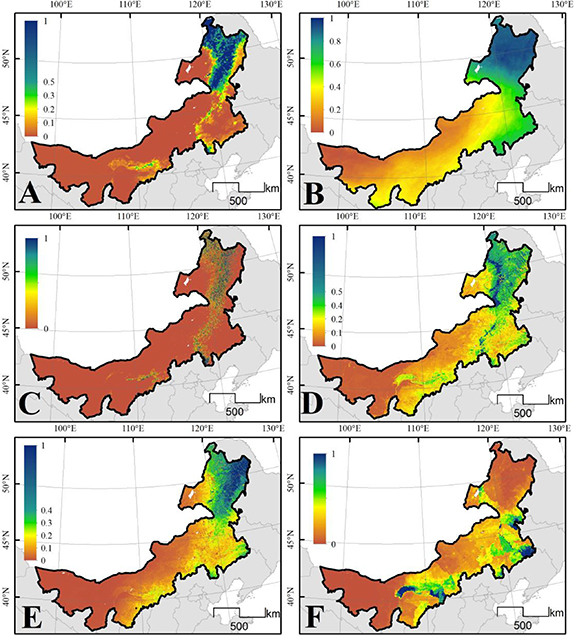
Figure 1. Maps for the different potential objectives' spatial distribution. (A): Biomass carbon (BC); (B): species richness (SR); (C): sand fixation (SF); (D): soil conservation (SC); (E): water yield (WY); (F): opportunity costs. For comparison purposes, all indicators are normalized, with 0–1 being relatively low to relatively high values (The quantitative results are showed in the appendix figure A2).
Download figure:
Standard image High-resolution image3.2. The identified conservation and restoration priority areas
Different target decisions show different benefit consequences (figure 2). The prioritization exhibited by a single-objective decision is not necessarily optimal for the coverage of other ecological functions. We compare the coverage of features at the top 30% of the priority rank (priority rank = 0.7), finding that all the single-objective strategies have lower ecosystem function coverage and higher opportunity cost coverage than the multi-objective (except for the opportunity cost single objective). Meanwhile, in terms of the average ecological function coverage provided by the unit opportunity cost value, the results of the multi-objective strategy are still better than the single objective. Thus, multi-objective decision-making has a definite advantage in selecting priority areas for restoration and conservation.
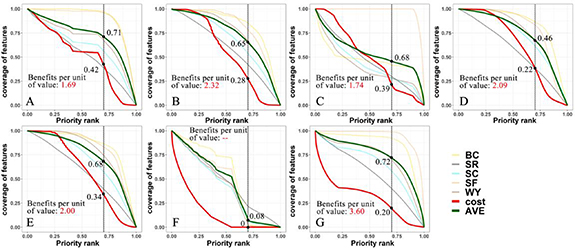
Figure 2. Coverage of features corresponding to different ranking values for single-objective (A)–(F) and multi-objective (G) decision-making scenarios. (A)–(F) are the results presented with biomass carbon (BC), species richness (SR), sand fixation (SF), soil conservation (SC), water yield (WY)and opportunity costs as a single objective, respectively. G for the consideration of multi-objectives results. The different color curves represent different ecological features that ranking and coverage under this decision. The red and green curves are opportunity costs and average ecological function coverage, respectively. The black vertical line is a line ranking value of 0.7, and the data for the two points intersecting with red and green represent the cost coverage and ecological function coverage when restoring the top 30% of the ranked land area under that decision. Benefits per unit of value represents how much ecological function can be covered per unit of opportunity cost (AVE/cost) when restoring the top 30% of the ranked land area under this decision.
Download figure:
Standard image High-resolution imageThe northern and eastern part of the study area has higher priority. The west-central region has a lower priority, which may be related to the higher cost of restoration in this region (figure 3(A)). The top 30% of the ranked areas are predominantly located in the northeastern portion of IM, with scattered distributions in the eastern and central portions (figure 3(B)). IM is dominated by conservation supplemented by restoration, and the area ratio is 71.8% and 28.2%, respectively (figure 3(C)). The statistic results show that the priority area can cover an average of 72% of ecosystem functions, including 92% of biomass carbon, 40% of species richness, 58% of soil conservation, 99% of sand fixation, and 70% of water yield, and only 20% of opportunity costs. Conservation and restoration areas provide an average of 53% and 19% of ecosystem functions, respectively. Biomass carbon has the highest fraction of restoration, followed by sand fixation (figure 3(D)).
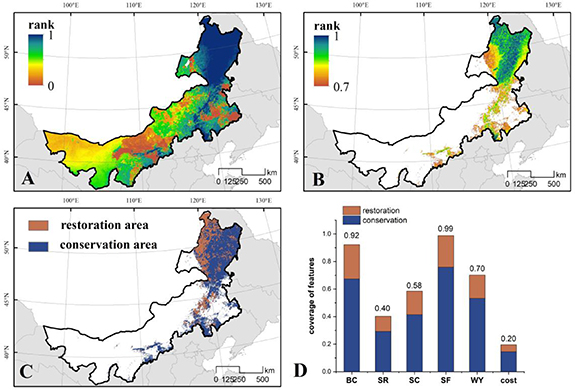
Figure 3. Priority area of multi-objectives strategy. (A): The priority ranking map of the whole IM; (B): the priority ranking map of the top 30% area; (C): distribution of conservation and restoration priority areas. (D): Proportion of different features covered by priority areas, including the coverage by restoration areas and the coverage by conservation area.
Download figure:
Standard image High-resolution image4. Discussion
The selection of priority areas often has synergistic or trade-off relationships among multiple objectives. We verified that the efficiency of using a combined assessment of multi-objectives for ecological restoration is often better than the efficiency of a single objective. Meanwhile, we clarify that the priority areas are those sites that are likely to exhibit the greatest ecological benefits while avoiding stakeholder losses as much as possible. The zonation tool has certain advantages in accomplishing these purposes. For drylands like IM with a large span of climate zones, the soil and surface vegetation vary greatly from east to west, and the land use classification shows a zonal distribution (Wang et al 2019). Different regions have different ecosystem service functions and production livelihoods. Zonation can rationalize the ecological and economic features normalization of different regions and process large scale areas with multiple ecosystem types and multifunctional distribution in zones (Maxwell et al 2019), providing a bridge and support for ecological conservation and restoration planning from national to local levels. Besides, our results identify a clear link between conservation and restoration, reflecting the principle of conservation-oriented and natural based solutions for prioritizing areas. Therefore, our method and results can guide decision makers in prioritizing the conservation and restoration of different lands and are particularly important for the strategic development and effective use of restoration techniques that target the spatial arrangement of specific barriers. A well-defined approach to rehabilitation can more effectively target specific areas and reduce costly failures—especially in the drylands where restoration success is limited—helping to achieve optimal effects with limited resources and investments.
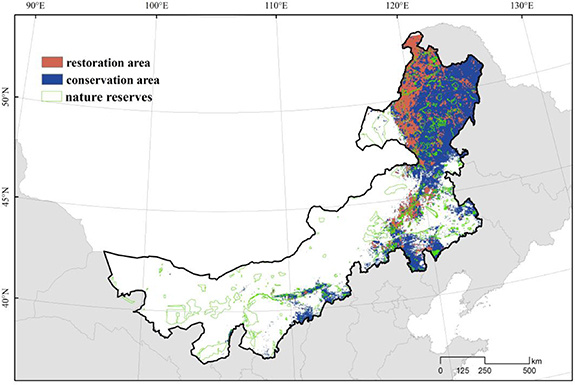
IM has carried out many ecological conservation and restoration efforts such as grain for green, reforestation and grassland ecological construction in order to rehabilitate ecosystem health and prevent land degradation (Wang et al 2023). However, the results of the priority area delineation based on our research point out two issues: first, the establishment of nature reserves is an important means of implementing ecological conservation (Liu et al 2003, Pringle 2017). There are currently 316 nature reserves in IM, accounting for 12.5% of the total land area. Although the number is big, there is still a large gap (84.7%) for the identified ecological priority areas (figure 4). And most of the established nature reserves are small. The single purpose of protection and more scattered distribution cannot form a good multi-functional ecosystem support system, so that the protection effectiveness is not significant (Sun et al 2020). This study can provide a reference for the development of the IM nature reserve system with national parks as the mainstay. Full advantage should be given to the establishment of a nature reserve system, and the integrity and connectivity of the reserves should be strengthened (Billionnet 2016). Using the ecological conservation priority areas as a guide and basing it on the principle of a nature-based solution framework, conservation gaps can be filled.
Figure 4. Ecological conservation, restoration, and nature reserves map in IM.
Download figure:
Standard image High-resolution image
Second, the ecological restoration projects that have been implemented in IM have mainly focused on recovery of degraded plateau grasslands, pasturelands, wetlands, desert and forest vegetation (Hou and Deng 2005, Wu et al 2014, Dang et al 2018, Liu et al 2020), with little attention paid to the vulnerability and degradation of the forest-grass transition zone, as well as few targeted restoration measures. The ecological restoration priority areas identified in this study are mainly located in the transitional zone between forest and grassland in the northeast (Guan et al 2021). More importantly, habitat heterogeneity can be a key to high conservation value in forest-grassland mosaics (Laszlo et al 2018). It is in line with the national ecological restoration planning for important ecosystems and points out the blind spots of ecological management in IM. The results of this study can be used as a guideline for both connectivity with national planning and compatibility with regional characteristics, improving the efficiency of ecological restoration.
Combining the references and research results, we believe that nature-based solutions (NBSs), which incorporate conservation and restoration by relying on the strength of nature, are more suitable for ecosystem management in IM and other dryland regions (Zheng et al 2019, Etter et al 2020). Emphasis should be placed on conservation, geographic variation, and local appropriateness, which are important prerequisites for measuring and judging interventions (Yao et al 2021). At the same time, considerations related to economic costs are key to the development of ecological conservation and restoration planning and the identification of priority areas. We take crop and livestock production opportunity cost into account in the ecological conservation and restoration planning process, and demonstrate that opportunity cost shows a strong advantage in multi-objective decision analysis, with only 20% of economic benefits to be lost when covering 72% of ecological functions on average. Such results contribute to predicting the cost-effectiveness and improving the efficiency of ecological conservation and restoration, as well as providing a theoretical basis for realizing regional ecological sustainable management.
Ecological conservation and restoration in drylands are an essential part of achieving global ecosystem restoration goals. Ecological conservation and restoration in drylands are complex in terms of multi-objective trade-offs. The indicator system can be supplemented with more socio-economic factors that influence the delineation of priority areas based on the framework of this study (for example, social equity and cultural priorities). Besides, the prediction of long-term ongoing input costs should be strengthened, as this also affects the balance of choices between conservation and restoration. Overall, our methods can contribute to the rational planning, well monitoring, and adequate assessment of ecological conservation and restoration plans. Decision support can be provided for preventing further desertification of degraded areas, protecting non-degraded drylands, managing dryland ecosystems efficiently, and achieving multiple sustainable development goals synergistically.
5. Conclusion
Effective and sustainable implementation of ecological conservation and restoration is an important channel for achieving multiple goals in drylands. When conservation and sustainable use are combined, ecological restoration is the nexus needed to transform local, regional, and global environmental conditions from a state of continued degradation to a state of net positive improvement. Identification of priority areas based on multi-objectives and ecosystem degradation is the key to refining and improving the efficiency of ecological conservation and restoration in drylands. The results show that priority area delineation based on multi-objectives can provide substantial ecological benefits at low cost, thus achieving co-development. More importantly, drylands should incorporate conservation and restoration by relying on the strength of nature for ecosystem management and combine NBSs to maintain and restore ecosystem structure and function. Under resource constraints, changes in ecosystem multifunctionality, stability and vulnerability in drylands and the integration of opportunity costs are key to improving the efficiency of ecological conservation and restoration as well as maintaining sustainable socioeconomic development.
Acknowledgments
This work was supported by the Projects named Ecological Restoration Planning of Inner Mongolia Autonomous Region (NMGZCS-G-F-210124) and Construction of Ecological Security Pattern and Demonstration of Multi-dimensional Control Technology of Water, Grass, Forest, and Food in the Interlocking Agro-pastoral Zone at the Northern Foot of Yinshan Mountain (2021CG0012).
Data availability statement
The data cannot be made publicly available upon publication because no suitable repository exists for hosting data in this field of study. The data that support the findings of this study are available upon reasonable request from the authors.
Supplementary data (1.7 MB PDF)