

Abstract
The South China Sea is a typhoon-prone region, and previous studies have shown that typhoons have significant impacts on air-sea CO2 fluxes. However, the effect of typhoons on the northern coastal area of the South China Sea is not well understood owing to limited observational data. In this study, we used a coupled model to simulate the impact of four typhoons (Hato, Mangkhut, Nida, and Merbok) on the partial pressure of CO2 in seawater (pCO2sea) and the CO2 fluxes in this area. Our results show that the coupled model effectively reproduces the spatial pattern of pCO2sea in this region. The response of pCO2sea to typhoons was determined by typhoon-induced vertical mixing and coastal upwelling, along with initial oceanic conditions. Typhoon Nida caused a decrease in pCO2sea with Total Alkalinity and Sea Surface Temperature being the primary factors. However, typhoons Hato, Mangkhut, and Merbok caused an increase in pCO2sea with Dissolved Inorganic Carbon playing a more prominent role. The average CO2 fluxes during the passage were approximately 6–14 times higher than those before typhoon passage. These results enhance our understanding of the effect of typhoons on air-sea CO2 fluxes over the northern coastal area of the South China Sea.
Export citation and abstract BibTeX RIS

Original content from this work may be used under the terms of the Creative Commons Attribution 4.0 license. Any further distribution of this work must maintain attribution to the author(s) and the title of the work, journal citation and DOI.
1. Introduction
Typhoons are tropical cyclones that occur frequently in the northwestern Pacific and South China Sea frequently (Zhan et al 2012, Zhong et al 2019, Liu et al 2020, Hong and Vinh 2022). Previous studies have shown that typhoons have a significant impact on the air-sea CO2 fluxes (CO2 fluxes) (Lu et al 2012, Ma et al 2020). Bates et al (1998) demonstrated that typhoons increased the summer CO2 fluxes in the Kuroshio Extension by nearly 55%. Hood et al (2001) found that high wind speeds during typhoon events led to a sharp decrease in sea surface temperature (SST), a significant increase in the partial pressure of CO2 in seawater (pCO2sea) and nitrate concentration, and doubling of CO2 fluxes. Nemoto et al (2009) indicated that during three typhoon events in the western subtropical region of the Northwest Pacific, the CO2 fluxes accounted for 60% of the total summer fluxes. Sun et al (2014) discovered that when a tropical cyclone passed through the low-salinity region of the South China Sea, it resulted in increased pCO2sea and doubled CO2 fluxes in low-salinity water areas. Yu et al (2020) found that the average CO2 fluxes during typhoons was 3.6–5.4 times higher than that during the pre-typhoon period. Over the past decade, typhoons have increased annual CO2 fluxes in the northern South China Sea by 23%–56% (Yu et al 2020). In addition, previous studies have explored the causes of CO2 fluxes variations during typhoons. Ye et al (2017) demonstrated that when Typhoon Wutip passed through the anticyclonic and cyclonic regions, the cyclonic region became a stronger carbon source, while the anticyclonic region changed from a carbon source to a carbon sink, which was primarily due to changes in vorticity, sea surface salinity (SSS), temperature, and pCO2sea. Research by Kao et al (2023) indicated that when a typhoon occurs in the southern East China Sea, the factors affecting pCO2sea in the upwelling area are the temperature effect (38%–40%), net biological activity (−33% to −36%), and the mixing effect (−24%).
The northern coastal area of the South China Sea, located in the northern part of the South China Sea continental shelf, receives freshwater from the Pearl River throughout the year (Cai et al 2004, Ni et al 2008, Li et al 2016, Liu et al 2018, Wei et al 2020). This region is characterized by complex physical and biological environments, which are often influenced by extreme weather events, such as typhoons (Zhao et al 2009, Pan et al 2017, Yin et al 2017, Qiu et al 2019, Qu et al 2021). Unlike in the open ocean, the seawater environment in this area is intricate. Previous studies have demonstrated that the Pearl River plume and seasonal upwelling have significant effects on biogeochemical processes in the nearshore area of the northern South China Sea (Gan et al 2010, Bai et al 2015, Li et al 2020, Geng et al 2021). These processes contribute a substantial amount of nutrients to the northern coastal area of the South China Sea, resulting in a notable decrease in pCO2sea due to increased primary productivity (Dai et al 2008, Cao et al 2011, Zhao et al 2021). Furthermore, Zhai et al (2009) found that air-sea exchange significantly influences pCO2sea in the northern coastal area of the South China Sea.
The frequency of typhoons has increased in the past decade owing to global warming (Goldenberg et al 2001, Webster et al 2005, Wu et al 2005, Elsner et al 2008, Balaguru et al 2012, Mei et al 2015, Balaguru et al 2016, Da et al 2021). In future warming scenarios, even more typhoon events will affect the region. However, the impact of typhoons on CO2 fluxes in the northern coastal area of the South China Sea is not well understood because of the limited observational data on pCO2sea and CO2 fluxes.
In order to compare the effects of typhoons with varying intensities on pCO2sea and CO2 fluxes in this area, we classify Hato and Mangkhut as stronger typhoons, while Nida and Merbok are considered weaker. This study used a coupled model to analyze changes in pCO2sea and CO2 fluxes during the passage of typhoons Hato, Mangkhut, Nida, and Merbok, and explored the underlying mechanisms. Models can offer three-dimensional responses of dynamically consistent variables of interest, thereby improving our comprehension. This study also quantitatively evaluated the impact of typhoons on CO2 fluxes. This research will significantly improve our understanding of CO2 fluxes variation in the northern coastal area of the South China Sea during typhoons.
The remainder of this paper is structured as follows. Section 2 provides an overview of the data and analysis methods. Section 3 examines the temporal and spatial changes in the pCO2sea and CO2 fluxes in the northern coastal area of the South China Sea during typhoon events. Section 4 investigates and quantifies the factors that influence pCO2sea and CO2 fluxes in the study area during typhoons. Finally, the conclusions are presented in section 5.
2. Data and methods
2.1. Data
This study simulated four typhoons: Hato (1713), Mangkhut (1822), Nida (1604), and Merbok (1702). Track data for these typhoons were obtained from the Central Meteorological Observatory Typhoon Network (http://Typhoon.nmc.cn/web.html). To verify the model results and assess its ability to capture pCO2sea characteristics, monthly average pCO2sea retrieval data from 2003 to 2019 with a spatial resolution of 1 km (https://zenodo.org/records/7743187), provided by Song et al (2023), were used.
2.2. Model settings
As figure 1 shows, this study utilized a coupled model (Luo et al 2023) based on the Coupled Ocean-Atmosphere-Wave-Sediment Transport modeling system. The model consists of a Weather Research Forecasting (WRF) module for the atmosphere and a Regional Ocean Modeling System (ROMS) module for the ocean (Warner et al 2008, Warner et al 2010). The WRF domain covers the Pearl River Watershed and northern part of the South China Sea, with a horizontal resolution of approximately 12 km. The ROMS domain includes the northern part of the continental shelf of the South China Sea and Pearl River Estuary, with a horizontal grid spacing ranging from 2.8 km to 40.7 km and an average resolution of approximately 4 km. The model had 30 vertical layers with a higher resolution near the surface and bottom boundaries. The vertical s-coordinate function was based on Shchepetkin and McWilliams (2009). The physical model used a recursive Multidimensional Positive Definite Advection Transport Algorithm three-dimensional advection scheme for tracers, fourth-order horizontal advection of tracers, third-order upwind advection of momentum, and the vertical mixing turbulence closure scheme of Mellor and Yamada (1982). The viscosity/diffusion coefficient for second-harmonic level mixing was set to 10−5 m2s−1. The numerical integration had an internal mode time step of 900 s and an external mode time step of 60 s, as determined by the Courant–Friedrichs–Lewy criterion. The Model Coupling Toolkit facilitates the interaction between WRF and ROMS. WRF transfers fluxes to ROMS, including variables such as sensible heat fluxes, precipitation fluxes, surface stress components, and surface pressure. ROMS provides SST information to WRF. Furthermore, this model is coupled with a nitrogen cycle model that considers carbonate chemistry (Fennel et al 2006, 2008, 2011).

Figure 1. The average distribution of summer pCO2sea (shading), the research area (black box), the vertical section (red line) chosen in this study and the spatial extent covered by WRF and ROMS models.
Download figure:
Standard image High-resolution imageFigure 1 indicates that in the northern coastal area of the South China Sea, the pCO2sea in nearshore waters is lower than that in the inner estuary and offshore waters. This difference may be attributed to the intricate biological processes in this area (Song et al 2023). Therefore, we selected the coastal waters of the Pearl River Estuary as our research region. The area enclosed by the black dashed line represents the selected study area, while the red line represents the vertical profile line positioned at the center of the region.
2.3. Controlling factors of pCO2sea and CO2 fluxes
This study examines the impact of temperature and non-temperature factors on the pCO2sea during typhoons, based on the research conducted by Takahashi et al (2002):
We represented the changes in pCO2sea caused by non-temperature and temperature effects using the variables npCO2nt and npCO2, respectively. The term pCO2sea refers to the partial pressure of CO2 at the ocean surface, whereas SST represents the SST in degrees Celsius. The subscript 'mean' indicates the average value.
During a typhoon, factors such as SST, Dissolved Inorganic Carbon (DIC), Total Alkalinity (TA), and SSS can be altered, leading to changes in the pCO2sea through vertical mixing (Takahashi et al 2002, 2009, McKinley et al 2006, Ji et al 2022). To determine the factors controlling the changes in pCO2sea during the typhoon period, the following equation was used (Takahashi et al 1993):
where dpCO2sea is the change in pCO2sea, and T, ALK, S denote SST, TA, and SSS, respectively.
The effect of each factor on pCO2sea can be determined by the thermodynamics of seawater CO2 (Takahashi et al 1993).


Air‐sea CO2 fluxes ( ) in the model was calculated as follows:

where K is the gas transfer velocity and KH is the solubility of CO2 in seawater (Weiss 1974, Wanninkhof 1992). pCO2sea and pCO2air are the partial pressures of CO2 in the ocean and the atmosphere, respectively. A positive  indicates fluxes of CO2 from the ocean to the atmosphere, meaning that the ocean acts as a source of CO2 to the atmosphere. Conversely, negative
  indicates fluxes of CO2 from the atmosphere to the ocean, indicating that the ocean acts as a CO2 sink.
2.4. MAPE and weighted average
We employed MAPE to assess the disparity between the model results (ysim) and inversion data (y i ) within the selected study area:

We used the weighted average method to calculate time series:
where Xi represents the value at each grid point of model outputs, Ai is the corresponding area of each grid point, n is the total number of grid points.
3. Results
3.1. Model evaluation
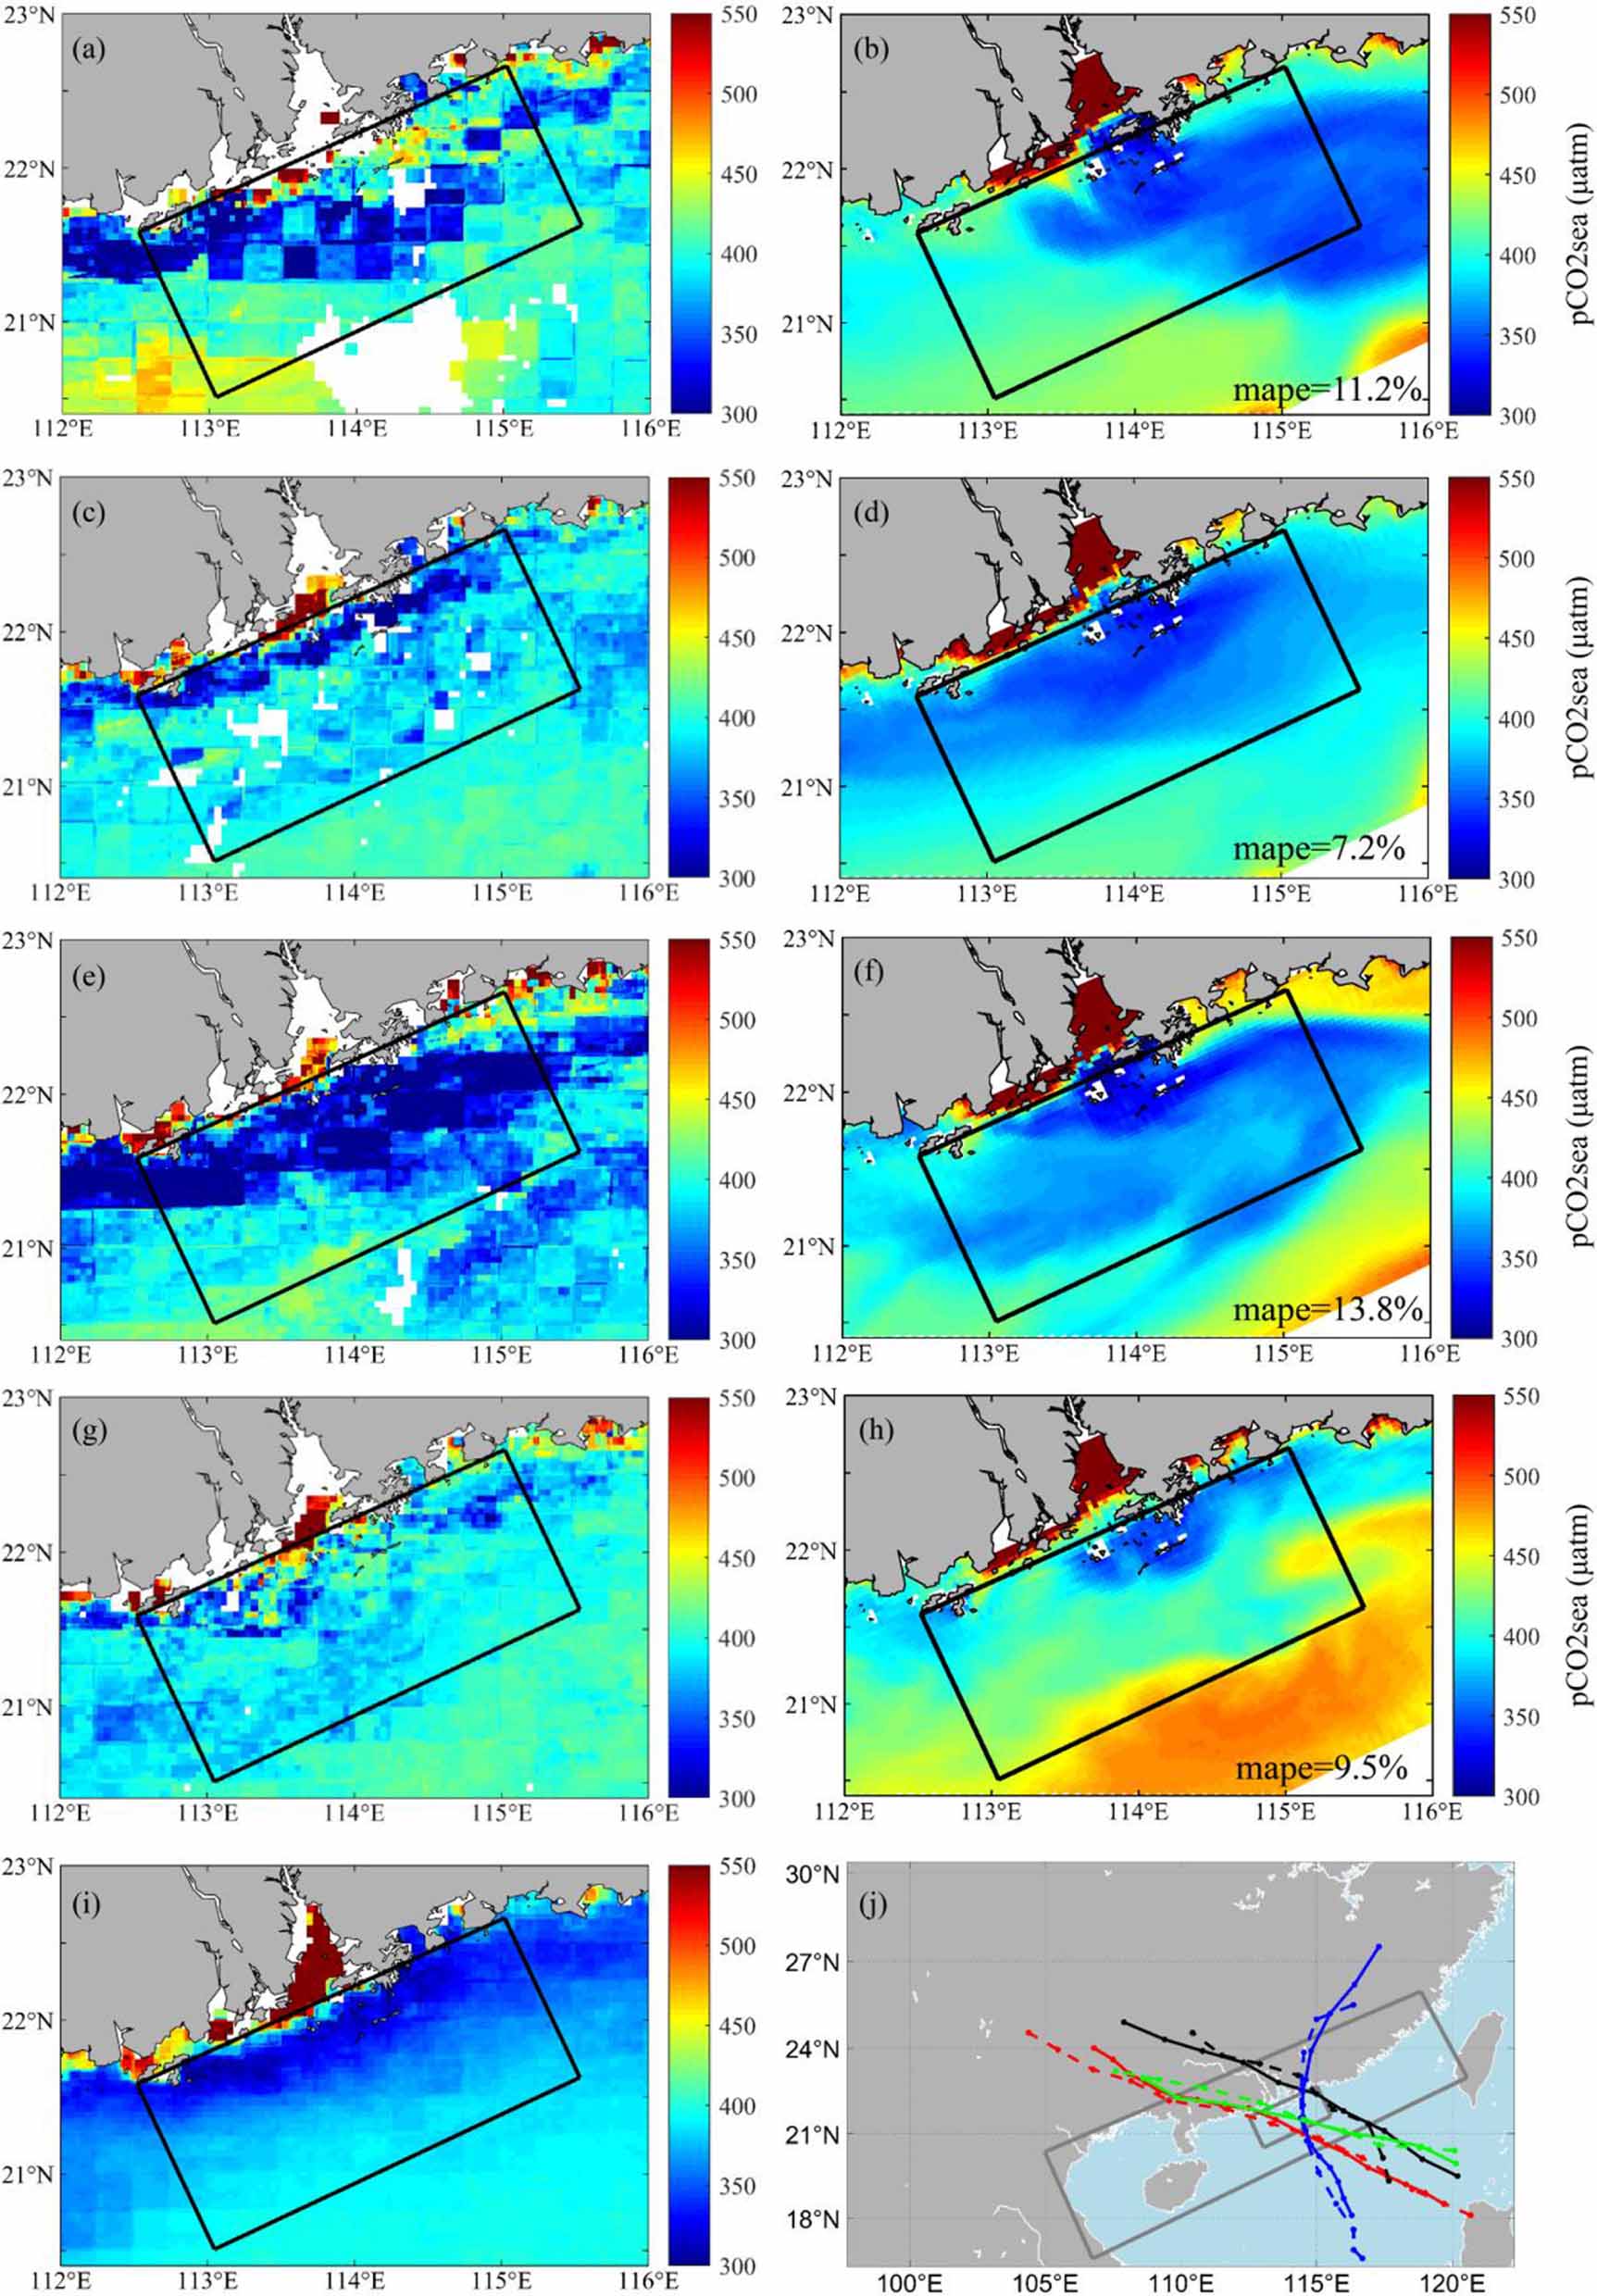
Previous studies have demonstrated a good performance in the physical and ecological simulations of our model (Luo et al 2023). In this study, we compared the simulated typhoon paths with the observed typhoon paths and used inverted ocean pCO2sea data to further evaluate the simulation ability of the coupled model. The results are shown in figure 2.

Figure 2. (a) average inverted pCO2sea in August 2016, (b) average simulated pCO2sea in August 2016, (c) average inverted pCO2sea in June 2017, (d) average simulated pCO2sea in June 2017, (e) average inverted pCO2sea in August 2017, (f) average simulated pCO2sea in August 2017, (g) average inverted pCO2sea in September 2018, (h) average simulated pCO2sea in September 2018, (i) inverted summer-averaged climate state pCO2sea, (j) four typhoon paths of simulation (solid lines) and observation (dashed lines), typhoon Hato (green line), typhoon Mangkhut (red line), typhoon Nida (black line) and typhoon Merbok (blue line).
Download figure:
Standard image High-resolution imageThe simulated paths of typhoons are in good agreement with the observations (figure 2(j)). Typhoons Hato and Mangkhut mainly pass through the left side of the Pearl River Estuary, whereas typhoons Nida and Merbok mainly pass through the right side of the estuary. Both inverted and simulated data indicate that the pCO2sea is high in the inner Pearl River Estuary and offshore waters and low in nearshore waters (figures 2(a)–(j)). These results demonstrate that the coupled model can effectively capture the spatial variations of the pCO2sea. It is worth noting that the simulated pCO2sea by the coupled model appears to be slightly higher than the inversion data, especially at the boundaries. This discrepancy may be attributed to a deficiency in oceanic boundary conditions.
3.2. Spatial variation of pCO2sea and CO2 fluxes in northern coastal area of the South China Sea during typhoons passage
As shown in figure 3, three time periods were determined for the analysis: when the typhoon entered the study area, when the typhoon was in the study area, and when the typhoon left the study area.

Figure 3. The spatial distribution of wind (a), (e), (i), CO2 fluxes (b), (f), (j), pCO2sea (c), (g), (k), SST (d), (h), (l) when the typhoon Hato just entered the study area (a)–(d), the typhoon was in the study area (e)–(h), and the typhoon just left the study area (i)–(l).
Download figure:
Standard image High-resolution imageWhen Typhoon Hato entered the study area, the distribution of CO2 fluxes was uniform, and the study area was a weak CO2 source (figure 3(b)). When Typhoon Hato was in the study area, the entire study area became a stronger source of CO2 (figure 3(f)), and became a weak CO2 source when Typhoon Hato left the study area (figure 3(j)). Throughout all three periods, the pCO2sea values were high near Lingdingyang Bay (figures 3(c), (g) and (k)), possibly because of the effect of carbon-rich water from the Pearl River Estuary. When Typhoon Hato was in the study area, there was an obvious increase in pCO2sea and CO2 fluxes. During this period, the temperature of nearshore waters drops more significantly than that of offshore waters.
When typhoon Mangkhut entered the study area, the distribution of sea-air CO2 fluxes was uniform, and the study area was a weak CO2 source overall (figure 4(b)). When the typhoon was in the study area, with a lower wind speed and corresponding smaller CO2 fluxes at the center of the typhoon, the entire study area became a strong CO2 source (figure 4(f)). When the typhoon left the study area, it became a weak CO2 source. When typhoon Mangkhut entered the study area, the pCO2sea in coastal waters was lower than that in offshore waters. During the typhoon's presence, there was a uniform increase in the pCO2sea, accompanied by an even drop in temperature, which is different from typhoon Hato.
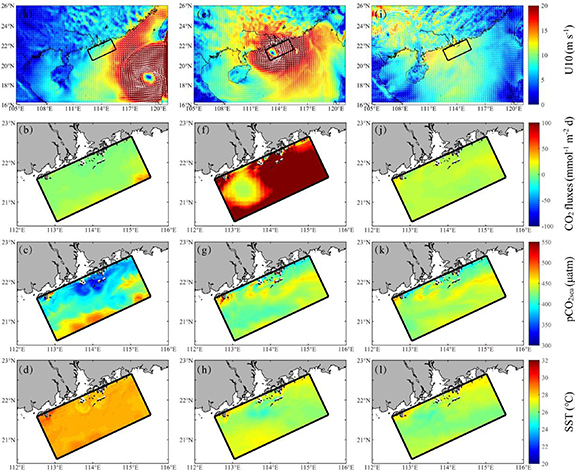
Figure 4. The spatial distribution of wind (a), (e), (i), CO2 fluxes (b), (f), (j), pCO2sea (c), (g), (k), SST (d), (h), (l) when the typhoon Mangkhut just entered the study area (a)–(d), the typhoon was in the study area (e)–(h), and the Typhoon just left the study area (i)–(l).
Download figure:
Standard image High-resolution imageAs shown in figure 5, when Typhoon Nida was in the study area, the entire area was a strong CO2 source. The eastern part of the study area exhibits a more pronounced transfer of CO2 from the ocean to the atmosphere. When the typhoon left the study area, it became a weak CO2 source. During this period, pCO2sea increased in the eastern part of the study area and slightly decreased in the western part; the decrease in SST was more significant in the eastern part of the nearshore waters. This could be because the typhoon mainly passed through the eastern side of the study area, resulting in stronger upwelling of deep water in the eastern part.
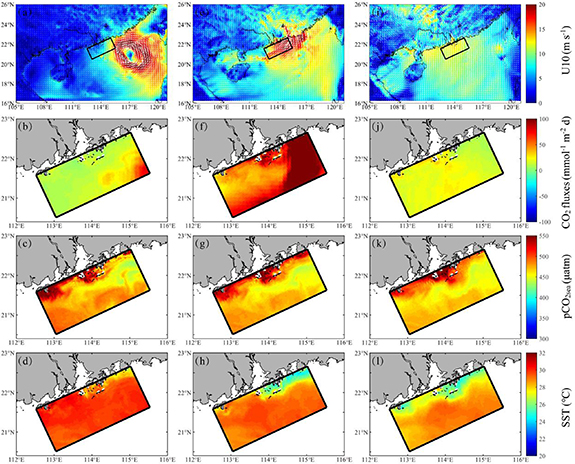
Figure 5. The spatial distribution of wind (a), (e), (i), CO2 fluxes (b), (f), (j), pCO2sea (c), (g), (k), SST (d), (h), (l) when the typhoon Nida just entered the study area (a)–(d), the typhoon was in the study area (e)–(h), and the typhoon just left the study area (i)–(l).
Download figure:
Standard image High-resolution imageWhen Typhoon Merbok entered the study area, the study area was a weak CO2 source overall, became a stronger CO2 source when the typhoon was in the study area, and then recovered to a weak CO2 source when the typhoon left (figure 6). Notably, the CO2 fluxes were lower in the center of the typhoon, where the wind was weak. When Typhoon Merbok entered the study area, the pCO2sea in the nearshore waters was lower than that in the offshore waters. When the typhoon left, there was a more significant increase in the pCO2sea on the eastern side of the nearshore waters. In addition, more significant changes in SST were observed in the eastern part of the study area.

Figure 6. The spatial distribution of wind (a), (e), (i), CO2 fluxes (b), (f), (j), pCO2sea (c), (g), (k), SST (d), (h), (l) when the typhoon Merbok just entered the study area (a)–(d), the typhoon was in the study area (e)–(h), and the typhoon just left the study area (i)–(l).
Download figure:
Standard image High-resolution image3.3. Temporal changes in pCO2sea and CO2 fluxes in in northern coastal area of the South China Sea during typhoons passage
Before the passage of the typhoon, there was a positive correlation between temperature and pCO2sea for Hato, Nida, and Merbok, but the situation was different for Typhoon Mangkhut (figure 7). One possible reason for this difference is that the pCO2sea of the open ocean is higher than that in the study area. Before the passage of Typhoon Mangkhut, high pCO2sea seawater from the open ocean flowed into the study area, causing a dilution of chla and a reduction in carbon consumption in the surface seawater, which resulted in a slight increase in pCO2sea when the SST decreased. However, the specific reasons for this phenomenon require further investigation. In addition, U10 varied from 5 to 10 m s−1, and the CO2 fluxes ranged from 0 to 10 mmol−1m−2d−1. Generally, this region was a weak source of CO2 during this period.

Figure 7. During typhoon Hato (a), (b), typhoon Mangkhut (c), (d), typhoon Nida (e), (f) and typhoon Merbok (g), (h), time series of pCO2sea, SST, wind of 10 m (U10), average of 24 h U10, and CO2 fluxes. Red dashed lines mark the period when typhoon passes the study area.
Download figure:
Standard image High-resolution imageDuring the passage of typhoons, npCO2nt increased, while npCO2 decreased (figure 8), which means that pCO2sea driven by temperature increased, while pCO2sea driven by non-temperature factors decreased.
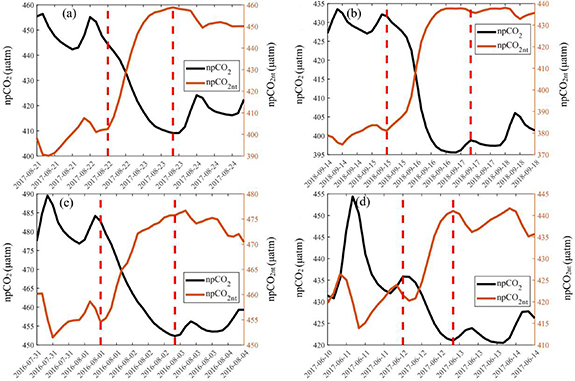
Figure 8. During typhoon Hato (a), typhoon Mangkhut (b), typhoon Nida (c) and typhoon Merbok (d), time series of pCO2sea changes driven by temperature (npCO2) and non-temperature factors (npCO2nt). Red dashed lines mark the period of typhoon passes the study area.
Download figure:
Standard image High-resolution imageIt is worth noting that, as the wind speeds increased and decreased, the typhoons seemed to have a two-step impact on the pCO2sea and CO2 fluxes (figure 8). In the first phase, during the initial passage of typhoons, the region experienced lower CO2 content and higher SST. As U10 increased, the CO2 fluxes increased. During this period, pCO2sea increased for Hato, Mangkhut, and Merbok, whereas pCO2sea decreased with fluctuations in typhoon Nida. In the second step, the concentration of CO2 on the sea surface increased, the SST had already cooled to some extent, and the U10 and CO2 fluxes also decreased. The growth of pCO2sea slowed down for typhoons Mangkhut and Merbok, while the pCO2sea showed a slight decrease for typhoon Hato. However, Typhoon Nida consistently caused a smooth decrease in pCO2sea. Overall, the influence of the non-temperature factors on the change in pCO2sea in the first step was more significant than that in the second step.
Notably, the pCO2sea and npCO2nt levels initially decreased and then increased for typhoon Merbok. Additionally, when npCO2nt increased, pCO2sea continued to decrease for a short period. This suggests that SST played a primary role in pCO2sea during the initial limited time period of Typhoon Merbok. Furthermore, there was no significant slowdown in the temperature-induced pCO2sea relative to non-temperature factors during the second step of Typhoon Nida (figure 8), indicating that SST may not only be affected by deeper water but may also be influenced by other factors such as heavy rainfall, which could cause a decrease in SST (Deng et al 2019, Feng et al 2021).
Considering the entire process, except for typhoon Nida, pCO2sea increased, with non-temperature factors having a more significant impact on pCO2sea than temperature factors. In addition, the region acts as a significant CO2 source during typhoons.
After the passage of typhoons, pCO2sea increased and showed a positive correlation with SST, indicating that SST was the main factor in the change in pCO2sea. The U10 and CO2 fluxes decreased to a lower positive value, indicating that the study area was restored to a weak CO2 source. However, neither pCO2sea nor SST fully recovered within 36 h of the typhoon's passage.
4. Discussions
4.1. The controlling factors of pCO2sea during typhoons passage
Changes in pCO2sea are primarily influenced by temperature, DIC, TA, and salinity (Takahashi et al 1993). DIC, TA, and salinity increased with depth, whereas temperature decreased. During the passage of typhoons, vertical mixing and coastal upwelling occurred (figure 9), which could transport CO2-rich and cool deep water to the surface. Coastal upwelling could bring lower temperatures deeper water to the nearshore (figure 9). Coastal upwelling was more pronounced during typhoons Hato, Nida, and Merbok, while vertical mixing was more pronounced during Mangkhut. This explains why temperature changes along the coast were higher than those in the offshore waters during Typhoons Hato, Nida, and Merbok, while SST changes were more uniform during Typhoon Mangkhut (figures 3–6).
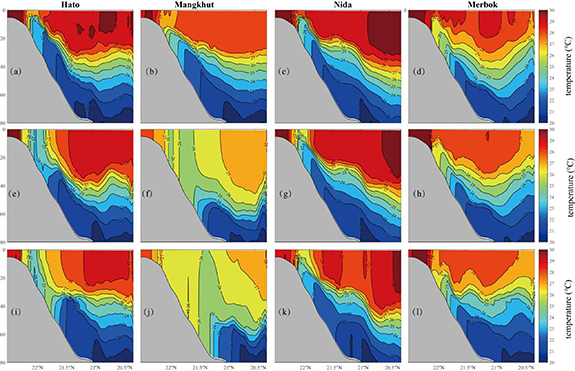
Figure 9. The vertical temperture (shading and contour) of typhoon Hato (a), (e), (i), typhoon Mangkhut (b), (f), (j), typhoon Nida (c), (g), (k) and typhoon Merbok (d), (h), (l) during three points in time: when the typhoon just entered the study area (a)–(d), the typhoon was in the study area (e)–(h), and the typhoon just left the study area (i)–(l).
Download figure:
Standard image High-resolution imageFor typhoon Hato, the cooling of surface seawater resulted in a decrease of 35 μatm in the surface pCO2sea. The changes in pCO2sea caused by DIC and TA were +120 and −100 μatm, respectively. SSS caused an increase of 30 μatm in the pCO2sea (figures 10(a)–(d)). The ratios of the changes in pCO2sea caused by DIC, TA, and SSS to those caused by SST were 3.4, 2.9, and 0.9, respectively.
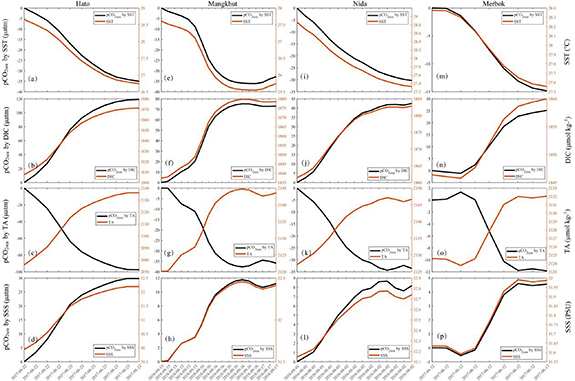
Figure 10. Contributions of (a), (e), (i), (m) SST, (b), (f), (j), (n) DIC, (c), (g), (k), (o) TA, and (d), (h), (l), (p) SSS to pCO2sea during typhoon Hato (a)–(d), typhoon Mangkhut (e)–(h), typhoon Nida (i)–(l) and typhoon Merbok (m)–(p).
Download figure:
Standard image High-resolution imageFor Typhoon Mangkhut, the cooling of surface seawater caused a decrease in pCO2sea of 37 μatm. Surface DIC and TA contributed to a +72 and −37 μatm change in pCO2sea, respectively, whereas salinity caused a +11 μatm change inpCO2 (figures 10(e)–(h)). Furthermore, the ratios of changes in pCO2sea caused by DIC, TA, and salinity to those caused by SST were 1.9, 1.0, and 0.3, respectively.
For Typhoon Nida, the cooling of the surface seawater led to a decrease in pCO2sea by 30 μatm. The changes in pCO2sea by surface DIC and TA were 43 and −34 μatm, respectively. Additionally, SSS caused a change of 8 μatm in the pCO2sea (figures 10(i)–(l)). Furthermore, the ratios of the changes in pCO2sea caused by DIC, TA, and salinity to those caused by SST were 1.4, 1.1, and 0.3, respectively.
For Typhoon Merbok, the cooling of the surface seawater led to a decrease in pCO2sea by 14 μatm. Surface DIC and TA contributed to +25 and −12 μatm change in pCO2sea, respectively. Salinity caused a +4.5 μatm change in pCO2sea (figures 10(m)–(p)). The ratios of the changes in pCO2sea caused by DIC, TA, and salinity to those caused by SST were 1.8, 0.9, and 0.3, respectively.
Overall, during the passage of typhoons, pCO2sea driven by DIC and TA continuously increased, whereas pCO2sea driven by TA and SST continuously decreased. Specifically, typhoon Nida caused a decrease in pCO2sea (figure 7), and the increased amplitude of pCO2sea driven by SST was similar to that driven by TA, suggesting that both TA and SST were important factors in the change in pCO2sea. Conversely, for typhoons Hato, Mangkhut, and Merbok, pCO2sea increased continuously (figure 7), and the changes in pCO2sea driven by DIC were significantly greater than those driven by SSS, which indicates that DIC played a more prominent role in the changes in pCO2sea.
Interestingly, for typhoon Hato, the ratio of the variation amplitude of pCO2sea caused by DIC, TA, and SSS to the variation amplitude of pCO2sea caused by SST was significantly higher than that of typhoon Mangkhut. This suggests that these non-temperature factors played more significant roles during Typhoon Hato than during Typhoon Mangkhut. Except for the initial oceanic conditions, this difference is also possibly due to the stronger vertical mixing during the passage of typhoon Mangkhut, whereas coastal upwelling was more pronounced during the passage of typhoon Hato (figures 3, 4 and 9). Coastal upwelling initially intensified and then weakened, with a vertical displacement of deep coastal waters, contrasting the vertical mixing of surface and deep waters. Furthermore, in terms of vertical distribution, DIC, TA, and SSS were higher along the coast than offshore at the same depth (figure 11). Coastal upwelling brought higher DIC, TA, and salinity to the nearshore ocean surface than vertical mixing.
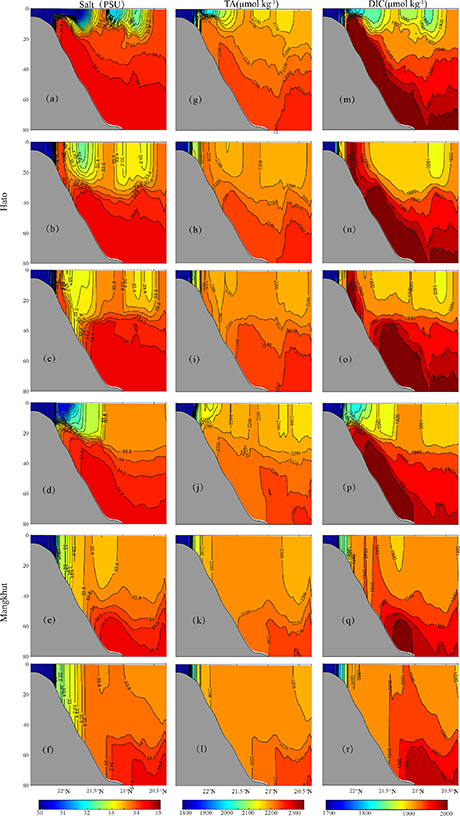
Figure 11. Vertical distribution of DIC, TA, salt of typhoon Hato (a), (b), (c), (g), (h), (i), (m), (n), (o) and Mangkhut (d),(e), (f), (j), (k), (l), (p), (q), (r) during three points in time: when the typhoon just entered the study area (a), (g), (m), (d), (j), (p), the typhoon was in the study area (b), (h), (n), (e), (k), (q), and the typhoon just left the study area (c), (i), (o), (f), (l), (r).
Download figure:
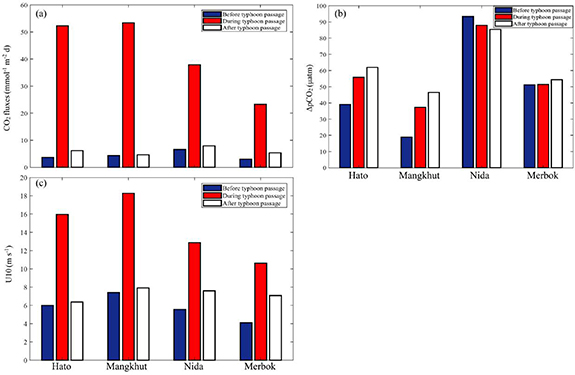
Standard image High-resolution image4.2. The effect of typhoons on CO2 fluxes
The impacts of the four typhoons on the CO2 fluxes were significant. Before the passage of typhoons, the fluxes were approximately 5 mmol−1 m−2d−1, increased to a range of approximately 23–54 mmol−1 m−2d−1 during the passage of typhoons, and then decreased to approximately 6.0 mmol−1 m−2d−1 after typhoons passage. The maximum average CO2 flux occurred during typhoon passage and increased approximately 6–14 times than that before typhoon passage (figure 12(a)). However, the change in ΔpCO2 (pCO2sea-pCO2air) during the typhoon passage did not always increase (figure 12(b)). For example, ΔpCO2 increased during the passage of typhoons Hato and Mangkhut, but slightly decreased during Typhoons Nida and Merbok. However, U10 always increased during the passage of typhoons (figure 12(c)). Therefore, the increase in CO2 flux during the passage of typhoons is primarily due to the increase in wind speed (U10).
Figure 12. Changes of CO2 fluxes (a),  pCO2 (b), U10 (c) during three period: before typhoon passage, during typhoon passage, and after typhoon passage for four typhoons.
Download figure:
Standard image High-resolution image
Overall, although each typhoon has its own characteristics and may have different impacts on the pCO2sea and CO2 fluxes, these four typhoons significantly increased the amount of CO2 emissions.
5. Conclusion
This study is the first to examined the impacts of typhoons (Hato, Mangkhut, Nida, and Merbok) on the pCO2sea and CO2 fluxes in the relatively nutrient-rich northern coastal region of the South China Sea. Due to limited observational data, a three-dimensional coupled model was employed for analysis. The results demonstrate that the model effectively replicates the spatial distribution of pCO2sea in this area. The main findings for the study region are as follows:
- 1.The response of pCO2sea to typhoons is influenced not only by typhoon-induced vertical mixing and initial ocean conditions but also by typhoon-induced coastal upwelling. Coastal upwelling is more pronounced during typhoon Hato passages, while vertical mixing is more prominent during typhoon Mangkhut passages. Coastal upwelling can transport a greater amount of DIC, TA, Salt, and cold deep-water to the nearshore ocean surface compared to vertical mixing, potentially resulting in higher pCO2sea changes compared to offshore waters.
- 2.Before the passage of typhoons, the daily pCO2sea cycle closely followed the daily temperature cycle, suggesting that the temperature played a primary role. During typhoon Nida, pCO2sea decreased with TA and SST being the primary factors. However, for typhoons Hato, Mangkhut, and Merbok, pCO2sea increased as DIC played a more prominent role. Overall, non-temperature factors are more likely the main drivers of pCO2sea variations in the northern coastal waters during typhoons passage. After the passage of typhoons, temperature generally plays a primary role in controlling the pCO2sea, including its daily cycle.
- 3.The model results suggest that during the passage of typhoons, increased wind speeds significantly affected CO2 fluxes, resulting in increased CO2 emissions. The average CO2 fluxes during the passage were approximately 6–14 times higher than those before typhoon passage.
The current research lacks sufficient short-term data on pCO2sea and CO2 fluxes, one solution is to estimation them using machine learning. Additionally, it is important to study the specific impacts of different typhoons on air-sea feedback and ecological changes in the northern South China Sea.
Acknowledgments
We appreciate the support of the Southern Marine Science and Engineering Guangdong Laboratory (Zhuhai) (Grant No. SML2023SP219), National Key R&D Program of China (Grant No. 2023YFF0805500), the State Key Laboratory of Tropical Oceanography Independent Research Fund (Grant No. LTOZZ2103), National Natural Science Foundation of China (Grant No. 42076025).
Data availability statement
No new data were created or analyzed in this study.
Conflict of interest
The authors have no relevant financial or non-financial interests to disclose.