

Abstract
Over the last 30 years, more than 150 different drivers of forest area development have been investigated in peer-reviewed statistical analysis of the environmental Kuznets curve for deforestation (EKCd) and the forest transition hypothesis (FTH). However, there is no synthesis which of these drivers significantly contribute to changes in forest land expansion, like deforestation and forest recovery. To fill this gap, we conducted a systematic review of the scientific literature dealing with statistical analysis of drivers of forest area development under the concepts of EKCd and FTH. We referred to peer-reviewed articles, preselected by the evidence and gap map of Tandetzki et al 2022 Environ. Res. Lett.17 123005. From these selected articles we identified 85 relevant studies and extracted the applied model specifications. We found differences among studies in variable specifications of the dependent variable (expressions of forest area development) and the choice of independent variables (drivers) as well as in the choice of geographical scope and the concept used (EKCd and FTH). For further analysis, we extracted all drivers used to explain forest area development in the different studies and assigned them to 12 thematic categories (e.g. income factors or institutional factors). Our results show that the main underlying drivers of deforestation are related to income, demographics, trade, and institutional factors. The forest transition phenomenon is mainly described by drivers directly influencing forest area (e.g. expansion of agricultural land) and demographic trends. The heterogeneity and universality of the concepts of EKCd and FTH is not clearly evident even when separating different study groups. By isolating and discussing individual drivers of forest area development, our findings support future research dedicated to the analysis and projection of global forest area dynamics.
Export citation and abstract BibTeX RIS

Original content from this work may be used under the terms of the Creative Commons Attribution 4.0 license. Any further distribution of this work must maintain attribution to the author(s) and the title of the work, journal citation and DOI.
1. Introduction
The Food and Agriculture Organization of the United Nations (FAO) estimates global deforestation between 1990 and 2020 at around 420 million hectares (FAO 2020). Mitigated by simultaneous re- and afforestation, FAO estimates the actual net deforestation during this period at about 178 million hectares. In other words, within three decades net global forest area has shrunk by 4.2% of its former size. To hold this development and to shape future options for action, it is crucial to understand the complex and interwoven factors influencing forest area development (Caravaggio 2020b). From an economic point of view, the 'grand theories of deforestation' (Indarto 2016, p 111) try to explain global forest area dynamics as a function of socio-economic variables. In this context, economic concepts like the environmental Kuznets curve (EKC) and the forest transition hypothesis (FTH) became famous over the last 30 years.
The relationship between inequality and income was first described by Simon Kuznets (1955), leading to the name 'Kuznets curve' (Kuznets 1955). Approximately 50 years later Grossman and Krueger (1991) applied the concept to investigate the effect of economic growth on environmental degradation. Since then, numerous authors applied the concept to forests to test the hypothesis of a curve linear relationship between economic development and deforestation. The classic environmental Kuznets curve for deforestation (EKCd) resembles an inverted U-shape relation between the rate of deforestation and income, e.g. GDP per capita (GDP pc) (Panayotou 1993). In the course of the last decades, the scope of available data sets providing independent economic variables (e.g. GDP pc growth rate of Djibouti only available from 2013 onwards in the World Bank (2023)) has expanded, as has access to statistical programs that can be used to apply various statistical estimation methods. This led to a diversification of the estimation studies published to test the EKCd hypothesis. In addition, databases reporting on forest area changes (e.g. FAO) improved so that enhanced records became available for more countries and regions (Romijn et al 2015, FAO 2020). In retrospect, studies like Bhattarai and Hammig (2004), Combes Motel et al (2009), Andrée et al (2019) and Ajanaku and Collins (2021) confirm the EKCd hypothesis. However, others, e.g. Bandyopadhyay and Shafik (1992), Nguyen Van and Azomahou (2007) and Cary and Bekun (2021) find no evidence for the EKCd hypothesis.
The FTH was first described by Mather in (1992). In the initial form of this concept, time serves as proxy for mixed socio-economic drivers which determine forest area development describing a transition from forest area decline to forest recovery. Later, Rudel et al (2005) introduced economic development and forest scarcity as two main pathways behind forest transition dynamics. Based on Rudel et al (2005), Lambin and Meyfroidt (2010) added globalization, state forest policy, and smallholder land use involving tree planting management as drivers to explain the forest transition phenomenon. While the phenomenon of forest transition was initially analyzed mainly by geographers and social scientists, economic perspectives were added later (Barbier et al 2017).
The concepts of EKCd and FTH both aim to explain forest area development and bear notable resemblance as elaborated in detail by Caravaggio (2020b). The economic development driving the EKCd can be associated with the chronological time describing the FTH progression (Caravaggio 2020a). Assuming this association, the increase in deforestation rate with GDP in the EKCd (ascending branch of the inverted U-shape curve), corresponds to the descending slope of the FTH curve, where forest cover decreases over time. This turning point of the EKCd curve, corresponds to the first inflection point of the FTH. After the turning and inflection point, deforestation and forest area decline continue under both concepts. At the lower bottom of the FTH curve, deforestation no longer takes place. This corresponds to the point where the EKCd curve intersects the zero point. The inflection point of the FTH curve here initiates the phase of forest recovery and reforestation. This final phase of forest recovery is not specified by the original EKCd concept (Angelsen 2007). Caravaggio (2020b), however, argues, that a continuation of the U-shape curve into negative territory, would express the reforestation phase of the FTH.
Other authors, however, argue that the two concepts are not fully consistent because the assumed drivers (time and economic development) are different, and the phase of severe deforestation of EKCd and the phase of forest recovery described by the FTH are not reflected by the other concept (Angelsen 2007).
Based on the theoretical assumptions of these concepts, a considerable number of publications mathematically estimated the relation between various drivers and forest area development, expressed e.g. as rate of deforestation, forest area change or forest cover change (Choumert et al 2013, Leblois et al 2017, Caravaggio 2020b, Tandetzki et al 2022, MacDonald 2023). The large body of literature on quantitative estimation of EKCd and FTH is supplemented by literature reviews and meta analyses as carried out by, e.g. Choumert et al (2013) and Caravaggio (2020b) comparing the individual articles. In this context, the EKCd was analyzed and applied much more frequently than the FTH (Tandetzki et al 2022). Most of the literature presents empirical estimations for limited sets of countries and is restricted to relative short time periods. Literature findings have yielded inconsistent results and neither concept has been proven globally (compare Caravaggio (2020a), Choumert et al (2013), Meyfroidt and Lambin (2011)). Rather, the applied econometric estimation approaches to curve regression differ widely, and model specifications differ in the variable definitions used to represent forest area development (dependent variable) and its drivers (independent variables).
Past examinations and ongoing research on the concepts of EKCd and FTH show that a universally valid set of explanatory variables to explain forest area development adequately has not yet been identified (Caravaggio 2020b). Another approach to further develop the EKCd concept, in addition to the inclusion of suitable variables, is the supplement of the quadratic function by a third order (Caravaggio 2020a, 2020b). The studies of, e.g. Bhattarai and Hamming (2001), Managi (2006), Halkos and Skouloudis (2020) and Murtazashvili et al (2019) have already followed this direction by analyzing the cubic impact of income on forest area development.
Although numerous qualitative and quantitative reviews have been conducted on these concepts and many econometric studies tried to improve the explanatory power of the estimations, a thorough analysis of the common success and failures is still missing. In this study, we build upon the evidence and gap map (EGM) of Tandetzki et al (2022). The EGM transparently collects and systematically outline research literature to identify voids in research and categorizes findings from which further in-depth reviews can be conducted. In this manner, Tandetzki et al (2022) systematically searched and selected relevant peer-reviewed articles. This present in-depth review applies the article selection of as a starting point, updates the literature search till 2023 and employs the method of a systematic literature review to the selected articles. Thus, the EGM conducted by Tandetzki et al (2022) and this present study are related in the sense that they build on the same search strategy. While the EGM maps relevant articles, this subsequent systematic review goes further by analyzing relevant content and studies within the articles and their findings (Haddaway et al 2018). By doing so, this present systematic review systematically assesses the numerous mathematical estimation studies that have been applied by in the past under the concepts of EKCd and FTH, and assesses their specifications.
Special focus is put on the independent variables applied to explain forest area development. This systematic review systematically examines the drivers of forest area development identified by mathematical estimation studies in the literature. The objective is, in contrast to the previous EGM by Tandetzki et al (2022), to determine whether the literature provides an overarching, conclusive picture of the drivers of forest area development or whether different patterns of influence emerge, e.g. between the two forest area development concepts (EKCd and FTH), in different geographic regions, or due to different specifications of the estimation models used. Therefore, in the descriptive analysis of this systematic review influencing factors identified in the literature are systematically analyzed and sorted according to (a) basic (simplified models) and advanced (extended models) studies, (b) the regions studied, (c) the specification of the dependent variable, (d) the considered concept (EKCd and FTH), and (e) the statistical estimation method. As the differentiation of estimation methods is very heterogeneous, both between and within concepts, we did not only consider the separate concepts but also delve deeper into the study designs. To accomplish this, we offer materials and methods in section 2. Subsequently, we present our findings in section 3, and in section 4, we engaged in a thorough discussion of the results and formulated our conclusion.
2. Materials and methods
2.1. Systematic review
This systematic review follows the principle guidelines of the environmental evidence reporting standard 'RepOrting standards for Systematic Evidence Synthesis (ROSES)' (Haddaway et al 2017). In the sense of the ROSES guidelines, this study applies as a basis the article selection from the EGM published by Tandetzki et al (2022). Thereby, the EGM functions as research protocol and outlines the scope of research, the systematic search and selection strategy for relevant articles as well as the strategies for coding, and data extraction. In the present systematic review, the 46 articles identified as relevant by Tandetzki et al (2022) were used for further analysis. Additionally, before analyzing the content of these articles, an update of the article search was conducted to keep the article selection up-to-date. A brief overview of the basic methods used for carrying out the EGM and the update is given in section 2.2.
The EGM identifies which and how many articles have been published related to a particular topic, and, conversely, where there are publication gaps on the topic at article level. The EGM serves as an upstream methodological stage of the subsequent systematic review. The systematic review method is an comprehensive in-depth approach and synthesizes the evidence from the articles for a specific research question (Haddaway et al 2018). The differences between the EGM and a systematic review lie in the approach and purpose. The EGM represents the breadth and mass of literature on a topic, while a systematic literature review is focused on the depth and quality of the evidence and analyses the methodologies, assumptions, data and results extracted from the content of the articles.
While the EGM and its update identified the relevant research literature for the topic under consideration at the article level, the systematic analysis of the content of these articles is done in the present systematic review. Some articles contain several studies, e.g. different estimates of forest area development with different independent variables. To avoid multiplicity, we performed a study selection procedure as described in section 2.3 to extract relevant estimation studies from the preselected articles. After selecting all studies, we extracted the data, in particular the variations of the independent variables for each study, and then analyzed all studies comparatively. To accomplish this, we utilized a distinct data coding and extraction process (section 2.4) based on Tandetzki et al (2022) and a data grouping strategy (described in section 2.5) developed collaboratively within the author team of this systematic review.
2.2. Article selection
2.2.1. Summary of methodologies applied in the EGM
The basic EGM serves as a protocol for the systematic review and for article selection. Tandetzki et al (2022) applied a specific search string in Web of Science (Core Collection) and Scopus to search for articles that mathematically estimate EKCd and FTH. Relevant articles were identified in two screening stages based on pre-defined selection criteria. Out of approximately 2500 search results, 46 relevant articles were extracted.
The inclusion criteria applied for the article selection in the EGM refer to the study type and the study content: only peer-reviewed, English-language articles published after 1955 and before November 2020 were included. Eligible articles needed to (a) examine more than one country and (b) numerically estimate the influence of socio-economic variables on forest area development according to the concepts of EKCd or FTH.
The article screening process for the EGM included a first screening of the abstract, the title and the keywords, and a second full text screening of relevant articles. Further details on the research strategy can be found in Tandetzki et al (2022).
In the EGM, Tandetzki et al (2022) extracted 46 articles, with the majority (76%) exploring the EKCd concept. Articles that investigated the concept of the FTH or both concepts in a single article appeared almost equally often (in 11% and 13% of cases, respectively). Study designs were found to be highly heterogeneous, with global datasets being estimated most frequently. The dependent variables of the estimates were divided into six forest-related and two agriculture-related categories, with the variables 'rate of deforestation' being estimated most frequently. Nearly all, except five articles, examine income variables as explanatory variables. Tandetzki et al (2022) found that over time, the range of estimation methods has increased and developed from classical methods such as ordinary least squares (OLS) to more specific methods, e.g. pooled mean group (PMG) estimator.
2.2.2. Updating the database till 2022
In order to conduct the systematic review on an up-to-date database, we expanded the article selection of Tandetzki et al (2022). To accomplish this, we performed an identical search and article selection procedure as applied in the EGM for the years 2020 to August 2022. Our updated search identified 948 articles in both databases (Web of Science and Scopus). Following the two-stage screening process, we added 14 eligible articles to the article selection from 1955–2020.
2.2.3. Critical appraisal and final article selection
In order to examine the quality of the articles, related to the reproducibility of the estimated models, we systematically code critical questions about the comprehensibility and traceability of data source, methods used, selection of variables and theoretical rationales. The critical appraisal took place at the article level. Unlike the EGM by Tandetzki et al (2022), this systematic review examined studies within articles and not complete articles. Articles that did only present studies with qualitative comparisons of drivers, without estimating common cross-country quantitative elasticities, were therefore excluded for the present review (this applied to Paradis (2021), Zambrano-Monserrate et al (2018) and Liu et al (2017). Further, the articles of Imai et al (2018) and Koop and Tole (1999) were excluded, as they do not present the coefficients at the study level.
The final selection of articles is as follows: Tandetzki et al (2022) found 46 articles, the updated search till 2022 added 14 articles and the critical appraisal excluded 5 articles. At the end, a total of 55 articles was included in the further evaluation and analysis of the systematic review.
2.3. Study selection
In contrast to the previously conducted EGM (Tandetzki et al 2022), the analysis of results was conducted at the study level. Therefore, a selection of relevant studies under avoidance of multiplicity was conducted in this systematic review. Thus, the unit of analysis is the individual study, defined as the single estimate of forest area development contained in the selected articles. Forest area development can be expressed as forest area, forest cover, change in forest area/cover, deforestation rate or any other specification that expresses the development of forest area (decline or expansion). Different studies presented within one article can be independent from each other and consider for instance different geographical regions, but may also multiply the same study concept several times by just exchanging one control variable. Thus, careful study selection was necessary to neither omit a relevant study, nor include studies that face multiplicity (López-López et al 2018).
As shown in figure 1, we considered six types of differences in study design as selection criteria across the selected articles. The selection criteria were applied to extract only those studies, that are unique in their characteristics and do not cause multiplicity, which would bias the analysis results. Thus, if individual studies within one article do not overlap, as they, e.g. consider different country groups or different time periods, we included all of them. For example, if one article examines low, middle, and high-income countries in individual studies, we selected all three of them. But, if the article also provides a study analyzing all countries together, we preferred this study to the studies of the individual country groups (see figure 1). For studies that utilize the EKCd concept, we always selected studies that examined both income and income2 to fulfill concept's condition. However, if estimation methods are chosen that calculate a threshold, e.g. to satisfy the condition of the EKCd curve pattern, we considered those as well.
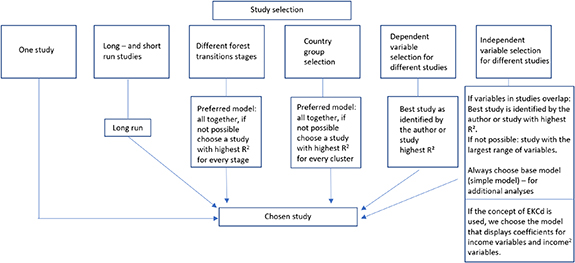
Figure 1. Study selection and criteria of chosen variables.
Download figure:
Standard image High-resolution image2.3.1. Selection of basic and advanced studies
There are two types of studies that we examined: basic studies and advanced studies. Basic studies examine the influence of few variables on forest area development. For instance, studies focusing on the concept of EKCd only must consider income and income2 variables to fulfil the basic needs of the concept (Grossmann and Krueger 1991) 3 . Several articles applied presented such a basic study in addition to an advanced study where more independent variables were added. The concept of FTH considers several drivers, but should estimate the influence of a maximum of two variables in order to meet the definition of a basic study in our case. Advanced studies, in turn, consider more than two variables (figure 1). By differentiating between the two types of studies, it was possible to make a statement about the power of the simplified basic studies. We used the R2 to assess if the basic studies explain forest area development statistically sufficient or whether improvements can be made by including additional variables in advanced studies. Due to the difficulties referring to multiplicity when comparing basic studies and advanced studies in one common analysis framework, we decided to analyze them in separate sections.
2.4. Data analysis strategy
The analysis objective is to provide an overview of the independent variables tested in estimation studies to explain forest area development. The analysis aims to show which variables and variable combinations have been tested significant and how this is influenced by variations of model and variable specifications, and input data applied. Variations were analyzed with regards to different regions considered, dependent variable definitions, statistical estimation methods chosen and forest area development concepts analyzed. Advanced studies were examined separately from basic studies (simple models).
Judging the influence of socio-economic drivers on forest area development by comparing the studies is challenging due to the diversity of methods and assumptions. On the basis of their heterogeneity, studies cannot be merged in a unified data frame. Thus, we compared them using descriptive analysis and refrained from further methods such as meta-analysis. As the studies are heterogenous regarding the study design ((a) the chosen region, (b) the dependent and their tested independent variables, (c) the chosen concept, and (d) the estimation method), we examined these criteria separately.
2.5. Data extraction and coding
The data extraction and coding strategy applied for this systematic review is based on prepared templates and was conducted in three screening steps (two on article level and one on study level). The screening procedures built on the methods applied and described in Tandetzki et al (2022). The data extraction within the screening steps is displayed in table 1.
Table 1. Overview data extraction and data coding strategy at the article and study level and for critical appraisal.
| Data extraction on article level | |
|---|---|
| Article ID | Forest development theory |
| Name of reviewer | Dependent variables |
| Bibliographic information | Independent variables |
| Type of evidence (e.g. peer-reviewed) | Assumed curve shapes |
| Studied regions | Statistical estimation methods |
| Studied periods | Support for development concepts |
| Data extraction on study level | |
| Identification of all tested variables | Identification of statistical method |
| Indication of estimation coefficients | Identification of support for development concepts |
| Identification of significance effects | |
| Data extraction on critical appraisal | |
| Data source | |
| Methods | |
| Variable selection | |
| Theoretical traceability | |
While the screen on article level revealed the evidence base of the targeted forest area development concepts, the screen on study level focuses explicitly on the targeted estimation models and the examination of independent variables. During the latter, we systematically extracted all independent variables applied in the studies selected and merge them into a prepared coding sheet (see table 1). We distinguished between tested and statistically significant variables. All tested variables were extracted, even if not significant, to determine the causal relationship between variable elimination and variable adding. In addition, the significance level stated for each independent variable in each study was noted. Variables were ordinally coded according to the following scheme: (i) '1' for tested and not significant, (ii) '2' for tested and significant at the 10% interval, (iii) '3' for tested and significant at the 5% interval, and (iv) '4' for tested and significant at the 1% interval (more information in supplementary material (Tandetzki et al 2023)). If a variable of the coding list was not considered in the study, it was coded with zero.
We also extracted the coefficients of the individual drivers, but due to their heterogenous nature, we did not analyze them further. The coefficients undergo significant changes influenced by the study design. A cross-sectional analysis across all studies was not feasible. We only examined the signs of the individual coefficients in relation to basic studies, as the limited number of independent variables in these studies allowed for comparison.
2.5.1. Categorizing of variables
In the considered studies over 150 different independent variables are applied. To facilitate interpretation of the results, we categorized independent variables into thematic categories of drivers. The individual variables applied in estimation models sometimes pursue the same causal explanation, but differ conceptually, e.g. different proxies are chosen for the same statement, or different units are chosen, e.g. GDP and GDP pc. We categorized such conceptually and content-wise similar independent variables into 12 thematic categories (drivers), as displayed in table 2. The variables were categorized into direct and underlying drivers, as suggested by Geist and Lambin (2001) for drivers of deforestation. The thematic categories applied in table 2 include both drivers of deforestation and forest recovery. All independent variables reported in the considered studies were assigned to the 12 categories listed in table 2. Further drivers described in literature like environmental awareness, cultural factors, or power and dependencies among individual countries (see, e.g. Estoque et al (2022) and Meyfroidt et al (2018)) were not found in any of the selected studies, and were thus not included in the categorization. Below the thematic categories, the most frequently applied individual variables are listed. In addition to the examples listed in table 2, we provide occasional examples of individual variables in the results section to show what specific variables make up the different categories.
Table 2. Thematic variable categories and attributions of the independent variables (pc = per capita).
| Proximate drivers | Underlying drivers |
|---|---|
| Direct area (land-use categories such as agricultural and forest, e.g. agricultural land area, arable land pc, initial forest area, planted forest area, proportion of land that is unsuitable for agriculture area) | Demographic (e.g. population density, rural population, population pressure, urbanization rate, total population, population per unit forest area) |
| Production forest land (specific variables that reflect the output on the forest area, e.g. charcoal production, labor per forest area, harvest as log of the volume of roundwood harvested) | Economic (e.g. poverty rate, FDI, bottom 40% income share, seigniorage) |
| Income (e.g. GDP pc, GNI, GDP, GDP growth rate) | |
| Institutional (e.g. democracy, government stability, political rights, civil freedom, political stability index, size of government, trust) | |
| Institutional economic (e.g. GINI coefficient, freedom to exchange in capital, debt level to GDP, freedom to exchange in capital, lending interest rate) | |
| Production agriculture land (e.g. agricultural income, cereal yield, agricultural land rate, agricultural output and production, crop production index, agricultural production index) | |
| Trade (e.g. degree of openness, trade intensity, export cost, export price deflators, trade index, trade intensity) | |
| Consumption (e.g. electricity consumption pc, biomass consumption, energy consumption, fossil fuel consumption) | |
| Education (e.g. human capital, literacy rates in %, rate of secondary school enrollment) | |
| Others (e.g. undernourishment, carbon dioxide emission, tech rate, world pandemic uncertainty) |
3. Results
3.1. Study selection and variable extraction
In the screening process, we identified 55 articles as eligible for the review analysis. From the 55 articles, 85 studies were extracted. The 85 studies were categorized into 14 basic studies and 71 advanced studies (figure 2). From the majority of articles, we chose one advanced study per article for subsequent study analysis. From eight articles (table 3), more than one advanced study was selected, as e.g. these articles presented numerous studies with different regional scope or for different time periods.
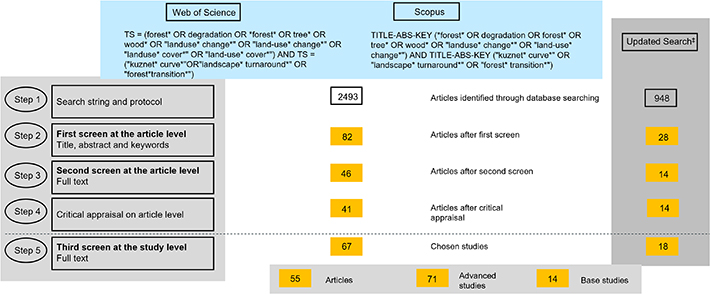
Figure 2. Flow chart of study selection and search strategy. ‡Search in Web of Science Core Collection and Scopus in August 2022 with same search string.
Download figure:
Standard image High-resolution imageTable 3. Overview of articles from which more than one study was selected (following figure 1).
| Article | Number and definition of selected studies |
|---|---|
| Caravaggio (2020a) | Three; low, middle- and high-income countries |
| Bhattarai and Hamming (2001) | Three; Latin America, Africa and Asia |
| Culas (2012) | Three; Latin America, Africa and Asia |
| Cropper and Griffiths (1994) | Three; Latin America, Africa and Asia |
| Joshi and Beck (2017) | Four; OECD, Latin America, Africa and Asia |
| Rudel (1998) | Four; different periods |
| Leblois et al (2017) | Two; EKCd and FTH |
| Caravaggio (2022) | Two; pre- and post-transition studies |
An overview of all selected studies and the extracted data is available in the supplementary material (Tandetzki et al 2023).
In total, the 85 studies assess 157 4 different independent variables. These 157 variables were categorized into 12 thematic categories (as displayed in figure 2) 5 . Across all selected studies of the systematic review, on average, basic studies tested two independent variables and advanced studies 7.2 independent variables. Not all of the tested variables were tested as statistically significant in the estimation studies considered. In total, 65% of variables proved to be statistically significant, of which 70% are highly significant at the 5% or 1% significance level.
3.2. Explanatory power of basic studies in regard to forest area development
During the screening process, we identified 14 basic studies (figure 2). Within one article, these basic studies have the same study design as the advanced studies in regard to, e.g. region and period selection and the choice of the dependent variable. The estimation method is also the same, except for Caravaggio (2020a), who uses a fixed effect estimator (FE) estimation for the basic studies and a PMG estimation for the advanced studies.
Based on the summary of the study designs of each basic study (see table 4), we appraised the explanatory content of the basic studies. Except for Köthke et al (2013), who analyze the FTH concept, all basic studies estimate the EKCd concept and thus the influence of income (expressed as GDP, GDP pc, GDP pc2 or a combination them) on forest area development. Thereby, the influence of at least one of these income variables was tested as statistically significant in 11 cases. This finding underlines the important role of income in explaining forest area change. Judging the explanatory power of the basic models we found that five out of the 14 basic studies specify a R2 as statistical measure for the goodness of model fit (Meyer et al 2003, Köthke et al 2013, Andrée et al 2019, Salahodjaev and Jarilkapova 2020, Assa 2021, Aquilas et al 2022) ranging from 0.234 to 0.726. The highest R2 (0.726) was found for the global basic study by Köthke et al (2013), who estimate the influence of demography on forest cover (applying FAO data) for 126 countries for a 20 year period using the FTH concept. On the contrary, the three other global basic studies carried out by Meyer et al (2003), Salahodjaev and Jarilkapova (2020) and Assa (2021), who applied income instead of demographic variables and test the EKCd concept, yielded lower R2 of 0.36, 0.23 and 0.24, respectively. Even though the limited availability of R2 measures made it difficult to draw firm conclusions on the explanatory power, the low goodness of fit of the global EKCd basic studies is an indication that income is insufficient as a sole explanatory factor for EKCd development, and that the incorporation of other drivers can enhance the explanatory power. In the studies that provide explanatory values in the form of R2 this value is generally relatively low overall, (except for Köthke et al (2013) and Aquilas et al (2022)). Only few studies display an adjusted R2 value, which is slightly higher in advanced models. The sign of the coefficients provides insights into the direction in which drivers influence forest area development and, additionally, whether the EKCd hypothesis is confirmed or not. It is important to note the specific dependent variables under consideration. For the rate of deforestation (n = 6), approximately half of the signs are either positive or negative. The results are so heterogeneous that no definitive statement can be made.
Table 4. Overview of basic studies (n = 14). GDP = gross domestic product, pc = per capita, FAO = Food and Agricultural Organization, WDI =world development indicators, OLS = ordinary least squares, FE = fixed effect, GLS = general least squares, adj = adjusted.
| Article | Region (n = number of countries); time period | Concept EKCd, FTH, mixed | Dependent variable and source | Independent variable (* = significant; n.s. = not significant, + and − hows signs of coefficients) | Estimation method | R2, adj. R2 | |
|---|---|---|---|---|---|---|---|
| Ehrhardt-Martinez et al (2002) | Global (n = 74); 1980–1995 | EKCd | Rate of deforestation (FAO) | −Forest stock | * | FE | NA |
| +GDP pc | * | ||||||
| −GPD pc2 | * | ||||||
| Meyer et al (2003) | Global (n = 117); 1990–2000 | EKCd | Rate of deforestation (FAO) | −GDP pc | * | OLS | 0.2491 |
| +GDP pc2 | * | ||||||
| Kahuthu (2006) | Others (n = 84), 1960–2000 | EKCd | Forest cover | −GDP pc | n.s. | OLS with FE | 0.03 |
| +GDP pc2 | * | ||||||
| Chiu (2012) | Developing (n = 52); 1972–2003 | EKCd | Arable land (FAO) | +GDP pc | * | PTSR with FE | NA |
| −GDP pc transition variable | * | ||||||
| Köthke et al (2013) | Global (n = 126); 1990–2010 | FTH | Forest cover (FAO) | +population pressure | * | OLS | 0.726 (adj. R2 0.72) |
| Caravaggio (2020a) | Low-income countries (n = 21); 1960–2015 | EKCd | Rate of deforestation (FAO) | −GDP pc | * | FE | NA |
| +GDP pc2 | * | ||||||
| Caravaggio (2020a) | Middle income countries (n = 65); 1960–2015 | EKCd | Rate of deforestation (FAO) | +GDP pc | * | FE | NA |
| −GDP pc2 | * | ||||||
| Caravaggio (2020a) | High income countries (n = 28); 1960–2015 | EKCd | Rate of deforestation (FAO) | −GDP pc | * | FE | NA |
| +GDP pc2 | * | ||||||
| Salahodjaev and Jarilkapova (2020) | Global (n = 176); 1990–2015 | EKCd | Forest area pc (WDI) | −GDP pc | * | NA | Adj R2 0.234 |
| +GDP pc2 | * | ||||||
| −proportion of seat held by women in national parliaments | * | ||||||
| +proportion of seat held by women in national parliaments2 | * | ||||||
| Halkos and Skouloudis (2020) | Others (n = 22); 1995–2016 | EKCd | Annual rate of forest change (FAO) | +GDP pc | * | GMM | 0.266 |
| −GDP pc2 | n.s. | ||||||
| +GDP pc3 | n.s. | ||||||
| Nguyen and Su (2021) | Developing countries (n = 74); 2002–2016 | EKCd | Forest area (WDI) | +GDP pc | n.s. | two step system GMM | NA |
| −GDPpc2 | n.s. | ||||||
| Assa (2021) | Global (n = 85); 1990–2010 | EKCd | Rate of deforestation and annual rate of forest change, respectively (FAO) | −GDP pc growth rate | * | OLS | 0.364 |
| +long run GDP growth rate pc | n.s. | ||||||
| Aquilas et al (2022) | Congo basin (n = 6); 1996–2020 | EKCd | Forest area (world bank) | +GDP | * | FE | 0.638 |
| −GDP2 | * | ||||||
| Toledo et al (2022) | Global (n = 110); 1990–2018 | Mixed | Forest Area (WDI) | +GDP pc | * | GLS | NA |
3.3. Independent variables used to estimate forest area development in advanced studies
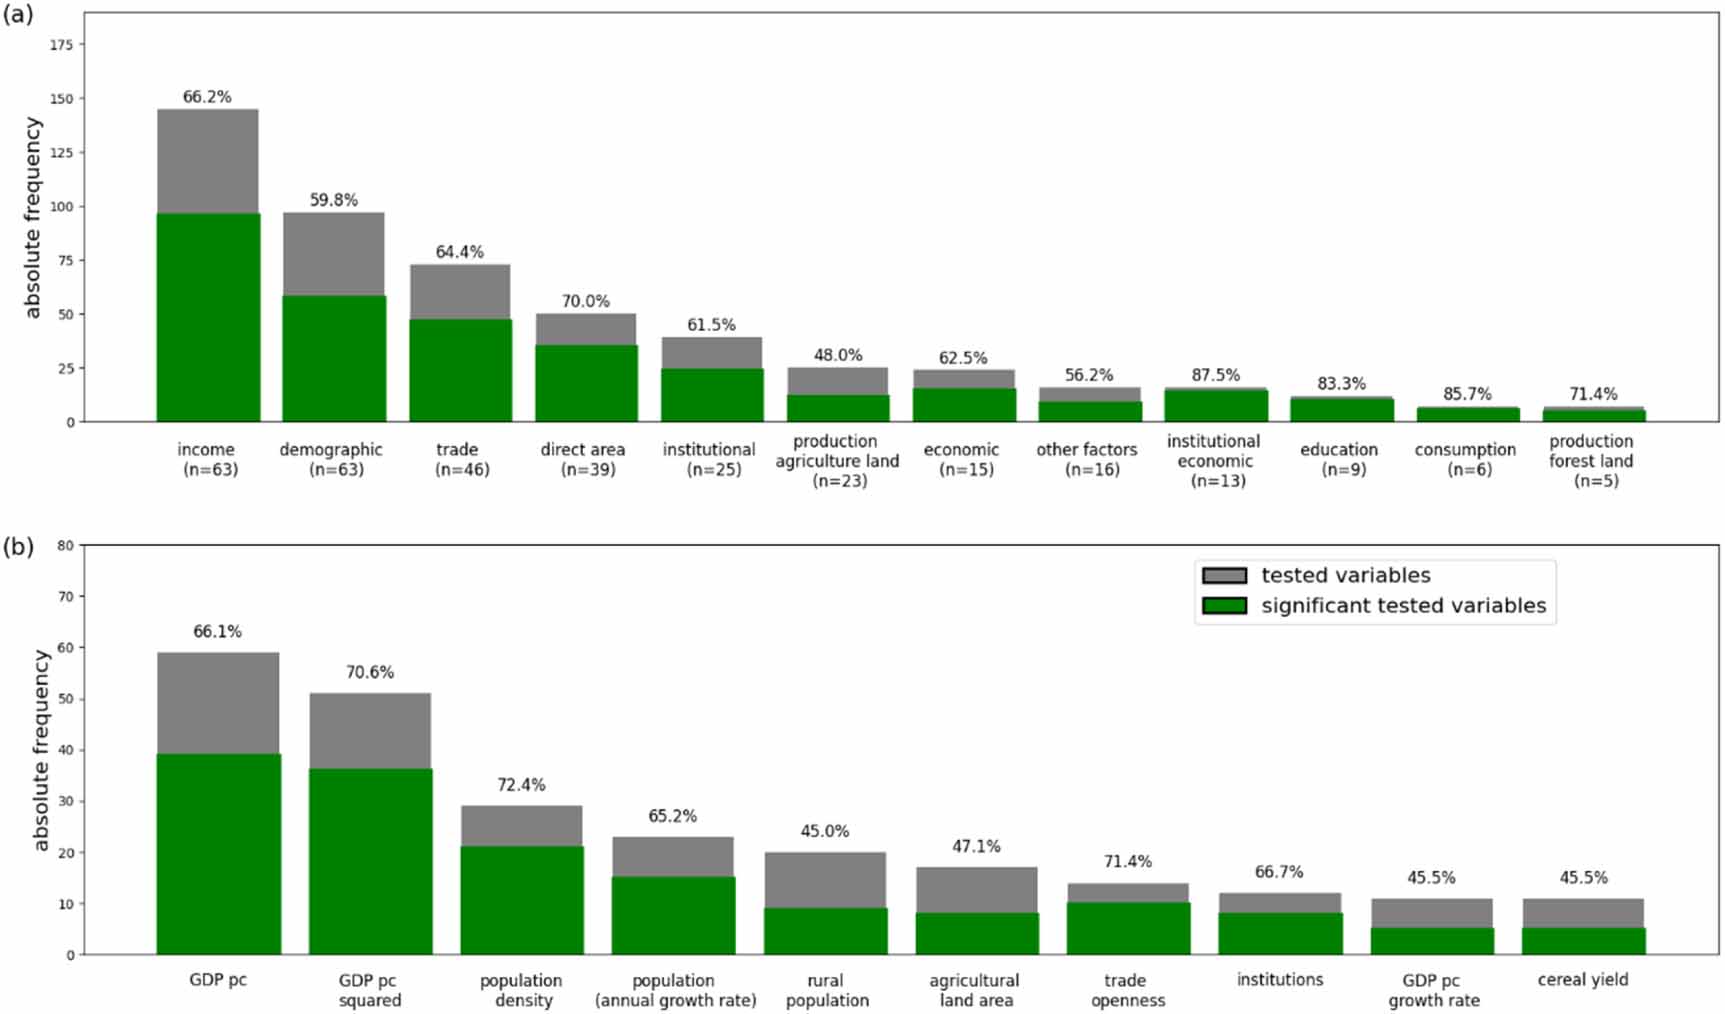
In a first step, we analyzed the 12 thematic categories to which all independent variables were assigned in regard to the number of tested and statistically significantly variables. In the advanced studies on average 7.2 independent variables were tested, i.e. not every study tested every variable. The most frequently tested are income variables, with an average of two income variables per study (n = 71). In some cases, study authors use more than one variable of the same thematic variable category within a study. This is evident, e.g. in figure 3(a), where 63 of 71 studies included in this systematic review examined the influence of income and tested a total of 145 income variables. Of these variables, 66% showed statistically significant influence. Demographic variables were similarly tested at least once in 63 out of 71 studies, with a total of 97 demographic variables, of which 60% were statistically significant tested. It is noteworthy that some variable categories were rarely tested, but are strikingly often statistically significant, e.g. 14 out of 16 institutional economic variables, 10 out of 12 education variables, 6 out of 7 consumption-related variables, and 5 out of 7 production forest land variables were tested statistically significant.

Figure 3. The absolute number of statistically significant drivers (green bars) and the absolute number of tested drivers (grey bar) with their respective shares indicated above the bars for (a) variable categories (where n is the number of studies in which the respective category appears, with maximal n = 71 studies) (some researchers tested more than one variable per category), (b) the 10 most often tested independent variables (extracted from n = 71 studies).
Download figure:
Standard image High-resolution imageIn a second step, we considered the individual independent variables. Figure 3(b) displays the 10 most often estimated individual independent variables (out of 157 different variables tested in total). GDP pc and GDP pc2 were most frequently applied. In approximately 70% of cases these variables were tested as statistically significant. Even though less frequently tested, population density, trade openness, and institutions appear to be statistically significant in more than 60% of cases. Agricultural land area and rural population as percentage of total population were statistically significant in less than 50% of cases tested (figure 3(b)).
To better grasp and analyze the combinations of independent variables tested within one study, we used a network graph displaying the statistically significant variable combinations. The graph accounts for statistically significant variables, grouped at category level. The combination of significant variables of different categories within one study is represented by a connection (edge) within the graph. The more often a combination of variables has been shown to be statistically significant in studies, the thicker the edge. For example, income variables proved to be statistically significant most often in combination with demographic or trade variables (see figure 4).
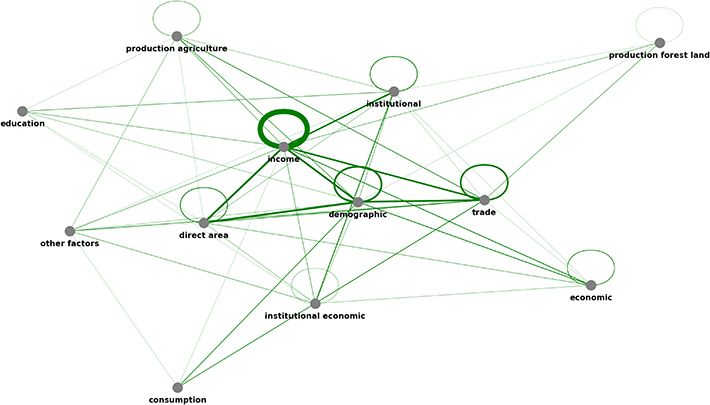
Figure 4. Network diagram of all variable categories tested significant as nodes and relationships as lines (edges) between variables in one study (n = 71).
Download figure:
Standard image High-resolution imageIn the center of the network diagram are the most common and frequently estimated variable categories, e.g. income-related variables and demographic-related variables. The variable categories that have been statistically significant in only one or two studies are displayed in the outermost ring (e.g. education-related variables, consumption-related variables). If multiple variables from one category are tested within one study, a ring is represented above the nodes. This is particularly common for the income variables, where GDP pc and GDP pc2 were jointly investigated in 86% of studies (figure 4).
3.4. Does geographic scope affect the drivers of forest area development?
The studies used in this review cover specific regions such as Middle East and North African (MENA-), Sub-Saharan African (SSA-), the organization for Economic Co-operation and Development (OECD-) countries, or continents and larger areas, such as developing countries or global data sets. We compared the study results from different geographical regions (see also figure 5(a)).
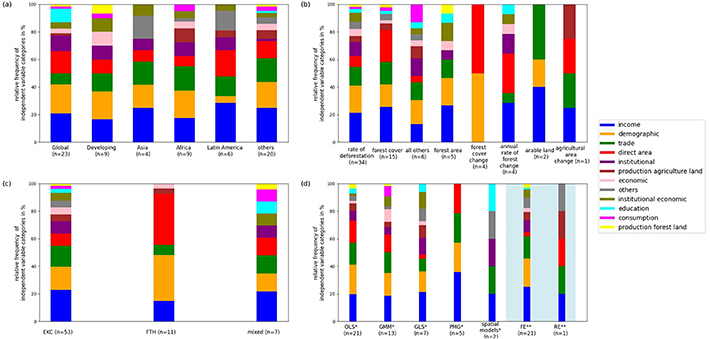
Figure 5. Relative frequency of statistically significant variable categories for studies with different (a) regional datasets (n = 71), (b) dependent variables (n = 71), (c) forest area development concepts (n = 71), (d) estimation methods (n = 48). Highlighted are methods (fixed effects (FE) and random effects (RE)) that capture individual and time effects in estimation. Below, legend for (a)–(d).*OLS: ordinary least squares (including OLS with FE, fully modified OLS, dynamized OLS, OLS with spatial lagged regression); GMM: generalized mixed methods (including system GMM, panel GMM, two-step GMM); GLS: generalized least squares (including feasible GLS); PMG: pooled mean group estimation); spatial models (including spatial durbin and spatial panel models).**FE: fixed effects; RE: random effects; pooled regression. The regressors are based on studies that are partially described in the estimation methods. The number refers to studies that have separately reported the effects and regressors.
Download figure:
Standard image High-resolution imageThe figure 5 displays the cumulative relative distribution of statistically significant drivers according to the 12 thematic categories. The drivers are represented in different colors in the bar chart, and the bars are thematically subdivided.
Figure 5(a) presents the distribution of influential drivers for larger spatial boundaries (global studies, developing country studies, and continental studies). Global datasets are most frequently analyzed among all studies (n = 23), followed by developing country studies (n = 9). The most frequently tested drivers for these large-scale studies are income-related, demographic, direct area-related, institutional, educational, and trade-related variables. Significant drivers from each thematic category were found for global studies (except for the category of other variables), while significant drivers were found for 9 out of 12 categories for developing countries. A comparison of the two large-scale groups (global and developing) shows that developing country studies more often identified trade as an influential driver than global studies, while the latter more often identifies direct area-related drivers to have an impact.
At the continental level, datasets are frequently examined for Asia (n = 4), Africa (here we also counted SSA-, MENA and the Congo Basin countries) (n = 9) and Latin America (n = 6), with most studies focusing on the African continent. Other continents (East Europe) were only considered in one study.
Africa was found to have the highest diversity of influencing factors in the studies reviewed, with drivers from 10 out of the 12 thematic categories showing a significant impact on forest area development. Studies on Latin America and Asia, in contrast, have shown no significant influence of consumption and other economic factors besides income.
As figure 5(a) shows, income and trade are the most dominant drivers in all three continents. Demographic factors, however, mainly influence forest area development for the Asian and African continents, and less frequently in Latin America. In contrast, direct area-related drivers were frequently identified in studies on Latin America, but seldom in studies on Asia and Africa. In addition to the described factors, institutional factors, institutional economic factors, and other factors have an influence on all three continents.
3.5. What impact do different definitions on forest area development have on drivers?
The heterogeneity in estimation models is also reflected in the choice of the dependent variable as representative of forest area development. A distinction is not only made between the definitions of the different dependent variables, but also between the data sources. In regard to the data source applied to determine forest area development we found that 40 studies use the FAO database, 16 studies use the World Bank data, five studies draw their data from the publication of Hansen et al (2013), three from the World Resources Institute, three do not clearly indicate the source and one study each uses the data from Zon and Sparhawk (1923), Sten (1956), the Environmental Performance Index (EPI), and from the land cover climate change initiative of European Space Agency.
The definition of the dependent variable is subject to the author's specification in each individual study, which we categorized into eight groups. The studies considered apply five forest variables already distinguished in Tandetzki et al (2022) (forest area, annual rate of forest change, forest cover, forest cover change, and rate of deforestation), net forest depletion (Amirnejad et al 2021, Ibrahim and Ajide 2022), tree cover loss from EPI (Le and Le 2022), and carbon emissions generated by deforestation per hectare (Zafeiriou et al 2022). Three studies apply agricultural variables (arable land and agricultural area change) as proxies for tropical deforestation (compare figure 5(b)). To detect the influence of socio-economic drivers depending on the definition of the dependent variable, we analyzed the role of the significant tested drivers with regard to the specification of forest area development.
In figure 5(b), the relative distribution of significant drivers with respect to the specification of the dependent variable are displayed. The rate of deforestation as dependent variable is included in most (n = 34) studies. The second most frequent applied independent variable is forest cover (n = 15), followed at a distance by 'all others', which assemble all studies that cannot be clearly assigned to any group (n = 6), and then by forest area (n = 5). The remaining specifications are rarely applied (less than five times).
For the rate of deforestation, drivers from each thematic category were tested significant at least once. Forest cover studies show a similar pattern expect from institutional and institutional economic-related factors, which were not tested significant.
The most frequently tested dependent variables, namely the rate of deforestation and forest cover, are dominated by income, demographic, and trade-related variables. A significant influence of direct area-related variables was found strikingly often on forest cover compared to rate of deforestation. Whereas institutional and institutional-economic drivers were more often found to influence the rate of deforestation.
Dependent variables which were applied by a few studies only exhibit a more diverse pattern. Due to the low number of observations, it is however difficult to draw valid conclusions on these. The pattern displayed for studies that examine forest cover change is strikingly different from that emerging from the other studies. These four studies are from the article of Rudel (1998), who considers in all studies an identical study design in different time periods, including the same tested variables. The low variety in identified drivers might therefore be attributed to the low variety of underlying articles and authors. When it comes to the agricultural variables serving as proxies, the influence of trade is dominate. However, these specifications of the dependent variable have only been applied three times in total.
3.6. Differences of drivers according to forest area development concepts
The theoretical concept chosen by the authors of the studies selected was not always clearly assignable to the framework of the EKCd or FTH. Thus, although the concepts are differentiated in theory, a clear distinction was not always visible in the estimation. We assigned the studies to the concepts according to the definition the authors gave in the respective article. However, due to missing information (n = 3) or both concepts being investigated in a single study (n = 4), we assign seven studies to a 'mixed' category. The rest were divided into 76% EKCd studies and 16% FTH studies. Analyzing the sum of ECKd studies, we found that at least one driver out of each thematic category was significant. Income, demography and trade were most frequently found to influence forest area development in EKCd studies. In contrast, only variables from six thematic categories were statistically significant in FTH studies. While the drivers in EKCd studies are very diverse, with a slight dominance of income, demography and trade, FTH studies are clearly dominated by demographic and direct-area-related drivers, which account for 33% and 37% of significant variables respectively (figure 5(c)).
3.7. Differences of driver in relation to different estimation methods
The studies applied different statistical estimation methods. We extracted all estimation methods, which are in order of frequency of appearance: OLS, generalized mixed methods (GMM), generalized least squared (GLS), PMG estimation; spatial models (including spatial durbin and spatial panel models). Additionally, and building on that, we analyzed which studies prefer FEs and which prefer random effects (RE) based on respective specification tests (e.g. Hausmann test).
The estimation methods chosen by the study authors also vary with the timing of publication. Historically, OLS has been frequently used in the early studies while in more recent publications, the range of estimation methods has become more heterogeneous (see also Tandetzki et al (2022)). To minimize a potential bias and ensure better comparability, we separately investigated the influence of the chosen estimation method on the drivers. Across all studies OLS was used most frequently (n = 21), followed by GMM (n = 13) and GLS (n = 7). Under these three estimation methods a high diversity of drivers (from 10 to 12 thematic categories) was identified. The relative frequency distribution of influential drivers indicates that estimations with OLS, GMM, and GLS similarly identified income and demography as main drivers. Direct area-related drivers were, however, identified as influential in 16% and 13% of studies using OLS and GMM respectively, and only in 3% of GLS studies. Conversely, GLS has a higher proportion of significantly tested other factors and institutional economic factors (nine and 10 times, respectively). Estimation methods used less often (PMG and spatial models) show a lower variety of drivers (figure 5(d)). Drawing definitive conclusions proves challenging in this context due to the limited strength of the mean value.
In almost all articles that conduct comparative studies between FEs and REs, the FE method is preferred. In 32% of the selected studies, both FE and RE were considered, with a decision in favor of FE in 91% of the studies.
3.8. Differences caused by the specification of the variables within the thematic categories
In order to investigate potential variations resulting from variable specification within a thematic group, we delved into the analysis of the income and demographic variables most commonly assessed (as depicted in figure 3(b)). To assess the impact of income, study authors most frequently applied GDP pc, GDP pc2 and GDP growth rate. Figure 6 shows the application of the different specifications of income in studies with different scope. Income variables are predominantly applied in EKCd studies (see figure 6(a)), but turned out to be significant only in 44%–66% of cases. In the FTH studies GDP pc and GDP pc2 were statistical significant in four and two of 12 studies but income was rarely tested over all. In the baseline studies, where only income was tested, it was significant for all income variables over at least 78%. In these groups (figures 6(a) and (b)), there are no great differences between the individual variable specifications. A different picture emerges when we differentiate regionally (figure 6(c)), where in large-scale studies (global and developing), GDP pc growth never showed a significant impact, and GDP pc, and GDP pc2 were less often statistically significant (0%–60%) than in studies considering smaller regions (71%–100% in continental studies). Significant effects of income were most frequently found in studies of Latin America.

Figure 6. Most frequent income variables tested in (a) EKCd and FTH studies, (b) basic and advanced studies, and (c) regional studies.
Download figure:
Standard image High-resolution imageThe influence of demographics was mainly tested using the variables of population density, population annual growth rate und rural population. These variables were tested in at least every FTH study, but only in 79% of the EKCd studies. In studies of both concepts, population density and annual growth were statistically significant in at least 53%–100% of cases, while rural population was significant in a maximum of 27% of cases (figure 7(a)).

Figure 7. Most frequent demography variables tested in (a) EKCd and FTH studies, and (b) regional studies.
Download figure:
Standard image High-resolution image
In global studies, a statistically significant impact of population density and population annual growth rate was found in 71% of the cases, whereas the impact of rural population density was only confirmed in 27% of the cases. In developing countries only, the demographic variable population density was tested as statistically significant (75% of cases). Again, consideration of continental studies provides a different picture. Rural population consistently exhibits statistical significance when tested in the regions of Asia, Africa, and Latin America, whereas its statistical impact in global studies is observed in only 27% of cases. Population density did not show any significant impact in any study conducted on Asia and Latin America. In Africa, all three demographic variables were consistently tested with statistical significance impact (figure 7(b)).
4. Discussion and conclusion
In the past, under the concepts of EKCd and FTH a variety of underlying and direct drivers have been applied to statistically assess forest area development. This article systematically reviewed scientific estimation studies to determine which variables are most frequently found to statistical significantly influence forest area development. The studies considered in this article are extracted from relevant literature on the subject. The search and selection of this relevant literature has been conducted by an EGM published by Tandetzki et al (2022). Tandetzki et al (2022) identified 46 peer-reviewed articles that have been published between 1955 and 2020. Each article contained at least one empirical estimation study of the EKCd or FTH concepts. Thereby, 76% of articles focused on EKCd only. After updating the article selection until 2022, we consolidated and synthesized estimation studies, their assumptions and findings from the preselected articles in the present systematic review. The results of the EGM of Tandetzki et al (2022) are not further addressed here. The discussion and conclusion are solely revolving around newly generated findings from the systematic review.
The systematic review is conducted to assess whether an overarching, conclusive picture emerges or whether various patterns of influence emerge. These different patterns could, e.g. be related to in different world regions, to different specifications of the applied estimation models, or to different drivers of forest area development tested. To gain better overview, those influencing factors are classified according to the model and variable specifications, mathematical estimation methods, regions, and analyzed forest area development concepts.
Research studies dedicated to the estimation of forest area development according to the EKCd or FTH phenomena aim to mathematically analyze turning points in observed forest area development. These turning points indicate the transition from fast to slow deforestation according to the EKCd hypothesis, and from deforestation to reforestation according to the FTH. Many more studies including a mathematical estimation of the EKCd have been published over the past years than on estimation of the FTH (Tandetzki et al 2022). Maybe this is partly due to the longer history of EKC research when compared to the younger approach of the FTH. Additionally, the EKCd appears to be easier to estimate mathematically than a curve representing the FTH: the basic concept of the EKCd resembles an inverted U-shaped curve with one turning point to explain the relationship between income and deforestation. The FTH seeks, at least theoretically, to determine two inflection points considering a multitude of drivers.
While EKCd base studies examined the impact of income on deforestation only, our analysis showed that estimation studies advanced over time. This is not only due to better access to longer time series data on forest area development and socio-economic variables, they also aimed to explore the shape of forest area development and multiple factors driving it. Even though simpler in its mere conceptualization, over the time more and diverse drivers have been tested and found to be influential for the EKCd, demonstrating that numerous drivers affect forest area development. Inspired by the lines of the FTH, some studies suggested the EKCd could also resemble a N- and sigmoid curve shape and should be estimated using a cubic instead of the traditional quadratic term (e.g. Bhattarai and Hamming (2001), Halkos and Skouloudis (2020) and Managi (2006)). The softening of the rigid inverted U-curve shape of the EKCd, along with the inclusion of additional drivers in explaining forest area under the EKCd, showed that the boundaries between these concepts are increasingly blurring and their delimitation is often neither feasible nor meaningful. But neither access to better data nor longer time series data could end the intensive debate on the existence and the exact path of forest area development according to the EKCd and FTH.
However, after observing non-conclusive results on the existence of a turning point in deforestation according to the EKCd hypothesis from the early years, it can be discussed if the hypothesis is more often confirmed with the application of better data and advanced estimation methods in recent years. This is supported by our analysis of base studies, reflecting the core concept of the EKCd, which mostly found an impact of income on deforestation, but with a rather low explanatory power. We found that the inclusion of additional variables increases the explanatory power of the statistical models in most cases, suggesting that forest development could not solely be explained with one single driver (e.g. income). Nevertheless, because of the wide variety of specifications used, the picture of the evidence from the estimation studies is still unclear and providing a statement about the validity of the EKCd hypothesis remains challenging till now, as was also found by Choumert et al (2013) and Caravaggio (2020b).
Most studies estimating an EKCd found a statistically significant influence on forest area development of income (e.g. GDP pc), demography (e.g. population density), trade (e.g. trade openness), and institutions (e.g. political stability), as well as of the direct drivers of area development (e.g. expansion of agricultural land area). Contrary, forest area development according to the FTH was found to be influenced mostly by underlying demographic and direct area related factors, with income and trade playing a subordinate role.
When collating a comprehensive set of studies and conducting a combined analysis of EKCd and FTH studies, a discernible variation in the geographical pattern emerges, with income, demography, and trade identified as key drivers in all study regions. However, the statistical influence of individual drivers varied in different regions. When, e.g. comparing the tropical forest-rich continents Latin America, Africa, and Asia, we see that income has the most significant influence on forest area development in Latin America while demographic drivers have the highest statistical influence in Africa. For Africa, this means that pressure on forest land will increase as the population grows. This is plausible, since the urbanization in the densely forested countries of Central Africa is low and thus, growing population requires land for settlement and subsistence farming (Abernethy et al 2016). Consistently, in some of the Latin American countries (e.g. Brazil, Argentina, Chile), more than 80% of people are living in urban areas (World Bank 2022) so that demographics and forest area development are less interconnected. The single variable rural population underlines these findings by showing that forest area development of rural population statistically significantly influences forest area development in Latin America, Africa, and Asia. Also, noteworthy, though rarely tested, is that education had a significant impact on forest area development in almost all global studies that diminishes in regional studies. This can be explained by the greater variation of the factor in larger-scale studies. Finally, it is important to discuss that in particular international trade plays a statistically significant role in studies focusing on developing countries. The confirmation of this relationship pointed out the role importing countries potentially have in driving global deforestation. To consider this finding in regional policies aiming at protecting forest resources elsewhere, e.g. in the northern hemisphere, seemed to be crucial.
Our analysis of all studies (EKCd and FTH) revealed that GDP pc and GDP pc2 followed by population density, trade openness and institutions (political rights, civil freedoms, political freedoms) were the most frequently tested variables with a statistically significant impact of forest area development. Remarkably is, that the impact of GDP pc and GDP pc2 was more often confirmed for smaller regions, while the results in larger-scale studies remains inconclusive. Thus, we conclude that the determination of the EKCd hypothesis on global scale remains a challenge and is most presumably dependent on diverse—and maybe partly still unknown—drivers.
4.1. Policy implications
To hold deforestation is one of the main goals to combat global climate change and foster forest-based mitigation measures as well as e.g. loss of biodiversity. Both the EKCd hypothesis and the FTH try to explain global forest area dynamics as a function of socio-economic variables. Knowing which of these variables significantly drives forest area development could enable policy and stakeholders to effectively intervene and reverse deforestation. However, overarching key drivers confirmed by our research such as population growth and GDP pc are difficult to shape for individual policy-makers or other decision holders in the short run. The statistical relevance of income, especially on regional scale in the southern hemisphere, confirms the important role of poverty alleviation, reduction of inequalities on the global agenda (United Nations 2015). Our analysis further revealed that the international exchange of goods and financial assets significantly impact forest area development. The governance of related economic variables, e.g. international trade or foreign direct investments appears to be possible but requires, due to its cross-border nature, the mutual effort of politics and economic actors in both the originating and receiving regions. According to our results, institutional indicators are remarkably often tested as statistically significant and thus, seemed to be the promising tools for controlling forest area development at the country or regional level. Thus, policymakers looking for effective ways to influence forest area development in a given region should focus on strengthening institutional drivers including, e.g. fostering political stability, civil freedom, political rights and democracy, while combating corruption. However, in a globalized world, worldwide deforestation cannot be controlled through the efforts of specific countries alone. Thus, only the simultaneous addressing of local and transregional drivers, such as trade and economic drivers, can truly alter forest area development. Again, noteworthy is the variable category education which showed to be significant in almost all cases when included into estimations in particular in global studies. Thus, to invest in and enable access to education is concrete and tangible option for action to be pursued from regional to global scale to fight deforestation. This systematic review is not a meta-analysis or meta-regression. While we identified which drivers are statistically significant in influencing forest area and provide a synthesis of patterns within these drivers, we do not conduct a meta-analysis of the strength and direction of effect of each influencing variable or a re-estimation of forest development based on the identified variables.
4.2. Methodological discussion
This synthesis built on the established methodology for systematic reviews of RoSES guidelines and thus, followed a clear protocol (Haddaway et al 2018). A two-stage approach that involves an initial EGM followed by a systematic review is not a novel but rarely employed method outside medical research. In this context, the EGM serves as a protocol, given its significant resemblance to the protocol of a systematic literature review. Initially, the breadth of evidence on a research topic is outlined using the EGM, which maps the existence and non-existence of literature on a certain topic. Subsequently, the systematic review approach delves deeper into the approaches and results applied in the literature and synthesizes them. This two-stage method allows for a more comprehensive and precise examination of the research (James et al 2016). Since the selection strategy is clearly defined, comprehensible, and repeatable, the reader can retrace how, at what time, and with what criteria the literature search was conducted. However, an unknown publication bias is inherent to this kind of methodology: systematic reviews can only make use of published research that fulfills the eligibility criteria (e.g. English and peer-reviewed). Anyway, this is only a subset of all work conducted in the field since, e.g. researchers do not publish their insignificant findings or publish their results in another language or format (e.g. non-reviewed working paper, book). In addition, also English and peer-reviewed articles face this reporting bias through individual editors' and reviewers' choices (see e.g. Choumert et al (2013) on a discussion of selection bias in meta-analysis).
Due to the heterogeneity of concepts and study designs (e.g. geographical scope, estimation method, measurement of model fit) used for the different estimations, comparison of study contents was challenging. In order to be able to compare the studies at all, we focused on the independent variables used in each study and related their occurrence and statistical significance to the study region, the dependent variables, the forest area development concept, and the estimation methods.
For a straight comparability of the studies, it would be necessary to re-estimate some of the studies and align data and variable sets with similar statistical indicators and estimation methods. However, this is beyond the scope of this theoretical systematic review.
4.3. Outlook
Over time, estimation methods have seen ongoing enhancements, enabling more recent publications to construct more dependable models. Future work may explore whether the earlier estimation methods merit a more critical scrutiny. For instance, spatial analysis techniques were used only in two studies, revealing a distinct pattern of forest development drivers compared to the other studies.
Bi- and multilateral trade linkages can drive deforestation (see e.g. Pendrill et al 2019, 2022), which is often neglected in cross-country studies that make up the majority of studies identified in this review. Future studies could also focus on these aspects.
Additionally, research gaps arise from the separate examination of different forest area types (e.g. natural forest, planted forest and plantations (FAO 2020)). Also, a more comprehensive investigation of institutional and economic (e.g. debt level), education, consumption (e.g. fossil fuel energy consumption) and production forest land-related (e.g. labor per unit forest area land) drivers is needed. These drivers, although relatively rarely tested, have a statistically significant influence on forest area development.
Even though other land use theories explaining land use change especially for smaller regions exist (Meyfroidt et al 2018), the hypotheses of EKCd and FTH provide an overarching framework that is applicable from regional to global studies and whose statements are universally valid independent of the study region or design. Based on our synthesis we concluded that the investigation of EKCd and FTH is not yet completed. In line with previous research on the validity of the concepts we confirm that—based on the present findings—neither a rejection nor an acceptation of the hypotheses is possible. In summary, our findings showed that many drivers influence the development of forest areas. Thus, future research dedicated to the hypothesis of the EKCd is needed to amend and refine the mere concept of an U-shaped curve. The FTH features a more comprehensive theoretical explanation for forest area development but has been insufficiently applied on a global scale till now.
Acknowledgments
Our sincere thanks go to Matthias Dieter for his collaborative efforts, engaging discussions, and expert insights. Furthermore, we extend our appreciation to the two anonymous reviewers and one board member, whose insightful feedback was instrumental in refining and improving the quality of our work.
Data availability statement
The data that support the findings of this study are openly available at the following URL/DOI: www.openagrar.de/receive/openagrar_mods_00088881.
Conflict of interest
The authors declare that they have no known competing financial interests or personal relation- ships that could have appeared to influence the work reported in this paper.