

Abstract
Snow cover is critical to the ground thermal regime because it affects surface conditions and the energy balance. Prior work inherently included confounding effects from vegetation and the soil when estimating the snow's effect by using the differences between air and ground surface or soil temperature. Here we use the Kudryavtsev model including a snow module to isolate the effect of only the snow cover during winter, based on observational sites across the Northern Hemisphere. We find that snow's damping of annual mean ground surface temperature averages 5.06 ± 3.15 °C and ranges 0 °C–10 °C, while damping of the annual ground surface temperature amplitude is 7.95 ± 4.95 °C, ranging 0 °C–20 °C. Greater insulation occurs in the high-latitudes. The insulating effect is primarily driven by snow depth, but also the combination of air temperature and its amplitude, snow depth, and duration. Snow cover duration and low air temperature enhance snow's insulating ability. These observational results that isolate the damping effect of only the snow could play a significant role in better understanding the energy change between air and the ground.
Export citation and abstract BibTeX RIS

Original content from this work may be used under the terms of the Creative Commons Attribution 4.0 license. Any further distribution of this work must maintain attribution to the author(s) and the title of the work, journal citation and DOI.
1. Introduction
Snow is one of the most important cryospheric components, with its average maximum winter extent in the Northern Hemisphere being approximately 47 × 106 km2 (Estilow et al 2015). Due to its high albedo, the presence or absence of snow controls the patterns of heating and cooling of Earth's land surface more than any other single land surface feature (Qin et al 2018, Peng et al 2021b). Snow cover influences the ground thermal regime, freshwater budget, vegetation, biogeochemical activity, terrestrial, and aquatic ecosystems (Callaghan et al 2011, Mudryk et al 2020a, 2021). These characteristics and their interactions with other systems play a significant role in the climate system.
Given the importance of snow cover, many aspects of its temporal and spatial variability have been extensively reported. Long-term trends of snow cover extent derived from satellite imagery indicate declines, especially in spring, with some decreases also reported in autumn (Kunkel et al 2016, Mudryk et al 2020b). In the Eurasian Arctic, June 2021 snow cover extent was the third lowest since records began in 1967, and snow cover extent has been below the mean for at least 15 consecutive years, starting in 2005, in the North American Arctic (Mudryk et al 2020b). The average annual maximum snow mass during 1980–2018 was 3062 ± 35 Gt in the Northern Hemisphere based on the GlobSnow 3.0 dataset (Pulliainen et al 2020). Snow cover is crucial to the overwintering success and thus survival of a wide range of species, due to snow's insulating capacity and low thermal conductivity (Pauli et al 2013). Counterintuitively, in most cases, snow cover decreases in the midlatitudes will result in a longer duration of frozen ground, causing detrimental winter cooling for organisms dependent on the seasonal refugium below snow (Zhu et al 2019). Additionally, snow meltwater is often a main source of runoff and plays an important role in ensuring water availability downstream, especially during low-flow periods (Han et al 2019, Kitlasten et al 2021). Besides providing a moisture source from melt, snow significantly affects vegetation due to its insulating capacity. Winter snow conditions are important controls on the timing of vegetation development and biomass production at the community level (Kelsey et al 2021). For example, in arid, semi-arid, and semi-humid regions, changes in snow can modulate the water regimes in spring by supplying soil moisture, and affecting vegetation growth (Barnett et al 2005, Peng et al 2010, Wu et al 2013, 2019). Conversely, vegetation such as conifers and, in tundra regions, shrubs also impacts the snow cover by intercepting and trapping snow (Palmer et al 2012, Loranty et al 2018, Kropp et al 2020). Additionally, snow cover plays a significant role in air-ground-soil temperature interactions (Nicholson and Granberg 1973). Snow depth and duration affect permafrost (Annerston 1964, Brown 1970, Burke et al 2020) such that greater degradation occurs when a snow depth increase occurs in autumn, rather than in winter, insulating the soil from early cooling (Park et al 2015). Lawrence and Slater (2010) used a climate modeling approach with a land surface model to simulate the effect of snow on soil temperature, finding that the net change in snow can either amplify or mitigate soil warming on a century timescale. In discontinuous permafrost regions, soil warming can result from snow thickness increases, even in the absence of air temperature increases (Biskaborn et al 2019). In addition to these snow-permafrost interaction studies, sensitivity experiments have also been used to evaluate the effects of snow on permafrost. Changes in snow thickness have significant impacts on the ground thermal regime and conductive heat flow to the atmosphere. Varying the snow thickness by 50% can result in annual ground temperature (as deep as 8.0 m below the ground surface) variations of more than 0.25 °C in Northern Alaska (Ling and Zhang 2007). The importance of snow properties such as density on soil temperature has also been noted (Michele et al 2013, Royer et al 2021).
Several methods have been applied to estimate the effect of snow on ground or soil temperature. (1) The influence of snowpack insulation on the soil/air separation has been investigated using an annual temperature offset. This offset is calculated as the difference between the mean annual soil temperature at different depths and mean annual air temperature (MAAT) at shelter height (Grundstein et al 2005, Osterkamp 2007, 2008, Isaksen et al 2011, Smith et al 2016, Cao et al 2020, Etzelmuller et al 2020, Chen et al 2021, Zhang et al 2021, Chen et al 2021a, 2021b). Most studies apply soil temperature at different depths, from centimeters to meters, and the thermal offset thus also includes the effects of soil, not only the snow. (2) A freezing n-factor has also been used to estimate the effect of snow cover by calculating the accumulated seasonal air and near-surface (where some studies used shallow soil temperature, most used the 5 cm soil temperature) freezing degree-days (Riseborough 2001, Smith and Riseborough 2002, Karunaratne and Burn 2003, Riseborough et al 2008, Hrbáček et al 2016). The freezing n-factor provides an indication of the influence of snow cover on the ground thermal regime. Lower values of freezing n-factor (i.e. values less than 1), indicate a greater influence of snow cover. While this method is very simple, it cannot correctly capture snow effects because snow covers vegetation in the cold period. Furthermore, the ground and vegetation are not covered by snow for the entire cold period, which therefore limits the utility of the n-factor approach and introduces uncertainties. (3) Surface energy balance and heat conduction models such as CryoGrid 3, GIPL, and a 1D heat transfer equation with phase change (Ling and Zhang 2004, Magnin et al 2017, Jafarov et al 2018, Yi et al 2019) have previously been used to simulate the effect of snow cover based on physical air-snow-frozen ground processes. Such modeling approaches can consider the thermal conductivity of several snow layers and the interactions with soil heat balance components, and can thus estimate snow effects via sensitivity experiments including snow depth, duration, density, etc. While this method had advantages in estimating the effect of snow, it requires many parameters including snow properties, soil, vegetation, etc for which only very limited observations are available. (4) Snow models, e.g. SNOWPACK and the SURFEX-Crocus snowpack evolution model, have advantages in that they contain detailed descriptions of physical snow processes. These models are uniquely adapted for simulations of the ground thermal regime (Gouttevin et al 2018, Royer et al 2021), however, they require detailed observational snow parameters, which are not available on larger spatial scales. (5) Earth system models or land surface models, e.g. the Community Land Model and CHANGE (Lawrence and Slater 2010, Park et al 2015), are also used to simulate snow's effect on soil temperature via prescribed snow experiments. Such climate model experiments have the advantage of simulating many snow parameters, but also the disadvantage of not directly including any observations. (6) Experimental statistical methods can be used to quantify the degree of damping between air and shallow soil temperatures in the presence and absence of snow cover (Mackiewicz 2012, Zhang et al 2018), or to build simple linear regressions between air temperature and shallow soil temperature during snow or snow-free periods (Mudryk et al 2017). Such methods are simple but may falsely attribute the effects of snow, that could be caused by other processes. (7) The Kudryavtsev (Ku) model is an analytical model for the soil's thermal state, and accounts for the major controls from air temperature, vegetation, snow, and soil properties (Kudryavtsev et al 1977). This model can isolate the snow from the vegetation effect on the ground surface temperature and has previously been determined to be sensitive to snow depth, with a relatively small RMSE for ground temperature modeling (Wang et al 2020). Therefore, we selected the Ku model to estimate the snow's effect on ground surface temperature in our study.
Many previous studies have detailed the effects of snow on soil temperature, permafrost, etc. However, they generally estimate the cumulative effects that include analogous changes in, e.g. soil and vegetation, without isolating the actual effect of the snow itself. Furthermore, ground surface temperature is one of the most important upper-boundary and initial -ondition forcing in permafrost models. While ground surface temperature is often assumed to be equal to air temperature, not including the impacts of snow cover can introduce a substantial bias, also including the effects of vegetation, organic factors, etc. Thus, it is critical to quantify the observational effect of snow cover on ground surface temperature, without including confounding effects such as from vegetation. An additional unique contribution of this study is that it quantifies the winter snow cover effect on ground surface temperature based on thousands of in-situ sites. Thus, the goal of this study is to apply the snow module of the Ku model (Kudryavtsev et al 1977) to estimate the effect of winter snow cover on ground surface temperature based on 2157 in-situ sites in the Northern Hemisphere.
2. Data and methods
2.1. Air temperature and snow depth
We assembled daily air temperature and snow depth observations from Canada, Russia, Alaska, the United States, and China. Daily in-situ data for 1436 Canadian stations and 3695 United States station are available from the Global Historical Climatology Network database (www.ncei.noaa.gov/products/land-based-station/global-historical-climatology-network-daily), although the snow depths are missing (NaN) at most stations. Russian air temperature and snow depth data are from the Russian Research Institute for Hydro-Meteorological Information-World Data Center (http://meteo.ru/) and include records for 600 sites with daily observations for 1880–2020 across the former Soviet Union. The China Meteorological Administration provides daily air temperature and snow depth records from 635 sites, from the 1950s to the 2010s. In Alaska, we obtained 1998–2019 records for 17 sites from the U.S. Geological Survey, collected as part of the climate monitoring array of the U.S. Department of the Interior on Federal lands in Arctic Alaska (Urban and Clow 2018). Additionally in the United States, daily records from the National Water and Climate Center (www.wcc.nrcs.usda.gov/) were obtained from 905 automated sites for 1978–2021, measured by the Natural Resources Conservation Service. All these data have been subject to thorough quality control by the data providers. However, the degree to which all of these stations are representative of their surrounding natural environment is not clear, and the results should be interpreted with this caveat in mind.
2.2. Ancillary data
To simulate the thermal effect of snow using the Ku model, soil moisture and soil texture are required. Soil moisture for 1981–2020 is obtained from the fifth generation European Centre for Medium-Range Weather Forecasts reanalysis (ERA5), with 0.1° × 0.1° spatial resolution (https://cds.climate.copernicus.eu/cdsapp#!/dataset/reanalysis-era5-land?tab=overview). Compared to four other reanalysis datasets, soil moisture from ERA5 was found to have a higher skill and significant improvements over its predecessors at the network scale (Li et al 2020). Thus, mean soil moisture for the top three soil layers (0–7 cm, 7–28 cm, and 8–100 cm) are used in this study. Soil texture for the top 0–30 cm is obtained from the Harmonized World Soil Database version 1.2, a product from the Food and Agriculture Organization of the United Nations and the Vienna International Institute for Applied Systems (Wieder et al 2014), available at a 1 km × 1 km resolution (https://webarchive.iiasa.ac.at/Research/LUC/External-World-soil-database/HTML/). In addition, snow class data are also used to estimate snow density and snow thermal conductivity, from the seasonal snow classification system produced by Sturm et al (1995, 2010, 2021).
2.3. Thermal effect of snow
Snow cover plays an important role in heat exchange processes between the ground surface and the atmosphere. Its influences are complex, and generally insulate the ground throughout the winter, so that mean annual ground surface temperature is generally higher where snow depth is greater compared to adjacent areas with little snow (Sazonova and Romanovsky 2003). Here, we used the Ku model (Kudryavtsev et al 1977, Romanovsky 1987) to estimate the thermal effect of snow cover based on in-situ site observations. A snow module was incorporated in the Ku model which considers the damping of the amplitude of annual ground surface temperature due to snow as ΔAsn, which is proportional to the change in mean annual ground surface temperature ΔTsn (Sazonova and Romanovsky 2003; table 1). Specifically, the variable ΔAsn is the difference between the amplitude of the annual surface temperature with snow cover, and the amplitude without snow cover. Similarly, ΔTsn is the difference between the annual surface temperature with snow cover, and the annual surface temperature without snow cover,

Table 1. Variables used in the Ku model.
| Abbreviation | Variable | Units |
|---|---|---|
| Aa | Seasonal amplitude of air temperature variations | °C |
| MAAT | Mean annual air temperature | °C |
| Zsn | Winter-averaged snow depth | cm |
| Ksn | Snow thermal conductivity | W m−1 °C−1 |
| Csn | Volumetric heat capacity of snow cover | J kg−1 °C−1 |
| Cf, Ct | Volumetric soil heat capacity of frozen and thawed states | J m−3 °C−1 |
| ρ | Snow density | kg m−3 |
| Kf, Kt | Soil thermal conductivity of frozen and thawed soil | W m−1 °C−1 |
| ρs | Soil density | kg m−3 |
| ρwater | Liquid water density | kg m−3 |
| Ω | Volumetric soil water content | m3 m−3 |
| ΔAsn | Damping of annual ground surface temperature amplitude due to snow, the difference between the amplitude of the annual surface temperature with snow cover and the amplitude without snow cover | °C |
| ΔTsn | Damping of annual mean ground surface temperature due to snow, the difference between the annual surface temperature with snow cover and without snow cover | °C |
where τ is a one-year period (units: second), τ1 is the winter period (units: second), Aa (units: °C) the annual amplitude of air temperature, i.e. half of the difference between daily maximum and minimum air temperature over the year, and s and μ are calculated as:
For equations (4) and (5), Ksn—the thermal conductivity of seasonal snow—is calculated using its density (Sturm 1997). The determination of density includes snow age based on the day of year (DOY), with older snow generally being deeper and denser than younger snow, and indirectly includes the effects of climate (temperature and wind), as in Sturm et al (2010):
where density values for ρmax, ρmin, and ρ0
, and k1
and k2
—densification parameters for depth and DOY—are determined based on snow classes (table 4 in Sturm et al
2010),  (units: cm) is the snow depth for the ith observation.
The soil thermal conductivity (Ks) for its frozen (Kf) and thawed (Kt) state (equation (8)) is determined via soil texture, bulk density, and soil moisture. Jafarov and Schaefer (2016) indicated that peat layers on top of the soil can also play a role in the soil thermal conductivity. Thus, the specific heat capacity for dry soil (Cs) combines the effects of the mineral soil and peat, and is calculated separately for thawed (Ct) and frozen (Cf) soil (equation (9)). Detailed soil thermal parameterizations can be seen in Wang et al (2020). Soil moisture is used from the ERA5-land analysis product,
The effective heat capacity of the substrate below the snow cover is estimated with parameter Cef, which takes into account heat turnover (equation (10)). The two dimensionless variables α and β are analogous to the Stefan number—the ratio of sensible to latent heat—in the Neumann equation (Zarling 1987, Sazonova and Romanovsky 2003),
The latent heat of phase change was calculated as (Anisimov et al 1997):

2.4. Methods
To determine which variables potentially influence the thermal effect of snow cover, Pearson correlation is used to build the relationship between ΔTsn and MAAT, Aa , snow depth, snow days (the number of days with snow cover), freezing snow days (the number of days with snow cover when the daily air temperature is less than 0 °C), and freezing days (the number of days with daily air temperatures less than 0 °C). Partial correlation is used to determine the contribution of each factor by holding other factors constant, and multiple regression is used to analyze the variables' combined contributions to the snow cover effect. We chose the 95% confidence level to assess significance for all statistical analyses.
To analyze the spatial pattern of these variables across the Northern Hemisphere based on the observational sites, we only use stations where the number of days with missing air temperature and snow depth observations is fewer than 10 in any one-year period. Additionally, each site must have at least five years of data ensure statistically robust results. Considering these requirements, 2501 sites are used in this study. However, there is still the important caveat that the unequal time periods used for the spatial analysis can introduce uncertainties.
It is also important to acknowledge that our estimates of the effects of snow on the soil thermal regime are limited by sparsely distributed observing sites in parts of the N.H., and the bias or uncertainties of this are not considered in this study.
3. Results
3.1. Spatial variability of observations
The thermal effect of snow cover may be associated with other climate variables, therefore we present the spatial patterns of the multiyear-mean observational variables for the Northern Hemisphere (figure 1). These variables include MAAT, Aa , snow depth, snow days, freezing snow days, and freezing days. MAAT is negative north of 50° N and, in general, lower values are observed in the high latitudes and elevations, e.g. the pan-Arctic region and the Tibetan Plateau, with higher values in the low latitude regions, e.g. southern China. The MAAT mostly ranges from −15 °C to 20 °C, with a mean and standard deviation of 5.33 ± 6.40 °C across all sites. At 46.3% of all observing stations MAAT is between −5 °C and 5 °C. These spatial patterns in MAAT are similar to those from gridded and reanalysis surface air temperature data (Harris et al 2014, Gelaro et al 2017, Peng et al 2021a). The range for Aa is 10 °C–40 °C, with a mean and standard deviation of 22.16 ± 5.59 °C, and 86% of all sites have a seasonal range between 15 °C and 30 °C. That range can even be greater than 30 °C in many pan-Arctic regions. Snow depth tends to be less than 15 cm at approximately 39.6% of sites. The overall mean is 37.11 ± 40.94 cm, with the high standard deviation indicating strong variability across the Northern Hemisphere. There are high snow depth values in the mountain regions of the United States, which is also captured by the Sentinel-1 mission satellites (Lievens et al 2019). Northern Hemisphere snow days range from 0 to 280 d, and average 135.11 ± 82.51 d. This spatial pattern is similar to snow day variability from satellites, and high values again in the U.S. Rocky Mountains (Wang et al 2018). Finally, freezing snow days and freezing days indicate the same spatial patterns, with ranges from 0 to 280 d, averages of 109.93 ± 60.88 and 111.98 ± 60.76 d, respectively and a number of days greater than 100 at 69% of sites for both snow days and freezing days.

Figure 1. The spatial distribution of (a) MAAT, (b) Aa , (c) snow depth, (d) snow days, (e) freezing snow days, and (f) freezing days based on observations across the Northern Hemisphere. The histograms represent the distribution of each variable.
Download figure:
Standard image High-resolution image3.2. Thermal effect of snow cover
To evaluate the thermal effect of snow cover, we quantify the damping of annual mean ground surface temperature (ΔTsn) and the annual ground surface temperature amplitude (ΔAsn) at each station (figure 2). Across the Northern Hemisphere, ΔTsn ranges from 0 °C to 10 °C and averages 5.06 ± 3.15 °C, indicating a high variability. Damping does not exceed 5 °C south of 40° N in the Eurasian continent, increases poleward, and the maximum values (10 °C or higher) are observed in Central Siberia. At 49.2% of sites the damping is less than 5 °C, with the remaining 50.8% of sites experiencing more than 5 °C across the whole Northern Hemisphere. The spatial pattern of ΔAsn is the same as for ΔTsn. However, the magnitude is much higher, with values ranging 0 °C–20 °C, averaging 7.95 ± 4.95 °C. Across the Northern Hemisphere, 39.8% of sites experience seasonal amplitude damping less than 7 °C, and only 30.1% of stations have values greater than 10 °C.
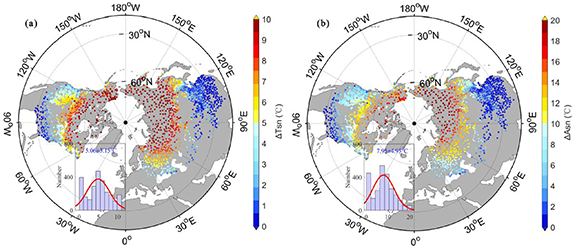
Figure 2. The spatial distribution of (a) ΔTsn and (b) ΔAsn in the Northern Hemisphere. The histograms represent the distribution of each variable.
Download figure:
Standard image High-resolution image3.3. Validation by comparisons with previous results
Given a lack of ground surface temperature measurements, comparisons between simulations and observations are difficult. Field measurements record the ground surface temperature at 0 cm or the shallow soil temperature, and a common approach to estimate the thermal effect of snow is to calculate the difference between air temperature and either that ground surface or shallow soil temperature during the snow period. However, because this approach also includes effects from vegetation and/or the top (shallow) soil layer, these temperature differences cannot truly isolate the thermal effect of the snow cover (Sherstiukov and Anisimov 2018).
To evaluate our thermal effect of snow cover results, we compare them to results from previous studies results based on a variety of methods. Sherstiukov and Anisimov (2018) used monthly mean values of snow surface temperature or soil surface temperature in summer, as well as the monthly mean values of soil temperature under the natural cover at soil depths of 20 and 40 cm (for summer and winter, respectively). They also assessed stations across Russia with a bare surface, to correct and reduce the effect of vegetation. The effect of snow cover on ground surface temperature ranged from 0 °C to 10 °C, with some sites reaching 15 °C under thick snow cover in central and eastern Siberia (Sherstiukov and Anisimov 2018). We also find that the thermal effect of snow cover mostly ranged 8 °C–10 °C and is greater than 10 °C at some sites in Russia. On the southern edge of the Altai Mountains, the difference between the snow surface and the ground surface is about −12.8 °C for a snow depth of 50 cm. The observed average air temperature and snow surface temperature for the 2011–2018 period were −11.17 °C and −14.82 °C, respectively, suggesting that the insulating effect of snow on the ground surface is approximately 9 °C (Zhang et al 2021). In our study, the insulating effect of snow cover on the southern edge of the Altai Mountains is about 4 °C–5 °C. However, the multiyear-mean snow depth is about 20 cm in our study (figure 1(c)), compared to 50 cm during the study period in Zhang et al (2021). Snow depth differences may result in errors in the snow effect. For the Emigrant Pass Observatory, observations between surface air temperature and ground temperature at 10 cm indicated that the difference is about 2 °C–3 °C during the snow-covered period (Bartlett et al 2004, table 2), which is also similar to our results. The amplitude of temperature during the snow cover period indicates that ΔAsn is smaller than Aa , which is shown by observations with a reduced amplitude in daily ground surface temperatures (Zhang 2005). Previous results with land surface models simulated differences between near-surface soil (20 cm) and air temperatures of 3 °C–14 °C during winter in Russian regions (Wang et al 2016), which is very similar to the results of our study. In all, although these comparisons are not direct, our range of values for the thermal effect of snow cover is similar to those from previous studies using different methods.
Table 2. Partial correlation coefficients between snow's thermal effect and the potential driving factors. The equation and R2 summarizes the multiple regression. Statistical significance at the 95% level is indicated with double asterisks.
| Factors | MAAT | Aa | SND | Snow days | Freezing days |
|---|---|---|---|---|---|
| Correlation | −0.29** | 0.32** | 0.75** | 0.22** | 0.01 |
ΔTsn = −1.06 − 0.10 × MAAT + 0.13 × Aa + 0.15 × SND + 0.03 × Snow days, R2 = 0.81**, p < 0.05.
3.4. Individual drivers of snow thermal effect
To account for the Northern Hemisphere's spatial patterns observed in the thermal effect of snow cover (figure 2), temperature and snow variables are correlated with ΔTsn. There is a negative correlation between MAAT and ΔTsn at 50% of all sites, located north of 45° N, while there are no significant correlations in the lower latitudes. Only 1% sites have a statistically significant positive correlation (figure 3(a)). Correlations of Aa and ΔTsn are exclusively positive (92% of sites; figure 3(b)). These positive Aa correlations suggest that decreasing air temperature amplitude reduces the damping effect of snow cover, and vice versa. A potential explanation could be that atmospheric circulation changes lead to anomalous water vapor transport, resulting in changes in downward (especially longwave) radiative flux via altered cloudiness and analogous atmospheric longwave emittance. These processes contribute to the heat flux balance of the snowpack and thus snow cover variability (Ye and Lau 2017). In addition, the greater range of air temperature—larger during the cold and warming period—contributes to both snow cover thickness and duration.
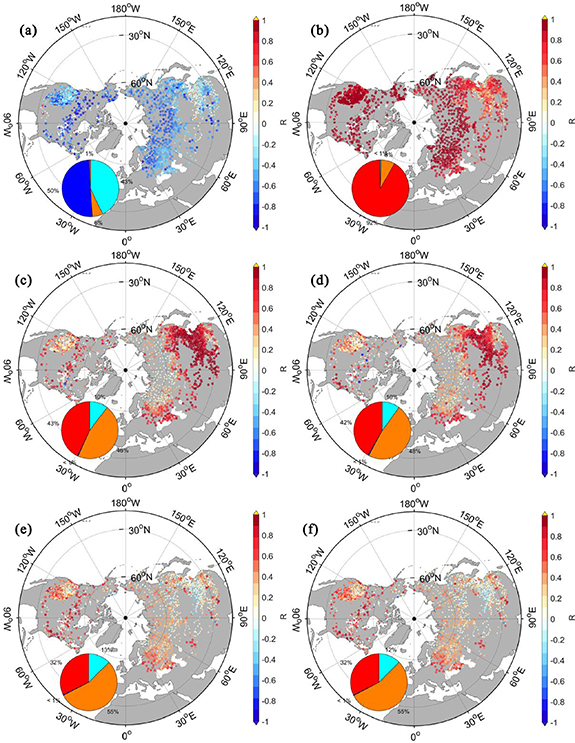
Figure 3. ΔTsn across the Northern Hemisphere correlated with (a) MAAT, (b) Aa , (c) snow depth, (d) snow days, (e) freezing snow days, and (f) freezing days. Circles denote stations with statistically significant correlations, whereas triangles are not significant. The pie chart insets represent the percentage of station with statistically significant positive (red), negative (blue), and non-significant positive (orange) and negative (turquoise) correlations.
Download figure:
Standard image High-resolution imageThe correlation between snow depth and snow days with ΔTsn indicates that 43% and 42% of sites, respectively, show a statistically significant positive relationship (figures 3(c) and (d)). These sites with positive correlations are mostly in areas with shallow and short-duration snow cover. The spatial pattern of correlations between freezing snow days and freezing days with ΔTsn is again similar (figures 3(e) and (f)) and statistically significant at 32% of sites. These positively correlated sites, as well as the ones with negative correlations, are located in low latitude regions (figures 3(e) and (f)). This suggests that snow depth contributes to the positive damping effect (Harris 1981, Zhang 2005).
3.5. Combined drivers of snow thermal effect
The above discussion focused on the correlation between a single variable and the insulating effect of snow cover. However, snow insulation is likely affected by several variables concurrently. We thus consider snow depth as the primary factor and combine it with all combinations of two other factors to assess their joint contribution (figure 4).
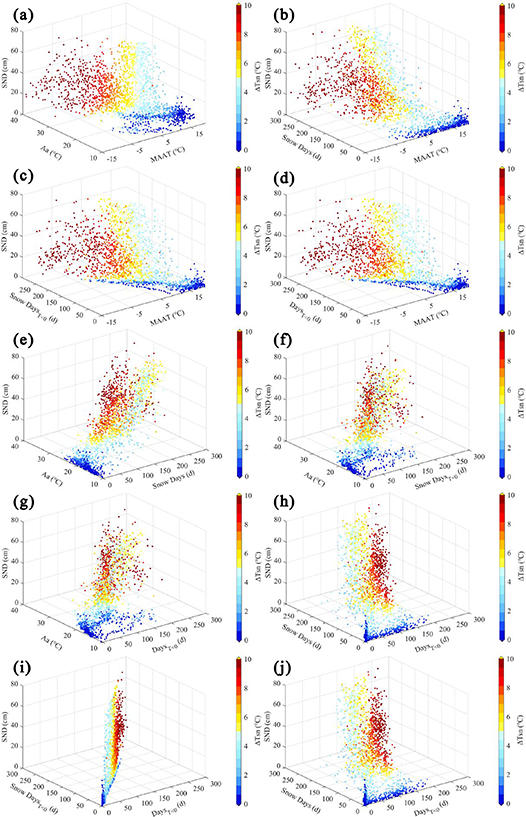
Figure 4. Relationship between snow depth (SND, z axis) and combinations of two other variables (x and y axes) on the snow thermal effect (ΔTsn).
Download figure:
Standard image High-resolution image
Increased snow depth combined with a lower MAAT and greater Aa results in a stronger insulating effect (figure 4(a)), likely because cold conditions and bigger range of air temperatures facilitate precipitation. Sites with a stronger insulating effect are the ones with low air temperatures and higher snow days (figure 4(b)). Both high freezing snow days (figure 4(c)) or high freezing days (figure 4(d)) combined with low MAAT and snow depth, are advantageous for insulation. Thus, Aa and snow days or freezing snow days enhance the insulating effect when MAAT and snow depth are fixed. It could be that cold conditions and great variability in air temperature result in a longer duration of snow cover.
When fixing snow depth and Aa , we find that snow days result in a strong insulating effect (figures 4(e)–(g)). But if the freezing days or freezing snow days are not high, the insulating effect can be low, suggesting that freezing temperatures are critical. When fixing snow depth with snow days and freezing snow days, the freezing temperatures again strongly benefit the insulating effect (figures 4(h)–(j)), especially when the snow depth is constant (figure 4(i)).
To better quantify the above associations between multiple factors and the snow effect, we apply partial correlation and multiple regression. There is a significant positive partial correlation between snow depth and the snow effect when the other factors are excluded (table 2), indicating that snow depth controls snow's insulating ability. Partial correlation also revealed that snow effect is positively correlated with Aa and snow days, at R = 0.32 and 0.22, respectively. There is a negative partial correlation with MAAT (R = 0.29, table 2), but no significant correlation with freezing days. Excluding freezing days and combining all four significant factors, the multiple regression indicates that they account for 81% of the variance in the snow's thermal effect (table 2).
Here, we demonstrate that MAAT and the range in air temperature can also have an important effect, in addition to snow depth and duration, because all these variables combined contribute to the effect of snow cover. In addition to these factors, active layer thickness and the soil properties in permafrost can impact the snow effect (Smith and Riseborough 2002, Throop et al 2012). Sites where MAATs and the soil moisture content of the active layer are relatively high, latent heating and a slower freeze-back of the active layer could impact the snow effect on the ground surface temperature (Throop et al 2012), also in non-permafrost areas due to seasonal freezing. At sites underlain by bedrock with a thin overburden layer that is ice-poor, latent heat effects are reduced and the active layer refreezes rapidly in autumn, allowing surface temperatures to decrease and resulting in a stronger snow effect (Throop et al 2012).
4. Summary and conclusion
We analyzed the effect of winter snow cover on the ground surface temperature across the Northern Hemisphere based on 2501 in-situ sites. This allowed us to describe the spatial pattern and the amplitude of just the snow cover effect, rather than the combined effect of snow and vegetation. We also assess the potential forcing variables of the snow's thermal effect. Our results reveal that the damping of the annual mean ground surface temperature due to snow alone ranges from 0 °C to 10 °C, with a mean of 5.06 ± 3.15 °C, and the damping of the annual ground surface temperature amplitude ranges from 0 °C to 20 °C, with a mean of 7.95 ± 4.95 °C across the Northern Hemisphere. The spatial pattern also showed that snow's insulating effect is higher in high latitudes, and lower in lower latitudes. Individually, MAAT has a negative correlation with snow's insulating effect, and a positive correlation for amplitude of air temperature. Snow days and freezing days also have a positive correlation. Further, when combined, these factors jointly contribute to the forcing of snow's insulating effect. Our results, based on in-situ sites, provide an important observational perspective to understanding the intersection between frozen ground and snow.
Acknowledgments
We thank the reviewers whose thoughtful and detailed evaluations greatly improved our manuscript. This study was supported by the National Natural Science Foundation of China (Grant Nos. 42161160328, 42171120), the National Key R&D Program of China (2019YFA0607003), and the Fundamental Research Funds for the Central Universities (lzujbky-2023-01, lzujbky-2021-ct13).
Data availability statement
No new data were created or analysed in this study.