

Abstract
Several recent widespread temperature extremes across the United States (U.S.) have been associated with power outages, disrupting access to electricity at times that are critical for the health and well-being of communities. Building resilience to such extremes in our energy infrastructure needs a comprehensive understanding of their spatial and temporal characteristics. In this study, we systematically quantify the frequency, extent, duration, and intensity of widespread temperature extremes and their associated energy demand in the six North American Electric Reliability Corporation regions using ERA5 reanalysis data. We show that every region has experienced hot or cold extremes that affected nearly their entire extent and such events were associated with substantially higher energy demand, resulting in simultaneous stress across the entire electric gird. The western U.S. experienced significant increases in the frequency (123%), extent (32%), duration (55%) and intensity (29%) of hot extremes and Texas experienced significant increases in the frequency (132%) of hot extremes. The frequency of cold extremes has decreased across most regions without substantial changes in other characteristics. Using power outage data, we show that recent widespread extremes in nearly every region have coincided with power outages, and such outages account for between 12%–52% of all weather-related outages in the past decade depending on the region. Importantly, we find that solar potential is significantly higher during widespread hot extremes in all six regions and during widespread cold extremes in five of the six regions. Further, wind potential is significantly higher during widespread hot or cold extremes in at least three regions. Our findings indicate that increased solar and wind capacity could be leveraged to meet the higher demand for energy during such widespread extremes, improving the resilience and reliability of our energy systems in addition to limiting carbon emissions.
Export citation and abstract BibTeX RIS

Original content from this work may be used under the terms of the Creative Commons Attribution 4.0 license. Any further distribution of this work must maintain attribution to the author(s) and the title of the work, journal citation and DOI.
1. Introduction
Recent temperature extremes across the United States (U.S.) have exposed vulnerabilities in regional energy systems. In February 2021, the North American cold wave resulted in power outages for >4.5 million homes in Texas alone (Busby et al 2021, Doss-Gollin et al 2021), and in June 2021, the record-shattering Pacific Northwest heat wave was associated with power outages affecting thousands of households and businesses (Geranios 2021, KOIN 6 News 2021, Bartusek et al 2022). Power outages coincident with such extremes can expose individuals to life-threatening temperatures, exacerbate pre-existing medical conditions and impair the response capability of communities by affecting healthcare facilities and other critical infrastructure (Ebi et al 2021, Stone et al 2021). Outages often disproportionately impact overburdened and low-income communities due to higher exposure to climate hazards, poor infrastructure, and inequities in energy management (Chen et al 2022, Do et al 2023, Zamuda et al 2023). For instance, during the 2021 cold wave, low-income and majority-black neighborhoods experienced multi-day power outages earlier and for longer durations (Dobbins and Tabuchi 2021, Lee et al 2022, Flores et al 2023). Consequently, the design, operation, and planning for more equitable and resilient electricity systems necessitates an understanding of changing climate risks and their resulting influence on energy demand and supply (Chen et al 2022).
Climate change is already affecting the characteristics of temperature extremes across the U.S. (Vose et al 2017, Marvel et al 2023). Heat waves have increased in frequency, severity, and duration over parts of the U.S. (Habeeb et al 2015, Lyon and Barnston 2017, Lopez et al 2018, Keellings and Moradkhani 2020, Perkins-Kirkpatrick and Lewis 2020) and are projected to continue to increase with further warming (Lyon et al 2019). In contrast, cold extremes have generally become less frequent and severe across most of the U.S., with these trends also projected to continue (van Oldenborgh et al 2019, Smith and Sheridan 2020, Blackport et al 2022). However, natural variability will continue to drive widespread cold air outbreaks, such as the February 2021 cold wave, though they will likely be relatively warmer and less frequent than present (Gao et al 2015, Cohen et al 2021, Smith and Sheridan 2021, Blackport et al 2022, Smith et al 2022).
In addition to these well-studied characteristics of extremes, an understanding of how these extremes affect energy demand and interconnected systems such as the energy grid requires an assessment of the geographic region and the number of people affected (Zamuda et al 2018). Recent studies have shown that the spatial extent of heat waves across the U.S. and other regions is increasing with warming (Lyon and Barnston 2017, Lyon et al 2019, Rogers et al 2022). However, an analysis of the spatial extent of heat waves and cold waves across different U.S. energy grids is currently lacking.
Household energy demand typically peaks during temperature extremes due to increased use of heating or cooling systems. Temperature extremes also affect energy supply by directly damaging energy infrastructure including transmission lines, and overheating transformers during heat waves or freezing natural gas pipelines during cold waves (Añel et al 2017, Zamuda et al 2018, Fischels 2021). Extreme temperatures can also influence the production capacity of fossil fuel-based and renewable resources, and these effects can be contrasting depending on the energy sources (e.g. Pryor and Barthelmie 2013, Ravestein et al 2018, Perera et al 2020, Busby et al 2021, Coffel and Mankin 2021). For instance, while energy from natural gas, coal, and wind experienced reductions of ∼37%, 43%, and 46% during the February 2021 Texas cold wave, solar capacity was 157% higher than typical (Busby et al 2021). The U.S. Energy Information Administration (EIA) projects that 24% of electricity generation in the U.S. would come from renewables in 2024, with solar and wind accounting for most of the growth in generation capacity (U.S. Energy Information Administration (EIA) 2023). Solar and wind offer many advantages over fossil fuels, including the potential for distributed energy systems that allow communities to be self-reliant, a key step towards energy and climate justice (Jenkins et al 2016, Stephens 2022). However, the efficiency and power output of solar and wind generation can be reduced by extreme conditions depending on the region (Patt et al 2013, Pryor and Barthelmie 2013, Novacheck et al 2021).
In this study, we investigate widespread hot and cold extremes and their influence on electricity demand and supply potential from renewable resources within the interconnected North American Electric Reliability Corporation (NERC) regions. We specifically focus on quantifying: (1) the spatiotemporal characteristics of widespread temperature extremes; (2) energy demand and power outages during widespread extremes; (3) theoretical changes in renewable energy (wind and solar) potential during widespread extremes; and (4) interannual variability and trends in widespread extremes. Our findings can inform the design and planning of energy systems, energy demand forecasts, resource allocation, and preparedness to reduce the risk of outages (Orlov et al 2020). We note that our analysis focuses mainly on energy supply potential and more comprehensive modeling and evaluation of the energy grid including generation, transmission, distribution, and equitable access is required to evaluate overall resilience of the U.S. energy system.
2. Data and methods
2.1. Climate data
We use hourly atmospheric data from the European Centre for Medium-Range Weather Forecasts ERA5 reanalysis (Hersbach et al 2020). We use 2 m dry-bulb temperatures between 0–23 UTC to calculate daily maximum temperature, surface solar radiation downwards (SSRD) to calculate daily cumulative solar potential, and 100 m U and V wind components to calculate daily maximum wind speeds (WS) and wind potential (100 m represents the approximate hub height of modern wind turbines; Hartman 2022).
2.2. Regions
We quantify widespread hot and cold extremes across the six NERC regional entities (figure 1(a))—Western Electricity Coordinating Council (WECC), Midwest Reliability Organization (MRO), Texas Reliability Entity (TRE), Southeastern and Central Regional Reliability Corporation (SERC), Reliability First Corporation (RFC), and Northeast Power Coordinating Council (NPCC). NERC regions are used because local electricity grids within these regions are interconnected to enable resource sharing, energy reliability, and security, as well as to coordinate operations, monitoring, and infrastructure resilience (NERC 2023).

Figure 1. Characteristics of widespread extremes: (a) North American Electric Reliability Corporation (NERC) Regions. (b) Frequency, (c) extent, (d) cumulative intensity and (e) duration of widespread cold extremes (blue) in winter (DJF) and widespread hot extremes (red) in summer (JJA) during 1980–2021 in each NERC region. Dots indicate years with the maximum value for each metric in each region. In some regions, the maximum value of a characteristic occurred in multiple years; years indicate the first occurrence of the maximum.
Download figure:
Standard image High-resolution image2.3. Extreme temperature event metrics
We define hot extremes in summer (June–August) and cold extremes in winter (December–February) as standardized daily temperature anomalies exceeding ±1.5 σ . These standardized anomalies are calculated by removing the 15 day local climatological (1991–2020) mean centered on that date and dividing by the climatological standard deviation of daily temperatures for that 15-day window. This is done to remove the seasonal cycle and account for the local conditions residents are acclimated to. Cold anomalies are multiplied by −1 to facilitate easier comparison with hot anomalies. For each day, we calculate the fractional area in each region experiencing hot or cold extremes. Widespread extremes are days in the top quintile of area affected by extremes, calculated from all days in a region when extremes occur in at least one grid cell. The top quintile threshold was selected to have sufficient sampling of events for calculating statistics. We define frequency as the number of widespread extremes in a season, extent as the fraction of the region under temperature extremes, duration as the number of consecutive widespread extremes, and cumulative intensity as the sum of the standardized temperature anomalies multiplied by area (km2) across all grid cells with extremes within each region.
2.4. Energy demand proxy
Degree days is a measure of heat or cold in a location (Quayle and Diaz 1980, Heim et al 2003, Shaffer et al 2022) that is commonly used to represent the weather-driven component of energy demand (Waite and Modi 2020, Doss-Gollin et al 2021, Lee and Dessler 2022), as the two are correlated (Quayle and Diaz 1980, Heim et al 2003, Lee and Dessler 2022). We use cooling degree days (CDD) in summer and heating degree days (HDD) in winter as proxies for energy demand following the widely-used American Society of Heating, Refrigerating, and Air-Conditioning method (Thevenard 2011). These are calculated as follows:
where  is dry-bulb temperature. This widely used metric assumes energy use for heating (cooling) when temperatures are below (above) 18 °C (64.4° F), and thus provides an approximation of energy demand that does not require representing the technological, social, and other factors that shape local electricity demand (Doss-Gollin et al
2023). Degree days are multiplied by the 2020 population (CIESIN 2016) for each grid cell to calculate population-weighted energy demand as in Doss-Gollin et al (2021). Total degree days are summed over the entire region for each widespread extreme and non-extreme day.
is dry-bulb temperature. This widely used metric assumes energy use for heating (cooling) when temperatures are below (above) 18 °C (64.4° F), and thus provides an approximation of energy demand that does not require representing the technological, social, and other factors that shape local electricity demand (Doss-Gollin et al
2023). Degree days are multiplied by the 2020 population (CIESIN 2016) for each grid cell to calculate population-weighted energy demand as in Doss-Gollin et al (2021). Total degree days are summed over the entire region for each widespread extreme and non-extreme day.
2.5. Solar and wind potential
We use daily cumulative SSRD and daily maximum 100 m WS data to calculate solar potential and wind potential, respectively. These metrics are proxies for how much renewable energy can be theoretically produced each day. Wind potential is measured by the wind capacity factor, which is the wind power per turbine (in kW) divided by the maximum power generated, and solar potential for a photovoltaic panel (PV) is similarly measured by solar capacity factor. These metrics are calculated following (Bett and Thornton 2016, Amonkar et al 2022):
where WS = daily maximum windspeed, a = 634.228, b = 1248.5, c = 999.57, d = 426.224, e = 105.617, f = 15.5487, g = 1.3223, h = 0.0609186, and i = 0.001162565. a–i are coefficients from the wind power curve for a V90-2.0 MW Vestas turbine from Amonkar et al (2022). These coefficients and the cut-in (3 m s−1; speed at which the turbine starts to generate power), rated (13 m s−1), and cut-out (25 m s−1; speed at which the turbine is mechanically limited and needs to shut down to avoid damage) speed thresholds are turbine-specific and could vary for different turbines. We convert the wind power into a unitless wind capacity factor by dividing the calculated wind power by the maximum operating power output of 2000 kW. Since we are using a wind power curve to calculate the wind capacity factor, the mechanical efficiency is incorporated. However, wind power efficiency losses due to temperature or icing are not accounted for.
Solar capacity factor is calculated using the following equation:
where G is the irradiance or the SSRD; GSTC = irradiance at standard testing conditions (STC) of 1000 W m−2 and  is the relative efficiency that accounts for variations in performance of the PV with temperature.
  is calculated from the PV module temperature (Tmod), standard testing temperature (TSTC
= 25°C), ambient temperature (T0
=
20°C), and nominal operating cell temperature (TNOCT
= 48°C). The module temperature is calculated as follows:
is calculated from the PV module temperature (Tmod), standard testing temperature (TSTC
= 25°C), ambient temperature (T0
=
20°C), and nominal operating cell temperature (TNOCT
= 48°C). The module temperature is calculated as follows:
where the irradiance G0 = 800 W m−2. Using Tmod, the relative efficiency  is calculated using the following equation:
 ;
;  ;
;  =
=  ;
;  =
=  ;
;  =
= 
 ), and G' = G/GSTC.
2.6. Power outage data
Annual summaries of electrical disturbances compiled by the U.S. Department of Energy (DOE) Office of Cybersecurity, Energy Security, and Emergency Response (ISER—electric disturbance events (DOE-417), 2023) are used to examine power outages associated with 'severe weather' from 2012–2021. Within each region, we identify the days on which weather-related outages coincide with widespread extremes and refer to them as extreme-related power outages. Non-weather related outages and unmatched outages are excluded from our analysis. Power outages during widespread temperature extremes could occur due to supply shortages from reductions in power generation capacity or failures in the transmission or distribution infrastructure such as sagging power lines due to heat or ice accumulation or strong winds during winter storms. The outage data does not include detailed information on the cause of the outage beyond categorizing them as 'severe weather' disturbances nor the precise location of outages within the NERC region in which they occurred. Linking the outage to the specific weather conditions during widespread extremes would require the outage location to co-locate with weather conditions. In the absence of such data, we focus on the coincidence of outages with widespread temperature extremes in each region.
2.7. Natural climate variability modes
To examine the influence of modes of variability on widespread extremes characteristics, we use standardized indices of the Arctic Oscillation (AO), North Atlantic Oscillation (NAO), El Niño-Southern Oscillation (ENSO; Niño3.4), and Pacific/North American pattern (PNA) (https://psl.noaa.gov/data/climateindices/list/). The positive and negative phases for each mode are defined as months with standardized anomalies exceeding ±0.5.
3. Results and discussion
3.1. Characteristics and trends of widespread temperature extremes
First, we quantify the frequency, extent, intensity, and duration of widespread hot and cold extremes (1980–2021). Median characteristics vary substantially across seasons and NERC regions, as does their variability (figure 1). WECC, MRO, and SERC have the highest median frequencies of widespread cold extremes (11.5, 9, and 7.5 d-per-year) and hot extremes (13, 9.5, and 11 d-per-year, figure 1(b)). However, individual years can have substantially more events. For instance, during the 1983–1984 winter, TRE and MRO recorded their highest number of widespread cold extremes, ∼5 times and 2 times higher than their median, respectively. Similarly, the record high frequency of widespread hot extremes in TRE and SERC in 2011, in MRO, NPCC, and RFC in 1988 and in WECC in 2021, exceeded their corresponding medians by a factor of 4.
Every region has experienced at least one widespread cold or hot extreme that affected nearly the entire region. Widespread cold extremes typically affect larger fractions of each region than widespread hot extremes, and have higher cumulative intensities (figures 1(b) and (c)). NPCC and TRE have the largest extents of widespread cold extremes, with their medians exceeding 85%. Some events that affected the entire extent of these region lasted multiple days. For example, the February 2021 cold wave included several days with 100% of TRE affected and the highest cumulative intensity day. In winter 1983–84, MRO, SERC, and RFC experienced their most intense cold extremes. This winter also produced the largest cold events for SERC and RFC. While extent is standardized by region size making their maximum extents similar across regions, cumulative intensity depends on region size. Therefore, the regions with the highest extents do not have the highest maximum or median intensities—these are typically experienced in WECC and MRO.
For widespread hot extremes, the largest median extents (∼60%) also occur in NPCC, followed by RFC (∼44%), whereas the median extent in all other regions is <32%. The relatively large extent of both widespread hot and cold extremes in these regions is likely due to their small sizes and regionally homogenous response to synoptic-scale temperature extremes. The largest region—WECC, has the smallest median fractional extent of widespread hot extremes (typically <25%). However, in 2021 WECC experienced multiple heat days that affected up to ∼70% of the region simultaneously and contributed to the highest cumulative intensity during 1980–2021.
The median duration of widespread extremes is ∼1–2 d, but every region has experienced protracted events that have resulted in substantial damages (figure 1(e)). For example, during the 1983–84 winter, MRO and TRE experienced 14- and 9 day stretches of widespread cold extremes, respectively, during a cold wave that broke duration records in many cities, resulting in economic damages of ∼6.2 billion USD (in 2023 dollars; NOAA Billion Dollar Weather disaster database; Ludlum 1984)). While event extents and intensities are typically greater in winter, frequencies, and durations are generally greatest in summer. Multiple regions experienced widespread hot extremes lasting >10 d, with the longest event lasting 22 d in SERC in 2011. MRO and TRE experienced their longest lasting widespread hot extremes (14 and 11 d, respectively) in 1980, during a prolonged hot, dry summer which resulted in economic losses of at least 39.7 billion USD (in 2023 dollars; NOAA Billion Dollar Weather disaster database; Karl and Quayle 1981). In WECC, the longest hot event (18 days in 2020) contributed to severe wildfire activity and a multi-week widespread air pollution episode across the western U.S. (Kalashnikov et al 2022).
3.2. Energy demand and power outages
Hot and cold extremes often drive peak demands for energy, the prediction of which is an important component of resource planning on seasonal time scales (Zamuda et al 2018). To compare the energy demand during days with widespread extremes to normal days, we calculate the population-weighted HDD and CDD (equation (1)). Widespread extremes are associated with significantly higher median energy demand (HDD and CDD) in all regions, relative to demand on non-extreme days (figures 2(a) and (b)). Differences between degree-day distributions on extreme and non-extreme days are larger for widespread cold extremes, compared to widespread hot extremes, likely due to their greater extents and cumulative intensities (figures 1(c) and (d)). During winter, the median HDD is greatest in RFC, nearly 2 times that on non-extreme days. Similar ratios are also seen in TRE and SERC (figure 2(a)). During summer, the median CDD is greatest in SERC, WECC, and RFC, and widespread hot extremes also significantly amplify CDD compared to non-extreme days (figure 2(b)).

Figure 2. Energy demand and power outages: Distributions of population-weighted (a) heating degree days (HDD) during widespread cold extremes (blue) and DJF non-extreme days (gray) and (b) cooling degree days (CDD) during widespread hot extremes (red) and JJA non-extreme days (gray). The distributions of degree days in all regions are significantly different than their distributions on non-extreme days in both seasons (p-value ≪0.01). Colored and gray circles in (a), (b) indicate days with weather-related power outages. (c–d) Number of days with weather-related power outages coincident with widespread extremes in DJF and JJA (2012–2021). Numbers above the bars indicate the fraction of outage days coinciding with widespread extreme days in each region. (e–f) Percentage of widespread extremes in each year with weather-related power outages.
Download figure:
Standard image High-resolution imageThe increase in energy demand along with direct impacts to electricity infrastructure (Dawson et al 2018, Climate Central 2022) have resulted in power outages in all NERC regions in at least one season in the past decade (figures 2(c) and (f)). Using data between 2012–2021, we quantify widespread extreme days with power outages, fraction of days with weather-related outages that coincide with widespread extremes, and the annual fraction of widespread extremes with an outage. Across all years, SERC and TRE have experienced the highest number of widespread cold extremes with outages, accounting for ∼19% and 53% of all winter days experiencing weather-related outages, respectively (figure 2(c)). In 2021, ⩾42% of widespread cold extremes were associated with power outages in every region except NPCC, including 100% of events in TRE and RFC (figure 2(e)). In summer seasons, RFC has experienced the highest number of widespread hot extremes with outages, accounting for ∼26% of all summer days with weather-related outages (figure 2(d)). In four of the past ten summers, >50% of widespread hot extremes in RFC have been associated with outages, the highest among all 6 regions (figure 2(f)). These results suggest that the electricity infrastructure in RFC is considerably more vulnerable to widespread hot extremes than other regions whereas SERC and TRE are relatively more vulnerable to widespread cold extremes. Although WECC has a relatively lower absolute number of outages than these regions, widespread heat extreme-related outages account for 41% of all summer days with weather-related outages in this region, a majority of which occurred in 2020 (figures 2(d) and (f)). Notably, NPCC has experienced no outages associated with widespread cold extremes during this period.
3.3. Solar and wind energy potential
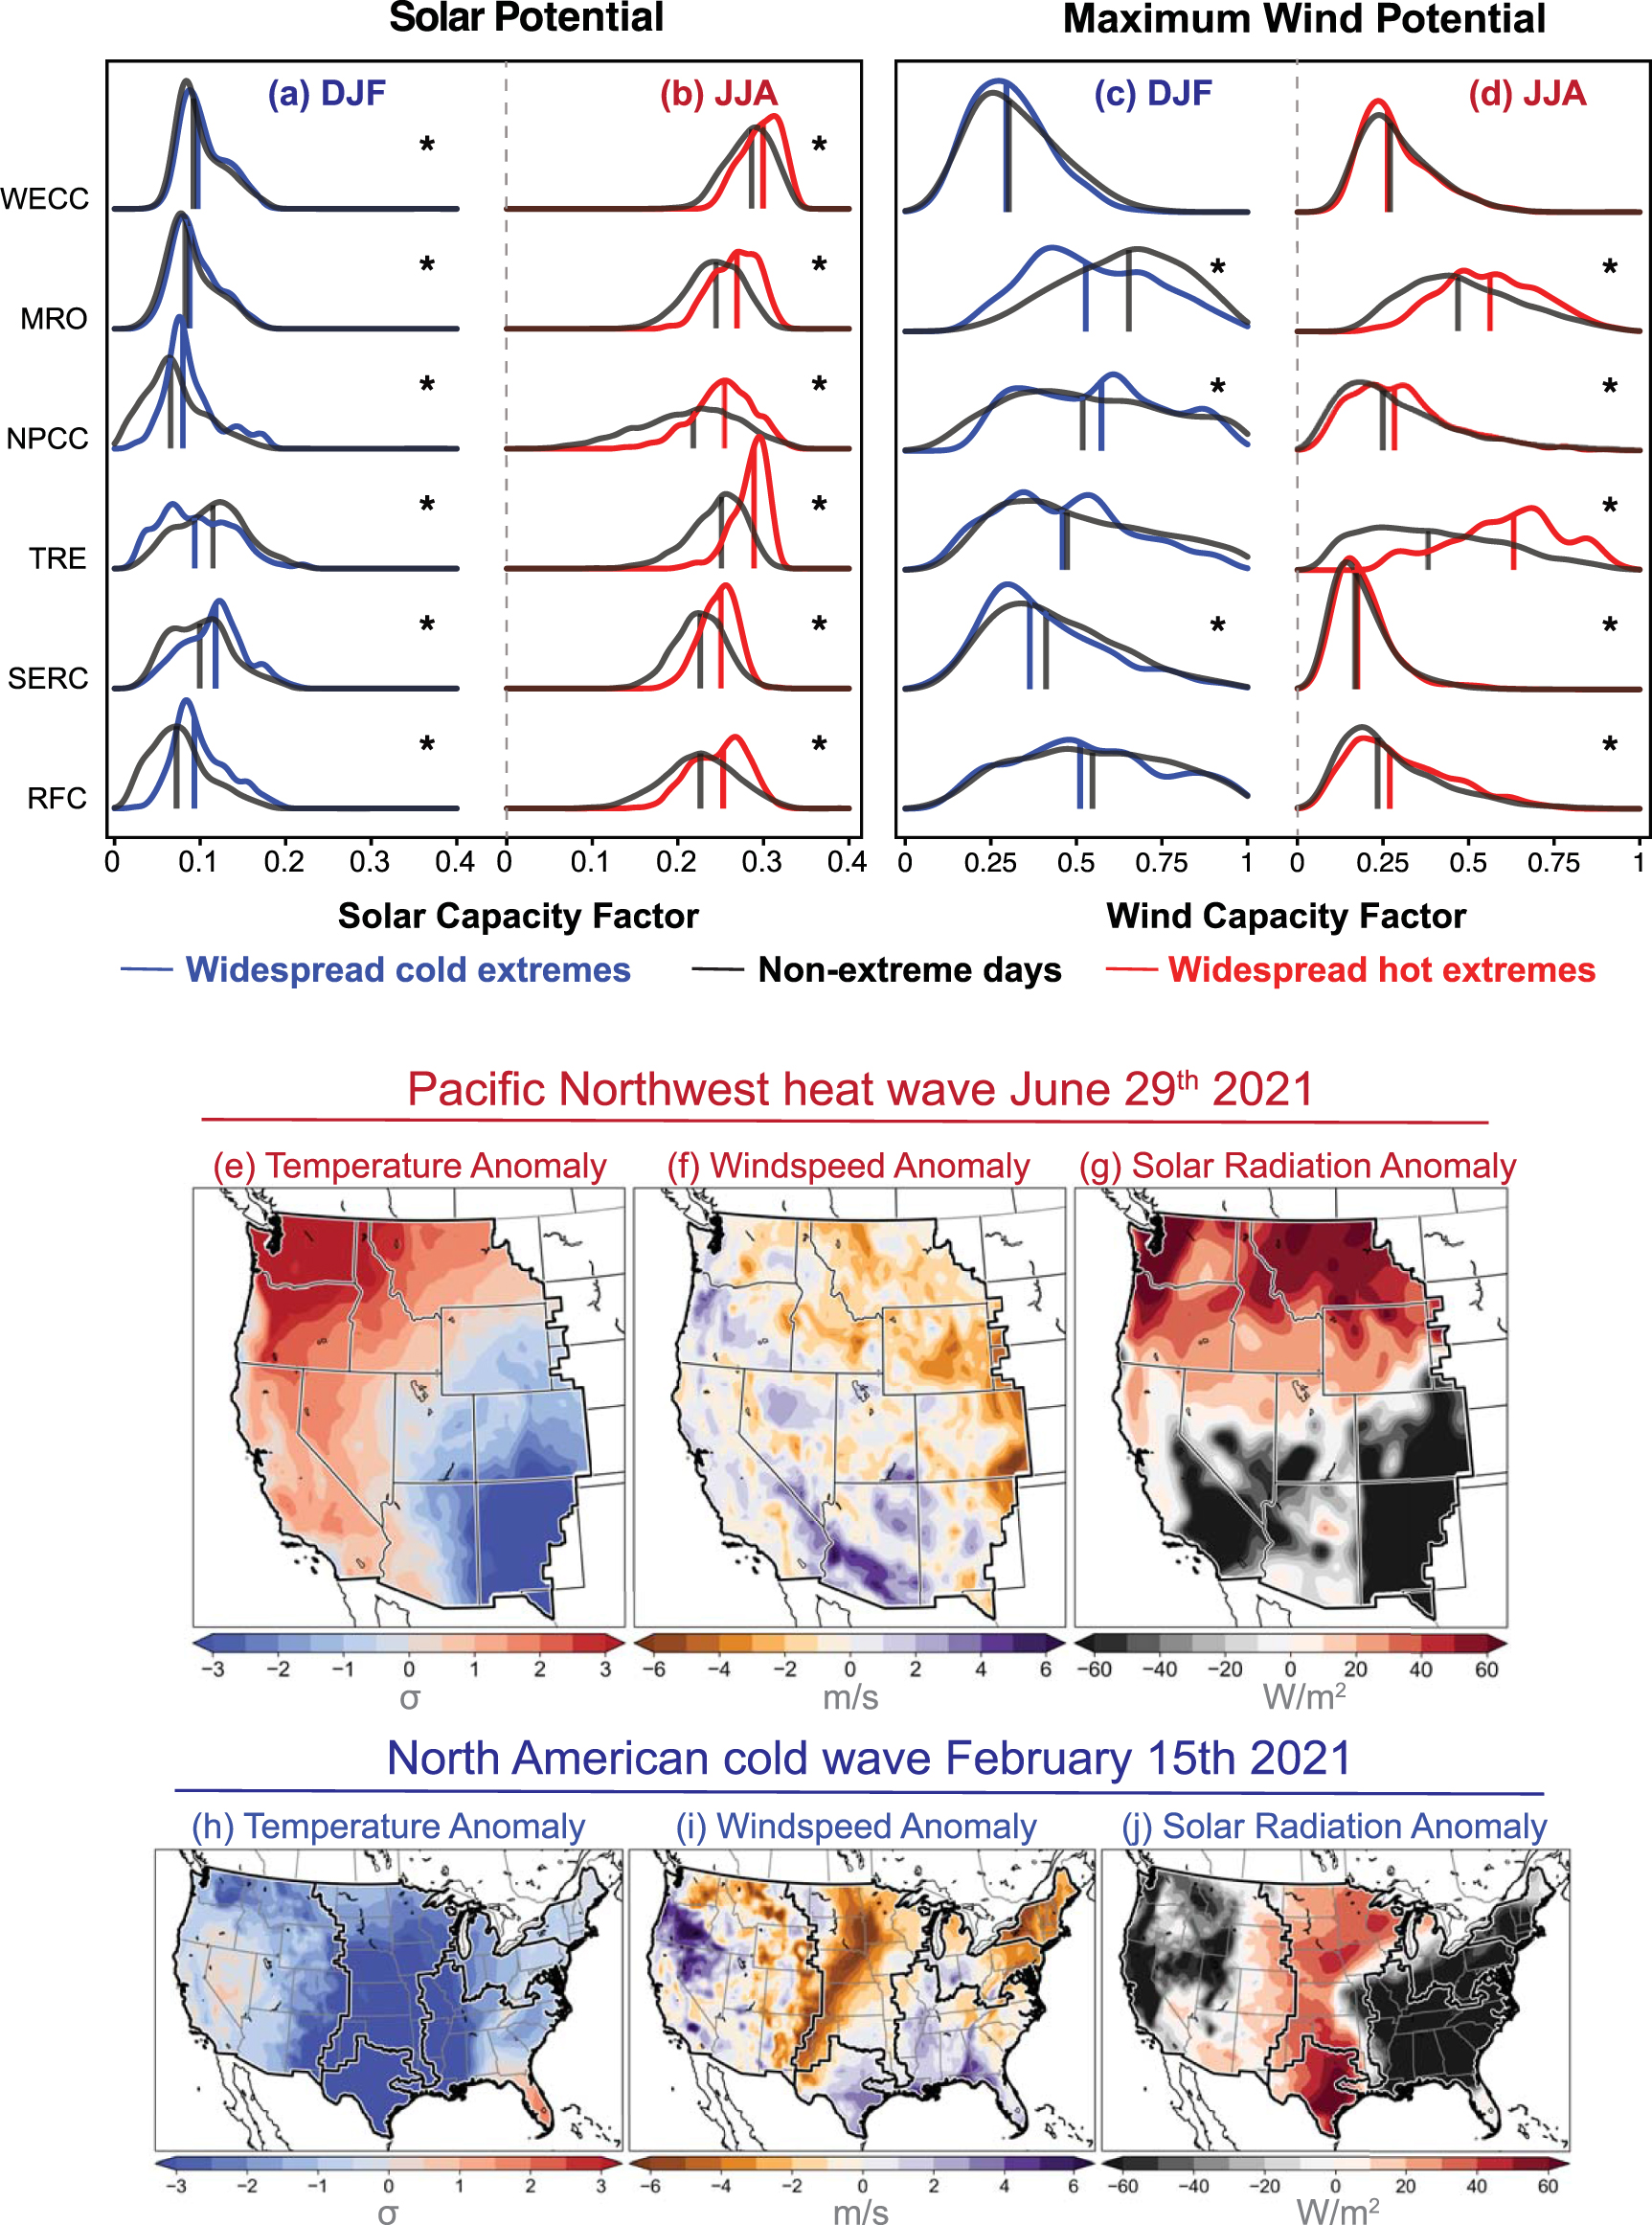
The risk of power outages during extremes could be exacerbated by coincident reductions in energy supply. The meteorological processes that drive widespread temperature extremes also affect surface solar radiation and wind speeds, and thus have the potential to affect the capacity of solar and wind energy systems. Therefore, we examine how energy potential from these sources is affected during widespread extremes. The median regional-average solar capacity factor is significantly higher in most regions during widespread cold extremes, with the largest increases over RFC, SERC, and NPCC and smallest increases over WECC and MRO (figure 3(a)). TRE is the exception where the solar capacity factor is significantly lower during widespread cold extremes. Similarly, the median regionally averaged solar capacity factor is significantly higher during widespread hot extremes than during non-extreme days in all regions, with the largest increase in TRE (figure 3(b)). These results suggest that all regions could likely benefit from expanding solar capacity to enhance electricity generation during widespread temperature extremes.
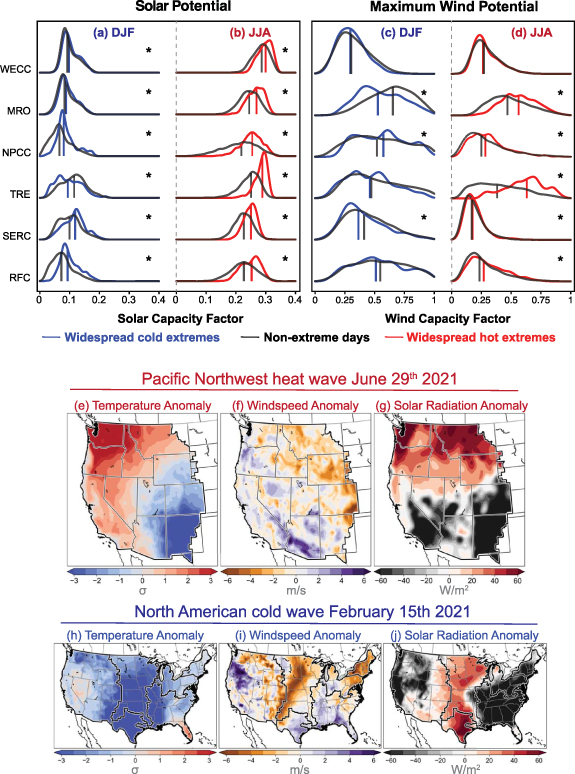
Figure 3. Solar and wind energy potential during widespread extremes: Distributions of area-averaged (a–b) solar energy potential, calculated using solar capacity factor, and (c–d) wind energy potential, calculated using wind capacity factor (equations 2, 3). Blue curves show the distributions of energy potential during widespread cold extremes, and red curves show the distributions during widespread hot extremes. Black curves show the distributions on non-extreme days in the respective seasons. The vertical lines represent medians of the distributions, and stars beside each panel indicate that the medians of the widespread extreme and non-extreme distributions are significantly different at the 10% level based on a permutation test. (e)–(g) Standardized temperature anomalies, wind speed anomalies, and solar radiation anomalies for the hottest day of the Pacific Northwest heat wave (29th June 2021). (h)–(j) Same as in (e)–(g) but on the coldest day of the North American cold wave (15th February 2021), identified as the day with the highest cumulative intensity over TRE (other regions had their coldest temperatures on different days). Refer figure S2 for climatology of wind and solar potential.
Download figure:
Standard image High-resolution imageThe response of wind energy potential on widespread temperature extreme days is more varied across regions than solar potential. NPCC is the only region with significantly higher median wind potential during widespread cold extremes relative to non-extreme days (figure 3(c)). Conversely, wind potential across SERC and MRO is significantly lower during widespread cold extremes, whereas across WECC and TRE the differences are statistically indistinguishable (figure 3(c)). In contrast, wind potential during widespread hot extremes is significantly higher over all regions except WECC relative to non-extreme days. The largest increases in median wind potential during widespread hot extremes occurs over TRE and MRO, suggesting that these regions could likely benefit most from increased wind generation capacity during hot events.
Enhanced solar potential during widespread hot extremes is because such events are primarily associated with atmospheric ridges (Horton et al 2015, Grotjahn et al 2016, Loikith et al 2017, Xie et al 2017, Agel et al 2021). Ridges are typically associated with clear skies that allow more solar radiation to reach the surface, however these conditions can also decrease wind potential in some areas. For example, during the hottest day of the 2021 Pacific Northwest heat wave (29th June), solar radiation was higher than average across areas of WECC experiencing the largest positive temperature anomalies (figures 3(e)–(g)). Near-surface winds were below-normal across much of the northern and eastern part of WECC (figure 3(f)), the leading edge of the associated ridge. Due to the large size of WECC compared to other regions, temperature, wind, and solar conditions vary spatially during such extremes. For example, solar anomalies were below normal over southeastern WECC where cool anomalies persisted while wind anomalies were above normal over Arizona. Such heterogeneity likely explains why WECC shows some of the smallest differences between median solar and wind potential anomalies on widespread extreme versus non-extreme days (figures 3(a)–(d)).
Widespread cold extremes across the U.S. are associated with cold air outbreaks (Smith and Sheridan 2020). These systems are associated with strong winds at their leading edge during cold air advection, but calmer conditions at their center under the surface high pressure system, co-located in space and time with the coldest conditions (Robert De 1923). These atmospheric conditions explain the increased solar potential and suppressed wind potential across most regions during cold extremes (figures 3(a) and (c)). For instance, during the coldest day of the exceptional 2021 North American cold wave across the central U.S. (15th February), MRO and TRE experienced above-normal solar radiation, and much of MRO experienced below-normal winds (figures 3(h)–(j)). Conversely, TRE saw relatively weak but positive windspeed anomalies over most of the region. Concurrently, stronger than normal winds were observed including over parts of SERC and WECC and weaker winds were observed over NPCC (figure 3(j)). However, these negative anomalies over NPCC are not typical during cold extremes and are likely due to the winter storm's extreme southward extent (Bolinger et al 2022). Typically, positive median wind anomalies in this region during widespread cold extremes (figure 3(c)) are likely because the region generally lies at the leading edge of cold air outbreaks that are most often centered around central US. For similar reasons, solar radiation anomalies were above normal over TRE even though typically, solar radiation is suppressed during widespread cold extremes. Such event-to-event variability in energy potential is observed for solar and wind across all regions (figures 3(a)–(d)).
3.4. Trends and interannual variability
To understand the changing nature of widespread hot and cold extremes, we calculate trends in event characteristics over 1980–2021 (figures 4 , S1 and S2). All regions show a decline in the frequency of widespread cold extremes, with significant trends (p-value < 0.1) over TRE (−79.9%) and NPCC (−97.8%; figure 4(a)). There are no significant changes in the extent, duration, or cumulative intensity of widespread cold extremes over any region, although there is a tendency towards less frequent, less intense, and smaller extent events in SERC, and less intense events in RFC (p-value ⩽0.17, figures 4(b)–(d) and S1). Contrastingly, half of the regions showed trends in one or more characteristics of widespread hot extremes (figures 4(e)–(g) and S2). WECC is the only region with significant trends in all metrics—increases in frequency (123.6%), average extent (32.5%), average duration (55.2%), and average cumulative intensity (29.3%) of widespread hot extremes. Of the six regions, TRE experienced the largest increase in frequency of widespread hot extremes (131.6%), along with small, insignificant trends in other characteristics. In contrast, SERC experienced a significant decline in the extent (−30.4%) and intensity (−37.4%), along with a substantial but insignificant decline in duration (p-value = 0.15; figures 4(f), (h) and S2). MRO and NPCC are the only regions with no significant changes in the characteristics for either widespread hot or cold extremes. These observed trends are consistent with greater warming in the western U.S. relative to other regions (van Oldenborgh et al 2019, Keellings and Moradkhani 2020, Perkins-Kirkpatrick and Lewis 2020, Rogers et al 2021, Wanyama et al 2023), increased summertime ridging over western states (Dong et al 2021), and the 'warming hole' in summer and winter over the southeastern and midwestern U.S., partly driven by anthropogenic aerosols, agricultural intensification, and natural climate variability (Leibensperger et al 2012, Banerjee et al 2017, Mascioli et al 2017, Vose et al 2017, Partridge et al 2018, Coffel et al 2022)
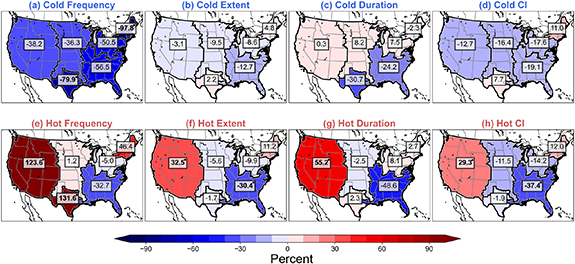
Figure 4. Changes in characteristics of widespread extremes: percent change in the (a) frequency, (b) average extent, (c) average duration, and (d) average cumulative intensity (CI) of widespread cold (top) and widespread hot (bottom) extremes (1980–2021). Changes are calculated from the linear trends (see figures S1 and S2) multiplied by the number of years and are expressed as a percent of the climatological mean (1991–2020). Bold numbers with a dot indicate significance of linear trends at the 10% level using the t-test.
Download figure:
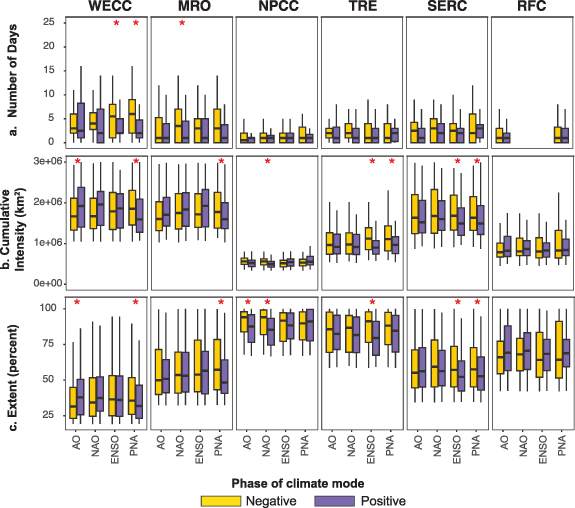
Standard image High-resolution imageNext, we examine the association between widespread extremes and four known modes of natural climate variability that represent potential sources of predictability—AO, NAO, ENSO, and PNA (figures 5 and S3). All modes significantly influence the frequency, extent, or intensity of widespread cold extremes in at least one region (figure 5). La Niña and negative PNA conditions favor more frequent widespread cold extremes across WECC and negative NAO conditions favor more frequent widespread cold extremes across MRO (figure 5(a)). Widespread cold extremes are significantly more intense and larger over WECC during positive AO and negative PNA conditions, over MRO during negative PNA conditions, and over SERC and TRE during La Niña and negative PNA conditions (figures 5(b) and (c)). In addition, negative AO and NAO conditions are associated with significantly larger cold extremes over NPCC.
Figure 5. Influence of natural variability modes on widespread cold extremes: distributions of the (a) frequency, (b) intensity, and (c) spatial extent of widespread cold events (DJF) during negative (yellow) and positive (purple) phases of the Arctic Oscillation (AO), North Atlantic Oscillation (NAO), El Niño-Southern Oscillation (ENSO), and Pacific/North American (PNA) pattern in each NERC region. Asterisks above a pair of boxplots indicate that the distributions during opposite phases of the climate mode are significantly different at the 10% level, based on the permutation test. Absence of boxplots insufficient (<20) events in that region to calculate statistics. Duration not shown as there were no significant differences in any region.
Download figure:
Standard image High-resolution image
Compared to cold extremes, fewer regions exhibit robust relationships between the characteristics of widespread hot extremes and the concurrent phase of climate modes (figure S4). The frequency of widespread hot extremes was significantly higher than normal during positive NAO conditions over WECC, negative NAO conditions over SERC, and positive PNA conditions over RFC. Positive AO, NAO, and PNA conditions favor significantly larger extremes across WECC. In addition, negative PNA conditions favor significantly larger and more intense heat extremes across RFC, but positive PNA favors an increase in the frequency of events. La Niña and negative AO conditions were also associated with significantly larger and more intense heat extremes over SERC. These relationships between natural climate variability modes and widespread hot and cold extremes are largely consistent with the previously identified influence of modes on the pattern of temperature extremes across parts of the U.S. (e.g. (Westby et al 2013, Loikith and Broccoli 2014, Grotjahn et al 2016, Yu et al 2019, Shi et al 2021).
4. Conclusions
Temperature extremes pose substantial health risks to the U.S. and global population (Ebi et al 2021). For most communities, the ability to cope with extreme temperatures depends on reliable access to electricity or natural gas for cooling or heating. Local electricity grids are often connected to adjacent grids to ensure stability and reliability during periods of elevated energy demand or reductions in supply. Despite these interconnections, widespread extremes can stress regional and national electricity grids. In recent years, every NERC region has experienced persistent and severe widespread hot and cold extremes that have strained this infrastructure, causing power disruptions at times when electricity access is critical to human health (Hansen 2021, Lee and Dessler 2022, Flores et al 2023, Zamuda et al 2023). The risk of such widespread hot extremes has doubled in WECC and TRE over the past four decades. The risk of widespread cold extremes has decreased in most regions by >36%, although these decreases are only significant over TRE and NPCC, suggesting that such events continue to pose a risk.
A key finding of our study is that nearly all regions experience increases in solar or wind potential during widespread temperature extremes. Further, our study provides the first systematic quantification of the characteristics of widespread temperature extremes across the six NERC regions in the summer and winter seasons and their influence on energy demand, power outages, and renewable energy supply, making the following four unique contributions. First, WECC experiences the highest frequency and cumulative intensity of widespread hot and cold extremes, and TRE and NPCC experience the largest events relative to their regional extent. Second, widespread cold extremes typically impacted a larger fraction of the affected regions and had a higher cumulative intensity than widespread hot extremes in all regions. Consequently, cold extremes were associated with relatively larger increases in energy demand than were hot extremes, as measured by degree days. Third, widespread extremes over the past decade have been associated with several power outages in each NERC region. SERC experienced the highest absolute number of power outages during widespread winter cold extremes and and RFC experienced the highest absolute number of power outages during widespread summer hot extremes. Finally, all six regions experience increased solar or wind potential during hot extremes and increases in solar potential during winter cold extremes. These increases during widespread hot extremes are greatest over TRE, a region with the largest percent increase in the frequency of widespread hot extremes.
We note several caveats to our analysis. Our analysis focuses solely on analyzing theoretical power generation potential from two renewable sources concurrent with temperature extremes, but energy reliability depends on resilience throughout the grid including of the generation, transmission, and distribution infrastructure (Zamuda et al 2023). Energy generation capacity from these resources, as with other energy sources, can be impacted due to mechanical or infrastructure-related issues such as ice build-up on wind turbine blades or snow cover on solar panels or because of damage to transmission lines (Gao and Hu 2021, Jackson and Gunda 2021). For instance, 23% of the generation outage in Texas and South-Central U.S. during the February 2021 winter storm was in wind generation systems that experienced outages early during the event, almost entirely due to blade icing or freezing issues (figures 30 and 90 in FERC, NERC and Regional Entities 2021). Solar energy generating systems also experienced outages due to freezing or mechanical and electrical issues caused by ice and freezing temperatures (figure 126 in FERC, NERC and Regional Entities 2021). In addition, high temperatures during heatwaves or accumulation of snow and ice during cold extremes can cause sagging of powerlines and high temperatures can reduce efficiency of electricity transmission, contributing to reductions in power availability or outages at times when electricity access is critical. Further, we evaluate energy potential across the NERC region without considering the location of existing or planned renewable energy projects, and do not consider factors such as whether energy production is centralized or decentralized. However, renewable energy production is more conducive to decentralization that could reduce the risk of outages due to transmission failures and offers opportunities for advancing energy justice and equity (Jenkins et al 2016, Zamuda et al 2023). Ensuring energy access and reliability in a changing climate requires modeling the impacts of extreme events on the complete interconnected energy systems to identify vulnerability, modeling costs from production to delivery, and evaluating justice considerations such as access for overburdened communities and decentralized solutions for storage such as microgrids (Zamuda et al 2023).
Transitioning to zero-carbon energy production requires increasing our fraction of energy supply from renewable sources (Lecocq et al 2022, Jay et al 2023). Our analysis suggests that in addition to the benefits of reducing greenhouse gas emissions to limit future warming and co-benefits of reduced air pollution (Davis 2023), increasing electricity production capacity from solar and wind could help meet the higher energy demand and strengthen grid resilience during widespread extreme temperature events. Hot extremes and their associated cooling demand are projected to increase with continued warming, and while cold extremes are generally decreasing with warming, they remain a risk to power grids in several regions within the U.S. (e.g.(Lyon et al 2019, Seneviratne et al 2021, Bartusek et al 2022, Marvel et al 2023)). In the long-term, infrastructure design, planning, and preparedness that accounts for projected changes in such spatial and temporal characteristics of temperature extremes is crucial to maintain the reliability of the electrical grid. In the short-term, the relationships we identified between modes of natural climate variability and the characteristics of widespread temperature extremes can be leveraged for forecasting energy demand and supply and inform resource allocation in preparation for such events. Ensuring energy reliability and advancing energy justice is critical for minimizing impacts of extremes, particularly on overburdened and low-income communities that are often the most vulnerable (Chen et al 2022, Stephens 2022).
Acknowledgment
DS, YB and CDWR were supported by grant NSF#1934383. DAK was supported by WSU's startup grant to DS.
Data availability statements
All computations were performed on WSU's Kamiak High-Performance Cluster. We acknowledge and thank several organizations for making their data publicly available. All meteorological data were originally downloaded at the hourly resolution from the European Center for Medium-Range Weather Forecasts (ECMWF) ERA5 reanalysis (Hersbach et al 2020; https://doi.org/10.24381/cds.adbb2d47). NERC region data were downloaded from the Homeland Infrastructure Foundation Level Database (HIFLD). Outage data are annual summaries of electrical disturbances from 2012-2021 compiled by the U.S. Department of Environment (DOE) Office of Cybersecurity, Energy Security, and Emergency Response ('ISER—Electric Disturbance Events (DOE-417)' 2023).
The data that support the findings of this study are openly available. Source code for the analysis and figures are provided in the repository linked below.
The data that support the findings of this study are openly available at the following URL/DOI: https://github.com/yiabek/energy_study_code.
Supplementary data (4.3 MB PDF)