

Abstract
Fires in the wildland-urban interface (WUI) are an important issue globally. To understand the change of WUI, we develop a 9 km worldwide unified wildland-urban interface database for 2001–2020 with Random Forest models and satellite data. We find that WUI has been increasing in all populated continents from 2001 to 2020 and the global relative increase is 24%, with the largest relative increase (∼59%) over Africa. Global total fire counts decrease by 10% from 2005 to 2020, whereas the WUI fraction of fire counts increases by 23%. The global total burned area decreases by 22% from 2005 to 2020, whereas the WUI fraction of burned area increases by 35%. These are mainly due to the expansion of WUI area. On all the populated continents, the WUI fractions of fire counts are higher than the WUI fractions of burned area, implying that WUI fires tend to have smaller sizes than wildland fires. We also project future WUI changes for the years 2030 and 2040, together with the projection of future fire burned area under different shared socioeconomic pathways (SSP) scenarios in the Community Earth System Model version 2 (CESM2). The projected global WUI fraction (excluding Antarctica and the oceans) is 5.9% in 2040 compared to 4.8% in 2020. The global WUI fraction of burned area is projected to increase from now to 2040 under most scenarios analyzed in this study, unless the WUI area stays at the 2020 level together with the projected burned area under SSP4-4.5. This study is a first step to understanding the changes of WUI fires at the global scale and demonstrates a growing importance of WUI fires. The global multi-year WUI and WUI fire datasets developed in this study can facilitate future work quantifying the impacts of WUI fires on air quality and climate.
Export citation and abstract BibTeX RIS

Original content from this work may be used under the terms of the Creative Commons Attribution 4.0 license. Any further distribution of this work must maintain attribution to the author(s) and the title of the work, journal citation and DOI.
1. Introduction
The wildland-urban interface (WUI) is the geographic area where anthropogenic urban land use and wildland vegetation come into contact or intermingle (e.g. chAs-Amil et al 2013, Modugno et al 2016, Masoudvaziri et al 2021). The technical definition of WUI has not been unequivocally determined (Stewart et al 2009, Mell et al 2010, Platt 2010). Different definitions have been used in different countries/regions (e.g Theobald and Romme 2007, Galiana-Martina et al 2011, Herrero-Corral et al 2012, Chas-Amil et al 2013, Price and Bradstock 2014, Thomas and Butry 2014, Modugno et al 2016, Johnston and Flannigan 2017, Miranda et al 2020, Sarricolea et al 2020). A widely used WUI definition is the USA Federal Register definition (USDA and USDI 2001), which includes Intermix and Interface. Intermix refers to areas with ⩾6.18 houses per km2 and ⩾50% cover of wildland vegetation; while Interface refers to areas with ⩾6.18 houses per km2 and <50% cover of vegetation located <2.4 km from an area ⩾5 km2 in size that is ⩾75% vegetated. The USA Federal Register definition does not consider industrial structures and infrastructure while some other WUI definitions include all artificial surfaces (e.g. Modugno et al 2016, Johnston and Flannigan 2017).
The concept of WUI has existed for decades in the fire management community (e.g. Davis 1990, Ewert 1993, Stewart et al 2007, Jaffe et al 2020). However, our understanding of WUI fires and their impacts on atmospheric chemistry and air quality is limited compared to that of wildland fires. Fires in WUI are an important issue and require more research and better understanding for a few reasons. (1) In WUI, there are more human ignitions compared to wildland (Price et al 2014, Radeloff et al 2018). (2) WUI fires are closer to humans and properties and can cause significant destruction and economic losses. As an example, the 2003 Cedar Fire in California destroyed more than 3000 homes (Manzello et al 2014). (3) WUI fires can have severe impacts on air quality and public health due to emissions of some toxic species. As an example, the emission factor of dioxins is around five orders of magnitude greater for urban fuels compared with biomass (Holder et al 2023). (4) WUI fires will become even more important in the future. For instance, previous studies indicated WUI is expanding in some countries or regions (e.g. Liu et al 2015, Radeloff et al 2018). Fire activities are also projected to increase due to climate change (e.g. Pechony and Shindell 2010, Flannigan et al 2013, Veira et al 2016, Abatzoglou et al 2019, Di Virgilio et al 2019, Tang et al 2023). Moreover, WUI expansion and fire activity increase can have a combined effect that is greater than the sum of their individual effects if WUI expands into regions of higher wildfire risk than the existing WUI (Liu et al 2015).
WUI fire studies have focused on just a few countries and regions in the past, even though WUI fire is a global issue (Bento-Gonçalves et al 2020). Recently, a global WUI map has been developed for the year 2020 at a 10 m spatial resolution (Schug et al 2023a, 2023b; hereafter the Schug-WUI map) to study the global distribution of WUI and WUI fires. The Schug-WUI map uses the USA Federal Register definition and is developed based on remote sensing-derived datasets (Zanaga et al 2021, Pesaresi and Politis 2022). However, the Schug-WUI map is only available for one specific year. To understand the changes in WUI and WUI fires, we develop a multiyear worldwide unified wildland-urban interface (WUWUI) database for 2001–2020 (Tang et al 2024) by leveraging Random Forest models, the Schug-WUI map, and other satellite and socioeconomic data (the WUWUI dataset can be accessed through https://zenodo.org/records/10703310). The WUWUI database provides a globally consistent picture for applications such as consistently tracking the change of global WUI, understanding WUI fires at the global scale, and intercomparing temporal evolution of WUI and WUI fires among different regions. The WUWUI dataset developed here is not intended to replace, but to complement, the existing WUI datasets. WUI maps developed specifically for regions of interest with high spatial resolution are needed when focusing on a specific region or local details. In addition, we project future WUI changes for the years 2030 and 2040, and analyze them together with projected future fire burned area under different shared socioeconomic pathways (SSP) scenarios in the Community Earth System Model version 2 (CESM2).
2. Data and methods
2.1. Data used to develop the WUWUI database
Several MODIS satellite products and population density data (summarized in table 1) are used as input predictors for the Random Forest models (table 1). These variables are chosen to include relevant information to WUI or can reflect the features of WUI, and meanwhile avoid redundant information. For the land cover type data, we calculate the fractions of each land cover type as predictors within 9 km × 9 km grids, and the mean distance between urban pixels within each grid as another predictor. For the other MODIS variables above, we calculate the means and standard deviations of each variable as predictors within each 9 km × 9 km grid (figure S1). To reflect impacts of potential spatial connections between neighboring grids, we also use the values of the aforementioned variables from the surrounding area as additional predictors for a given grid. I.e. in addition to calculating the aforementioned variables within the 9 km × 9 km, we also calculated the same variables within an 18 km × 18 km grid centered with the 9 km × 9 km grid. (figure S1).
Table 1. Satellite and population data used as input for the Random Forest models.
| Data product | Versions | Spatial resolution | Temporal resolution | Variables from satellite products used | Derived variables used in the Random Forest model |
|---|---|---|---|---|---|
| MODIS/Terra + Aqua Land Cover Type Yearly | MCD12Q1 v6.1 (Friedl and Sulla-Menashe 2019) | 500 m | Yearly | LC_Type1 | landcover_fraction_in_the_grid_Barren, landcover_fraction_in_the_grid_Forests, landcover_fraction_in_the_grid_Savannas, landcover_fraction_in_the_grid_Urban, landcover_fraction_in_the_grid_Wetlands, landcover_fraction_in_the_grid_Croplands, landcover_fraction_in_the_grid_Grasslands, landcover_fraction_in_the_grid_Shrublands, landcover_fraction_in_the_grid_Water, urban_pixel_mean_distance_in_the_grid, urban_pixel_total_distance_in_the_grid, landcover_fraction_in_the_surrounding_grid_Barren, landcover_fraction_in_the_surrounding_grid_Forests, landcover_fraction_in_the_surrounding_grid_Savannas, landcover_fraction_in_the_surrounding_grid_Urban, landcover_fraction_in_the_surrounding_grid_Wetlands, landcover_fraction_in_the_surrounding_grid_Croplands, landcover_fraction_in_the_surrounding_grid_Grasslands, landcover_fraction_in_the_surrounding_grid_Shrublands, landcover_fraction_in_the_surrounding_grid_Water, urban_pixel_mean_distance_in_the_surrounding_grid, urban_pixel_total_distance_in_the_surrounding_grid |
| MODIS/Terra + Aqua Albedo Daily | MCD43A3 v6.1 (Schaaf and Wang 2015) | 500 m | Daily data averaged for summer mean | Albedo_WSA_Band2, Albedo_WSA_Band5 | mean_of_Albedo_Band2_in_the_grid, standard_deviation_of_Albedo_Band2_in_the_grid, mean_of_Albedo_Band5_in_the_grid, standard_deviation_of_Albedo_Band5_in_the_grid |
| MODIS/Terra Vegetation Indices 16-Day | MOD13Q1 v6.1 (Didan 2015) | 250 m | 16 days data averaged for summer mean | 250 m 16 d NDVI | mean_of_summer_time_NDVI_in_the_grid, standard_deviation_of_summer_time_NDVI_in_the_grid |
| MODIS/Terra Vegetation Continuous Fields Yearly | MOD44B v6.1 (DiMiceli et al 2015) | 250 m | Yearly | Percent_Tree_Cover, Percent_NonTree_Vegetation, Percent_NonVegetated | mean_of_Percent_Tree_Cover_in_the_grid, standard_deviation_of_Percent_Tree_Cover_in_the_grid, mean_of_Percent_NonTree_Vegetation_in_the_grid, standard_deviation_of_NonTree_Vegetation_in_the_grid, mean_of_Percent_NonVegetated_in_the_grid, standard_deviation_of_Percent_NonVegetated_in_the_grid, mean_of_Percent_Tree_Cover_in_the_surrounding_grid, standard_deviation_of_Percent_Tree_Cover_in_the_surrounding_grid, mean_of_Percent_NonTree_Vegetation_in_the_surrounding_grid, standard_deviation_of_NonTree_Vegetation_in_the_surrounding_grid, mean_of_Percent_NonVegetated_in_the_surrounding_grid, standard_deviation_of_Percent_NonVegetated_in_the_surrounding_grid |
| Population density | GHS-POP (Schiavina et al 2022) | 1 km | Yearly | Population density | Mean_Population_Density_in_the_grid |
2.2. Random forest models
We use the Schug-WUI map for 2020 (Schug et al 2023b) as the 'truth' map, and MODIS satellite products and population data as predictors to train a series of Random Forest models for individual continents. The WUWUI map is developed at the 9 km × 9 km (1/12 degree latitude × 1/12 degree longitude) resolution as a tradeoff between spatial resolution, performance of the Random Forest models, and usefulness for applications (e.g. typical global climate and air quality modeling). Based on our tests, at the 4 km resolution, the model performance is not as good as it is at 9 km resolution, whereas at 12 km resolution, the model performance is close to 9 km resolution. Therefore, we decide to use 9 km resolution to perform analyses. Therefore, the Schug-WUI map and predictors are all aggregated to 9 km × 9 km resolution to develop Random Forest models which predict WUI area fraction in each 9 km × 9 km grid. 75% (25%) of the data for each continent are randomly selected as a training (test) set. We use the Grid Search algorithm to optimize a few other relevant model hyper-parameters (e.g. tree numbers, the number of predictor variables to select at random for each decision split, and the threshold for the minimum size of a leaf node) to achieve the best model performance. The finally selected values for these parameters are 100, 44, and 3, respectively. The performance of the Random Forest models can be found in table S1. A comparison between WUWUI and Schug-WUI maps in 2020 is shown in figure 1. Overall, the Random Forest models perform well in all the six continents and the WUWUI and Schug-WUI maps agree well for the year 2020. We then use the models to predict WUI area fraction for the years of 2001, 2005, 2010, 2015, and 2020. The developed WUWUI maps are shown in figures 1 and 2.
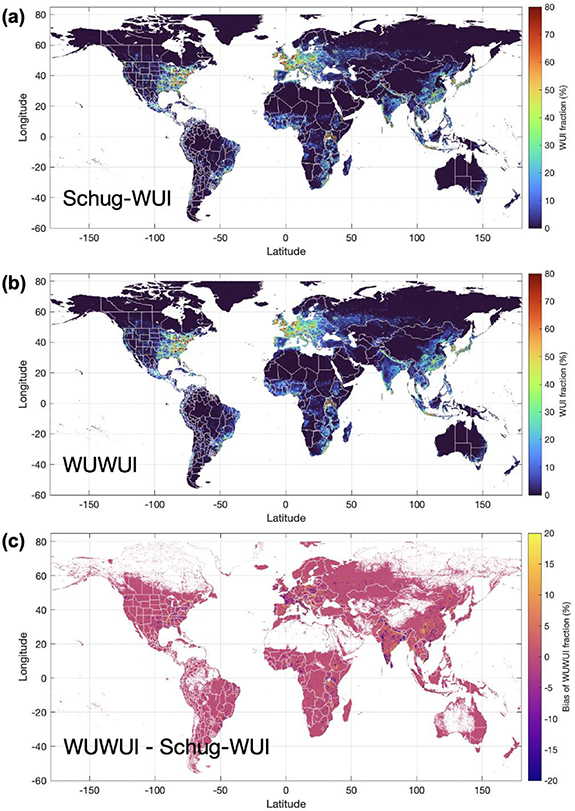
Figure 1. (a) Wildland-urban interface (WUI) fraction (%) in 2020 from the Schug-WUI map for 2020 (Schug et al 2023b) and (b) worldwide unified wildland-urban interface (WUWUI) data. (c) Difference (%) between (a) and (b) calculated by WUI fraction from WUWUI minus WUI fraction from the Schug-WUI map. Grids in which WUI fraction is extremely low (<0.01%) in both WUWUI and Schug-WUI map are not shown.
Download figure:
Standard image High-resolution image
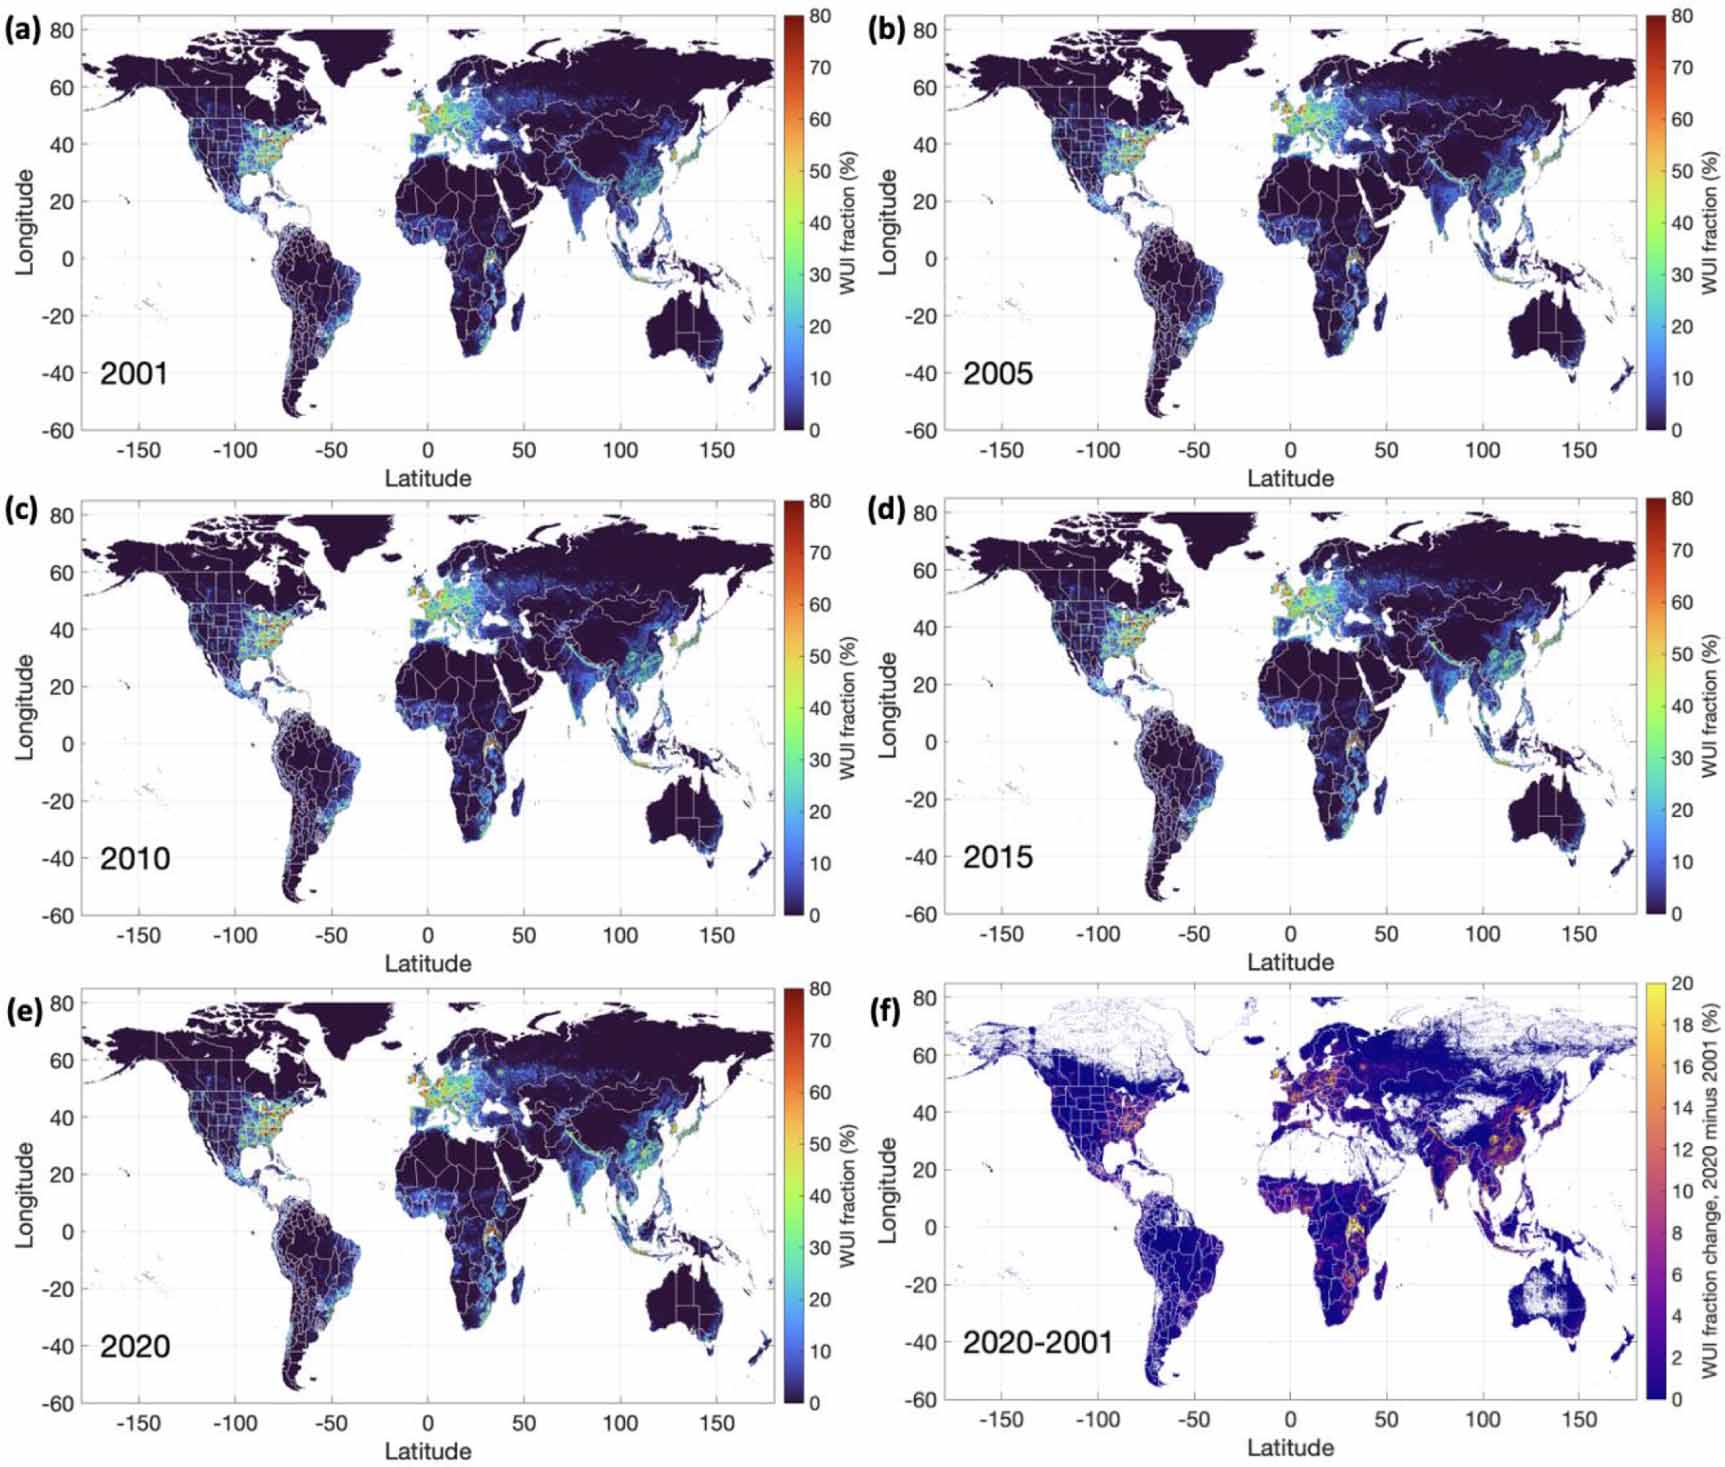
Figure 2. Wildland-urban interface (WUI) fraction (%) in (a) 2001, (b) 2005, (c) 2010, (d) 2015, and (e) 2020 from WUWUI data. (f) Wildland-urban interface (WUI) fractional (%) change from 2001 to 2020, calculated by WUI fraction in 2020 minus WUI fraction in 2001. Grids in which WUI fraction is extremely low (<0.01%) in both 2001 and 2020 are not shown.
Download figure:
Standard image High-resolution image2.3. Fire count and burned area data from MODIS
We compare the 2005, 2010, 2015, and 2020 WUWUI maps with MODIS active fire count products (NASA/University of Maryland 2002, Davies et al 2009) and burned area products (MODIS/Terra + Aqua Burned Area Monthly L3 Global 500 m; MCD64A1 v061; Giglio et al 2021) to quantify the evolution of WUI fires. Unlike WUI, fire detections and burned area have large interannual variability (e.g. Tang et al 2023). To address interannual variability and emphasize the trends, we use 3 year averages centered on the years of WUI data for fire counts and burned area to represent the mean fire activity. 2001 is not included due to MODIS data availability. Total fire count and burned area are calculated for each 9 km × 9 km grid. The fire counts (burned area) within WUI for a given grid is calculated by multiplying the total fire counts (burned area) within the entire grid by the WUI fraction of that grid. This calculation implicitly assumes the distribution of fire count and burned area within a grid is independent from the WUI distribution in the grid. This method is adequately accurate at 9 km based on our sensitivity analysis (see the discussion and figure S2 in the supplement for details).
2.4. Future projection of fire burned area in CESM2
The SSPs were established to facilitate the integrated analysis of future climate impacts, vulnerabilities, adaptation, and mitigation (O'Neill et al 2017, Riahi et al 2017), which has been used in the IPCC-6 report. SSP1-2.6 (sustainable development) is the low end of the range of future forcing pathways in SSP. SSP2-4.5 is a scenario that represents the middle part of the range of future forcing pathways. SSP5-8.5 is the unmitigated baseline scenario, representing the high end of the range of future pathways.
CESM2 is a widely-used state-of-the-art community Earth system model that has components of ocean, atmosphere, land, sea‐ice, land‐ice, river, and wave models (Danabasoglu et al 2020). The fire scheme in CESM2 provides estimates of fire burned area. The modeled burned area in CESM2 is affected by climate and weather conditions, vegetation composition and structure, and human activities. In general, burned area estimation in fire models is subject to uncertainties such as uncertainties from population density and land use and land cover change (Li et al 2019). Nevertheless, fire simulation in CESM2 still outperforms several other fire models in a previous comparison (Li et al 2019). The fire simulation in CESM2 falls in the range of observation-based fire emission inventories (Tang et al 2023).
The horizontal resolution for modeled burned area is 1.25° × 0.9° (longitude × latitude). The burned area data from CESM2 under the scenarios SSP1-2.6, SSP2-4.5, and SSP5-8.5 for 2020, 2030, and 2040 are used. More details on these simulations can be found in Tang et al (2023). Following the analyses with burned area data from MODIS, we use 3 year averages centered on the years of WUI data of fire counts and burned area.
2.5. Future projection of WUI
The WUI changes at continental scale fit well with linear trends from 2001 to 2020 (R2 for the linear regressions vary from 0.97 to 0.99; figure S3). Therefore, we use the linear trends to project WUI fractions for 2030 and 2040 by continent. We first show the linear-projection-based results as a possible scenario for the future, assuming the WUI fractions will grow at the same rate from 2020 to 2040 as it was in the past 20 years.
Even though the WUI change in the past 20 years follows very well the linear trends, the WUI change in the future is still uncertain. To address this uncertainty, we assess 3 WUI change scenarios: (1) the WUI fraction is projected to increase from 2020 to 2040 following the same linear trend as 2001–2020; (2) the WUI fraction is projected to increase from 2020 to 2030 following the same trend as 2001–2020, and then stay at the 2030 level; (3) the WUI fraction at 2030 and 2040 will be the same as 2020. These three WUI change scenarios cover a range of possible different WUI conditions in the near future.
After projecting WUI to 2030 and 2040, we then calculate the projected fraction of burned area within WUI. The WUI fraction of burned area is calculated by multiplying the projected total burned area within a grid with the projected WUI fraction of the grid at the resolution of 1.25° × 0.9°. To reduce the uncertainty from the coarse spatial resolution of CESM model results, we apply scaling factors to correct the systematic bias due to coarse resolution (See Supplement for details).
3. Evaluation of WUWUI
We evaluate the WUWUI map against the Schug-WUI map for the year 2020, which shows very high spatial consistency (figure 1). The 2001–2020 WUI data for the conterminous United States (CONUS) downloaded from the Forest Service Research Data Archive, United States Department of Agriculture (Radeloff et al 2023) (hereafter USDA WUI for short) was developed following the Federal Register definition of WUI (USDA and USDI 2001), which is also used for the Schug-WUI and WUWUI maps. Therefore, here we compare WUWUI with USDA WUI map over CONUS at 9 km × 9 km resolution (figures 3 and S4). The spatial patterns of WUWUI and USDA WUI maps agree well for the years 2010 and 2020 (figure 3), given that the USDA WUI map and WUWUI were developed via different methods. USDA WUI was developed through integrating U.S. Census and USGS National Land Cover Data with geographic information systems, while the Schug-WUI map (basis for WUWUI) uses European Space Agency World Cover dataset (Zanaga et al 2021) for land cover and the GHS-POP dataset (Schiavina et al 2022) for population. The WUWUI map also agrees well with another global WUI dataset developed in Chen et al (2022) for the year 2020 (figure S5).
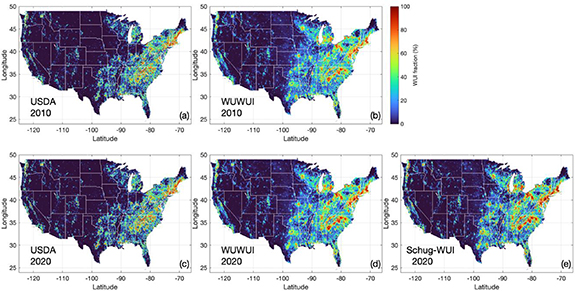
Figure 3. Wildland-urban interface (WUI) fraction (%) in 2010 from (a) USDA WUI map and (b) WUWUI database. Wildland-urban interface (WUI) fraction (%) in 2020 from (c) USDA WUI map (Radeloff et al 2022), (d) WUWUI database, and (e) the Schug-WUI map (Schug et al 2023b).
Download figure:
Standard image High-resolution image4. Change of global WUI from 2001 to 2020
The most noticeable increase in the WUI fraction from 2001 to 2020 is seen in the East Africa (figure 2(f)). The global average fraction (excluding the Antarctic and oceans) of WUI increases from 3.9% to 4.8% during 2001–2020 (figure 4(a)). The continental mean fraction of WUI is the largest in Europe (increasing from 12.4% in 2001 to 14% in 2020), followed by North America (increasing from 5.9% in 2001 to 6.5% in 2020). As for the WUI area (figure S6), North America and Asia has the largest WUI area in 2020 (1.43 × 10¹² m2 and 1.43 × 10¹² m2, respectively), followed by Europe (1.37 × 10¹² m2). In 2001, continental averaged fraction of WUI is the lowest in Africa (2.2%), but in 2020, South America has the lowest WUI fraction (2.6%). WUI has been increasing in all continents from 2001 to 2020 with different increase rates (figure 4(a)). The largest absolute increase of the WUI fraction from 2001 to 2020 occurs over Europe (0.08%/year) and Africa (0.07%/year) (figure 4(a)). In terms of the relative change (i.e. difference in the WUI fraction between 2020 and 2001 divided by the WUI fraction in 2001), Africa and Asia have the most significant increase. From 2001 to 2020, the WUI fraction in Africa has increased by 59% compared to the 2001 value.
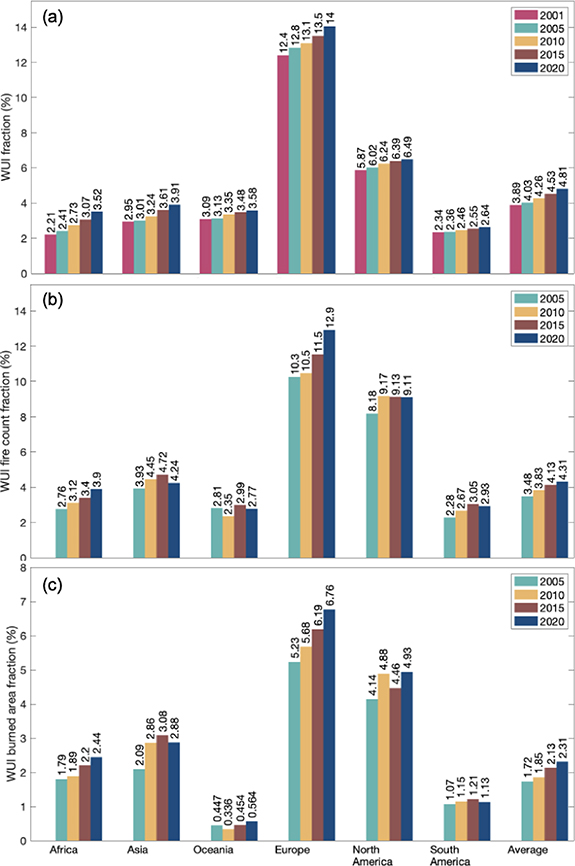
Figure 4. (a) Wildland-urban interface (WUI) fraction (%) in 2001, 2005, 2010, 2015, and 2020 by continents. (b) Fraction of fire counts within WUI (%) in 2005, 2010, 2015, and 2020 by continents. (c) Fraction of burned area within WUI (%) in 2005, 2010, 2015, and 2020 by continents. 2001 is not included in (b) and (c) due to data availability.
Download figure:
Standard image High-resolution imageThe rapid increase in the WUI fraction combined with the large area of the Africa continent points toward an urgent need to understand and address WUI expansion and associated issues (e.g. WUI fires) in Africa. Similarly, the WUI fraction (and area) in Asia has increased by 33% in the past 20 years compared to the 2001 value. The lowest relative increase from 2001 to 2020 is seen in North America (∼11%) where the WUI fraction is already relatively high.
5. Changes of global WUI fires from 2005 to 2020
Globally, the WUI fraction of fire counts (figure 4(b); defined as fire counts within WUI divided by total fire counts) and the WUI fraction of burned area (figure 4(c); defined as burned area within WUI divided by total burned area) increase from 2005 to 2020. The global total fire counts and burned area decreased from 2005 to 2020 (figure S7) mainly driven by the decreased wildland fire counts and burned area (figure S9). Similar to the overall global trend, fire count and burned area per unit WUI area also decreased (figure S8), even though the total WUI fire counts and burned area increased (figure S9). Therefore, the increase of WUI fractions of fire counts and burnt area is driven by the expansion of WUI area in the past 20 years.
Specifically, the global total fire counts decrease by 10% from 2005 to 2020, whereas the WUI fraction of fire counts from 2005 to 2020 increases from 3.5% to 4.3% (i.e. relative increase of 23%). The global total burned area decreases by 22% from 2005 to 2020, whereas the WUI fraction of burned area from 2005 to 2020 increases from 1.7% to 2.3% (i.e. relative increase of 35%). The global increase of the relative importance/fraction of WUI fires (in terms of both fire count and burned area) suggests an urgent need to understand and quantify WUI fires and their impacts globally, especially in those understudied regions such as Africa.
Over Africa, the WUI fractions of both fire counts and burned area increase from 2005 to 2020 with absolute increases of 1.1% and 0.65% and relative increases of 41% and 36%, respectively, even though the total fire counts and burned area in Africa decrease from 2005 to 2020 (figure S7). The relative increase of WUI fractions of both fire counts (41%) and burned area (36%) are close to the relative increase of WUI fraction itself (46%) in Africa during 2005–2020. This suggests that the increased WUI fraction of fire activities may be mainly driven by the increase of WUI areas. The fire trends in Africa largely contribute to the global trends as Africa has the highest fire count and burned area (figure S7). Over Europe, the WUI fractions of both fire counts and burned area also increase from 2005 to 2020 with absolute increases of 2.6% and 1.5% and relative increases of 25% and 29%, respectively, even though the total fire counts and burned area in Europe decreased from 2005 to 2020 (figure S7). In Asia and South America, however, the WUI fractions of fire counts and burned area increase from 2005 to 2015 but decrease from 2015 to 2020. The overall trends are still positive. In Oceania, there is no clear trend in either the WUI fractions of fire counts or burned area from 2005 to 2020 (figure S7).
In North America, the WUI fraction of fire counts (8%–9%) is higher than the WUI area fraction (∼6%). This implies that fire risk is relatively high in WUI regions compared to non-WUI regions over North America as fire counts represents fire occurrence. The WUI fraction of fire counts increase from 2005 (8.2%) to 2010 (9.2%) and stays almost constant from 2010 (9.2%) to 2020 (9.1%). However, the WUI fraction of burned area increases during 2010–2020. In 2015, the WUI fraction of burned area is 4.5%, whereas it is 4.9% in 2020. These changes of fire counts and burned area indicate that the WUI fires in North America may become larger and more destructive from 2015 to 2020.
In all six continents, the WUI fraction of fire counts is higher than that of burned area. Globally, the WUI fraction of burned area (∼2%) is smaller than that of fire count (3%–4%), implying that WUI fires tend to have smaller sizes than wildland fires. This is reasonable as fire management and fire suppression activities can be different in WUI versus wildland (e.g. Stewart et al 2007, Jaffe et al 2020). WUI fires could also have different duration due to fire management (e.g. Masoudvaziri et al 2021) which impacts MODIS detection of active fire counts. The different changes in WUI fractions of fire counts and burned area can reflect changes in human activities and practice. In terms of the WUI fire trends, the relative increase of the WUI fraction of burned area (35%) is larger than that of fire counts (24%) globally, indicating WUI fires may become larger in size in global average sense.
6. Trends of future WUI and WUI fires at continental scale
Following the linear trends, the global average WUI fraction is projected to be 5.3% (5.9%) in 2030 (2040) if the WUI expansion follows the historical trend (figure 5(a)). Europe and North America are projected to still have the highest WUI fractions (15.9% and 7.3% in 2040, respectively). In 2040, the WUI fraction in Africa (4.9%) is projected to be higher than that in Oceania (4.2%) and close to that in Asia (5.0%).

Figure 5. (a) Wildland-urban interface (WUI) fraction (%) in 2020, 2030, and 2040 by continents. (b)–(h) Fraction of burned area within WUI (%) in 2020, 2030, and 2040 under different scenarios. The fraction of burned area within WUI (%) calculated with CESM2 burned area is normalized to the fraction of burned area within WUI (%) in 2020 calculated with MODIS burned area observations (shown in figure 4). An unnormalized version is shown in figure S11.
Download figure:
Standard image High-resolution image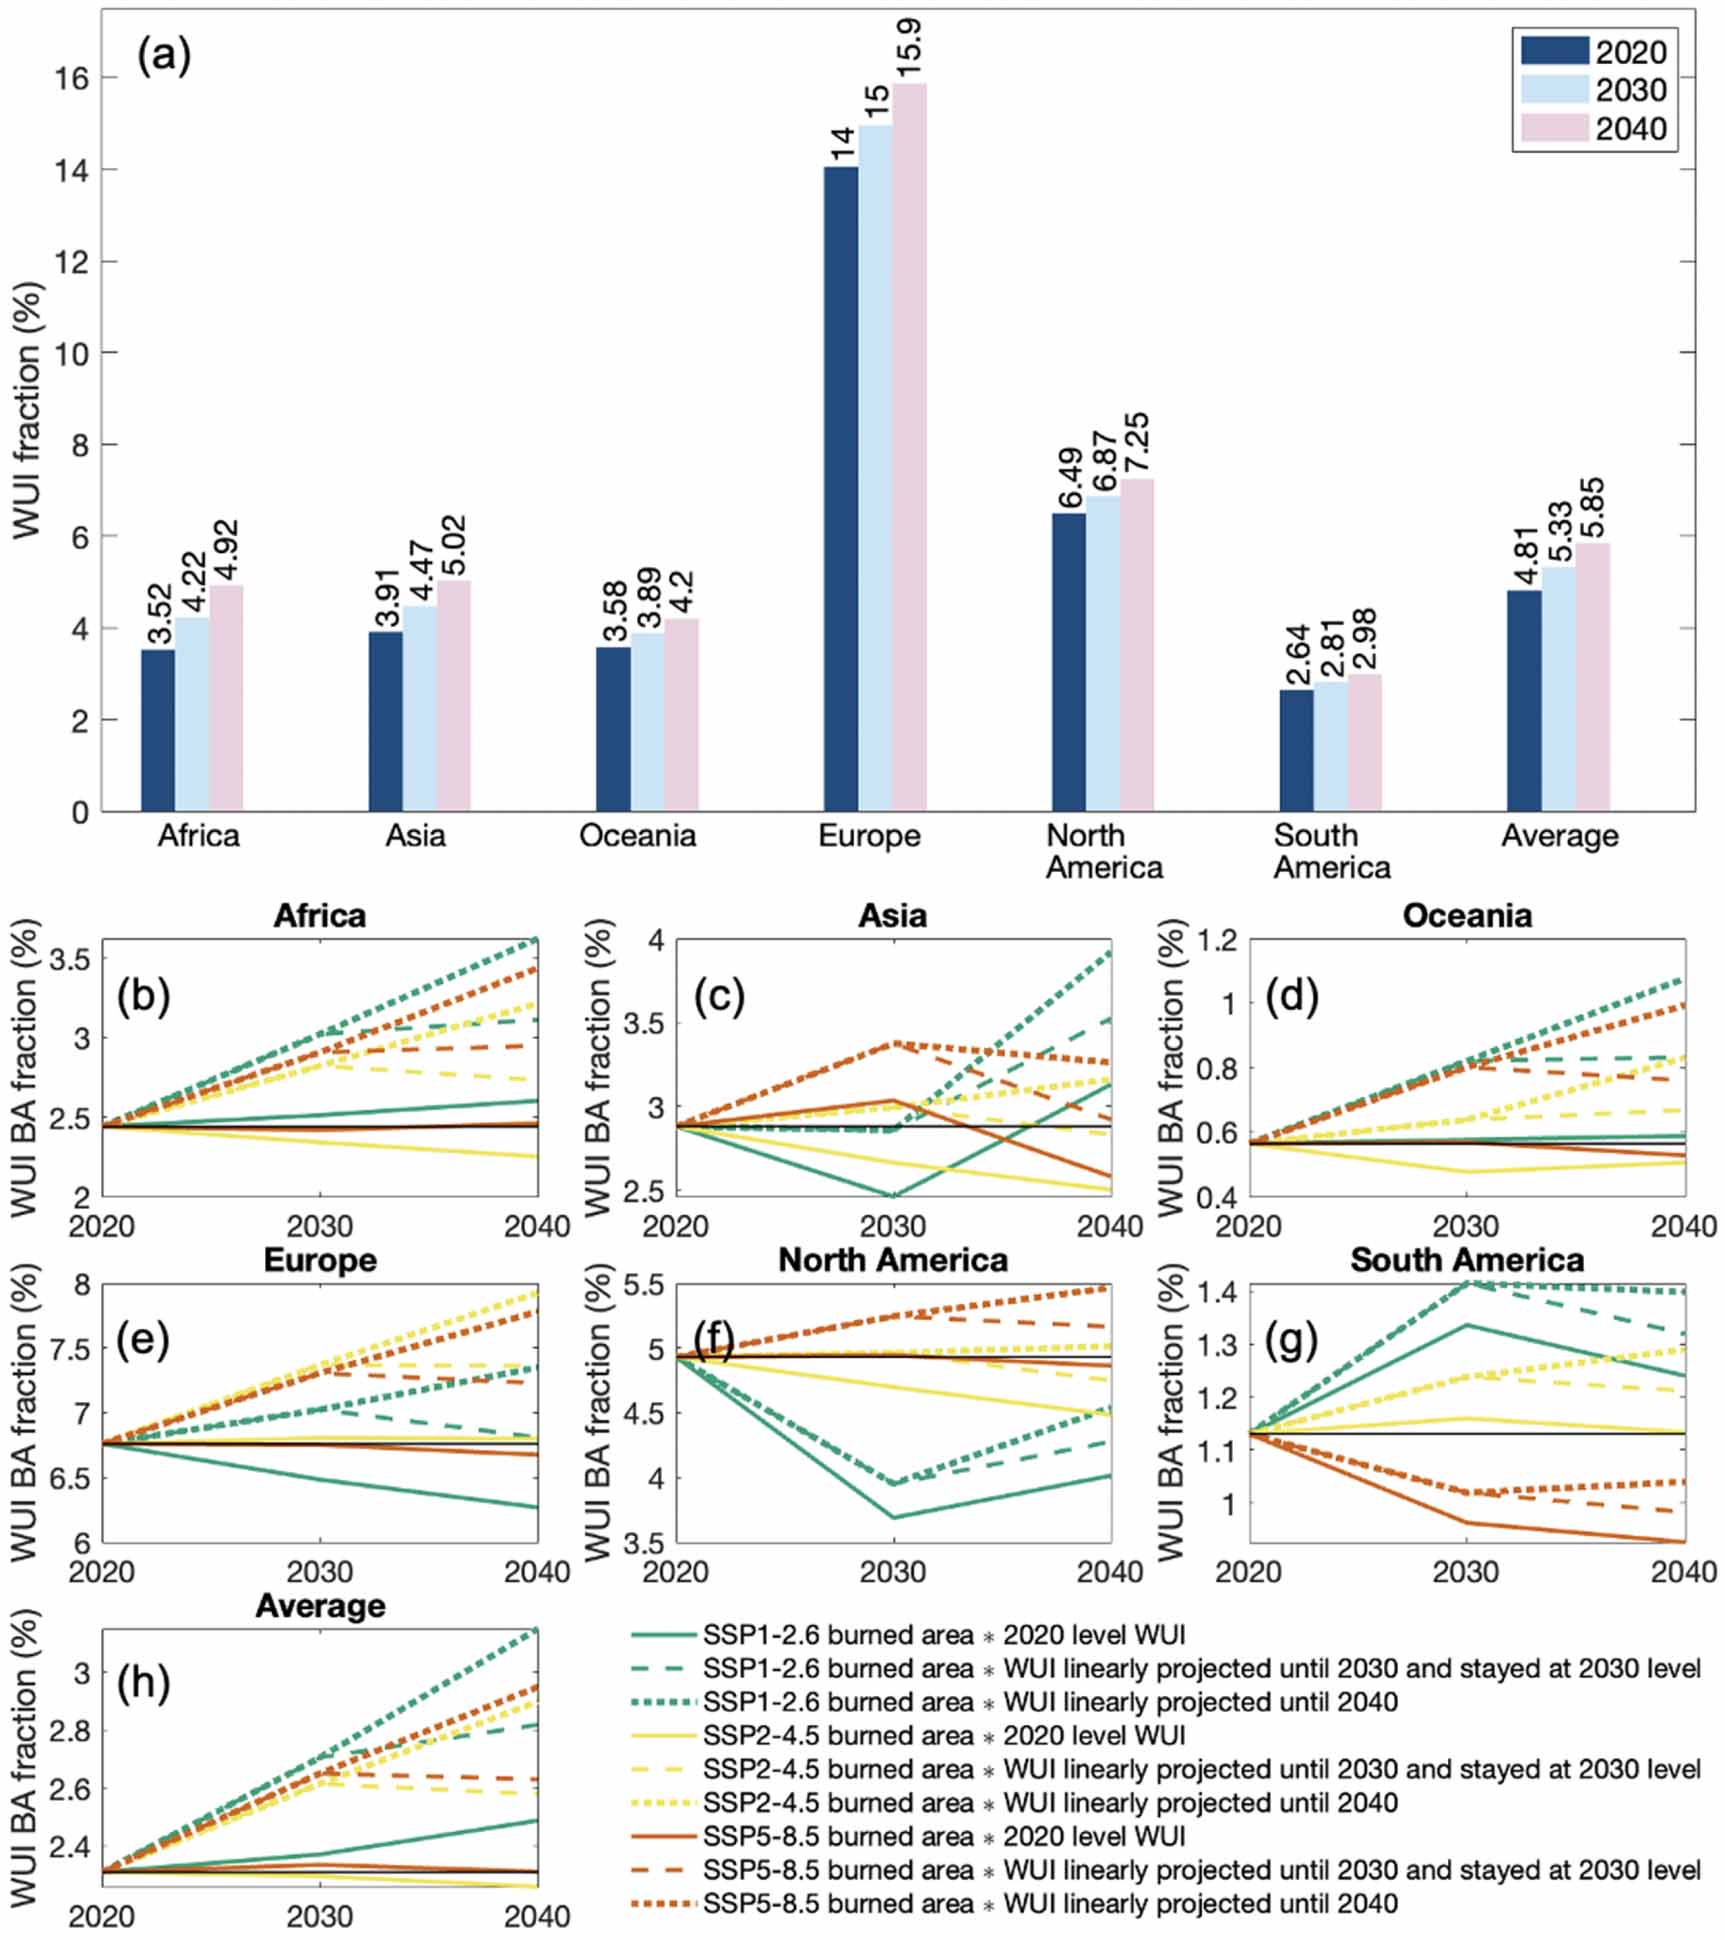
We combine the three future WUI scenarios with the three future burned area scenarios. The projected burned area is shown in figure S10. Globally (figure 5(h)), the only scenario under which the WUI fraction of burned area is projected to slightly decrease (2.26% in 2040) is the one with future WUI staying at the 2020 level combined with SSP2-4.5 burned area as burned area is projected to decrease under SSP2-4.5 (figure S10). Under all the scenarios with the WUI fraction linearly increasing from 2020 to 2030 or 2040, the WUI fraction of burned area will increase (2.58%–3.15% in 2040). This suggests that WUI fires will likely become more significant in the future. The trends under different scenarios vary across individual continents. In Africa, Europe, and Oceania, the WUI changes tend to play a more important role in determining the trends of future WUI fractions of burned area, whereas in Asia, North America, and South America, the future changes of burned area appear to play a more important role.
7. Conclusions
We developed a 9 km WUWUI database for 2001–2020. We then analyzed the WUI area fraction from WUWUI together with MODIS fire counts and burned area to understand the change of WUI fires. In addition, we analyzed projected changes of WUI fraction and WUI fires in 2030 and 2040. The main conclusions are as follows:
- The global average fraction (excluding the Antarctic and oceans) of WUI is 4%–5% during 2001–2020. The continental average fraction of WUI is the largest in Europe (12%–14%) and the lowest in Oceania (2%–3%).
- WUI area fraction has been increasing in all populated continents from 2001 to 2020 and the global relative increase is 24% (increased from 3.9% in 2001 to 4.8% in 2020). The largest relative increase of WUI from 2001 to 2020 occurs over Africa (59%). The lowest relative increase occurs in North America (11%), where the WUI fraction is already relatively high.
- Global total fire counts and burned area decrease by 10% and 22% from 2005 to 2020, respectively, whereas the WUI fractions of fire counts and burned area increase by 23% and 35%, respectively, mainly due to the WUI area expansion.
- Globally, the WUI fraction is projected to increase from now (4.8%) to 2040 (5.9%). The global WUI fraction of burned area is projected to increase from now to 2040 under most scenarios analyzed in this study. This indicates that WUI and WUI fires would become more important in the future. More research is needed on WUI fires and their impacts on air quality and climate.
This study is a first step to quantify the changes of WUI fires at the global scale, which paves the road for future studies of their impacts on air quality and climate. WUI fires can interact with many key elements such as air quality, urban meteorology, and health/property exposure. Given the global expansion of WUI areas and the increasing importance of WUI fires, understanding WUI fires is becoming crucial in quantifying fire characteristics in the Earth system, interactions between fires and human activities, and fire impacts on air quality and health.
Acknowledgments
This project is supported by NOAA Atmospheric Chemistry, Carbon Cycle and Climate (AC4) Program (Award Number: NA22OAR4310204). Cenlin He was partially supported by NOAA's Climate Program Office's Modeling, Analysis, Predictions, and Projections Program (MAPP), Grant# NA20OAR4310421. This material is based upon work supported by the National Center for Atmospheric Research, which is a major facility sponsored by the National Science Foundation under Cooperative Agreement No. 1852977. We thank Schug et al for their global WUI map for 2020. We thank Radeloff et al for the WUI dataset of conterminous United States (CONUS) downloaded from the Forest Service Research Data Archive, United States Department of Agriculture. We thank the MODIS MCD12Q1, MCD43A3, MOD13Q1, MOD44B, MCD64A1, and active fire teams for the satellite data. We thank GHS-POP team for the population data.
Data availability statement
The WUWUI dataset can be accessed through https://zenodo.org/records/10703310 (Accessed 12 March 2023). The MCD12Q1 data is available at https://lpdaac.usgs.gov/products/mcd12q1v061/ (Accessed 16 November 2023). The MCD43A3 data is available at https://lpdaac.usgs.gov/products/mcd43a3v061/ (Accessed 17 November 2023). The MOD13Q1 data is available at https://lpdaac.usgs.gov/products/mod13q1v061/ (Accessed 17 November 2023). The MOD44B data is available at https://lpdaac.usgs.gov/products/mod44bv061/ (Accessed 31 May 2023). The GHS Population Grid Multitemporal (1975–2030)—OBSOLETE RELEASE data can be accessed through https://jeodpp.jrc.ec.europa.eu/ftp/jrc-opendata/GHSL/GHS_POP_GLOBE_R2022A/ (Accessed 17 November 2023). The MCD64A1 data is available at https://lpdaac.usgs.gov/products/mcd64a1v061/ (Accessed 17 November 2023). The FIRMS fire count data is available at https://firms.modaps.eosdis.nasa.gov/active_fire/ (Accessed 17 November 2023). CESM2 model results can be accessed at https://esgf-node.llnl.gov/projects/cmip6/ (Accessed 17 November 2023).
Supplementary data (4.0 MB DOCX)