

Abstract
Reservoirs of 14C-depleted methane (CH4), a potent greenhouse gas, residing beneath permafrost are vulnerable to escape where permafrost thaw creates open-talik conduits. However, little is known about the magnitude and variability of this methane source or its response to climate change. Remote-sensing detection of large gas seeps would be useful for establishing a baseline understanding of sub-permafrost methane seepage, as well as for monitoring these seeps over time. Here we explored synthetic aperture radar's (SAR) response to large sub-permafrost gas seeps in an interior Alaskan lake. In SAR scenes from 1992 to 2011, we observed high perennial SAR L-band backscatter (σ0) from a ∼90 m-wide feature in the winter ice of interior Alaska's North Blair Lake (NBL). Spring and fall optical imagery showed holes in the ice at the same location as the SAR anomaly. Through field work we (1) confirmed gas bubbling at this location from a large pockmark in the lakebed, (2) measured flux at the location of densest bubbles (1713 ± 290 mg CH4 m−2 d−1), and (3) determined the bubbles' methane mixing ratio (6.6%), radiocarbon age (18 470 ± 50 years BP), and δ13CCH4 values (−44.5 ± 0.1‰), which together may represent a mixture of sources and processes. We performed a first order comparison of SAR σ0 from the NBL seep and other known sub-permafrost methane seeps with diverse ice/water interface shapes in order to evaluate the variability of SAR signals from a variety of seep types. Results from single-polarized intensity and polarimetric L-band SAR decompositions as well as dual-polarized C-band SAR are presented with the aim to find the optimal SAR imaging parameters to detect large methane seeps in frozen lakes. Our study indicates the potential for SAR remote sensing to be used to detect and monitor large, sub-permafrost gas seeps in Arctic and sub-Arctic lakes.
Export citation and abstract BibTeX RIS

Original content from this work may be used under the terms of the Creative Commons Attribution 4.0 license. Any further distribution of this work must maintain attribution to the author(s) and the title of the work, journal citation and DOI.
1. Introduction
Arctic permafrost imperfectly traps reservoirs of 14C-depleted methane (Isaksen et al 2011), a powerful greenhouse gas with a global warming potential of 25–34 times higher than carbon dioxide (Myhre et al 2013). This entrapment of methane by permafrost and glacial overburden has been referred to as the 'cryosphere cap' (Walter Anthony et al 2012, Kohnert et al 2017, Kleber et al 2023). However, fractionated hydrocarbons in surface soils near Prudhoe Bay, Alaska is evidence of gas migration through thick, frozen soils, indicating that ice-bonded permafrost is not a perfect seal (Masterson et al 2001). Warming and thinning of permafrost, often accelerated by surface and ground water dynamics (Yoshikawa and Hinzman 2003, Woo 2012), can create thawed chimneys in the frozen ground (open taliks) facilitating gas migration (Bowen et al 2008, Sullivan et al 2021). 14C-depleted methane also escapes to the atmosphere through faults (Etiope and Klusman 2002), and petroleum exploration/extraction often punctures within- and sub-permafrost methane reservoirs causing blowouts (Yakushev and Chuvilin 2000) indicating high volume sub-permafrost gas reservoirs. Anomalously-high methane fluxes observed in a terrestrial sedge-dominated tundra environment (>1100 mg CH4-C m−2 d−1) were attributed to a thermogenic, sub-permafrost origin (von Fischer et al 2010). Whether or not natural 14C-depleted methane emissions are increasing is a matter of great uncertainty (Etiope and Klusman 2002, Schwietzke et al 2016), as well as of twofold interest: 14C-depleted methane seeps cause a positive feedback to climate warming by enhancing more warming, thaw, and methane release (Walter Anthony et al 2012, Kohnert et al 2017); additionally, a solid knowledge of natural 14C-depleted methane emissions is vital to an accurate estimate of anthropogenic methane emissions from petroleum industries (Mazzini et al 2021).
Visibly-open holes in lake ice from naturally-occurring bubbling seeps have been used to map and quantify 14C-depleted methane within Alaskan and Greenland lakes (Walter Anthony et al 2012, 2021, Sullivan et al 2021). Ice holes are created by a combination of vigorous bubbling's mechanical force and water-column convection, whereby relatively warmer lake-bottom water accompanies gas bubbles as they rise to the surface. However, consistent detection, quantification, and monitoring of these high-flux, focused gas seeps on frozen lakes using optical remote sensing approaches is challenging because even a thin layer of ice or snow renders seeps optically undetectable in aerial flights and multispectral satellite imagery. Seeps are also challenging to visually detect in summer during ice-free conditions when rain or breeze on open water obscures bubble-stream visibility.
Recent advances in aerial reconnaissance using multispectral absorption instruments such as the next generation airborne visible/infrared imaging spectrometer (AVIRIS-NG) have successfully mapped geologic methane seeps in the four corners region of the United States (Frankenberg et al 2016) and thousands of other terrestrial methane anomalies in the permafrost regions of Alaska and NW Canada (Elder et al 2020, 2021). While airborne methane sensors have made important recent advances by mapping over 70 000 km2 of Alaska and northwestern Canada with AVIRIS-NG during the summers of 2017–2019 through NASA's arctic boreal vulnerability experiment (ABoVE) (Miller et al 2019), they remain a terrestrial (not aquatic) methane monitoring platform due to radiometric constraints on spectrometry and are generally relegated to summer flights. Airborne eddy covariance platforms (Kohnert et al 2017) can detect both terrestrial and aquatic methane, and have inferred natural-gas methane during summer campaigns based on high, focused fluxes; however, such campaigns have so far been rare and ground-truth limited due to logistical constraints. If methane previously impeded by permafrost can escape through newly formed conduits, greenhouse gas concentration in the atmosphere would increase in a way that is not currently accounted for in carbon budgets. Hence there is a need for development of satellite remote-sensing methods coupled to ground-truth sampling that can accurately detect and quantify large methane seeps to establish a baseline for change detection in vast Arctic landscapes.
Mapping gas seeps with remote sensing could also benefit the safety of people traveling in winter since bubbling creates dangerous ice conditions. The bubbling-induced weak ice is often masked by snow, giving no indication to travelers until they have fallen through the ice.
Synthetic aperture radar (SAR) remote sensing has been used for decades to gain knowledge about lakes and lake ice (Murfitt and Duguay 2021), including an empirical model used to quantify methane bubbling from ecologic sources (microbial methane formed in near-surface sediments) based on the bubble-induced rough ice/water interface in lakes (Engram et al 2020), to which SAR is sensitive (Atwood et al 2015). While SAR can be more difficult to interpret than multispectral/optical imagery, its active microwave instrument is not dependent on reflected sunlight. Thus, SAR can image lake ice throughout the dark winter, and can penetrate clouds and dry snow. Based on our observations of high sigma-naught (σ0) normalized radar cross section backscatter features from lake ice at the location of known geologic seeps (Walter Anthony et al 2012, Wooller et al 2012, Sullivan et al 2021) in L-band SAR (∼24 cm wavelength), we were motivated to explore the potential and lay the groundwork for space-borne SAR to systematically detect large gas seeps within lakes. We focus our work on NBL, an interior Alaska lake in which we observed perennial high SAR L-band σ0 backscatter from a ∼90 m-wide anomalous feature in winter ice prior to any field-work knowledge (figures 1(a) and (b)).
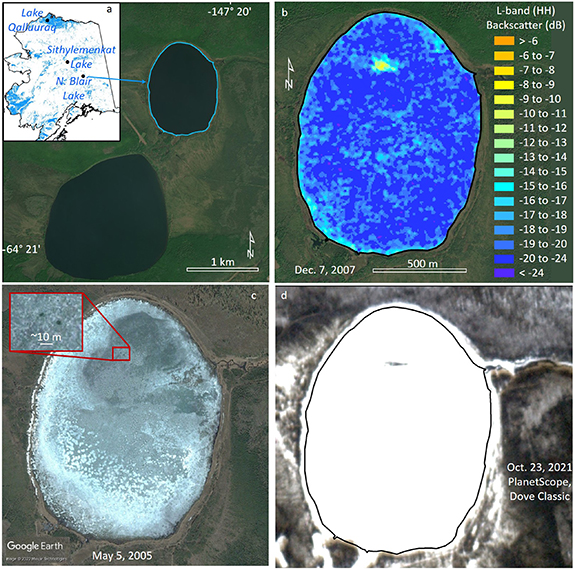
Figure 1. North Blair Lake (NBL) in interior Alaska is the site of a large methane seep discovered exclusively with L-band SAR imagery. The NBL area is used for recreation and hunting, although the land is in an Army reservation, labelled 'Fort Wainwright' on a USGS map (US Geological Survey, Fairbanks B-1, 1:63 360). Lake Qalluuraq and Sithylemenkat Lake are sites of known large methane seeps (panel (a)). High L-band HH-polarization backscatter feature in northern quadrant of NBL (panel (b)) corresponds to open holes in the ice in fall (panel (c)) and spring (panel (d)) optical imagery (Image © 2021 Planet Labs PBC). Lakes (blue) shown in panel (a) are HydroLAKES dataset (Messager et al 2016). SAR data in panel (b) is ALOS PALSAR-1 ©JAXA/METI 2007, colorized for contrast and normalization between images. Background image in panels (a) and (b) from Alaska High Resolution Imagery RGB 2020 (Maxar Technologies Inc., Alaska Geospatial Office, USGS). (a) Data reproduced from Alaska Department of Natural Resources. CC BY 3.0. Data reproduced from Messager et al (2016). CC BY 4.0. (b) Data reproduced from ALOS PALSAR-1 ©JAXA/METI 2007. Background image: ©2020 Maxar Technologies Inc., Alaska Geospatial Office, USGS.
Download figure:
Standard image High-resolution imageThe primary goal of this research was to improve our ability to detect and quantify anomalously large gas seeps in frozen lakes by using SAR to gain better understanding of the sensitivity to seepage of a variety of SAR platforms. Specific objectives included: (1) conduct field work to confirm that the remotely-sensed feature at NBL was a large, geologic gas seep; (2) determine optimal parameters for NBL seep detection using single-polarization (single-pol) L-band SAR backscatter with different incidence angles; (3) examine decomposed quadrature-polarized (quad-pol) L-band data from the NBL seep as well as from other known sub-permafrost methane seeps with different ice/gas morphologies (figure 2) in two other Alaskan lakes to gain first-order knowledge of how different shapes of ice/water interfaces present in SAR polarimetric parameters; (4) examine shorter wavelength C-band SAR over the NBL seep to determine whether large methane seeps could be detected with this wavelength, since low C-band backscatter (instead of high) anomalies had suspected (no ground truth) association with natural gas seepage in a West Siberian lake (Pointner et al 2021); and (5) examine historical L-band data to determine the NBL seep presence or absence in the early 1900s (supplementary tables 1 and 2).

Figure 2. Schematic showing probable shapes of gas, water, and ice for studied seeps. Red line shows highest dielectric contrast between two media, indicating probable location of SAR scattering. The NBL seep represents (a) closed ice surface with bubbles included in dense ice-trapped chimneys (sometimes open holes in shoulder seasons). The north seep at Lake Qalluuraq (b) has many mixed open/closed water/gas chimneys. The main seep at Lake Qalluuraq (c) is a single open water cavity. Shapes of bubbles in ice for (a) and (b) are modeled after bubbles observed in ice blocks harvested from lakes near Fairbanks with bubble size of <5 mm and 1–2 cm respectively. Shape of ice cavity in (c) is based on under-ice photos in Walter et al (2009). Ice growth changes the shape of the ice/water/gas interface over time. Pockmarks in sediments are not to scale, but indicate relative differences based on field observations.
Download figure:
Standard image High-resolution imageWe used only ice-on SAR scenes for analysis, since σ0 from bubbling activity in open water can be obscured by wind-roughened water surfaces. In addition to the physical presentation of these seeps as they effect the highly reflective ice/water interface, we present results of gas analyses from the seeps.
2. Methods
2.1. Physical properties of study site and comparison of lake seeps
NBL is one of two 'Blair Lakes' that are morphologically unusual (exceptionally large and round) on the Tanana River floodplain landscape, an area noted by Jorgenson et al (2001) as Tanana-Blair Lakes Uplands (figure 1(a)). Blair Lakes are partially surrounded by hills >300 m high with steep terrain (supplementary figure 1). Hills in this region can create large precipitation gradients with permafrost-free highlands serving as groundwater recharge zones to the permafrost-dominated lowlands where Blair Lakes reside (Kane 1981, Gieck and Kane 1986, Youcha 2003).
The origin of Blair Lakes is unknown. They are not of glacial or thermokarst origin (Kurtz et al 1966) and there are no volcanos nearby to indicate they are maars, a specific round type of waterbody caused by the explosive reaction of hot lava with water or permafrost (Lorenz 1973, Beget et al 1996). NBL overlays non-Yedoma soils (Strauss et al 2022): permafrost in the Blair Lakes study area (47 m thick in one borehole, Chacho et al 1995) is discontinuous (Jorgenson et al 2008) and undergoing rapid degradation (Jorgenson et al 2001).
Faults form fractures through which geologic methane can vent (Etiope and Martinelli 2002), and the occurrence frequency of lake-bound geologic methane seeps inversely correlates with distance to faults (Walter Anthony et al 2012). Blair Lakes are in the Salcha seismic zone, and a fault mapped approximately 4.3 km N-NE of the NBL seep (Gedney and VanWormer 1974, supplementary figure 1) is a left-lateral slip fault that could contribute to gas release in NBL (Barrett Salisbury, personal communication).
In addition to the NBL seep, we selected previously identified geologic seeps with different ice-bubble morphologies (figure 2) to explore variability in geologic seep interactions with SAR. We chose examples of three types of geologic seep morphologies in lake ice that we have previously measured in situ (figure 2) and examined scattering mechanisms from decomposed quad-pol SAR data. Lakes where these seeps occur were not necessarily representative of particular lake types, but were chosen because they contained large, sub-permafrost methane seeps that created a variety of shapes at the ice/water interface which could affect SAR backscatter. Seep-type, rather than lake-type, is considered representative in the Arctic.
Two seeps occurred in Qalluuraq Lake, a thermokarst lake situated in a larger drained lake basin near the Meade River south of Atqasuk, Alaska: (1) a large (∼10 m diameter) seep, called Q. Main (figures 3(a) and (b)) that creates a single cavity in the ice, remaining ice-free (open) with vigorous bubbling in winter despite sub-zero temperatures although a thin (<10 cm in January 2008) snow-ice cover seasonally masks the open hole at the surface (Wooller et al 2012), (2) a seep field in the north section of the lake (Q. North) that creates numerous mixed open/closed water/gas chimneys (figure 3(c)) in the lake ice on the order of 1–2 m in diameter (Walter Anthony et al 2012).

Figure 3. Qalluuraq L. main gas seep (a) 8 October 2008 open hole in lake ice caused by vigorous bubbling. For scale, the person is slightly over six feet tall. Photo reused with permission from co-author Katey Walter Anthony. (b) Forward looking InfraRed (FLIR) image of researcher measuring gas flow rate on 18 January 2008 from a small hole made in the naturally-occurring snow-ice cover. The warm pixels indicate thin, <10 cm snow-ice cap over the ice-free hole created by gas seepage. Photo reused with permission from Peter Anthony. (c) Lake Q North seep, 8 October 2008. Panels (a)–(c) are modified from Walter et al (2009). Photo reused with permission from co-author Katey Walter Anthony. (d) PALSAR-1 SAR image acquired 30 January 2010 (Data reproduced from ALOS PALSAR-1 ©JAXA/METI 2010.) showing high backscatter from Q Main and Q North seeps. A drained lake basin surrounding the lake is visible in the background image 7 July 2007, true color (Data reproduced with permission from ©JAXA 2007. All rights reserved.).
Download figure:
Standard image High-resolution imageAdditionally, we selected two methane seeps at Sithylemenkat Lake (figure 4), which manifest as open holes in lake ice throughout winter, surrounded by a belt of ice-trapped bubble columns, thereby representing all three types of water-ice-bubble shapes shown in figure 2. Sithylemenkat Lake has a round shape similar to NBL and is also mostly surrounded by hills. Walter Anthony et al (2012) conducted field work at this lake on 16 February 2010 when the ice was >2 m thick: the gas had a strong hydrogen-sulfide (rotten egg) smell. Water depth at the southern seep was 12.9 m. The origin of Sithylemenkat Lake is undetermined: some claim it is a crater lake formed when a meteor struck Earth (Cannon 1977, 1978) while others dispute this theory (Patton and Miller 1978). Gas geochemistry is shown in table 1.

Figure 4. (a) SAR L-band mid-winter single-pol image (15 February 2009; Data reproduced from ALOS PALSAR-1 ©JAXA/METI 2009.) of frozen Sithylemenkat Lake shows high backscatter at the location of open holes as measured on-ice by GPS (white circles) on 16 February 2010. (b) Larger of the two open holes as seen from the air with ice-trapped bubbles in the >2 m thick adjacent ice. (c) Smaller of two naturally-occurring open holes caused by ebullition. Areas of the small (c) and large (b) holes were estimated in the field to be 6 m2 and 21 m2 respectively. All rights reserved. Photo reused with permission from co-author Katey Walter Anthony. Background image for (a) is AVNIR-2 27 September 2010 true color. Data reproduced with permission from ©JAXA 2010. All rights reserved.
Download figure:
Standard image High-resolution imageTable 1. North Blair Lake seep bubble gas concentrations and isotopes (this study) alongside those constituents previously measured at Qalluuraq Lake (Lake Q, Walter Anthony et al 2012) and Sithylemenkat Lake (this study).
| Bubble constituent | North Blair Lake | Sithylemenkat Lake Fresh bubbles 16 February 2010 | Lake Q (main seep) Fresh bubbles 2007–2009 | Lake Q (north seep) Fresh bubbles Oct. 9 October 2008 | ||
|---|---|---|---|---|---|---|
| Ice-trapped bubbles 18 December 2020 | Fresh bubbles 11 September 2021 | |||||
| CH4 | (%) | 5.4 | 6.6 | 5.5 ± 0.0 | 97.0 ± 3.6 | 99.5 ± 1.2 |
| CO2 | (%) | 0.5 | 0.3 | 0.09 ± 0.00 | 1.17 ± 0.23 | 0.38 ± 0.10 |
| Ethane | (%) | — | — | 0.0099 ± 0.0010 | 0.0517 ± 0.0474 | 0.0021 ± 0.0001 |
| δ13CCH4 | (‰) | −48.1 ± 0.02 | −44.5 ± 0.1 | −48.4 ± 0.76425 | −57.22 ± 1.20 | −57.40 ± 0.29 |
| δDCH4 | (‰) | −212.2 ± 0.44 | −214.3 ± 0.9385 | −231.22 ± 1.35 | −226.38 ± 2.69 | |
| 14CCH4 age | (yrs BP) | 18 470 ± 50 | 38 300 ± 400 | 47 380 ± 4,580 | 47 511 ± 1,400 | |
| (FM) | 0.1003 ± 0.0006 | 0.0085 ± 0.0004 | 0.0027 ± 0.0016 | 0.0027 ± 0.0005 | ||
| 14CCO2 age | (yrs BP) | 6,370 ± 80 | — | — | — | |
| (FM) | 0.4525 ± 0.0040 | — | — | — | ||
| CH4 flux | kg CH4 d−1 | 0.18 | 1.2 | 98 | 8.0 | |
2.2. Field work on NBL
Garmin-GPS coordinates for field samples and observations were collected on NBL during three field campaigns on 18 December 2020; 10–11 and 17 September 2021. During the 10–11 September 2021 field work, bubbling extent was mapped from a boat during calm water conditions when seep-bubble streams were visible in the lake water column (figures 5(a) and (c)). Seep-field area was calculated in GIS (ArcMap v.10.7) and active-bubbling waypoints were overlain with SAR data in GIS to compare the location and extent of the mapped seep field to the high-backscatter feature (figure 6(b)).
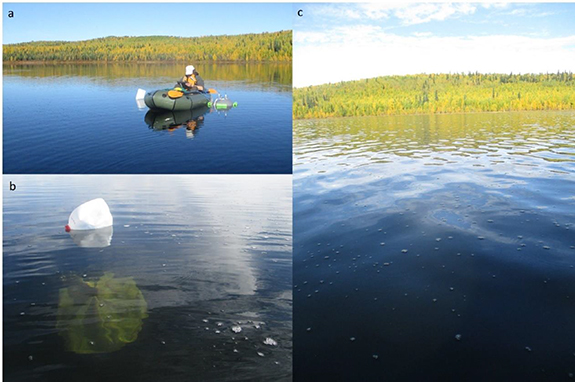
Figure 5. September 2021 field observations at N. Blair L. included flux measurements with a floating chamber attached to a LGR-ICOS microportable greenhouse gas analyzer (a), bathymetric measurements, and collection of gas samples with underwater bubble traps (b). Active bubbling is seen on lake surface (b), (c) and was mapped at the location of the high L-band SAR backscatter anomaly. No evidence of oil or oil slicks were seen at NBL. (a) Photo reused with permission from Peter Anthony. (b), (c) Photo reused with permission from co-author Katey Walter Anthony.
Download figure:
Standard image High-resolution image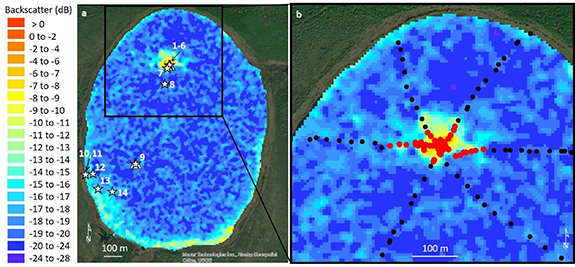
Figure 6. PALSAR-1 single-pol image on 17 March 2011 of NBL (a) showing chamber flux measurement locations as white stars (numbers correspond to supplementary table 3), bubble trap location as small square inside seep (at points 1–6), hydrolab locations as white triangles (at points 9 and 1–6). (b) GPS points recorded from a boat in September 2021 at locations of bubbling (red circles) and locations of no bubbling (black circles) align spatially with location of 2006–2011 SAR high backscatter zone. Data reproduced from ALOS PALSAR-1 ©JAXA/METI 2011. Background image: ©2020 Maxar Technologies Inc., Alaska Geospatial Office, USGS.
Download figure:
Standard image High-resolution imageConcentrations of methane and carbon dioxide in December ice-trapped and September open-water bubble samples were measured by gas chromatography at Florida State University (supplementary methods). We mapped NBL bathymetry 10–11 September 2021 using a boat-mounted side-scan sonar unit with integrated GPS (supplementary methods). During September 2021 fieldwork, methane and carbon dioxide linear fluxes were measured continuously for ∼2-to ∼4 min at 14 locations within the active bubbling area and around the lake outside the seep field using the floating static chamber method (Aguirrezabala-Campano et al 2021; figures 5(a), 6(a) and supplementary table 3).
To explore possible differences in water chemistry at the seep and remainder of the lake we measured water-column hydrochemical properties with a Quanta Hydrolab (supplementary table 4) and surface-water δDH2O and δ18OH2O on 11 and 17 September 2021 (figure 6(a)) at the Alaska stable isotope facility (supplementary table 5).
2.3. SAR data processing and analysis
To assess the seasonal variation and historic duration in σ0 presentation of the NBL seep, we processed data from two L-band spaceborne SAR missions over NBL: the Phase Array L-band Synthetic Aperture Radar-1 (PALSAR-1) instrument aboard the Japanese Advanced Land Observing Satellite-1 (ALOS-1) from 2006–2011, and the Japanese Earth Resources Satellite 1 (JERS-1) from 1992–1998 (supplementary methods). The range of σ0 for JERS-1 and PALSAR-1 single-pol (HH) imagery was determined by the minimum and maximum pixel values within the seep area, mapped from field work, for different incidence angles and seasons (early-, mid-winter, and Spring) (tables 2 and 3). As well as σ0 intensity, we visually examined σ0 contrast between the seep and adjacent ice in images acquired with different incidence angles to determine optimal imaging parameters for detecting seeps.
Table 2. PALSAR-1 fine beam single-polarization (FBS) L-band backscatter intensity from the ice over the NBL seep from 34 scenes over 4 winters, varying incidence angles. Dashes indicate that no data were available over the site for that timeframe.
| Season | FBS 24° (σ0 dB) | n scenes/n winters | FBS 39° (σ0 dB) | n scenes/n winters | FBS 47° (σ0 dB) | n scenes/n winters | FBS 59° (σ0 dB) | n scenes/n winters |
|---|---|---|---|---|---|---|---|---|
| Early winter (Oct–Dec) | −7 to −20 | 3/ 3 | −7 to −20 | 7/ 6 | −10 to −22 | 4/ 4 | −12 to −21 | 3/ 1 |
| Mid-winter (Jan–Feb) | — | — | −5 to −19 | 10/ 5 | — | — | — | — |
| Spring (Mar–Apr) | — | — | −5 to −17 | 5/ 5 | −5 to −15 | 2/ 2 | — | — |
Table 3. JERS-1 intensity from ice over the NBL seep from 15 scenes over 5 winters.
| Season | JERS-1 39° (dB) | n scenes/n winters |
|---|---|---|
| Early winter (Oct–Dec) | −9 to −19 | 6/ 4 |
| Mid-winter (Jan–Feb) | −7 to −18 | 5/ 4 |
| Spring (Mar–Apr) | −7 to −17 | 4/ 3 |
To compare NBL with previous published research reporting low C-band SAR backscatter from suspected West Siberian lake seeps, we processed and examined Sentinel-1 C-band (∼5 cm wavelength) dual polarized (dual-pol) data over NBL for the 2020–2021 winter, coinciding with 18 December 2020 field work (SI methods). The approximate area of the perennial high-backscatter feature in NBL was calculated in GIS from several scenes throughout the winter by manually delineating the high-backscatter feature from the low-backscatter background, then calculating the area.
We processed all quad-pol PALSAR-1 scenes when NBL was frozen, using the [T3] coherence matrix main diagonal elements and the Yamaguchi 3-component decomposition (Yamaguchi et al 2006) in order to include a mathematical as well as an incoherent model-based decomposition in our analysis (Ferguson and Gunn 2022). The resulting three Yamaguchi components (odd-, double-bounce and volumetric scattering) along with the T11, T22, and T33 parameters were processed to geotiff files (SI methods). To compare the NBL seep to known seeps in Lake Qalluuraq and Sithylemenkat Lake, which have different ice/water interface shapes, we downloaded and decomposed all quad-pol data for these lakes using the same processing methods as for NBL. Using a generalized seep shape derived from multiple images, we calculated the mean backscatter from the seep and the adjacent surrounding ice (100 m), and additionally performed a first order visual assessment of the presence/absence of each polarimetric component from these seeps with different ice-water interface shapes (table 4).
Table 4. Comparison of polarimetric signals from seeps with different morphologies. Mean backscatter from seep is contrasted with backscatter with adjacent ice (100 m surrounding seep). Y3 indicates the Yamaguchi 3-component polarimetric decomposition. Backscatter units are σ0 dB.
| Roughness | Double bounce | Volumetric Scattering | |||||||
|---|---|---|---|---|---|---|---|---|---|
| T11 | Y3 Odd | T22 | Y3 Dbl | T33 | Y3 Vol | ||||
| Seep type | Seep name | Date PALSAR-1 | Season | Seep/Adj. Ice | Seep/ Adj. Ice | Seep/Adj. Ice | Seep/ Adj. Ice | Seep/Adj. Ice | Seep/Adj. Ice |
| Mostly closed ice with bubbles included, sometimes open holes in shoulder seasons | NBL | 27-Nov-09 | Fall | −10/−15 | −10/−15 | −20/−21 | −20/−20 | −22/−25 | −19/−20 |
| 12-Jan-08 | Winter | −8/−15 | −8/−15 | −20/−22 | −19/−19 | −23/−27 | −19/−19 | ||
| 11-Apr-09 | Spring | −6/−11 | −6/−11 | −16/−19 | −17/−18 | −19/−23 | −16/−18 | ||
| 14-Apr-10 | Spring | −8/−11 | −9/−11 | −14/−16 | −16/−17 | −18/−21 | −16/−18 | ||
| Multiple open-holes | Lake Q North | 13-Nov-09 | Fall | −14/−21 | −15/−21 | −23/−24 | −23/−23 | −26/−28 | −23/−23 |
| 23-Mar-07 | Spring | −10/−15 | −10/−15 | −21/−23 | −22/−22 | −26/−27 | −22/−22 | ||
| 28-Mar-09 | Spring | −10/−14 | −10/−14 | −22/−22 | −22/−22 | −24−24 | −21/−21 | ||
| 26-Apr-09 | Spring | −7/−13 | −7/−13 | −20/−22 | −22/−22 | −22/−25 | −19/−21 | ||
| Single open cavity, open hole | Lake Q Main | 13-Nov-09 | Fall | −13/−20 | −14/−20 | −24/−25 | −23/−23 | −27/−28 | −23/−23 |
| 23-Mar-07 | Spring | −13/−12 | −13/−12 | −24/−22 | −22/−22 | −25/−24 | −22/−21 | ||
| 28-Mar-09 | Spring | −13/−15 | −14/−15 | −22/−22 | −22/−22 | −25/−25 | −21/−21 | ||
| 26-Apr-09 | Spring | −12/−16 | −13/−16 | −23/−23 | −22/−22 | −26/−25 | −22/−21 | ||
| Two open holes, surrounded by included bubbles | Sithylemenkat | 13-Nov-07 | Fall | −15/−17 | −15/−17 | −23/−23 | −20/−20 | −27/−28 | −20/−20 |
| 29-Dec-07 | Fall | −14/−19 | −13/−19 | −24/−25 | −21/−21 | −28/−29 | −21/−21 | ||
| 15-May-07 | Spring | −5/−9 | −5/−9 | −18/−19 | −19/−19 | −21/−21 | −18/−18 | ||
| 30-Mar-08 | Spring | −11/−14 | −11/−14 | −23/−24 | −21/−21 | −27/−29 | −21/−21 | ||
| 4-Apr-09 | Spring | −10/−14 | −10/−14 | −22/−24 | −20/−20 | −27/−29 | −20/−20 | ||
a indicates seep is visibly distinct from surrounding lake ice.
3. Results and discussion
3.1. Field work
3.1.1. Bathymetry and seep areal extent
Field work confirmed continuous streams of bubbles at the SAR-detected NBL anomaly (figure 5). The areal extent of the seep field from field observations was 8057 m2 (∼90 m in diameter). Lake depth was ∼1–4 m across most of NBL (mean depth 2.2 m), except directly below the seep field, where a complex pockmark up to 8 m deep was mapped (figures 7(a) and (b)). In published literature, at least two similar pockmarks are reported below large gas seeps releasing sub-permafrost, geologic methane through narrow thaw conduits beneath lakes: Bowen et al (2008) reports a pockmark up to 9.5 m in depth (∼35 m diameter) on the Mackenzie River Delta; Sullivan et al (2021) describes a 15 m deep pockmark (∼32 m diameter) in northwest Alaska. At NBL, side-looking sonar imaged bubbles rising from pockmarks (figure 7(c)). Some pockmarks have been attributed to groundwater springs associated with permafrost thaw (Paull Charles et al 2022). Sullivan et al (2021) gives a comprehensive review of pockmarks associated with methane release in the marine, terrestrial, and freshwater realms.
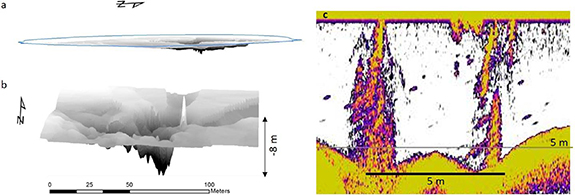
Figure 7. Whole-lake bathymetry (a) shows complex pock-mark (b) directly beneath the seep. Note vertical scale is ten times horizontal scale (a), (b). Sonar image (c) acquired 17 September 2021 showing bubble plumes rising from pockmarks in one of the densest seep areas of NBL.
Download figure:
Standard image High-resolution image3.1.2. Estimating seep emissions using floating chambers
In most lakes, ebullitive events impede measurement of linear concentration increases in chambers; however, due to the steady stream of small (<0.5 mm) bubbles in the NBL seep, we obtained linear fluxes (R2 = 0.93–0.99); although the linearity of diffusive fluxes outside the seep field was higher: R2 = 0.98–0.99 (supplementary table 3, supplementary figure 2). Under calm open-water conditions, field workers estimated that the density of ebullition bubbles at the location where the floating chamber measurements were made was about 100 times higher than the rest of the seep field, as defined by bubbling extent observed by GPS mapping (figure 6(b)).
Two areas (approx. 3 m × 4 m each) within the seep field had particularly strong ebullition. Ebullition within the densest bubbling area was ∼1700 mg CH4 m−2 d−1. When chambers were placed over open water areas between bubbling streams in the seep field, the diffusive flux was much lower, 14 ± 6 mg CH4 m−2 d−1, indicating ebullition dominated total emissions from the seep field. This also indicates that in the most intense areas of bubbling, seep emissions are 41 times higher than diffusion measured by floating chambers outside the seep field on the rest of the lake (42 ± 36 mg CH4 m−2 d−1). Ecological methane ebullition in NBL associated with microbial decomposition of organic matter in surface lake sediments was not measured, but sporadic bubbling of larger diameter bubbles (<2 cm) were observed in various areas of NBL away from the seep field during September field work.
3.1.3. Gas analysis results
Methane content of the NBL seep bubbles was unusually low (6.6%) compared to geologic seeps associated with coalbed and petroleum hydrocarbons (typically 40%–100%); however, the magnitude of seepage on a volumetric basis (figure 8(a)), as well as the 14C-depleted CH4 [18 470 ± 50 years BP; 0.1003 ± 0.0006 Fraction Modern (FM)] (figure 8(b)) and δ13CCH4 values (−44.5 ± 0.1‰) (figure 8(c)) indicate that it is more similar to other geologic methane seeps in Alaska than to ecological sources. Carbon dioxide concentration (0.3%) was even lower than methane, but carbon dioxide concentrations are often well below 1% in Alaska lake bubbles (Walter Anthony et al 2012, 2021). Interestingly, the methane concentration and stable isotopes at NBL were most similar to bubbles emitted from Sithylemenkat Lake (table 1), also a strikingly round lake, located in the Brooks Range.

Figure 8. North Blair Lake (NBL) seep gas properties. Seepage magnitude (a), methane (CH4) radiocarbon expressed as fraction modern (FM) carbon (b), and stable isotopes (c) of the NBL seep (yellow stars) plotted with other ecologic (open symbols) and geologic (black symbols) seeps in Alaska. Adapted from Walter Anthony et al (2012), with permission from Springer Nature.
Download figure:
Standard image High-resolution imageThe NBL seep-field bubbles were <5 mm in diameter at the water surface, smaller than bubbles typically seen at other geologic methane seeps (1 to >5 cm diameter bubbles and plumes of coalesced bubbles ∼100 cm diameter, Walter Anthony et al 2012). Geologic methane seeps are characterized by one or more continuous streams of bubbles (as seen at the NBL seep), in contrast to temporally sporadic ebullition from ecologic sources of methane, which intermittently release bubbles. Geologic methane seeps are also characterized by high fluxes of up to 141 600 l gas seep−1 d−1 often with high concentrations (up to 99.5%) of highly 14C-depleted methane (Walter Anthony et al 2012, Sullivan et al 2021).
3.2. SAR results and discussion
3.2.1. SAR backscatter from ice over liquid water
L-band SAR backscatter depends mainly on the physical shape of the ice/water interface created by gas bubbling, since cold water has a high dielectric constant ( , Komarov et al
2005) compared to pure ice (
, Komarov et al
2005) compared to pure ice ( Mätzler and Wegmüller 1987). This large dielectric contrast causes a highly reflective ice/water interface (figure 2). Field observations reveal that gas seeps in northern lakes sculpt the ice/water interface in several different ways. Strong, focused seeps with continuous bubble streams cause convection of the water column, whereby warm lake-bottom water is entrained by rising bubbles, impeding surface lake-ice formation. Since the water column surrounding strong bubble streams is not affected by ebullitive turbulence, lake ice grows vertically downward in calm water surrounding seeps. The result is a chimney of bubbling water with irregularly shaped ice walls (figure 2). Whether there is one focused seep or many seeps in a seep field will determine the number, diameter, and density of venting water-filled columns in lake ice, which in turn affect roughness relative to the SAR wavelength.
Ebullition rate, in combination with air temperature and snowfall, determine whether ice forms at the lake surface (Zimov et al 2001). Often, bubbling rates are not strong enough to keep the ice totally 'open' all winter: often a thin, incomplete layer of ice forms over the open bubbling water, while sometimes the surface completely freezes over. In cases where seeps ice-over, emerging bubbles displace the water and the mostly ice-free chimneys fill, or partially fill, with gas that periodically escapes though small crack and fissures in the ice surface, and then refill with gas by continued bubbling. Some seeps are highly diffuse (e.g. NBL), with widely-distributed bubble streams creating bubble-chimneys that become mostly encapsulated in the lake-ice sheet. The insulating effect of ice-trapped gas causes an upward-warped shape of the ice/water interface from relatively slower ice growth beneath bubbles (Engram et al 2013, 2020).
The different sizes and density of seep-caused ice/water shapes will cause varying backscatter responses, since SAR backscatter depends on the height, horizontal size, and spacing of water-filled bumps in the ice, relative to the SAR wavelength (Ulaby and Long 2014). Several water-filled chimneys or bumps in the underside of the ice, less than a wavelength in size will seem 'rougher' than a single water-filled dome with a diameter much greater than a wavelength.
3.2.2. SAR detection of strong gas seepage in NBL
GPS points delineating the boundary of visible bubbling for the NBL seep in September 2021 correlated spatially to the perennial high L-band SAR σ0 feature from lake ice (figure 6(b)). Seep area measured by the high SAR-backscatter area (5600–12 000 m2, depending on early or late winter 2007–2011) was similar to mapped area from September 2021 fieldwork (8057 m2). SAR was previously used in conjunction with local indigenous knowledge to discover new, large 14C-depleted methane seeps (Walter Anthony et al 2012, Sullivan et al 2021). This is the first time SAR σ0 was the only information used to guide us to a large methane seep for field work.
3.2.2.1. PALSAR-1 (L-band single-pol HH).
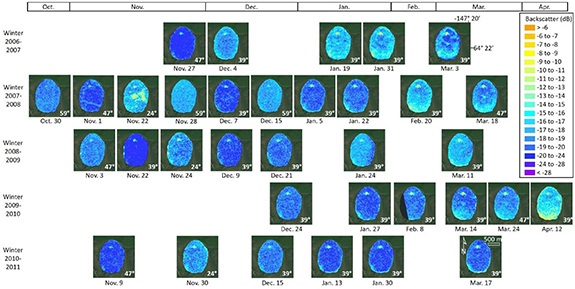
The NBL seep was visible as a group of distinct high (−5 to −10 dB maximum) σ0 pixels in every single-pol PALSAR-1 image from 2006–2011 obtained during ice-cover. These 34 images were acquired with a variety of incidence angles throughout the winter (figure 9). Comparing σ0 from pixels within the seep location (as defined by field GPS boundaries) for this dataset shows that the ranges of σ0 from data acquired at 24° and 39° were the same; however, σ0 decreased with increasing incidence angles (47° and 59°, table 2). Over the course of a winter, σ0 from ice at the NBL seep acquired with 39° incidence angles increased (2007–2011, table 2). Backscatter trends over the winter from other incidence angles could not be compared due to lack of data.
Figure 9. High backscatter anomaly (i.e. the bright feature in NW quadrant of NBL) is present in all available fine beam HH-polarized L-band scenes from 20 October to 15 April from PALSAR-1. Acquisition incidence angles noted in white text, lower right, of each scene. Data reproduced from © JAXA/METI ALOS PALSAR L1.5. Accessed through ASF DAAC 4 March 2022. Background images: ©2020 Maxar Technologies Inc., Alaska Geospatial Office, USGS.
Download figure:
Standard image High-resolution image
In our effort to identify L-band imaging parameters most sensitive to gas seeps in lake ice, we found that scenes acquired with a 47° or a 24° incidence angle showed fairly high contrast in some scenes with less contrast in others; 59° was least sensitive (figure 9). Examining all PALSAR-1 Fine Beam Single-pol data acquired from 2006–2011 for visual contrast, images acquired with a 39° incidence angle consistently showed the seep clearly and were also regularly acquired by PALSAR-1 throughout the winter, creating a high temporal resolution dataset. This suggests that data acquired with a 39° incidence angle is the optimal imaging mode for L-band single polarized data from PALSAR-1.
3.2.2.2. JERS-1.
Older L-band data from the JERS-1 platform were all acquired with a 39° incidence angle from 1992–1996 and have a coarser spatial resolution (12.5 m pixel size compared to 6.25 m for single-pol PALSAR-1). The NBL seep field was visible in at least one scene per winter in all five winters' ice covers in JERS-1, although it was indistinguishable in three of the 15 scenes due to lack of contrast (high backscatter across the lake), and was only faintly visible in some early winter scenes (supplementary figure 3). The difference in seep visibility in these earlier data and PALSAR-1 data is most likely due to a higher noise floor in JERS-1 (noise equivalent sigma0 is −14.5 dB, Shimada et al 2003) than PALSAR-1, resulting in less contrast and a noisier image overall in the older JERS-1 imagery. However, these data provide a valuable historical perspective, indicating that the NBL seep has existed since at least 1992. Similar to PALSAR-1 single-pol, JERS-1 backscatter from the NBL seep increased over the winter (1992–1997, table 3).
3.2.2.3. Sentinel-1 C-band
The NBL-seep ice returned high C-band σ0 in both VV and VH polarizations throughout the winter of 2020–2021, showing visible contrast with surrounding ice in early winter for both polarizations (supplementary figure 4). Other researchers report larger (∼500 m diameter) low C-band σ0 features appearing only in late winter from possible methane seeps in Western Siberia lakes, however no field confirmation that these were gas seeps was done (Pointner and Bartsch 2020, Pointner et al 2021). We see at NBL high σ0 from both C- and L-band SAR starting in early winter from ground-truthed sub-permafrost methane seeps in frozen lakes with high σ0 continuing all winter. The difference between these results can be explained by pressure from thick late-winter ice pushing water up through seeps in the West Siberian lake to cause large flooded areas on top of the ice, resulting in low backscatter. Further comparison of our results with previously published results are discussed in Supplementary Information: we show midwinter high L-band σ0 at feature locations on the West Siberia lake in supplementary figure 5.
3.2.3. SAR polarimetry from the NBL seep compared to other known geologic methane seeps in Alaskan lakes
The results of the two types of polarimetric decomposition (Pauli-based elements of [T3] coherency matrix vs. Yamaguchi 3-Component decomposition) were very similar, with visible differences in only four of 17 scenes (table 4, supplementary figure 6). In early winter, roughness and volumetric scattering were present at the site of the NBL seep for both decompositions (table 4).
All of the seeps, except for Q. Main, consistently demonstrated strong, distinct roughness scattering in every scene throughout the year. One reason for a less distinct, weaker roughness backscatter signal from the large Q. Main seep, is that this seep emerges as a single domed cavity (Walter et al 2009), creating one rough bump in the ice/water interface larger than one L-band SAR wavelength, a scenario which is governed by different scattering models than many bumps presenting in the same areal extent (Ulaby and Long 2014). Double-bounce was not detected on a regular basis in any of the seep shape types, indicating that the sides of water-filled ice columns are not orthogonal to the surrounding ice/water interface. Volumetric scattering was present only in the NBL seep on a regular basis. This is interesting since there is no appreciable volumetric component associated with ecologic seeps which often present as included bubbles in ice with a rough underlying ice/water interface (Engram et al 2012). One reason for a volumetric component at NBL lake could be the high density of bubbles in and under the ice. The presence of a volumetric component as well as roughness in the NBL seep could be leveraged to detect these types of seeps across a landscape.
3.2.4. Significance of high backscatter response and optimal SAR parameters
Since open water generally causes low-backscatter in SAR and open water is often present at these focused methane seeps, the high-backscatter response that we observed from field-confirmed sub-permafrost methane seeps in lake ice is surprising as well as useful. High backscatter indicates that the signal from the rough ice-water interface is stronger than low backscatter from any open water occurring at the surface of these seeps.
The determination of scattering mechanisms from quad-pol L-band SAR for large, sub-permafrost methane seeps in lake ice is significant information that could be used to evaluate the type of seep: roughness with a volumetric scattering component could mean a seep with mostly closed ice and bubbles included in the ice, similar to NBL seep, while a strong roughness signal could indicate a seep with multiple open holes, similar to Q-North and Sithylemenkat seeps. Other features in lake ice cause roughness scattering, such as ridges and cracks in the ice, but from our repeated observations of lake ice in SAR, they do not appear in the same location between years. Ecologic methane from decomposition of modern detritus also causes roughness scattering and could be responsible for backscatter variations across lake ice (Engram et al 2020); however, ecological ebullition is typically not focused in distinct anomalous features in lake ice, but rather appears as a more diffuse backscatter pattern.
L-band SAR showed consistent high backscatter from sub-permafrost methane seeps in lake ice. Seep pixels present as high contrast with surrounding ice throughout the winter. We observed slightly different scattering responses from differently shaped seep-ice (figure 2, table 4). C-band SAR shows high backscatter from seeps in early winter, but this signal is overshadowed by the high backscatter signal from floating lake ice in mid- and late-winter, especially in single-pol mode, limiting the usefulness of C-band to detect large methane seeps. The higher revisit frequency of Sentinel-1 does provide more opportunities for observing seeps in early winter: C-band is useful to confirm the presence of a known seep in the absence of L-band SAR.
4. Conclusion
Large uncertainties regarding past and present 14C-depeleted methane contribution from natural sources still exist (Etiope and Schwietzke 2019, Dyonisius et al 2020, Hmiel et al 2020), making accurate prediction of the quantity of sub-permafrost methane release with future permafrost disintigration impossible. A new remote sensing tool to detect and monitor methane seeps in lakes would be a valuable asset to climate science.
The discovery of a large methane seep at NBL demonstrates that SAR remote sensing can detect large gas seeps in frozen lakes across a landscape. Although seeps were discernable in C-band SAR, L-band SAR showed more contrast between the seep and surrounding ice throughout the winter. High backscatter must appear perennially in L-band SAR to be considered a potential seep indicator: data acquired with a 39° incidence angle gave the best results. Other non-seep features such as cracks and ridges in lake ice return ephemeral high backscatter, but will not perennially appear in the same location: these features appear in different locations between years. Confirmation of a possible seep with optical/multispectral imagery is recommended, although seeps will not necessarily appear as holes in the ice when obscured by a thin layer of ice and snow. Remote sensing SAR and optical imagery cannot determine the chemical composition of a gas seep, but they can guide field work where samples can be collected for analyses.
Methane origin of the NBL seep was inconclusive. Ebullition magnitude, stable isotope values and the radiocarbon age of methane were consistent with a geologic (potentially thermogenic) source; however, the low methane concentration in the bubbles was atypical of other thermogenic seeps previously sampled in Alaskan lakes (Walter Anthony et al 2012) and more similar to the bubble geochemistry in another uniquely round shaped lake in the Brooks Range, Sithylemenkat Lake. Historic JERS-1 SAR data show that the seep has existed at least since 1992.
We show that seeps with different ice-bubble morphologies return different types of SAR polarimetric parameters as determined by two different polarimetric decompositions. This information could be useful for categorizing newly-discovered seeps based on the link between SAR scattering mechanisms and the physical and spatial presentation of known geologic methane seeps. Mapping and monitoring such seeps with remote sensing could also be used to provide thin-ice hazard maps for people traveling across frozen landscapes in winter and improving our understanding of natural geologic methane emissions to the atmosphere.
The new NASA-Indian Space Research Organization Synthetic Aperture Radar mission, planned to launch in 2024, will provide dual-pol L-band SAR data with more frequent revisit times than PALSAR and open data access that can detect large gas seeps in lakes to (1) target for field sampling and potential travel hazard, and (2) monitor for increase in size and number of naturally occurring seeps. Field sampling and analysis at sites located by SAR and confirmed with optical imagery will further our knowledge of the contribution of 14C-depleted methane to the atmosphere now and in the future.
Acknowledgments
The authors gratefully acknowledge the Alaska Satellite Facility (ASF) for providing SAR data and post-processing tools (MapReady), the Alaska Division of Geological and Geophysical Surveys for providing elevation data for SAR terrain correction, and the European Space Agency for providing Sentinel-1 data and post-processing tools (SNAP) as well as SAR polarimetric processing tools (PolSAR-Pro). For invaluable field measurements at North Blair Lake, we thank P Hanke, A Bondurant, P Anthony, A Anthony, J Anthony. We thank M T Aguirrezabala Cámpano for assistance in LGR gas chamber data processing. R Bursiel at Wright Air Service described observing the seeps, which he assumed were springs, during overflights. The authors thank Barrett Salisbury, geologist at the Alaska State Division of Geological and Geophysical Surveys for his expert insight on the Blair Lakes fault.
Data availability statement
All data that support the findings of this study are included within the article (and any supplementary files), or are publically available.
Funding source
This work was perfomed for the 'Characterizing Microtopographic Hot-spots and Landscape-scale Methane Emissions Across the ABoVE Domain', a Phase 2 project of NASA's Arctic-Boreal Vulnerability Experiment (ABoVE) awarded to the Jet Propulsion Laboratory, California Institute of Technology (80NM0018D0004) and the University of Alaska Fairbanks.
Supplementary Information Supplementary Methods, Results, and Discussion (<0.1 MB DOCX)
Supplementary Figures, Tables Supplementary Figures and Tables (1.6 MB DOCX)