

Abstract
Accurately capturing the impact of urban trees on temperature can help optimize urban heat mitigation strategies. Recently, there has been widespread use of remotely sensed land surface temperature (Ts) to quantify the cooling efficiency (CE) of urban trees. However, remotely sensed Ts reflects emitted radiation from the surface of an object seen from the point of view of the thermal sensor, which is not a good proxy for the air temperature (Ta) perceived by humans. The extent to which the CEs derived from Ts reflect the true experiences of urban residents is debatable. Therefore, this study systematically compared the Ts-based CE (CETs) with the Ta-based CE (CETa) in 392 European urban clusters. CETs and CETa were defined as the reductions in Ts and Ta, respectively, for every 1% increase in fractional tree cover (FTC). The results show that the increase in FTC has a substantial impact on reducing Ts and Ta in most cities during daytime. However, at night, the response of Ts and Ta to increased FTC appears to be much weaker and ambiguous. On average, for European cities, daytime CETs reaches 0.075 °C %−1, which is significantly higher (by an order of magnitude) than the corresponding CETa of 0.006 °C %−1. In contrast, the average nighttime CETs and CETa for European cities are similar, both approximating zero. Overall, urban trees can lower daytime temperatures, but the magnitude of their cooling effect is notably amplified when using remotely sensed Ts estimates compared to in situ Ta measurements, which is important to consider for accurately constraining public health benefits. Our findings provide critical insights into the realistic efficiencies of alleviating urban heat through tree planting.
Export citation and abstract BibTeX RIS

Original content from this work may be used under the terms of the Creative Commons Attribution 4.0 license. Any further distribution of this work must maintain attribution to the author(s) and the title of the work, journal citation and DOI.
1. Introduction
The process of urbanization, marked by changes in land cover and the release of anthropogenic heat emissions, typically results in elevated temperatures within urban areas, giving rise to the phenomenon known as the urban heat island (UHI) effect (Kalnay and Cai 2003, Grimm et al 2008, Zhang et al 2022b). This additional urban warming can have negative impacts on various aspects of urban environments, including the vegetation growth, the hydrological cycle, and the soil quality (Zhou et al 2018, Gui et al 2019, Zou et al 2021). Moreover, urban heat can pose a risk to the well-being of urban residents, influencing their indoor and outdoor thermal comfort and even leading to added mortality (Zhou et al 2018, Iungman et al 2023, Ren et al 2023). Therefore, urban heat and strategies for its mitigation have garnered increased attention in recent years (Yao et al 2018, Zhou et al 2018, Hsu et al 2021, Tuholske et al 2021, Chakraborty et al 2022c, Liu et al 2023, Schneider et al 2023, Yang et al 2023). Increasing vegetation cover, particularly through tree planting, is a feasible and commonly proposed approach for alleviating urban heat (Schwaab et al 2021, Iungman et al 2023, Zhang et al 2023). Trees outperform other vegetation in terms of evapotranspiration and shading, making them effective in reducing local temperatures (Zhou et al 2017, Liu et al 2021, Zhang et al 2023). Consequently, the study of the cooling effect (CE) of trees is a prominent and actively researched topic in the field of urban climate.
Traditionally, the cooling efficiency of trees is quantified by directly comparing the air temperature (Ta) between areas with and without trees using in situ measurements (Akbari et al 1990, Richards et al 2020, Yan et al 2020, Zhang et al 2020). Such approach offers the advantage of continuous, long-term observations and yields results that align closely with human perception (Goldblatt et al 2021). However, in situ measurements of the thermal environment (e.g. weather stations or mobile transects) are usually characterized by spatial discontinuities and limited coverage, making them too costly for extensive large-scale analyses (Peters et al 2010, Loughner et al 2012, Wang et al 2012, 2018, Jiao et al 2017, Richards et al 2020, Wujeska-Klause and Pfautsch 2020, Yan et al 2020, Zhang et al 2020, Meili et al 2021). With the proliferation of satellite observations, remotely sensed land surface temperature (Ts) has been often used for quantifying the CE of urban trees due to its advantages of spatial continuity (Wang et al 2019, 2020, Yang et al 2022). Nevertheless, it is crucial to acknowledge that a distinction exists between remotely sensed Ts observations and in situ Ta measurements (Jin and Dickinson 2010, Jin 2012, Zhang et al 2014, Chakraborty et al 2017, Janatian et al 2017, Goldblatt et al 2021, Venter et al 2021, Naserikia et al 2023).
The differences between Ts and Ta are primarily evident in two aspects. Firstly, Ts and Ta vary in magnitude and spatial distributions, originating from factors like radiation, heat transfer, and storage processes (Mutiibwa et al 2015, Cao et al 2021). Solar radiation absorbed by surface materials with high emissivity results in a significant increase in surface temperature, whereas air, with its lower emissivity, is less efficient at absorbing and radiating energy (Harde 2013, Li et al 2013). Heat transfer via conduction and convection contributes to temperature interaction, but the efficiency of this process is limited by air's low thermal conductivity (Zhou et al 2012, Lu et al 2014). The higher thermal capacity of surface materials enables them to absorb more heat during the day compared to air, thereby amplifying temperature discrepancies between the surface and the surrounding air (Mohajerani et al 2017). Secondly, Ts and Ta represent different components of the environment, with distinct impacts on human comfort. Ts is typically not directly experienced by urban pedestrians since we do not come into direct contact with the surfaces using our bare skin (Goldblatt et al 2021, Haeri et al 2023). Moreover, Ts measurements often relate to elevated locations like rooftops, walls, and the top of tree canopies, areas not frequented by humans for daily activities (Vanos et al 2016, Battisti et al 2018, Haeri et al 2023). As a result, the CE of trees derived through Ts may not appropriately capture the public health impacts on urban inhabitants, which are typically more aligned with the Ta perceived by humans (Novick and Katul 2020, Chakraborty et al 2022c).
Although multiple numerical modeling studies have estimated the CE of urban trees (Krayenhoff et al 2021), observational estimates are much rarer (Ziter et al 2019, Chakraborty et al 2022c), partly due to the dearth of dense Ta measurements within cities (Zaitchik and Tuholske 2021). As a result, many researchers have quantified the CE of urban trees using remotely sensed Ts observations and considered the slope of Ts versus tree cover fraction to quantify CE (Wang et al 2019, 2020, Chinchilla et al 2021, Schwaab et al 2021, Zhou et al 2021, Chakraborty et al 2022a, Zhao et al 2023a). Since Ts and Ta are different, we would also expect substantial differences in Ta-based CE (CET a) and Ts-based CE (CET s). Knowledge about how CET s deviates from CET a is critical for gaining a more physiologically-relevant understanding of the role played by trees in shaping the urban thermal environment. However, there is still a lack of large-scale and quantitative assessments of the relationship and difference between CET s and CET a. The study by Chakraborty et al (2022a) is the only relevant one, but it utilizes a vegetation index instead of tree cover fraction, with the two being not directly comparable (Zeng et al 2023).
Hence, by using spatiotemporally matched in situ Ta and remotely sensed Ts datasets, we calculated CET a and CET s, respectively, in 392 European urban clusters. Subsequently, we conducted a comparative analysis of the differences between CET a and CET s in terms of spatial distribution and day-night contrast. The results of this study can deepen our understanding of the cooling benefits of urban trees and help inform heat stress mitigation strategies.
2. Data and methods
2.1. Data selection and processing
The fractional tree cover (FTC) was obtained from the Copernicus Global Land Service (CGLS) dataset (2019). Based on over 20 000 random samples, Buchhorn et al (2020) reported that the CGLS dataset had an overall accuracy of better than 80% for all land-cover types and a global average absolute error of 9% for the FTC (Buchhorn et al 2020). The surface water was derived from the global surface water data produced by the Joint Research Centre (Pekel et al 2016), which provides annual maximum surface water extents. Surface elevation information was obtained from Global 30 Arc-Second Elevation (GTOPO30) dataset.
The growing popularity of Citizen Weather Stations (CWSs) in urban areas in recent years has facilitated the crowdsourcing of intensive meteorological observations. Venter et al (2021) obtained hourly Ta data for July 2019 from all available CWS provided by Netatmo in Europe (Chakraborty et al 2022b). The CWS Ta data underwent additional cleaning processing to remove stations with poor data quality or significant missing data (Venter et al 2021). This led to the final selection of 75 293 CWS stations, distributed across 931 European urban clusters. The boundaries of urban clusters were derived from the Global Human Settlement Layer dataset using the clustering method proposed by Venter et al (2021).
Daily Ts data for the European urban clusters during July 2019 were collected from the MODIS products (MOD11A1 and MYD11A1). These Ts data were preprocessed into clear-sky pixels with an average Ts error less than or equal to 3 K. MODIS satellites collected data every day around 1:30, 10:30, 13:30, and 22:30 local time to provide daytime and nighttime Ts observations. To obtain the hour-by-hour Ts values, the MODIS transit time from local solar time was converted to UTC local time by subtracting the longitude of the MODIS grid and dividing by 15, according to the MODIS user guide (Wan 2006). The time zones of each urban cluster were then accounted for and combined with daylight saving time to offset the UTC of each city. This resulted in Ts readings with specific hourly timestamps that could be synchronized with the hourly CWS dataset (Venter et al 2021, Chakraborty et al 2022b).
The Ts pixels were paired with the treated CWS Ta stations based on coordinates and time (Chakraborty et al 2022c). Subsequently, we calculated the median values of Ts and Ta at each station for the study period separately. We chose the median rather than the mean to avoid the effects of extreme temperatures. Then, we extracted information about tree cover fraction, elevation, and the presence of surface water for each station. In each urban clusters, we removed stations covered by surface water or influenced by topographic relief (out of the range of mean elevation ± 100 m) (Cao et al 2016, Li et al 2022). In addition, we removed urban clusters with too few stations (<20) to ensure the stability of the regression model for calculating the CE of urban trees. The above processes reduced the number of available stations to 40 364. Ultimately, a total of 392 urban clusters were included in this study (figure 1). It should be emphasized that the MOD11A1 Ts had data gaps during nighttime due to cloud contamination and quality degradation, resulting in an insufficient number of observations (<20) in some urban clusters. Therefore, we calculated the CE corresponding to the MOD11A1 nighttime Ts (∼22:30) only for the 232 urban clusters (figure 2).
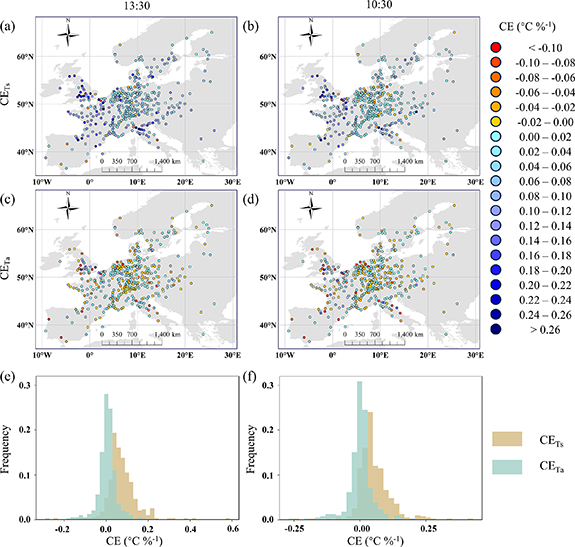
Figure 1. Spatial patterns and frequency distributions of the daytime cooling efficiency (CE) of urban trees across European urban clusters. CET s and CET a represent the CE estimated from surface temperature and the CE estimated from air temperature, respectively. The observational times are ∼13:30 for AQUA and ∼10:30 for TERRA, respectively. The air temperature corresponds to overpassing time of the overlaying MODIS pixels.
Download figure:
Standard image High-resolution image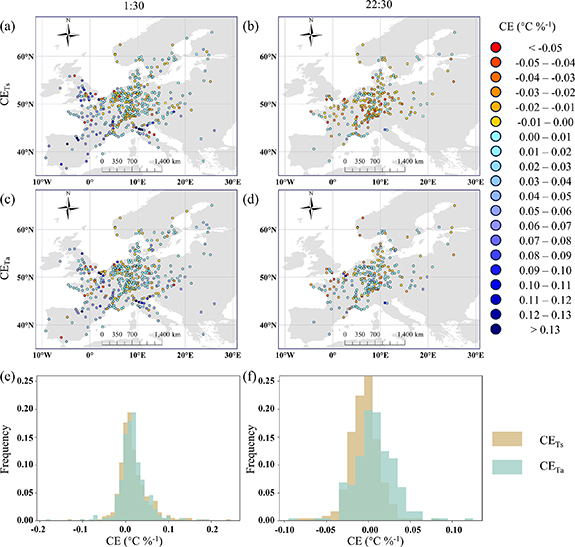
Figure 2. Spatial patterns and frequency distributions of the nighttime cooling efficiency (CE) of urban trees across European urban clusters. CET s and CET a represent the CE estimated from surface temperature and the CE estimated from air temperature, respectively. The observational times are ∼1:30 for AQUA and ∼22:30 for TERRA, respectively. The air temperature corresponds to overpassing time of the overlaying MODIS pixels.
Download figure:
Standard image High-resolution image2.2. Calculation of cooling efficiency of urban trees
In this study, we employed a univariate linear regression model to calculate the CET s and CET a for each urban cluster. In this model, we considered FTC as the independent variable, and either Ts or Ta as the dependent variable. We computed the regression coefficients and used the opposite of these coefficients as the CE of urban trees, denoted as CET s = −△Ts/△FTC and CET a = −△Ta/△FTC. CET s and CET a represent the reduction in Ts and Ta, respectively, for each 1% increase in the percentage of urban trees, and measure the CE of urban trees with respect to Ts and Ta (Wang et al 2019, 2020, Cheng et al 2022, Yang et al 2022). If CET s is higher than CET a, it suggests a higher estimated CE of urban trees based on Ts compared to Ta, and vice versa.
3. Results
During daytime, both CET s and CET a show positive values in most urban clusters, indicating the prevailing cooling effect exerted by urban trees on local temperatures (figure 1). Statistically, over 90% urban clusters exhibit positive daytime CET s, whereas the corresponding percentage for daytime CET a stands at approximately 60% (figure 1). Besides, higher values of CET s and CET a are mostly concentrated in western Europe and south-central Europe. On average for all urban clusters, CET s reaches 0.075 [0.069, 0.082] °C %−1 (95% confidence intervals in parentheses, hereafter) and 0.055 [0.049, 0.061] °C %−1 at local times ∼13:30 and ∼10:30, respectively (figure 3). These mean values of CET s are significantly (p < 0.001, t-test) higher than corresponding averages of CET a, which are 0.006 [0.001, 0.010] °C %−1 and 0.003 [−0.001, 0.008] °C %−1, respectively (figure 3). These results indicate that the daytime CE of urban trees quantified from Ts differs from that estimated from Ta, which is further supported by the weak correlation between CET s and CET a across all urban clusters (figure 4).
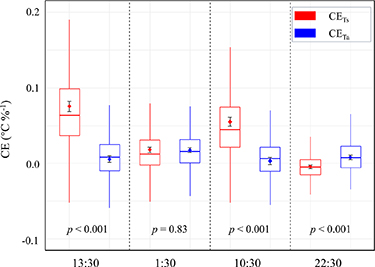
Figure 3. Comparisons of the cooling efficiencies of urban trees estimated from surface temperature (CET s) with that estimated from air temperature (CET a). The p-values are from significance t-tests between CET s and CET a. If the p-value is less than 0.05, it is considered a statistically significant difference between CET s and CET a. The lines and dots in the boxes represent median and mean values of trees' cooling efficiency, respectively. The error bars indicate 95% confidence intervals. The observational times are ∼13:30 and ∼1:30 for AQUA, and ∼10:30 and ∼22:30 for TERRA. The air temperature measurements corresponding to overlaying MODIS pixels are used for daytime and nighttime overpasses.
Download figure:
Standard image High-resolution image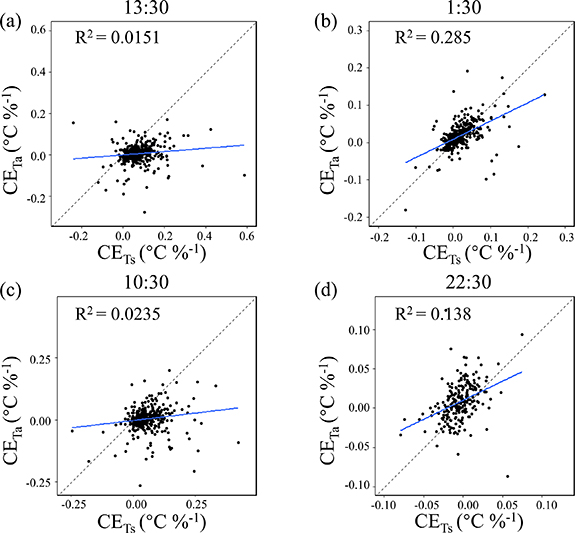
Figure 4. Correlations between the cooling efficiencies of urban trees estimated from surface temperature (CET s) and those estimated from air temperature (CET a). The observational times are ∼13:30 and∼1:30 for AQUA, and ∼10:30 and ∼22:30 for TERRA. The air temperature measurements corresponding to overlaying MODIS pixels are used for daytime and nighttime overpasses.
Download figure:
Standard image High-resolution imageAt night, CET a is found to be positive in over 70% urban clusters, while CET s does not exhibit a fixed positive or negative tendency (figure 2). In addition, higher values of CET s and CET a are concentrated in western Europe and south-central Europe. On average for all urban clusters, CET s reaches 0.018 [0.015, 0.022] °C %−1 and −0.004 [−0.007, −0.002] °C %−1 at local times ∼13:30 and ∼10:30, respectively (figure 3). The mean values of these CET s did not differ significantly from the corresponding averages for CET a, which are 0.018 [0.014, 0.021] °C %−1 and 0.008 [0.005, 0.011] °C %−1, respectively (figure 3). These results indicate that the nighttime CE of urban trees quantified using Ts has a higher similarity to that estimated from Ta compared to the daytime results. This finding is further supported by the observation that the distribution of CET s and CET a aligns more closely with the 1:1 line during nighttime than during daytime (figure 4).
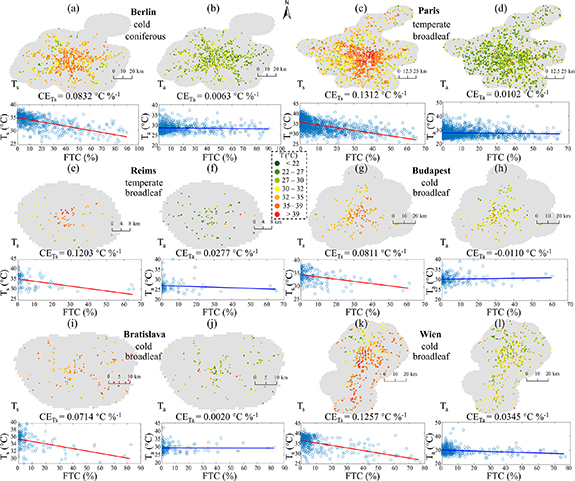
To provide a more intuitive representation of the difference between CET s and CET a, we selected six prototypical urban clusters (Berlin, Paris, Reims Budapest, Bratislava, and Wien) with different climates, tree species, and city sizes for closer examination (figure 5). It can be seen that both daytime Ts and Ta show almost a consistent decreasing trend with increasing FTC, suggesting that trees can play a role in reducing urban localized temperatures. However, Ts typically exhibits a greater range of spatial variability relative to Ta, and the extent of temperature change triggered by an equivalent percentage increase in FTC is more pronounced for Ts compared to Ta. This discrepancy in the response of Ts and Ta to increased FTC ultimately leads to the observed difference between CET s and CET a.
Figure 5. Changes of daytime surface temperature (Ts) and air temperature (Ta) along fractional tree cover (FTC) gradients, taking Berlin, Paris, Reims Budapest, Bratislava, and Wien as examples. These urban clusters are situated in various climate zones, including temperate and cold zones, and feature different dominant tree species, such as coniferous and broadleaf trees.
Download figure:
Standard image High-resolution image
4. Discussion
4.1. Spatiotemporal difference in the cooling efficiencies estimated from Ts and Ta
The findings suggest a noticeable CE of urban trees during daytime, and the impact of trees on reducing Ts is found to be substantially more than that on Ta. Trees release water vapor through small pores called stomata in their leaves, also known as transpiration (Pirasteh‐Anosheh et al 2016). As this water evaporates, it absorbs heat from the surroundings, lowering the temperature of the surface, which in turn impacts the near surface (Gunawardena et al 2017). Evapotranspiration occurs in the immediate vicinity of the ground, where trees draw up water from the soil and release water vapor through stomata in their leaves (Berry et al 2010). This close proximity to the surface means that the CE is more directly felt at ground level (Armson et al 2012). While water vapor released through evapotranspiration does influence Ta, the impact is somewhat diluted as it mixes with the larger volume of the atmosphere (Gunawardena et al 2017). Therefore, the CE for Ta is not as concentrated as it is at the surface. Second, trees provide shade by blocking sunlight from reaching the ground, which reduces the amount of solar radiation absorbed by the Earth's surface, leading to a substantial CE (Coutts et al 2016). On the other hand, Ta is influenced by a variety of factors, including the absorption of solar radiation by the atmosphere, conduction, convection, and radiation (Raman et al 2014). While shading by trees can have some influence on the Ta by reducing the amount of solar radiation reaching the ground, the atmosphere itself is less directly affected by shading compared to the surface (Rahman et al 2017). Therefore, the shade provided by trees has a more direct impact on the Ts than on the Ta. However, we should note here that the Ts underneath the tree can be markedly different from the Ts measured by satellites, whose view of the ground can be partially blocked by those trees. Third, trees play a pivotal role in creating microclimates by regulating soil moisture in their immediate surroundings (Pramova et al 2012). Adequate soil moisture contributes to a cooler surface, and the impact of soil moisture regulation is particularly significant at the surface level, where trees interact with the ground (Lagergren and Lindroth 2002). In summary, the creation of microclimates by trees involves a combination of factors, including the evapotranspiration process, soil moisture control, and shade provision. While these factors also influence Ta, their immediate and more pronounced effects are often observed at the surface level where the vegetation interacts intimately with the ground.
However, the CE of urban trees on nighttime temperatures is very limited in most cities. During the night, in the absence of sunlight for photosynthesis, trees generally close their stomata (Domec et al 2012). As a consequence of stomatal closure, metabolic activities in the leaves, including transpiration, slow down or cease (Dawson et al 2007). This reduction in transpiration leads to a notable decrease in the CE facilitated by this process (Zheng et al 2021). In addition, trees, especially deciduous ones, typically have a lower albedo, which results in more energy absorption during the day (Hami et al 2019). The additional absorbed energy is then released at night, thereby offsetting the cooling benefits that trees typically provide (Peng et al 2014, Li et al 2015). Furthermore, in urban environments, tall and dense trees can influence the dissipation of heat from various structures. The obstruction of airflow may contribute to heat retention in certain areas, especially during calm nights (Cleugh 1998, Zhao et al 2023b). The factors mentioned above, to some extent, offer a plausible explanation for the reduced CE of trees at night. This also underscores the complex interplay of various factors in shaping the overall thermal behavior of urban environments influenced by tree cover.
We have identified notable variations in the CE of urban trees across different cities. Firstly, the daytime CE is found to be higher in western Europe compared to central Europe (figure 1). This difference may be attributed to variations in tree species. Western Europe is dominated by oaks from broadleaf forests (https://inventaire-forestier.ign.fr/spip.php?rubrique86), while central Europe is dominated by spruce and pine from coniferous forests (Holzwarth et al 2020). Characteristics of urban trees, such as leaf structure, color, size, and density, directly influence their effects on the surrounding environment and the observed CE (Liu et al 2019, Wang et al 2021). Secondly, a relatively higher CE is also observed in south-central Europe, characterized by a hotter and drier environment. This may be attributed to the nonlinear physiological response of urban trees to meteorological conditions, which generally manifests itself as an increase in evapotranspiration rates with increasing temperature and decreasing humidity (Wang et al 2019, 2020, Yang et al 2022). Besides, the role of urban trees in moderating temperature is also influenced by their spatial configurations, with densely and continuously distributed trees tending to provide more cooling benefits (Zhou et al 2017, Fan et al 2019). This may provide a plausible explanation for the significantly higher CE in some well-greened cities, such as Ludenscheid and Sodertalje (figure 1).
4.2. Significance and implications
This study finds that the estimated daytime CE of urban trees, based on Ta, is much lower than that based on Ts, which is in line with field-level estimates for general afforestation (Novick and Katul 2020) and multi-city estimates based on vegetation index (Chakraborty et al 2022c). Many recent multi-city studies have primarily utilized Ts instead of Ta to assess the cooling efficiency of trees (Wang et al 2019, 2020, Chinchilla et al 2021, Schwaab et al 2021, Zhou et al 2021, Cheng et al 2022, Chakraborty et al 2022a, Zhao et al 2023a). However, Ta is more closely related to temperatures perceived by humans than Ts. Hence, the current Ts-based CE might inflate the cooling effectiveness of tree planting and thus overestimate their public health benefits. This could potentially foster an excessively optimistic perspective regarding the cooling advantages associated with urban trees (Venter et al 2021, Chakraborty et al 2022c, Wang et al 2023a). It should be noted that increased FTC seems to be associated with a more efficient cooling of temperatures in western and south-central Europe. Therefore, emphasizing the increase of tree cover in these regions could be crucial for mitigating the adverse effects of high temperatures on human well-being. However, overall, it appears that the increase in tree cover in most parts of Europe is not significantly associated with a reduction in Ta. Particularly at night, there is even evidence of a warming effect of tree cover in some cities. Consequently, relying solely on increasing tree cover may not be sufficient for alleviating urban heat stress, and a more comprehensive approach may be necessary. Policymakers should consider implementing additional measures to effectively address urban heat. Feasible practical measures may involve enhancing surface albedo through the adoption of lighter roofing and paving materials, along with reducing human-generated heat emissions through promoting energy-saving lifestyles (Hayes et al 2022).
While we focus on urban vegetation impacts on Ta and Ts in the present study, there are other aspects of heat exposure within cities that should be kept in mind. Of note, urban trees can also increase humidity through transpiration (Meili et al 2020), which, in turn, can increase moist heat stress, all else remaining equal (Ho et al 2016, Chakraborty et al 2022c). While Ts should not directly be used as a proxy for heat stress, Ts has been successfully used as input to data-driven models to estimate urban Ta (Venter et al 2020, Zhang et al 2022a) and even humidity (Wang et al 2023b). Trees can also provide shading, which during midday, can have a dominant impact on reducing overall heat loading (Middel et al 2021). However, Ta is only indirectly related to shading and satellites cannot sufficiently resolve shading from trees since they are primarily observing the top of the tree canopy. A recent study (Li et al 2023) over Philadelphia, USA estimated mean radiant temperature (Tmrt), a metric for thermal discomfort that also accounts for radiant heat, and found that satellite-derived Ts showed medium associations with Tmrt. A future direction may be to examine quantitative differences and similarities between the CE for Ts and Tmrt.
4.3. Limitations and future studies
The present study has certain limitations that should be kept in mind. First, it is important to note that the study area is limited to Europe, and therefore our findings cannot be generalized to other climate zones globally. Second, this study only considers data from the summer month of July, overlooking seasonal variations in vegetation activity, which are temperature-dependent. It is crucial to conduct in-depth investigations into the similarities and differences in CE quantified using Ts and Ta for other seasons to capture the full spectrum of potential variations. Third, there is a discrepancy in the spatial continuity and scale between satellite Ts observations and in situ Ta measurements, and a more detailed analysis considering variations at different spatial scales could provide additional insights. Fourth, there are sampling biases in the CWS data which are difficult to correct for. The most prominent bias is that CWS are typically placed in residential areas, rather than in commercial districts, which tend to experience higher temperatures (as indicated by Ts) (Hulley et al 2019, Chakraborty et al 2022c). This means that when utilizing CWS data, we might systematically overlook non-residential areas where pedestrians could still face higher-than-expected heat stress. To ensure the accurate utilization of CWS in urban research, it is essential to improve the metadata for the sensor locations. Furthermore, there is a pressing need for more robust quality control measures. To address the aforementioned limitations, future investigations should incorporate large-scale, multi-seasonal and multi-scale analyses from multiple data sources, to support more robust constrains on the physiologically-relevant cooling efficiency of urban trees.
Acknowledgments
This research was supported by the Postdoctoral Science Foundation of China (2021TQ0245 and 2021M702470), and the National Natural Science Foundation of China (42201389 and 42201377). T.C.'s contribution was supported by the U.S. Department of Energy (DOE), Office of Science, Biological and Environmental Research program through the Early Career Research Program. Pacific Northwest National Laboratory is operated for DOE by Battelle Memorial Institute under contract DE-AC05-76RL01830.
Data availability statements
The data that support the findings of this study are openly available. The CWS air temperature measurements and corresponding MODIS land surface temperature observations are available at https://github.com/TC25/Europe_CWS. The CGLS fractional tree cover data can be downloaded from https://zenodo.org/records/3939050. The JCR global surface water data can be accessed from https://global-surface-water.appspot.com/download. The Global 30 Arc-Second Elevation data is available from www.usgs.gov/centers/eros/science/usgs-eros-archive-digital-elevation-global-30-arc-second-elevation-gtopo30.