

Abstract
The decadal-scale global-mean surface temperature (GMST) trend fluctuates between rapid-warming, slow-warming and cooling under the combined action of external forcing (EX) and internal variability. However, the principal contributors to the time-varying trends of GMST across decadal scales in current and future climates remain elusive. Here, by leveraging observations and initial-condition large ensembles, we unravel that historical GMST trend fluctuations are predominantly driven by EX on timescales exceeding ∼9 years within the current climate, with anthropogenic and volcanic aerosols being the primary drivers. However, in the warming climate, the significant contribution of EX on decadal scales is projected to decrease. This is primarily due to anthropogenic aerosol mitigation efforts and the absence of unpredictable volcanism. Despite the continuous increase in greenhouse gases, these factors are expected to delay the emergence of EX-dominance to ∼14-year timescale. Our results quantitatively underscore the pivotal role of the EX in modulating GMST trend fluctuations and its potential weakening at decadal scales in the warming climate, indicating that predicting near-term changes in GMST may become less certain in the future.
Export citation and abstract BibTeX RIS

Original content from this work may be used under the terms of the Creative Commons Attribution 4.0 license. Any further distribution of this work must maintain attribution to the author(s) and the title of the work, journal citation and DOI.
1. Introduction
In the context of global warming, will climate keep getting warmer in the coming decades? The answer is not a straightforward one. In reality, substantial fluctuations overlay the long-term warming trajectory, collectively leading to global-mean surface temperature (GMST) trend fluctuating between periods of slow warming, rapid warming and cooling, as evidenced by instances of extreme warming and hiatus events (Kosaka and Xie 2013, Trenberth and Fasullo 2013, Fyfe et al 2016, Kosaka and Xie 2016, von Känel et al 2017). Such trend fluctuations arise from the joint effects of external forcing (EX) and internal variability (IV) particularly on decadal scales, such as the early 2000s warming slowdown as a consequence of internal climate dynamics interwoven with aerosol-driven adjustments (Meehl et al 2013, Huber and Knutti 2014, Boo et al 2015, Takahashi and Watanabe 2016, Hua et al 2018, Mann et al 2020). Fluctuations in GMST trends shape the uncertainty of near-term climate change and influence the likelihood of unprecedented climate events, which are informative for climate adaptation policies (Cane 2010, Goddard 2016). Therefore, a comprehensive understanding of EX and IV contributions to GMST trend fluctuations across varying timescales is of paramount importance, yet it remains elusive.
Recent studies emphasize that EX significantly affects decadal variations in the GMST, with minimal influence from unforced IV since the twentieth century (Dong and McPhaden 2017, Dong et al 2014, Haustein et al 2019, Rashid 2021, Smith et al 2016). In addition to the accelerated warming effects of greenhouse gases (GHGs), volcanic and anthropogenic aerosols play key roles in the decadal modulation of GMST trends. Volcanic eruptions causing abrupt temperature drops have contributed to a large fraction of the decadal-scale variance in GMST since 1950 (Liguori et al 2020). Anthropogenic aerosols (AAs) modulate GMST decadal variations through radiative effects and circulation adjustments (Levy et al 2013, He et al 2023). Notably, AAs have significantly contributed to the Atlantic Multidecadal Variability since the late nineteenth century via aerosol-cloud microphysical interactions (Booth et al 2012, Qin et al 2020). Furthermore, massive AAs from Asia drive negative Interdecadal Pacific Oscillation by influencing the Aleutian Low, impacting GMST decadal trends (Xie et al 2013, Wang et al 2016). Under a changing climate, whether the decadal modulation by EX on GMST trend variations is invariant remains uncertain. Furthermore, the EX-driven signals possess higher potential predictability than stochastic IV (Boer 2009, 2011, Kushnir et al 2019). Given that, it is crucial to determine the timescale at which EX-driven signals begin to emerge out of IV and dominate GMST trend fluctuations, which is referred to as emergence timescale here. This signifies the threshold beyond which GMST trend fluctuations attain enhanced predictability and underlines the primacy of external forcing in guiding near-term climate changes, offering valuable insight for climate strategies.
In this study, by utilizing initial-perturbation large ensembles and a novel pattern recognition method to distinguish the externally-forced signals, we provide a robust quantification of the relative contributions of EX and IV to GMST trend fluctuations across varying decadal scales, and further identify the emergence timescale under current and future climates. Our results reveal a significant role of anthropogenic and volcanic aerosols in modulating GMST trend fluctuations. This modulation would largely be suppressed on decadal scales in a warming climate, indicating that decadal GMST prediction may become more challenging.
2. Data and methods
2.1. Large ensemble models and observations
We analyze the surface temperature variable (blended air and sea surface temperatures) to investigate the time-varying trends of GMST. We utilize eight large ensemble models participating in CMIP5 and CMIP6. Each model has more than 30 members, namely CESM1-CAM5, MPI-ESM-LR, CanESM2, GFDL-ESM2M, and CSIRO-Mk3.6 in CMIP5, and ACCESS-ESM1-5, MIROC6, and CanESM5 in CMIP6 (table S1 in supporting information S1). All members of each large ensemble model share the same radiative forcing but slightly differ in initial conditions. The research period encompasses 1950–2080, including historical simulations and future projections under a high-emission scenario (RCP8.5 in CMIP5 and SSP5-8.5 in CMIP6), with the SSP3-7.0 and SSP2-4.5 scenarios included for comparative purposes.
We assess individual anthropogenic forcings based on CESM1 'all-but-one-forcing' initial-condition large ensembles (Deser et al 2020), which retain the CESM1 all-forcing large ensemble protocol except for fixing one forcing agent at 1920 conditions, including fixed greenhouse gas (XGHG, 20 members, 1950–2080), fixed industrial aerosol (XAERindus, 20 members, 1950–2080), fixed biomass-burning aerosol (XAERbmb, 15 members, 1950–2029) and fixed land use/land cover (XLULC, 5 members, 1950–2029) simulations. Given that AERbmb in RCP8.5 does not change appreciably after 2030, we combine AERindus and AERbmb as the overall AA effects.
Four observational surface temperature datasets are employed: NOAAGlobalTemp5 combines ERSST v5 and GHCN-M v4 (Huang et al 2020); HadCRUT5 combines HadSST4 and CRUTEM5 (Morice et al 2021); GISTEMP v4 combines ERSST v5 and GHCN v4 (Hansen et al 2010, Lenssen et al 2019, GISTEMP Team 2022); and BEST combines HadSST4 and the Berkeley Earth land temperature product (Rohde and Hausfather 2020).
2.2. Extracting EX-driven signals in large ensemble models
A novel pattern recognition method called 'signal-to-noise-maximizing pattern filtering' (Wills et al
2020) is employed to distinguish EX-driven surface temperature signals from IV. This approach identifies spatial patterns maximizing the 'signal' variance, where 'signal' is the consistent temporal evolution agreed by ensemble members (regarded as EX), and 'noise' refers to random IV. The leading patterns with the highest signal-to-noise ratios (S/NPs) are identified using linear discriminant analysis. We truncate the number M of leading S/NPs through an empirical test to maximize the global-mean squared correlation between half-ensemble S/NP filtering and half-ensemble simple ensemble-average. The combination of leading M S/NPs constitutes the EX signal  , which is agreed upon by all members. Residual of each member is the corresponding IV signal
  . We believe that this method offers a refined tool for distinguishing EX signal with limited ensemble members and bolsters the capacity to extract EX signals while preserving spatiotemporal covariance. The details of the S/NP filtering method are provided in the supporting information S1.
The GHG/AERindus/AERbmb/LULC-forced surface temperature signals in CESM1 'all-but-one-forcing' initial-condition large ensembles are given by:
where  and
and  is obtained by S/NP filtering in the all-forcing and XGHG/XAERindus/XAERbmb/XLULC large ensembles, respectively. The combined effects of IV and GHG forcing in any individual member i of single-forcing simulation can be calculated as follows:

 is derived same as
  .
.
2.3. Extracting EX-driven signals in observation
Given that CESM1-Large Ensemble (CESM1-LE) exhibits the closest resemblance to observations (figure S1 in supporting information S1), we regress the observational surface temperature anomaly pattern on CESM1 leading S/NPs, obtaining the leading externally-forced temporal response in the observation. Interannual variabilities are removed using 10 year low-pass filtering prior to regression. Since the two leading S/NPs in CESM1 account for 99% variance of EX-driven signals with S/N ratios above 0.9, we synthesize the regressions of the first two S/NPs as the EX for observation. The IV in observation is derived by subtracting the EX-forced temporal evolution from the observational GMST.
We also use a low-frequency pattern filtering method to extract EX-driven signals in observation. This method is analogous to S/NP filtering but is applied to a single realization (Wills et al 2018). Here, the 'signal' is the slowest evolving pattern, typically reflecting the externally-forced component. We combine the two leading low-frequency patterns to generate EX-driven signals for observation.
2.4. GMST trend fluctuations and emergence timescale
This study focuses on the variations in GMST decadal trends (not the trend per se), encompassing accelerations of warming and cooling, and transitions between colder and warmer periods. Here, the GMST trend fluctuations across multiple decadal scales are estimated based on the running trend curves under varying sliding-window durations. For instance, by employing a 10-year window, we slide it forward yearly (1950–1959, 1951–1960 through 2071–2080) and fit the least-squares trend of annual-mean GMST within each segment. The resultant running-trend curve captures all trend fluctuations at a 10-year timescale, and its variation reflects changes in the rate of warming or cooling, such as an increase in positive values indicating an acceleration of surface warming. We quantify the amplitude of the 10-year GMST trend fluctuations by calculating the overall variance in the running trends curve. Computations are carried out for temporal windows ranging from 5 to 25 years.
The variance contribution of EX/IV are determined as the ratio of the EX-/IV-driven running trend curve variance to the total running trend curve variance. With the lengthening of the timescale (window), the variance contribution of EX increases. Emergence timescale is identified as the threshold timescale at which the variance contribution of EX is equivalent to that of IV. That is, exceeding the emergence timescale, a large fraction (>50%) of GMST trend fluctuations can be attributed to the externally-forced component, with the ratio of EX to IV is greater than 1. Given the detectability of externally-forced signals, the emergence timescale marks the threshold beyond which decadal GMST trends could be more detectable, which is informative for near-term climate predictability.
Here we compute the running trend curve for the entire period of 1950–2080 at each sliding-window length. Subsequently, we divided the curve into two epochs, 1950–2020 and 2021–2080, to identify the respective emergence timescales. This approach circumvents the concern of inadequate time sampling relative to the window length.
3. Results
In this study, we limit GMST to the near-global domain (70° S to 70° N) due to the lack of long-term reliable observations and uncertainties among models in polar regions (Masson-Delmotte et al 2021, Smith and Reynolds 1998). By evaluating the ability of large ensemble models to replicate the observational GMST during 1950–2020, we find that CESM1-LE exhibits the best performance with a high correlation and the lowest root mean square error with the four observations (figure S1 in supporting information S1). Hence, we predominantly present results derived from the CESM1-LE, supplemented with insights from other models.
The leading patterns and associated time series of EX-forced surface temperature signals in CESM1-LE are illustrated in figure S2 in supporting information S1. The first leading pattern (S/NP-1) denotes global warming driven by GHG, exhibiting a high spatial correlation of 0.99 with the pattern derived from the GHG single-forcing experiment and high consistency across the models (figure S3(a) in supporting information S1). The second pattern (S/NP-2) signifies the GMST trend transition driven by the shift in aerosol emission sources from America/Europe to South Asia (figure S4(a) in supporting information S1). The third pattern (S/NP-3) delineates the global synchronous variation driven by aerosol co-emissions (figure S4(b) in supporting information S1). Here the S/NP-2 and S/NP-3 are recognized as two typical modes of AA-forced responses (Kang et al 2021, Shi et al 2022, Wang and Wen 2022). They can be detected in the AERindus single-forcing experiment, exhibiting a consensus among models (figures S3(b) and (c) in supporting information S1). The fourth pattern (S/NP-4) implies an El Niño response to tropical volcanic forcing induced by the land-sea thermal contrast (Adams et al 2003, Ohba et al 2013, Chai et al 2020). Based on an empirical test, the first six leading S/NPs are truncated and synthesized as EX-driven signals (figures S2(i) and (j) in supporting information S1), with the residual representing IV.
3.1. Relative contributions of EX and IV to GMST trend fluctuations
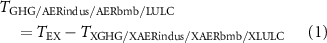
During 1950–2020, as timescale (window) lengthens, the variance of EX-driven GMST trend fluctuations exhibits a steady increase, whereas IV-driven GMST trend fluctuations gradually diminish (figure 1(a)), leading to progressive growth of variance contribution of EX to GMST trend fluctuations (figure 1(b)). For example, the corresponding 5-year running trend curves (figure 1(e)) show that GMST trend fluctuations at the 5-year timescale are primarily driven by IV-phase transitions, with a modest contribution of 29% from EX, largely reflecting the impact of three major volcanic eruptions during 1950–2020. However, when considering 10-year and 20-year GMST trend fluctuations (figures 1(f) and (g)), EX becomes more pronounced, with respective EX contributions increasing to 53% and 82% during 1950–2020. EX-driven trend variations are mainly reflected in the shift between warming acceleration and warming slowdown. An example is the declining running trend since around 2000 (figure 1(f)), reflective of the hiatus experienced in the 21st century.
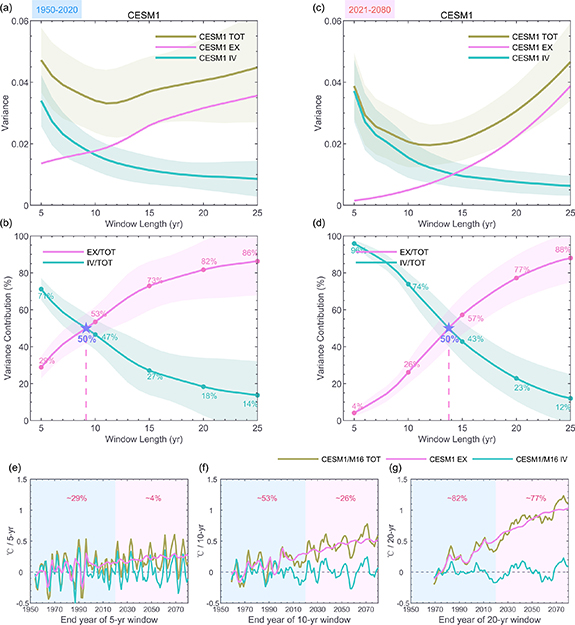
Figure 1. Relative contributions of EX and IV to GMST trend fluctuations in CESM1-LE. (a) Variance in GMST trend fluctuations (brown) across 5–25-year temporal windows during 1950–2020 and its decomposition into components driven by EX (pink) and IV (green), with unit in (°C/window-length)2. The thick curve denotes the ensemble average and shading denotes the one standard deviation ensemble spread envelope. (b) Variance contributions (%) of EX (pink) and IV (green) to GMST trend fluctuations across 5–25-year temporal windows during 1950–2020. The pentagram denotes emergence timescale. The shading envelope of EX contribution stems from uncertainties in total GMST trend fluctuations attributed to random IV. (c), (d) Same as (a), (b) but for 2021–2080 under RCP8.5 scenario. (e)–(g) GMST running trends curve and its EX and IV components at a 5-year (e), 10-year (f), 20-year (g) sliding-window, with EX variance contribution labeled. We display Member 16, chosen for its superior alignment with NOAAGlobalTemp5 GMST. The linear trend is scaled by window length (unit in °C/window-length).
Download figure:
Standard image High-resolution imageFor windows exceeding 9 years, i.e. the emergence timescale, more than half of historical GMST trend variations can be explained by EX (figure 1(b)). It implies that a temporal span of at least nine years is required to detect externally-forced signals with the potential for predictability under the current climate. This quantification offers implications for the intricate interplay between EX- and IV-driven processes. For instance, on a 10-year timescale, the contributions of IV and EX to GMST trend fluctuations appear to be comparable, reflecting the ongoing debate regarding the role of AAs (Boo et al 2015, Dittus et al 2021, Smith et al 2016) and internally-generated negative Interdecadal Pacific Oscillation (Kosaka and Xie 2013, England et al 2014, Meehl et al 2016) in the warming hiatus observed in the early 21st century. Our results suggest that both factors contribute approximately equally to the observed hiatus, collectively contributing to temporary stagnation against the backdrop of global warming.
In the warming climate during 2021–2080, the variance of IV-driven GMST trend fluctuations remains almost the same as that in 1950–2020, while EX-driven variance virtually decreases across decadal scales (comparing figures 1(c)–(a)). As shown in figures 1(e) and (f), EX-driven GMST running trend increases mostly monotonically during 2021–2080, with a reduced variance contribution from EX compared with 1950–2020. The reduced variance is attributed to the weakened short-term influences, such as lesser volcanic activities and AAs, which contributed to EX-driven variance significantly even amidst slower warming rates during 1950–2020 (see details in section 3.2). Consequently, the weakening of the EX-driven GMST trend fluctuations leads to prolonged emergence timescale of ∼14 years in the warming climate (figure 1(d), see details in section 3.3). This prolongation delays the onset of EX-dominance on GMST trend variations, statistically indicating that detecting anthropogenically-driven trend changes may require a longer temporal span in the future.
To verify the robustness of CESM1-derived results, we replicated the analysis with observations during 1950–2020. Due to the high degree of consistency from 1950 onward among the four observational datasets and fewer missing grid cells in NOAAGlobalTemp5 near the polar regions, we present results based on NOAAGlobalTemp5 (figure 2). Here the observed EX-driven signals are identified through regressions onto CESM1 leading S/NPs. As timescale lengthens, the variance of EX-driven GMST trend fluctuations increases (figure 2(a)), with an emergence timescale of 8.8 years during 1950–2020 (figure 2(b)), which demonstrates a high consistency with CESM1. To ensure cross-methodological robustness, we employed an alternative approach—the low-frequency pattern filtering—applied to NOAAGlobalTEMP5 (figure S5 in supporting information S1). This approach extracts the observed EX-driven signals by directly isolating the lowest-frequency components from the observational data, corroborating a consistent emergence timescale around 9 years historically. Additionally, the historical emergence timescale exhibits significant alignment across four observational datasets (figure S6 in supporting information S1), further reinforcing the credibility of CESM1.

Figure 2. Relative contributions of EX and IV to GMST trend fluctuations in NOAAGlobalTemp5. (a), (b) As in figures 1(a) and (b) but for NOAAGlobalTemp5. The variance of GMST trend fluctuations in HadCRUT5, GISTEMP v4 and BEST are also shown in (a) with dotted lines.
Download figure:
Standard image High-resolution image3.2. Contributions of anthropogenic forcings
Anthropogenic forcings, as pivotal sources of near-term climate prediction (Kushnir et al 2019), profoundly modulates GMST trend fluctuations. Using CESM1 'all-but-one-forcing' initial-condition large ensembles, we find that AAs consisting of AERindus (industrial aerosols) and AERbmb (biomass-burning aerosols) are accountable for a large fraction (32%–50%) of EX-driven GMST trend fluctuations on timescales of 10–25 years during 1950–2020 (blue lines in figure 3(a)), with AERindus making the primary contribution. Contrastingly, GHGs only exert a modest impact during 1950–2020 on the GMST trend fluctuations (orange line in figure 3(a)). The residual derived from the removal of all anthropogenic forcing agents from total EX primarily represents the volcanic forcing, as evidenced by a significant correlation with the CESM1 volcanic-forcing-only simulation archived in CMIP5 (r = 0.785, p < 0.01, figure S7 in supporting information S1). Accordingly, the volcanic forcing is likely the primary driver of sub-decadal variations in GMST trends (green line in figure 3(a)). Under the high-emission scenario, the dominant driver will shift to GHG, whereas the influence of AA decreases (figure 3(b)).
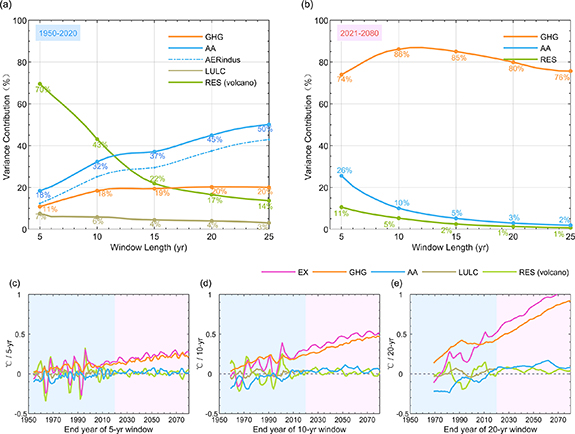
Figure 3. Contributions of anthropogenic forcings to externally-forced GMST trend fluctuations. (a) Variance contributions (%) of greenhouse gas (GHG, orange), anthropogenic aerosol (AA, blue) and its industrial aerosol component (AERindus, dashed blue), land use/land cover (LULC, brown) and residual (RES, green) to externally-forced GMST trend fluctuations across 5–25-year temporal windows during 1950–2020. (b) Same as (a) but for 2021–2080 under RCP8.5 scenario. (c)–(e) The GMST running trends at a 5-year (c), 10-year (d), 20-year (e) sliding-window.
Download figure:
Standard image High-resolution imageDuring 1950–2020, explosive volcanic eruptions prompt rapid cooling via stratospheric aerosols, with a recovery period of approximately a decade, thus playing a prominent role in GMST trend fluctuations on timescales below 10 years, as depicted by the three spikes in GMST trend fluctuations (figures 3(c) and (d)). AAs, characterized by temporal trajectories and geographic distributions, impact GMST trend fluctuations through direct (absorbing and scattering radiation) and indirect (aerosol-cloud feedback) effects on shortwave radiation. AAs also drive decadal and multi-decadal trend variations through large-scale circulations, exemplified by Interdecadal Pacific Oscillation linked to the Aleutian Low (Dittus et al 2021) and Atlantic Multidecadal Variability linked to aerosol-cloud interaction (Booth et al 2012), further contributing to GMST trend fluctuations (figures 3(d) and (e)). In the warming climate during 2021–2080, GHG emerges as the dominant driver, while AA-driven trend fluctuations move toward stability (figures 3(d) and (e)). This stabilization arises from the implementation of clean air policies in early industrialized countries since the 1970s and contemporary AA mitigation efforts in newly industrialized countries. Consequently, EX-driven GMST trend fluctuations are primarily manifested as nearly monotonic upward trends driven by GHG. As the impact of GHGs on GMST trend fluctuations becomes increasingly prominent in the future, the risk of extreme warming events is likely to intensify, even on decadal scales, underscoring the urgency of implementing climate mitigation strategies that target GHGs.
3.3. Delayed emergence timescale in a warming climate
The significant extension of emergence timescale under the high-emission scenario is robust across all large ensemble models (figure 4(a)). The multi-model ensemble mean of emergence timescale for historical and future GMST trend fluctuations is 8.6 ± 2.4 years and 17.2 ± 3.8 years, respectively. Among all large ensemble models, CESM1 shows the highest degree of alignment with the observational estimation (∼9 years) of emergence timescale during 1950–2020, confirming its reliability as the primary subject. An evaluation is conducted on the disparities among models, with a focus on those (MPI-ESM-LR, GFDL-ESM2M, CanESM2, MIROC6, and CanESM5) that inadequately capture the observed emergence timescale during 1950–2020 (i.e. the model spread not covering the observation). As shown in figure S8(a) in supporting information S1, the longer historical emergence timescale in MPI-ESM-LR and MIROC6 arises from the stronger IV but weaker EX-induced response compared with that of the observation, with the variance contribution bias reaching approximately 15% for both models. This is likely due to the weak responses to volcanic and GHG forcings, as indicated by the relatively low cooling following the 1963 eruption of Mt. Agung as well as the limited long-term warming during 1991–2020 (figures S8(b) and (c) in supporting information S1). Conversely, the opposite situation holds for the shorter emergence timescale in GFDL-ESM2M, CanESM2 and CanESM5, with the latter two exhibiting the largest variance contribution bias of approximately 12%. Particularly, GFDL-ESM2M exhibits the strongest cooling following the 1963 and 1982 eruptions of Mt. Agung and El Chichón (figure S8(b) in supporting information S1). CanESM2 and CanESM5, however, possess the most pronounced warming since the 1980s, which likely masks out the volcanic-induced cooling effects (figures S8(b) and (c) in supporting information S1).
Figure 4. Projected prolongation of emergence timescale in a warming climate. (a) Box plots of emergence timescale for 1950–2020 (blue box) and 2021–2080 (orange box) in a warming climate (RCP8.5 for CMIP5 and SSP5-8.5 for CMIP6) in eight large ensemble models. Box shows the 25th, median and 75th percentiles among ensemble, with diamond symbol denoting the ensemble average. Whiskers denote ensemble maxima and minima, excluding outliers displayed independently as '+'. Dashed blue line denotes the observational estimation of emergence timescale during 1950–2020 in figure 2(b). The purple (1950–2020) and pink (2021–2080) boxes denote distribution of ensemble-mean emergence timescales derived from eight large ensemble models. (b) Variance of GMST trend fluctuations driven by EX (pink pentagram) and IV (green box) at a 10-year timescale, with the first and second columns represent the periods of 1950–2020 and 2021–2080 respectively.
Download figure:
Standard image High-resolution imageThe robust prolongation of emergence timescale under the high-emission scenario is primarily attributed to diminished EX-driven decadal GMST trend fluctuations, whereas the variance in IV-driven GMST trend fluctuations remains relatively stable in the warming climate (figure 4(b)). This phenomenon is more pronounced under intermediate-emission scenarios (SSP3-7.0 and SSP2-4.5) than that under SSP5-8.5 scenario (figure S9 in supporting information S1), characterized by a more prominent prolongation of emergence timescale and reduction of EX-driven variance. This is attributed to a relatively slower acceleration of global warming due to the moderate GHG emissions in intermediate-emission scenarios, which result in a lesser contribution from EX compared to the SSP5-8.5 scenario (figure S9(b) in supporting information S1). By adhering to the SSP2-4.5 scenario, the multi-model ensemble mean indicates emergence timescale could potentially be delayed by approximately 15 years compared to that in the SSP5-8.5 scenario, highlighting the significant benefits of mitigation actions.
We further investigate the main factors behind future prolongation of emergence timescale using CESM1 'all-but-one-forcing' initial-condition large ensembles (figure 5). Future changes in the variance of GMST trend fluctuations across decadal scales (brown line in figure 5(a)) chiefly stem from EX-driven changes (pink line in figure 5(a)). The comparison between 2021–2080 and 1950–2020 reveals a decrease in EX-driven variance below the 24.2year timescale and an increase beyond this timescale. In contrast, IV remains relatively constant (solid green line in figure 5(a)). The reduction in EX-driven GMST trend fluctuations below 24.2-year timescale partly results from the absence of episodic and unpredictable volcanic activity, as depicted by dashed green line in figure 5(a). Furthermore, AAs contribute more significantly to variance reduction below 24.2-year timescale (dashed blue line in figure 5(a)), due to continuous AA reduction. Notably, the ongoing increase in GHGs positively contributes to the strength of GMST trend fluctuations by accelerating warming rates (dashed orange line in figure 5(a)). However, due to future diminishing influence of AA and volcanic activities at decadal scales, the enhancing effect of GHGs on GMST trend fluctuations becomes dominant at timescales exceeding 24.2 years (brown line in figure 5(a)). Accordingly, projected prolongation of emergence timescale is determined by jointly contrasting effects of GHG and AA forcings, with the former shortening emergence timescale while the latter prolonging it (figure 5(b)). It is noteworthy that the variance of GMST trend fluctuations across decadal scales evolves nonlinearly and thus emergence timescale cannot be simply inferred by linear superposition in single-forcing experiments.

Figure 5. Future changes in GMST trend fluctuations and emergence timescale driven by single forcings. (a) Future changes in variance of GMST trend fluctuations (brown) for the period 2021–2080 versus 1950–2020 across decadal-scale windows, and its EX (red) and IV (green) components. Variance changes driven by GHG (dashed orange), AA (dashed blue) and RES (dashed green) forcings are also presented. The solid pink vertical line marks the timescale (24.2 years) at which future variance change in GMST trend fluctuations becomes positive. (b) Box plots of projected change in emergence timescale for CESM1 all-forcing, GHG and AA single-forcing under RCP8.5 scenario.
Download figure:
Standard image High-resolution image
4. Conclusion and discussion
The trajectory of GMST under global warming is characterized by a non-monotonic rise, punctuated by notable trend fluctuations on decadal scales, encompassing warming acceleration or deceleration and warming-cooling transitions. This study provides a systematic quantification of the relative contributions of EX and IV to decadal GMST trend fluctuations under current and future climates. Historically, emergence timescale for EX dominating GMST trend fluctuations is approximately 9 years, with EX-driven signals surpassing IV and accounting for more than 50% of variance in GMST trend fluctuations. Anthropogenic and volcanic aerosols are the primary driving forces. In the warming climate, this threshold timescale prolongs to approximately 14 years, with the dominant driver shifting toward GHG. This projected extension of emergence timescale stems from a future reduction in the EX-driven GMST trend fluctuations on decadal scales, which is a consequence of the stabilization of AAs and the absence of unpredictable volcanic eruptions, whereas IV remains relatively stable. The extended emergence timescale implies that detecting the influence of predictable anthropogenic factors within decadal GMST trends necessitates a longer temporal coverage in the future.
The prolongation of emergence timescale under the high-emission scenario, linked to the diminished role of EX in decadal GMST trend fluctuations, strikingly deviates from an expectation of a pronounced EX's role in a warming climate. This contradiction raises intriguing questions regarding the divergences in climate predictability on different timescales. The influence of EX indeed increases in the context of long-term climate projections, particularly regarding centennial-scale global warming (Masson-Delmotte et al 2021). As revealed by CESM1, the influence of accelerated GHG warming on the GMST trend fluctuations becomes evident at timescales exceeding approximately 24 years. However, on a decadal scale, the GMST trend is marked by significant fluctuations, and it is anticipated that future external influences on such decadal changes would be weakened. This indicates that predicting near-term changes in GMST may be more challenging in the future, given the growing influence of stochastic IV.
In the future, the diverse trajectories of AA emissions may introduce uncertainties into climate projections. Despite notable advancements in recent years (Bellouin et al 2020), the present estimation of aerosol forcing and its climatic responses in Earth system models still exhibit considerable uncertainty (Watson-Parris and Smith 2022). Therefore, prioritize efforts in reducing the potential uncertainty in AA forcing and improving the simulation of AA-driven climate impacts is imperative. This is crucial for improving the reliability of future climate change projections in the near-term and facilitating more effective mitigation and adaptation planning.
Acknowledgments
This work is financially supported by the Science and Technology Innovation Foundation of Laoshan Laboratory (LSKJ202202602), National Natural Science Foundation of China (NSFC) projects (42276016), and National Key Research and Development Program of China (2019YFA0607001, 2023YFF0805103).
Data availability statement
The CMIP5 large ensemble model data can be obtained from the U.S. CLIVAR Multi-Model Large Ensemble Archive www.earthsystemgrid.org/dataset/ucar.cgd.ccsm4.CLIVAR_LE.html; whereas MPI-ESM large ensemble model data can be obtained from https://esgf-data.dkrz.de/projects/mpi-ge/. The CMIP6 large ensemble model data can be obtained from https://esgf-node.llnl.gov/projects/cmip6/. All CMIP5 and CMIP6 models used in this study can be found in table S1 in supporting information S1. The observational data are available: NOAAGlobalTemp5 at www.ncei.noaa.gov/metadata/geoportal/rest/metadata/item/gov.noaa.ncdc:C01585/html; HadCRUT5 at https://crudata.uea.ac.uk/cru/data/temperature/#datdow; GISTEMP v4 at https://data.giss.nasa.gov/gistemp/; BEST at http://berkeleyearth.org/data/.
All data that support the findings of this study are included within the article (and any supplementary files).
Code availability
Codes for the main results are available at: https://drive.google.com/drive/folders/1ZMQm6O2Xs2eEjPcPTxbDPbw7DkEeqMv4.
Conflict of interest
The authors declare no competing interests.
Supplementary data (6.2 MB DOCX)