

Abstract
Residual emissions are an important category of analysis in climate targets and scenarios, describing the emissions that would need to be compensated by carbon dioxide removal to reach net zero CO2. This article sheds light on the size and composition of residual emissions in integrated assessment modelling (IAM) scenarios at net-zero CO2, using the Intergovernmental Panel on Climate Change 6th assessment report (AR6) scenario database. I find that IAMs depict residual greenhouse gas emissions levels of 16 [12–26] GtCO2e/yr across below 1.5 °C, below 1.5 °C with overshoot, and below 2 °C scenarios—representing gross emissions reductions of 72 [55–78] % from 2020 to the point of net zero CO2. Emissions from livestock, agriculture, transport, waste and industrial processes remain most prevalent at net zero, with scenario averages tending to depict significantly lower reduction rates and higher residual emissions than those recently published in corporate net zero standards. Nonetheless, scenarios depict a wide range of outcomes across all of these 'hard-to-abate' sectors, with lower values characterised by demand-side shifts in the food and energy system, alongside the rapid electrification of end-use sectors and limits on CDR scaling. Current scenario reporting does not easily facilitate the calculation of gross emissions from the AR6 database, which would be a prerequisite to a more systematic exploration of the residual emissions frontier and its implications for climate policy.
Export citation and abstract BibTeX RIS

Original content from this work may be used under the terms of the Creative Commons Attribution 4.0 license. Any further distribution of this work must maintain attribution to the author(s) and the title of the work, journal citation and DOI.
1. Introduction
Net-zero CO2 implies a period of deep reductions in fossil fuel emissions and deforestation, followed by a balance of emissions with carbon dioxide removals (CDR). This future state would be a necessary precondition for stabilising temperatures and limiting dangerous climate change (Allen et al 2022, Fankhauser et al 2022). But inherent to the net-zero concept is the question of what 'residual emissions' would remain once it is reached. This is a topic that has gained increasing attention in the literature (Luderer et al 2018, Edelenbosch et al 2022, Buck et al 2023, Lund et al 2023, Schenuit et al 2023). However, consensus on the types of gases, economic sectors or activities that residual emissions might be composed of remains elusive.
The problem with residual emissions is that they are a future, unknown quantity dependent on the long-term technological, economic and political prospects of deep decarbonisation. But nevertheless, they have deep significance for climate policy design and its distributional implications. Residual emissions imply that some sectors and geographies will decarbonise to a lesser degree than others. And since CDR is limited by available land, access to geological reservoirs and technological means, the ability to offset residual emissions will vary considerably between nations. On an aggregate level, the higher the amount of residual emissions, the more CDR will be required, the higher the risk that social, environmental or technological constraints for scaling these technologies are exceeded. Pathways with low residual emissions may therefore be the safest course of action for limiting climate change and reversing any potential overshoot, as these would imply a more modest scaling of CDR to achieve either net-zero or net-negative emissions.
Policy documents and techno-economic studies often refer to residual emissions as the consequence of 'hard-to-abate' sectors. These are sectors where marginal abatement costs are relatively high due to technical hurdles or the absence of substitution options (Edelenbosch et al 2022). Emissions from livestock, industrial processes and aviation are commonly cited examples, as methane is a by-product of digestion in cattle and other ruminant animals; steel and cement manufacture require carbon feed-stocks; and long-haul flights depend on a certain threshold of fuel energy density. Reducing emissions in these sectors may therefore require a greater degree of effort, such as through high carbon prices or shifts in underlying demand.
But beyond mere technical considerations, it is clear that 'hard-to-abate' is an inherently political category involving conflicting claims on which sectors should be deprioritised in climate mitigation (Lund et al 2023, Schenuit et al 2023). If a sector is successfully positioned as 'hard-to-abate' for political, economic, or strategic reasons—for instance because it is critical to feeding populations or providing employment—then climate policy exemptions or additional state support might be gained. One could of course argue that a uniform carbon price would ultimately resolve which sectors are 'hard-to-abate' or not, however the history of climate policy has shown that discursive framing can be a key channel for expressing political power and influencing the implementation, coverage and stringency of policies. The new category of 'hard-to-abate' emissions might offer yet another such entry point to climate policy obstruction.
Scientific evidence can provide some grounding for such discussions. In this article I consider one line of evidence for the size and composition of residual emissions at net zero CO2: integrated assessment model (IAM) scenarios. IAMs are simplified representations of the global energy system that model scenarios of technological change and shifts in energy services to meet climate goals in a cost-effective manner. As such, they are suited to considering the techno-economic frontiers of mitigation across different sectors. However, they are less suited to considering the normative or political aspects of climate policy, even if many such aspects are implicitly modelled (e.g. via demand, lifestyle and dietary shifts, as well as regional and intergenerational equity). As IAMs are a prominent source of science-policy advice on the conditions for meeting climate targets, it is of significant interest to understand the size, range and composition of residual emissions in their scenarios.
The research questions of this study are as follows: (1) what is the size and variation in residual emissions across scenarios at the point of net zero CO2? (2) what is the composition of residual emissions in scenarios with respect to gases, sectors and fuels? (3) what scenario characteristics explain variations in total residual emissions and their composition?
The analysis in this manuscript centres on residual emissions at the point of net zero CO2, rather than net zero greenhouse gas (GHG) emissions. While the latter is a more stringent objective that likely requires even lower residual emissions, it is not always reached in scenarios. Global mitigation objectives derived from the Intergovernmental Panel on Climate Change (IPCC) assessment literature are also strongly oriented around net zero CO2 emissions, which advises for this state to be reached by the mid-century in order to limit warming to below 1.5 °C (IPCC 2022), with net zero GHG approximately 10 years later. But despite this orientation around net zero CO2, the subsequent analysis considers both CO2 and non-CO2 gases (CH4, N2O, Fgases), acknowledging that not all of the latter would need to be compensated by CDR to stabilise warming.
2. Method
My primary data source is the scenario database compiled and vetted for the IPCC 6th Assessment Report (Byers et al 2022), and supported by an extensive underlying literature (Bertram et al 2021, Riahi et al 2021, Soergel et al 2021, Strefler et al 2021, Luderer et al 2022). I use three categories of scenarios: 'below 1.5 °C', 'below 1.5 °C with overshoot' and 'below 2 °C scenarios'. These correspond to the IPCC terminology of 'C1', 'C2' and 'C3' scenarios (IPCC 2022), which are those most relevant to the temperature goal of the Paris Agreement. Only global totals are considered in these scenarios. Further, I use a linear interpolation to estimate data in the years between reported time steps. The complete R code and processed data for this manuscript are available at https://github.com/mcc-apsis/The-size-and-composition-of-residual-emissions-in-integrated-assessment-scenarios-at-net-zero-CO 2 .
2.1. Scenario exclusions
Many scenarios must be excluded from the analysis due to a lack of data. To achieve a certain granularity of analysis, I consider only scenarios that report 17 separate emissions variables as detailed in table 1. In addition, only scenarios that report carbon sequestration in the land use and energy supply sectors were selected, as these variables are required to calculate gross emissions.
Table 1. Sector aggregation used in the analysis.
| Sector | Subsector variables |
|---|---|
| Energy | CO2|Supply |
| CO2|Demand|Industry | |
| CO2|Demand|Residential and Commercial—also known as the buildings sector | |
| CO2|Demand|Transportation | |
| CO2|Other | |
| CH4—also known as fugitive emissions from fossil supply chains | |
| AFOLU | CH4|Livestock|Enteric Fermentation |
| CH4|Livestock|Manure Management | |
| CH4|Rice | |
| CH4|Other | |
| CO2|Land Use | |
| N2O | |
| Other | CO2|Industrial Processes |
| CO2|Other | |
| F-Gases | |
| N2O | |
| CH4
|
a Calculated as the sum of 'CO2|Energy|Supply' and 'Carbon Sequestration|CCS|Biomass'. b Variables that capture the difference in the sum of subsectors (e.g. CO2|Energy|Supply, CO2|Energy|Demand) to the overall sector gas total (e.g. CO2|Energy). c Calculated as the sum of 'CO2|AFOLU' and 'Carbon Sequestration|Land Use'. d Calculated as the sum of 'CO2|Other' and any other reported carbon sequestration variables. e Variables that capture the difference in the sum of sectors (e.g. CH4|Energy, CH4|AFOLU) to the overall gas total (e.g. Emissions|CH4). f This sector likely represents CH4 emissions from waste, which are only inconsistently reported as such in the AR6 database. Some variable names are shortened compared to the original AR6 database.
Finally, I exclude scenarios that do not reach net zero CO2 emissions in the 21st century. The remaining dataset of 156 scenarios comprises 31 below 1.5 °C scenarios (out of 70), 43 below 1.5 °C with overshoot scenarios (of 106) and 82 below 2 °C scenarios (of 231). An important consequence of these exclusions is that only three models are represented in the final dataset: IMAGE, MESSAGE and REMIND.
2.2. Aggregation of scenario data
Emissions do not sum reliably across sectors and gases in the AR6 scenario database. To ensure consistent reporting across the hierarchy I therefore created a set of residual 'other' categories that capture the difference in the sum of emissions from the subsector to sector level, and the sector to gas level. Total net GHG emissions for each scenario are then calculated as the sum of the individual sectors or gases (CO2, CH4, N2O and F-gases). I use AR6 global warming potentials with a 100 year time horizon (GWP100) (Forster et al 2021), but take native GWP100 reporting in the scenario database for F-gases. Following these procedures, the sum of emissions across the resolved sectors is fully consistent with native reporting by gas, but still does not equal the native 'Kyoto gas' total in the AR6 database. Nonetheless, the absolute differences are relatively small (median and 5th–95th percentile: 130 [97–250] MtCO2e in 2050).
More critically, net zero years calculated using native reporting of net CO2 emissions in the AR6 database—i.e. the variable 'Emissions|CO2'—are not always consistent with the metadata describing net zero years, which are aligned to 'AR6 climate diagnostics|Infilled|Emissions|CO2' as derived by Kikstra et al (2022) in their scenario harmonisation process. I therefore recalculated net zero years using the native scenario variables, to ensure consistency with the reported sector and subsector emissions. These differ from the metadata by 3 [0–18] years.
2.3. Calculation of residual emissions
The main analytical task is to calculate total residual emissions at net zero CO2 across scenarios. This requires resolving gross emissions in two sectors that are typically reported as net fluxes including removals: 'CO2|AFOLU' and 'CO2|Energy|Supply'. To these sectors I add the absolute value of the 'Carbon Sequestration|Land Use' and 'Carbon Sequestration|CCS|Biomass' sectors, respectively. This assumes that all biomass based CCS is applied in the energy supply sector. This is not the case for all models, including some IMAGE 3.2 scenarios, which also include biomass based CCS for industrial processes. However, as it is unclear whether IMAGE 3.2 reports 'CO2|Industrial processes' as a net flux, I added these removals to a residual gross emissions category called 'CO2|Other'. If any further carbon sequestration variables are reported for a given scenario (e.g. for direct air capture, enhanced weathering, feedstocks, and other), I also add these to the 'CO2|Other' sector. Note that Prütz et al (2023) follow a similar procedure, but find that gross land use emissions are not always positive—a definitional inconsistency that may be due to outdated scenarios in the ensemble. I nonetheless retain the scenarios where this is the case, as the gross 'negative' emission level is relatively small (−0.18 [−0.033 to −0.54] GtCO2) and excluding them would remove 50 REMIND and 4 IMAGE scenarios and significantly dilute the dataset.
Following these procedures, gross emissions are resolved into the sectors and subsectors shown in table 1. Overall residual emissions are then calculated the sum of these at the reported year of net zero CO2 for each scenario. Whenever data is summarised across groups of scenarios, I report the median and 5th–95th percentiles.
2.4. Principal component analysis
To evaluate which groups of scenarios share similar residual emissions outcomes, I perform a principal component analysis on the subsector emissions across all scenarios. Subsector emissions were re-scaled to unit variance (by subtracting the population mean and dividing by the population standard deviation) for comparability between each metric. Results for the first two principal components are shown and overlaid with a selection of highly correlating subsector variables (i.e. those with higher than average expected contribution to the principal components).
3. Results
3.1. Total residual emissions at net zero CO2
Scenarios reduce gross CO2 emissions on average by 80 [58–86] % from 2020 to the point of net zero, where they reach a total of 8.5 [5.8–18] GtCO2/yr. Below 1.5 °C scenarios have higher median CO2 reductions and lower residual CO2 emissions, followed by below 1.5 °C with overshoot and below 2 °C scenarios (figure 1; table 2). Below 1.5 °C scenarios also reach net zero a median of 6 years earlier than below 1.5 °C with overshoot scenarios, and 20 years earlier than below 2 °C scenarios.
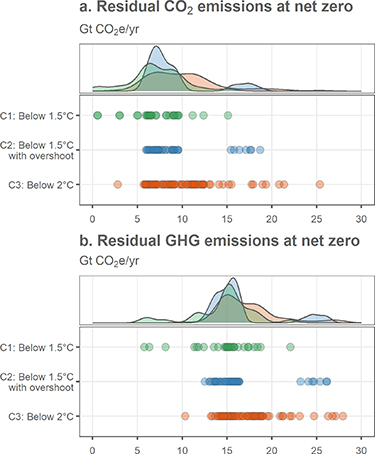
Figure 1. Total residual CO2 and GHG emissions across scenarios. Gross emissions are estimated as the sum of emissions by sector and available carbon sequestration variables in the AR6 database. 3 outliers with very low residual emissions of below 10 GtCO2e/yr are sourced from Strefler et al (2021) and Soergel et al (2021).
Download figure:
Standard image High-resolution imageTable 2. Median net zero years and total residual emissions across scenarios. Ranges in the square brackets indicate the 5th–95th percentiles. Note that only 64 of 156 scenarios in this ensemble adjust for the COVID-19 induced drop in 2020 emissions. However, changing the baseline year to 2019 has no impact on the presented reduction values.
| Scenario category | No. scenarios | Year of net zero CO2 | Residual CO2 emissions (GtCO2/yr) | CO2 reduction from 2020 (%) | Residual GHG emissions (GtCO2e/yr) | GHG reduction from 2020 (%) |
|---|---|---|---|---|---|---|
| C1-C3 | 156 | 2070 [2048–2100] | 8.5 [5.8–18] | 80 [58–86] | 16 [12–26] | 72 [55–78] |
| C1: Below 1.5 °C | 31 | 2057 [2047–2088] | 6.6 [1.8–12] | 83 [73–96] | 15 [7.2–19] | 73 [67–87] |
| C2: Below 1.5 °C with overshoot | 43 | 2063 [2047–2070] | 7.4 [6.2–18] | 82 [58–85] | 15 [13–25] | 72 [55–77] |
| C3: Below 2 °C | 82 | 2077 [2066–2100] | 9.4 [5.9–19] | 78 [54–85] | 16 [14–27] | 71 [53–75] |
Scenarios converge on very similar levels of residual GHG emissions. Across the ensemble these are reduced by 72 [55–78] % from 2020 to 16 [12–26] GtCO2e/yr—almost double that of residual CO2 emissions. Median residual GHG emissions range by just 2 GtCO2e/yr between the temperature categories. These results are consistent with, but not directly comparable to reporting in IPCC AR6 WGIII, due to the narrower selection of scenarios in this analysis. For instance, whereas the IPCC (Riahi et al 2022) refers to residual non-CO2 emissions of 5–11 GtCO2e/yr at the time of net zero in below 2 °C scenarios (e.g. C1-C3), here it is calculated as 6.9 [6.4–8.9] GtCO2e/yr.
3.2. The composition of residual emissions at net zero CO2
Levels of residual CH4 and N2O emissions are relatively consistent in scenarios, regardless of model and temperature category (figure 2(a) and table SI2). Across the ensemble, CH4 emissions at net zero total 4.4 [3.5–5.4] GtCO2e/yr and N2O emissions total 2 [1.8–3.3] GtCO2e/yr. Scenarios also sustain residual F-gases of 0.23 [0.17–1.2] GtCO2e/yr, however unabated F-gases are more prevalent in the MESSAGE model at around 1.1 GtCO2e/yr (figure 2(a)). As shown previously, there is significantly more variation in residual CO2 emissions at net zero compared to CH4 and N2O (table 2 and figure 2(a)).
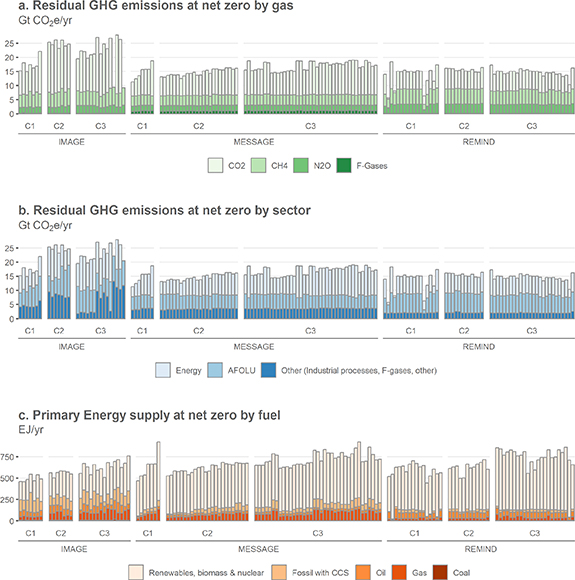
Figure 2. Residual GHG emissions by gas, sector and fuel. Note that the year corresponding to net zero CO2 varies for each scenario, as summarised in table 2. Total primary energy supply levels should therefore not be compared between scenarios, as this indicator continuously grows throughout the 21st century. 3 outliers with very low residual emissions of below 10 GtCO2e/yr (REMIND C1 scenarios) are sourced from Strefler et al (2021) and Soergel et al (2021).
Download figure:
Standard image High-resolution imageTotal residual GHG emissions are primarily situated in the Energy and AFOLU sectors (figure 2(b) and table SI3). Across the ensemble, these account for emissions of 6.8 [4.5–11] GtCO2e/yr and 5.5 [4.1–8.7] GtCO2e/yr, respectively. Emissions from Industrial processes, F-gases and other activities account for the remaining 3.4 [1.9–8.5] GtCO2e/yr. However, there are some differences across scenarios, mainly driven by the model type: IMAGE reports relatively higher Energy and Other emissions compared to the median, while MESSAGE reports relatively lower AFOLU emissions (figure 2(b)).
Although all scenarios represent a deep transition of the global energy system away from fossil fuels, none complete this transition by the point of net zero (figure 2(c)). Of total primary energy supply across scenarios (660 [500–840] EJ/yr), most is serviced by renewables, biomass and nuclear power (500 [270–680] EJ/yr), followed by fossil fuel use without carbon capture and storage (CCS) (110 [66–190] EJ/yr), and fossil fuel use with CCS (46 [13–150] EJ/yr) (figure 2(c) and table SI4). However, models significantly differ in their outcomes. IMAGE deploys fossil fuels with CCS at levels far above the ensemble median at 130 [76–170] EJ/yr. MESSAGE tends towards a relatively deep phase down of oil without CCS at 25 [18–33] EJ/yr (ensemble median: 44 [20–89] EJ/yr); while REMIND tends to a deep phase down of gas without CCS at 32 [18–61] EJ/yr (ensemble median: 63 [27–130] EJ/yr). Coal without CCS is almost entirely absent across the scenario ensemble.
While figure 2(c) depicts varying total levels of primary energy supply, it shows scenario outcomes at different points in time for an indicator which continuously grows throughout the 21st century. When compared in the same year (e.g. 2050; table SI5), scenarios are relatively consistent at 540 [480–590] EJ/yr. None achieve the very low levels of primary energy supply (290EJ/yr in 2050) depicted in the Low Energy Demand scenario by Grubler et al (2018).
Of all subsectors, the energy supply sector has the deepest reductions and lowest relative residual emissions compared to 2020 at −91 [−79 to −96] % across all scenarios (figure 3(a)). However, these emissions do tend to be higher and have a wider spread of outcomes in the IMAGE model. Similarly, there are deep—but not complete—reductions in fugitive methane emissions ('Energy|CH4') across all models (figure 3(a)). Among the energy demand sectors, transport tends to have the lowest relative reductions and highest residual emissions at net zero, followed by industry and buildings.
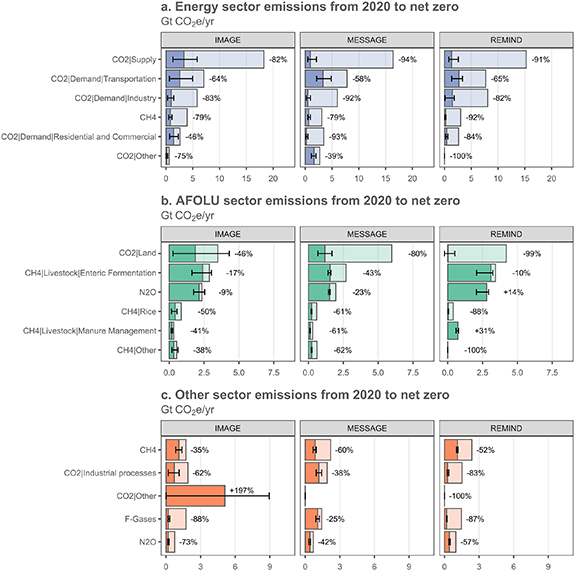
Figure 3. Energy, AFOLU and Other sector emissions from 2020 to net zero. Each column represents the multi-scenario median from the models IMAGE, MESSAGE and REMIND. Error bars represent the 5th–95th percentile of scenarios in each model category. Note that negative gross emissions are not possible, but can be found in some cases, suggest accounting inconsistencies around carbon sequestration (Prütz et al 2023). These are found here in the lower percentile of REMIND model results for the 'AFOLU|CO2|Land use' sector.
Download figure:
Standard image High-resolution imageScenarios are far more diverse in AFOLU reductions and residual emissions outcomes. Whereas CO2 from land use is consistently almost eliminated in REMIND—and severely curtailed in MESSAGE—IMAGE depicts a wide range of outcomes and median of −46% reductions. Consequently, CH4 emissions from livestock (specifically enteric fermentation) are typically the largest remaining component of residual AFOLU emissions across all models, followed by N2O emissions (figure 3(b)). These categories are reduced by −39 [−7 to −47] % and −24 [+16 to −27] %, respectively, with relatively higher reduction rates in MESSAGE scenarios. The remaining emissions components are small, however their treatment in different models varies significantly. For instance, REMIND scenarios have relatively high median reductions in CH4 emissions from rice cultivation, but deliver no reductions in CH4 emissions from livestock manure, in contrast to IMAGE and MESSAGE (figure 3(b)).
In the remaining 'Other' sector, CH4 emissions (i.e. from waste) are typically the largest residual sector, with an average of −56 [−46 to −52] % reductions and reaching a median of close to 1GtCO2e/yr across all models (figure 3(c)). Reductions in industrial process emissions are relatively higher in REMIND, while F-gas emissions reductions are relatively lower in MESSAGE. Note that the large gross emissions in the 'CO2|Other' category for IMAGE are due to the allocation of removals outside of the land use and energy supply sectors to this category—the specific gross emissions they compensate for cannot be discerned from the available data.
3.3. Explaining variations in residual emissions
In the prior analysis of sector and subsector emissions, reporting was organised around model family. To test this assumption that models are critical to explaining variations in residual emissions, I performed a principal component analysis. The first two principal components explaining 75% of variance in residual emissions at the subsector level show a strong three-way grouping according to model type, with the IMAGE model having the largest spread of outcomes (figure 4). In addition, contributions to the first two principal components are widely distributed across these dimensions. The analysis suggests that REMIND scenarios tend to have higher AFOLU|N2O emissions, and higher AFOLU|CH4 emissions from enteric fermentation and manure management; that MESSAGE scenarios tend to have higher industrial process and F-gas emissions; and that IMAGE scenarios tend to have higher building sector emissions (figure 4). In other words, scenarios sourced from the same model tend to have a similar distribution of subsector emissions levels; and differences between models are driven by the combination of many, rather than a few, of these subsector emissions variables.
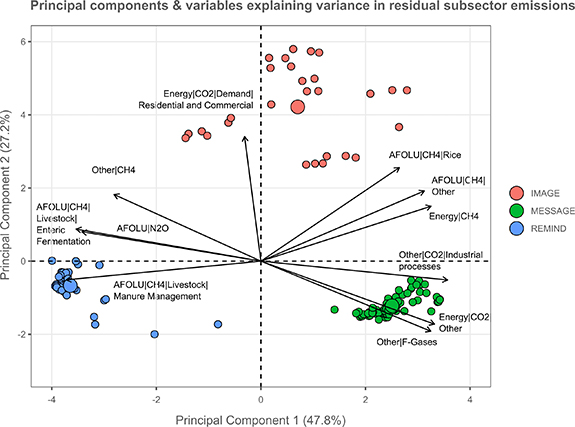
Figure 4. Principal component analysis. The first two principal components of the subsector emissions data (normalised to unit variance) are depicted, with scenarios coloured by their model family. These are overlaid with the 11 (of 17) highest correlating variables with PC1 and PC2, selected based on above average expected contribution to these dimensions. Scenarios located towards the direction of the depicted variables have a high value on that variable, while those on the opposite side have a low value.
Download figure:
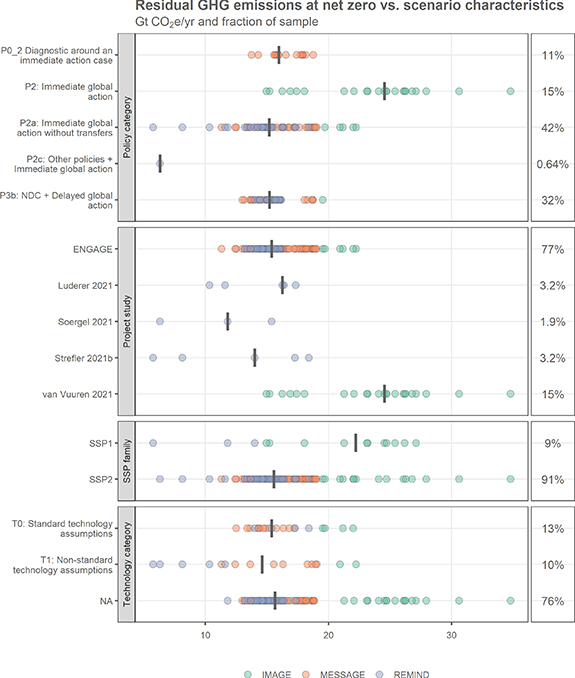
Standard image High-resolution imageThe AR6 scenario database provides some high-level scenario characteristics to aid inter-comparison, namely the 'policy category', 'project study', 'SSP family' and 'technology category' variables. However, descriptively, these characteristics do not provide significant insight on why total residual emissions vary between scenarios (figure 5). Further, several characteristics are highly weighted in the sample and correlate with the model family. For instance, when discarding the three policy categories that are entirely weighted by model family (P0_2, P2, P2c), total residual GHG emissions are highly similar between immediate (P2a) and delayed action (P3b) scenarios, at 15 [12–21] and 16 [15–18] GtCO2e/yr, respectively (figure 5). In addition, a significant majority of scenarios are sourced from the ENGAGE project (77% of total), the SSP2 'Middle of the Road' pathway (91%), and do not report any distinguishing technology characteristics (76%). However, a handful of studies are responsible for delivering a set of REMIND scenarios with the lowest residual emissions in the ensemble (Soergel et al 2021, Strefler et al 2021, Luderer et al 2022).
Figure 5. Scenario characteristics and residual emissions at net zero. Each row depicts the spread of residual GHG emissions at net zero for scenarios with the given characteristic, with vertical lines depicting the row-wise median. The fraction of the row-wise sample is given in the right column (out of a total of 156 scenarios).
Download figure:
Standard image High-resolution image
4. Discussion
In this article I assess the level and composition of residual GHG emissions in AR6 scenarios. An important motivation for this is simple transparency: as discussions of net zero move into practice, there are increasing calls to distinguish gross emissions and removals in pledges, plans and policies (Rogelj et al 2021, Buck et al 2023).
As it stands, a relatively complex set of procedures are required to calculate residual emissions in the current iteration of the IPCC scenario database. Such information could be put further within reach if gross emissions and removals were reported separately in each relevant sector. This becomes increasingly relevant as new CDR technologies that belong to neither the land use nor the energy supply sectors are integrated into scenarios. For instance, it is currently unclear which gross emissions are offset by direct air capture, which are here allocated to a residual 'CO2|Other' category. Similar problems will arise when enhanced weathering or marine-based CDR technologies are implemented. Separate reporting would also help to diagnose inconsistencies, such as when gross land use emissions are resolved as negative (Prütz et al 2023).
A striking result of this analysis is the overall expected level of residual emissions at net zero CO2 in scenarios. In terms of CO2 emissions, 8.5 [5.8–18] GtCO2/yr is projected across the ensemble—consistent with Prütz et al (2023)—representing gross reductions of 80 [58–86] % from 2020. Almost double this level of emissions is projected for total GHGs. This contrasts with expectations now being set in a string of corporate net zero standards that benchmark significantly deeper reductions of more than 90% in energy and industrial process CO2 emissions (ISO 2023, SBTi 2023). Indeed, scenarios depict lower reductions and higher residual emissions across all sectors that are comparable to the Science Based Targets initiative (SBTi) standards (table 3). Of course, scenarios must reflect regional variations in transition speeds—and potentially wider system boundaries—whereas corporate-oriented targets can afford to set stringent benchmarks and anchor higher ambition. SBTi also purposefully aligns its standard to assume 'conservatively low assumptions of CO2 removal availability' (SBTi 2021). But overall this does suggest an emerging divide in expert assessments on how low residual emissions might go.
Table 3. Sector-based reduction targets in corporate net zero standards versus global reductions in scenarios by net zero CO2. Note that insufficient data is present in the AR6 database to distinguish cement versus iron and steel emissions. These sectors are here mapped to the 'CO2|Energy|Demand|Industry' and 'CO2|Industrial processes' variables in the AR6 database. Similarly, service and residential buildings are mapped to the 'CO2|Energy|Demand|Residential and Commercial' variable. Also note that scenario numbers refer to gross reductions and would require additional removals to reach net zero, while the SBTi documentation is ambiguous concerning whether reductions are gross or net. Sources: SBTi (2023), Byers et al (2022).
| Science Based Targets initiative (SBTi) | Below 1.5 °C scenarios | Below 1.5 °C with overshoot scenarios | Below 2 °C scenarios | |
|---|---|---|---|---|
| Reductions from 2020–2050 (%) | Reductions from 2020 to net zero CO2 (%) | |||
| Forest, land and agriculture | 72 | 40 [27–73] | 55 [5.3–61] | 55 [27–67] |
| Power | 97 (by 2040) | 92 [88–97] | 93 [85–97] | 91 [76–96] |
| Cement | 94 | 84 [78–98] | 82 [73–87] | 78 [70–85] |
| Iron and steel | 91 | |||
| Service buildings | 98 | 85 [52–98] | 93 [17–97] | 86 [37–95] |
| Residential buildings | 95 | |||
| Cross-sector total (excl. AFOLU) | 90 | 80 [71–93] | 79 [59–83] | 75 [58–82] |
The challenge of residual emissions is that they cover a diverse array of potential sources, including not just energy system CO2 emissions, but also industrial processes, land use fluxes, agricultural CH4 and N2O, and the waste sector. As it stands, however, very few models report a wide scope of detail across these categories. Only 52% of scenarios in the AR6 database report agricultural emissions, while 46% capture more detailed categories such as livestock or managed soils—a reflection of the still limited state of land use model integration in IAMs. Another widely cited example of a 'hard-to-abate' sector is aviation, yet just 2% of scenarios report emissions at this level. While it is important not to seek a false level of precision around expectations of residual emissions, a minimum degree of reporting will be required to facilitate inter-comparison and reflection on the various possible futures. This would also limit the subjectivity involved with determining what level of sector detail to include, which was found here to have a strong trade-off with model coverage and limited the sample to just three models—IMAGE, MESSAGE and REMIND.
Inter-comparison of the AR6 database scenarios is further hindered by a lack of descriptive variables characterising pathways and their underlying features. But sampling the set of scenarios at the lower end of residual GHG emissions (e.g. <12 GtCO2e/yr at net zero) suggests a number of strategies to minimise these emissions. The first is to resolve land-based impacts through a significant increase in the dietary share of plant based proteins. Soergel et al (2021) increase this share to ∼80% and observe rapid reductions in agricultural N20 and CH4 emissions, which also facilitates a higher CO2 budget for meeting the 1.5 °C target. The second is to focus on a particularly deep electrification of end-use technologies in the transport, industry and buildings sectors, supported by a rapid scale-up of solar power and wind generation, as in Luderer et al (2022). The third is to limit CDR availability and thereby constrain models to implementing deeper gross emissions reductions at higher costs (Strefler et al 2021). Finally, cross-cutting demand-side measures are known to ease the mitigation of emissions in 'hard-to-abate' sectors (Grubler et al 2018, van Vuuren et al 2018, Creutzig et al 2022). This includes not just a shift to sustainable diets, but reductions in aviation demand and constraints on building floor area and material use. One recent scenario not included in the AR6 database cumulates these various interventions to residual emissions of ∼10 GtCO2e/yr in 2060 (Edelenbosch et al 2022).
5. Conclusion
As countries begin to design their pathways to net zero, there remains debate as to the degree of fossil fuel phase-out and CDR scaling that will be needed in the coming decades (Achakulwisut et al 2023, Smith et al 2023). These questions are highly salient for understanding the amount of policy effort required to minimise residual emissions and establish CDR technologies, including what actions need to be taken in the near-term.
While scenarios depict a range of outcomes in these categories, there has been relatively little reflection on where the frontier of low residual emissions may lie. Given the cost-optimisation nature of IAMs, strategies that limit CDR or execute extremely high carbon prices may be needed to systematically explore this frontier. However, even an expansion and harmonisation of the descriptive variables that characterise possible residual emissions outcomes would be useful. The literature suggests that more detail is required on electrification, demand and activity levels, including emissions in key sectors such as agriculture, industrial processes and international aviation. Further, while this article has considered both CO2 and non-CO2 gases, only sufficient CDR to compensate the former would be required to reach the assessed net-zero CO2 targets. The amount of CDR required to reach net zero GHG is a rather more complex question and will depend on the specific composition of residual gases, underlining the importance of clarity in national plans going forward (Allen et al 2022, Zickfeld et al 2023).
The categories of residual emissions and 'hard-to-abate' sectors would seem to increase the complexity of climate policy, adding further subjectivity with regards to where efforts should take place and where difficulties will be met. However, it is also unambiguously clear that a wide range of short-term, effective and necessary intervention points exist to phase-out fossil fuels and eliminate deforestation. It is only through learning by doing that residual emissions will finally become known.
Acknowledgments
William F Lamb was supported by the ERC-2020-SyG 'GENIE' (Grant ID 951542). I thank Jan Minx and Matthew Gidden for insights on the analysis and discussion in this manuscript.
Data availability statement
The data that support the findings of this study are openly available at the following URL/DOI: https://github.com/mcc-apsis/The-size-and-composition-of-residual-emissions-in-integrated-assessment-scenarios-at-net-zero-CO 2 .
Supplementary information (<0.1 MB DOCX)
Supplementary data file (<0.1 MB XLSX)