Toward diffusion tensor imaging as a biomarker in neurodegenerative diseases: technical considerations to optimize recordings and data processing
 Hans-Peter Müller*
  Jan Kassubek
- Department of Neurology, Ulm University, Ulm, Germany
Neuroimaging biomarkers have shown high potential to map the disease processes in the application to neurodegenerative diseases (NDD), e.g., diffusion tensor imaging (DTI). For DTI, the implementation of a standardized scanning and analysis cascade in clinical trials has potential to be further optimized. Over the last few years, various approaches to improve DTI applications to NDD have been developed. The core issue of this review was to address considerations and limitations of DTI in NDD: we discuss suggestions for improvements of DTI applications to NDD. Based on this technical approach, a set of recommendations was proposed for a standardized DTI scan protocol and an analysis cascade of DTI data pre-and postprocessing and statistical analysis. In summary, considering advantages and limitations of the DTI in NDD we suggest improvements for a standardized framework for a DTI-based protocol to be applied to future imaging studies in NDD, towards the goal to proceed to establish DTI as a biomarker in clinical trials in neurodegeneration.
1 Introduction
Magnetic resonance imaging (MRI) with diffusion tensor imaging (DTI) provides information on the microstructural processes of the central nervous system’s white matter (WM) in vivo (Pierpaoli and Basser, 1996). This technique has been used in different neurodegenerative diseases (NDD), e.g., in Alzheimer’s disease (AD) for both the early diagnosis and for monitoring disease progression (Oishi et al., 2011). Previous DTI studies in Parkinson’s disease (PD) have demonstrated alterations in multiple WM regions, particularly in the dopaminergic pathways (Zhang and Burock, 2020). DTI has shown microstructural abnormalities in patients with Huntington’s disease (HD) and is a tool to characterize how these abnormalities change with disease progression (Zhang et al., 2018). Furthermore, DTI plays a key role in cross-sectional and longitudinal imaging of WM alterations in motor neuron diseases (MND) like amyotrophic lateral sclerosis (ALS) (Basaia et al., 2019); cross-sectional DTI studies in patients with ALS identified the corticospinal tract as the major WM tract demonstrating microstructural alterations (Agosta et al., 2010; Kassubek et al., 2014; Müller et al., 2016; Braak et al., 2017).
Longitudinal DTI studies showed progression of WM degeneration, that way targeting a propagation-based biomarker in NDD (e.g., Gregory et al., 2015 – HD; Basaia et al., 2019 – MND; Kalra et al., 2020 – ALS; Torso et al., 2022 – AD; Hu Z. et al., 2023 – PD) and demonstrated the utility of DTI to monitor disease progression in NDD in a mono-or multicenter setting.
Based on these data, the aim was to reflect on suggestions for improvements of the scanning protocol as well as for the standardization of analysis (without focus on specific analysis software solutions) in order to provide a framework for future clinical trials regarding DTI scan protocol, analysis, and effect sizes.
2 Scanning protocol-related contributions to results of DTI studies in NDD and options of optimization
2.1 Analysis of microstructural alterations by DTI
As a basis for DTI data analysis, it has to be noted that WM tracts in the central nervous system consist of densely packed axons in addition to various types of neuroglia and other small populations of cells (Nieuwenhuys et al., 2019). The axonal membrane as well as the well-aligned protein fibers within an axon restrict water diffusion perpendicular to the fiber orientation, leading to anisotropic water diffusion in brain WM (Moseley et al., 1990). Myelin sheaths around the axons may also contribute to the anisotropy for both intra-and extracellular water (Mori and van Zijl, 2002). Diffusion anisotropy is mainly caused by the orientation of fiber tracts in WM and is influenced by its micro-and macrostructural features. Of the microstructural features (Basser et al., 1994; Mattiello et al., 1994), intraaxonal organization appears to be of greatest influence on diffusion anisotropy, besides the density of fiber and cell packing, degree of myelination, and individual fiber diameter. On a macroscopic scale, the variability in the orientation of all WM tracts in an imaging voxel influences its degree of anisotropy (Pierpaoli and Basser, 1996). DTI provides two types of information about the property of water diffusion: first, the orientation-independent extent of diffusion anisotropy (Pierpaoli and Basser, 1996) and second, the predominant direction of water diffusion in image voxels, i.e., the diffusion orientation (Pajevic and Pierpaoli, 1992). Since there are several challenges in displaying tensor data, the concept of diffusion ellipsoids has been proposed (Basser et al., 1994). The Eigendiffusivities of these ellipsoids represent the unidimensional diffusion coefficients in the main direction of diffusivities of the medium, i.e., the main axis of the ellipsoid represents the main diffusion direction in the voxel which coincides with the direction of the fibers, while the eccentricity of the ellipsoid provides information about the degree of anisotropy and its symmetry. Therefore, diffusion anisotropy metrics such as the fractional anisotropy (FA) could be defined for the parameterization of the voxel tensors (Le Bihan et al., 2001). Advanced techniques like Q-ball imaging (Tuch, 2004) may provide more sensitive white matter descriptors in single patients and lead to generalized measures of fractional anisotropy (Corbo et al., 2014). Thus, the clinical role of DTI in various disease processes, especially NDDs, is emerging (Tae et al., 2018).
These DTI-based metrics have shown to map age-related alterations over the life span in the human brain; such age-dependent changes also seem to exhibit regional differences with respect to the brain anatomy (Salat et al., 2005; Westlye et al., 2010). Furthermore, a regional tract-specific age dependency which requires also non-linear corrections for different age ranges has been demonstrated (Behler et al., 2021). Based on these findings, DTI also acts as a cross-validation technique for age-dependent cerebral blood flow alterations in the human brain (Damestani et al., 2024).
2.2 DTI protocol
Standardized DTI protocols will, at least currently, be performed at 1.5 T or 3.0 T clinical scanners, because scanners with higher magnetic field (ultrahigh field scanners) would provide better signal-to-noise ratio but are still rare and hardly available for multicenter trials. The protocols include full-brain coverage using a 2-D echo planar imaging sequence; about axial 70 slices, slice thickness 2.0 mm, voxel size 2.0 × 2.0 × 2.0 mm3, field of view 256 × 256 mm2, matrix 128 × 128, five b0 images, and 30 or more diffusion gradient directions with a b value of 1,000 s/mm2. The recording of more than one b0 image could help to improve the signal-to-noise-ratio (SNR). Good examples of standardized prospective multicenter protocols are provided in (Hobbs et al., 2015 – HD; Nir et al., 2015 – AD; Kalra et al., 2020 – ALS). However, a major drawback of DTI is that it assumes a single water pool with Gaussian diffusion in each voxel and does not account for structural heterogeneity which reduces the specificity of the derived indices (Alexander et al., 2001; Basser and Jones, 2002), neurite orientation dispersion and density imaging (NODDI) is a multishell diffusion technique (Zhang et al., 2012) that assumes further types of microstructural environments and could easily be added to a standardized DTI protocol, if b-values of 2000 s/mm2 are available.
For the application of fiber tracking (Mori and van Zijl, 2002), differently oriented fiber bundles inside one voxel are incorrectly modeled by a single tensor. High Angular Resolution Diffusion Imaging (HARDI) aims at using more complex models, such as a two-tensor model, for estimating two fiber bundles (Caan et al., 2007). Although standard DTI is an established default tool, acquisition with stronger diffusion weightings beyond the DTI regimen is now possible by NODDI, that way enabling even more detailed characterization of tissue microstructures, e.g., in the early diagnosis of AD (Takahashi et al., 2024) or tau deposition in AD (Weston et al., 2023).
The schedule of visits could be optimized taking possible costs and patient burden into account. Repeated DTI scans during one given subject’s visit could significantly improve the effect size (Behler et al., 2022a). Thus, it is recommended to increase the number of DTI scan repetitions at one visit. Note that the scans should be independent, i.e., subject repositioning in the scanner is recommended.
For longitudinal studies in NDD with a rapidly progressive disease course, e.g., ALS, one baseline and two follow-up visits were advised over a total observation period of about 12 months (time interval between baseline and follow-up 2) to monitor the course of disease (e.g., Cardenas-Blanco et al., 2016; Kassubek et al., 2018; Kalra et al., 2020). For longitudinal studies in NDD with a slowly progressive disease course, multiple follow-up scans are possible and could even be spread over several years, e.g., in PD with one baseline and two follow-up visits 6 years apart (Shih et al., 2023).
Independent of the progression rate, it has to be noted that, if one baseline and two follow-up scans are recorded, the first follow-up visit is suggested to balance observing change and minimizing attrition so that the individual schedule should be such that the timing of follow-up 1 does not bisect the entire observation period between baseline and follow-up two. The unfavorable choice of a symmetrical bisectioning of the observation interval was demonstrated in a cohort of HD patients with one baseline and 2 follow-up scans (Müller et al., 2021). The shortcoming with splitting the observation time into two identical periods is that regression models, due to their intrinsic properties, underweight follow-up visit 1, with the result that the progression slope is mainly determined by baseline and follow-up 2.
2.3 Quality control
In addition to common MRI artifacts (truncation, aliasing, chemical shift, banding, pile-up, blurring, spikes, etc.) (Krupa and Bekiesińska-Figatowska, 2015), there are specific challenges that one may encounter when using MRI scanner gradient hardware for diffusion MRI, especially in terms of eddy currents and sensitivity to motion (Le Bihan et al., 2006). According to an established quality control protocol (Dubois et al., 2014; Müller et al., 2014), corrupted gradient directions as well as motion artifacts could be excluded and corrupted slices or volumes could be resampled from further analysis prior to correction of eddy current-induced geometric distortions (Shen et al., 2004). In particular, if the analysis focuses on one parameter like FA, the omission of single GD has only little effect on the result and thus the omission of corrupt GD allows a more precise determination of the resulting values.
2.4 Subject samples
2.4.1 Effect size and sample size calculations
The effect size is estimated by Cohen’s d, i.e.,
with
Sample size calculations usually were based on a two-sided significance level (α) of 5% and a power (1-β) of 80%. Then, the sample size n could be calculated by Kadam and Bhalerao (2010)
and with Za = 1.96 and Z1-β = 0.84, the sample size could be approximated to
Effect size and sample size calculations for cross-sectional comparisons yield an estimation of baseline effects in a clinical study, whereas estimates for longitudinal comparisons yield effect sizes and sample sizes required to observe time-dependent changes.
To obtain maximum effect sizes [high values of d (Eq. 1)] in clinical trials, high differences between the mean values (of any quantity) of NDD patients and controls should be obtained. It is of high relevance, however, to obtain minimum standard deviations [σ (Eq.1)]. This minimization is discussed in the following.
2.4.2 Selection of subject samples for clinical trials
In order to be able to identify a disease-specific alteration (in a given parameter), an optimized and representative control sample should be used. Both inter-subject variability, scanner and environmental noise as well as subject motion or ad hoc scan specific noise contribute to the DTI signal (Müller et al., 2014).
The averaged recorded signal of a group of N subjects (each with one scan) can be split into (Note: in the following, is assumed)
with.
Si are the individual measured signals for the respective subject.
; Li are the individual system noise values for a single scan including partial volume effects due to different subject positioning.
; ΔGi are the individual disease related alterations for the respective subject; ΔGi = 0 for controls; for NDD patients ΔGi are assumed to be considerably larger than the age-related alterations.
; Fi are the individual values of a parameter for the respective subject.
Fi can be split into a mean value (representing the “normal” value of a parameter) and the individual variability ΔFi
are the individual values of a parameter for the respective subject.
Now, the effect size of a two sample (NDD patients and controls) study is
Thus,
That way the noise and inter-individual variability are contained times.
Coherent signal averaging can be expressed by Rompelman and Ros (1986)
with a root mean square value of the noise of σN, i.e., after N averages (normally distributed values), the SNR scales as
Based on studies in a completely different field of research, that is the optimization of averaged heartbeats, there are techniques that allow an optimized representative data collective to be selected from a larger data collective of controls (Mühler and von Specht, 1999; DiPietroPaolo et al., 2005). That way, the variability of any parameter from the control sample could be reduced. This reduction of variability includes inter-subject variability as well as scanner and environmental noise. The simplest technique is to use median and two-sided 80% percentile, more effective is the use of a categorized clustering (DiPietroPaolo et al., 2005) (schematic illustration in Figure 1) to obtain a maximum SNR.
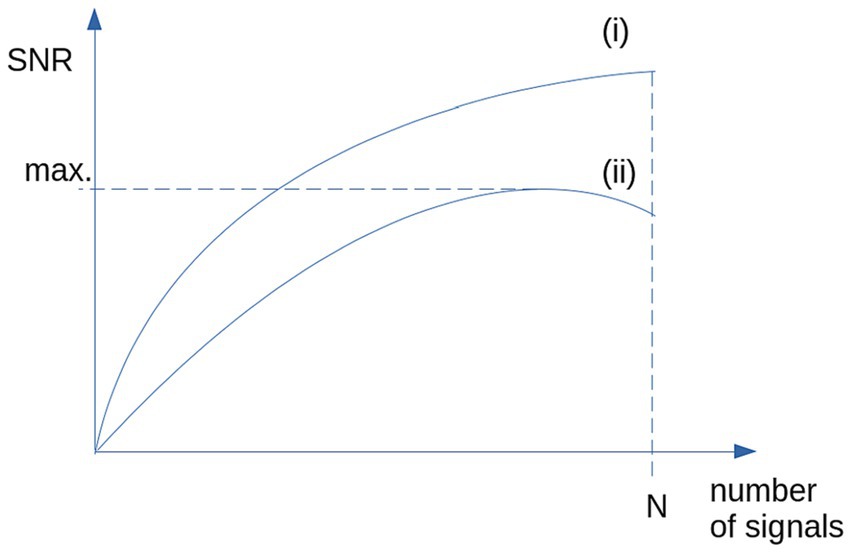
Figure 1. Schematic illustration of the SNR: (i) SNR is growing with N for the case of identical signals and stationary, normally distributed noise. (ii) For non-stationary noise (i.e., high inter-subject variability), SNR shows a maximum for selected signals (e.g., by categorized clustering).
When applying the percentile criterion or a categorized clustering approach, Eq. 5 is replaced by
where p is a value between 0 and 1, representing the amount of averaged data. Then, also the system noise is altered:
That way, as the mean value of the controls is approximately stable and the standard deviation of controls is reduced, higher effect sizes could be obtained. Thus, the following recommendation can be given: in case of a high variability in the controls` data (also caused by outliers), the appropriate reduction of the control sample toward a more representative one leads to an increase in the effect size. In a given study, the careful selection of a representative controls sample could be more effective in terms of effect size optimization than merely increasing the number of controls by an unselective inclusion into the study.
The same considerations apply to the patient sample, with a high grade of inter-individual variability particularly in brain regions that are affected at variable degrees by the given NDD. Nevertheless, attention should be directed to careful patient selection based on the research question, also excluding patients with additional medical conditions if necessary.
That way, the noise and inter-individual variability are contained times ( ) and the effect size (Eq. 7) is increased. Furthermore, (Eq. 7) is also reduced, that way increasing the effect size.
2.4.3 What can we gain from longitudinal scans of controls?
Longitudinal scans of controls (when age-related alterations can be neglected, e.g., scans within time intervals in the range of months) mainly provide the following information:
i. estimation of system noise (Eq. 4).
ii. estimation of inter-individual variability.
iii. longitudinal alterations of controls (at the group level) – these should be negligible over such a short period.
Longitudinal alterations in controls should have no impact on the further analysis. The comparison of longitudinal alterations in patients and in controls is therefore dominated by system noise (i) and inter-individual variability (ii). Therefore, it is recommended that efforts should be spent in accumulating a high amount of different controls at baseline (rather than longitudinal scans of controls), both to increase the SNR and to decrease the variability in signals of controls.
As a consequence, system noise (i) and inter-individual variability (ii) together could be used at the group level to act as a “detection threshold,” i.e., only longitudinal alterations in patients that exceed this threshold are defined as “detectable.”
3 Postprocessing-related contributions to results of DTI studies in NDD: options of optimization
3.1 DTI data analysis
Considering the effect of experimental noise on DTI metrics (Bastin et al., 1998; Seo et al., 2019), statistical analysis is provided by several software packages [e.g., Statistical Parametric Mapping (SPM) (Penny et al., 2006), FMRIB Software Library (FSL) (Jenkinson et al., 2012), Tensor Imaging and Fiber Tracking (TIFT) (Müller et al., 2007)]. Analysis could be performed as unbiased whole brain-based voxelwise comparison of DTI metrics (Müller et al., 2014), or as hypothesis-guided region of interest (ROI) or tract of interest (TOI) analyses [tract-based spatial statistics (TBSS) (Smith et al., 2006) or tractwise fractional anisotropy statistics (TFAS) (Mueller et al., 2007)]. Analyses pipelines combining several toolboxes have also been introduced (e.g., Cui et al., 2013; Soares et al., 2013).
The principles of microstructural analysis by DTI have been taken use of in many mono-and multicenter studies in NDD:
– AD (e.g., Nir et al., 2015 – multicenter (FSL, TBSS); Douaud et al., 2011; Bourbon-Teles et al., 2023; Zhang and Zhan, 2023 – monocenter (TBSS); Chen Y. et al., 2023 – review; Takahashi et al., 2024 – NODDI).
– ALS [e.g., Canu et al., 2011 – monocenter (in house); Corbo et al., 2014 (TBSS); Basaia et al., 2019 – review; Kalra et al., 2020 – multicenter (TIFT); Turner et al., 2011; Filippi et al., 2015].
– HD [e.g., Douaud et al., 2009; Gregory et al., 2015; Zhang J. et al., 2018 – multicenter (in house, FSL)].
– PD [e.g., Gorges et al., 2019 – multicenter (TIFT); Zhang and Burock, 2020 – review; Shih et al., 2023 – monocenter (FSL)].
The cross-sectional comparison of NDD patient groups to healthy controls aims at the definition of specific brain regions and the related patterns of alterations. Beyond this initial cross-sectional research in specific NDDs, a “pseudo-longitudinal” analysis of DTI could be performed: cross-sectional results could also be further analyzed by taking the disease status of the individuals as time-axis in order to map increasing alterations or spreading patterns during the course of ALS (Kassubek et al., 2014; Müller et al., 2023) or association patterns similar to the neuropathological Braak staging of AD (Wen et al., 2021) could be analyzed. Meta-analyses of DTI metrics in PD contribute to increasing the knowledge of PD pathophysiology by addressing the possibility of follow-up of the disease severity and associated brain structural modulations using in vivo imaging (Atkinson-Clement et al., 2017).
3.2 Statistical analysis
In case of unequal sample sizes, the Welch-test should be used which is an adaption of Student’s t-test and is more reliable when the two samples have unequal variances. Welch’s t-test defines the statistic by
with
Prior to statistical analysis, input data should be tested for normal distribution. In case of not normally distributed data, the samples should first be checked with regard to their distribution and the contributing data (see subsection “Selection of subject samples for clinical trials”) and, if not normally distributed, non-parametric testing, e.g., Mann–Whitney U-test, should be applied.
3.3 Advantage of comparisons of longitudinal data with a control data set at baseline
Previous studies that analyzed longitudinal alterations in ALS patients (Zhang et al., 2016; Kassubek et al., 2018; Kalra et al., 2020; Shih et al., 2023) calculated the effect size of longitudinal differences in a given DTI metric by
with
are the average longitudinal alterations in controls and in NDD patients at the group level. Note: in this approach a longitudinal time interval normalization is necessary (Kassubek et al., 2018).
Eq. 13 can be written as
Now, the effect size of a two sample (NDD patients and controls) study is
That way the noise and inter-individual variability are contributing
This approach also takes longitudinal alterations in controls into account, that way, mainly incorporating additional noise components due the information input of longitudinal scans of controls. Since the target is the detection of alterations in NDD patients (see subsection “What can we gain from longitudinal scans of controls?”), the alterations of inter-subject variability of controls (as obtained from longitudinal scans of controls) is off target and would only lead to an additional noise component in the results.
An alternative approach (e.g., Cardenas-Blanco et al., 2016; Loane et al., 2016) is to analyze data without follow-up control visits; then, Eq. 15 simplifies to
Then the noise and inter-individual variability are contained times. This approach (ideally with a large control sample at baseline) shows a higher impact on the effect size as .Thus
However, this approach without follow-up of the controls is particularly suitable for cross-sectional comparisons of each visit to a (large) database of controls (Eq. 7) so that optimal effect size can be obtained at any visit. This is particularly suitable for a 3-D visualization of longitudinal alterations (unbiased whole brain-based voxelwise analysis) or for the display of longitudinal changes in defined structures (e.g., Cardenas-Blanco et al., 2016). That means that higher effect sizes could be gained when data of each visit (of NDD patients) are compared to a (large and optimized) control sample at baseline.
3.4 Multiparametric statistics and application of artificial intelligence
Multiparametric or multimodal imaging has a high impact on the quality and reliability of results. The investigation of the relationship between WM alterations with further factors (atrophy, vascular disease, or, e.g., amyloid burden) and clinical features increases the set of analyzed parameters and thus offers possibilities to apply methods of multiparametric analyses, e.g., in AD and Lewy body dementia (Donaghy et al., 2020). Recent multiparametric analyses showed no association between multiple biomarkers of cerebral microvascular function and WM connectivity (using DTI to quantify the number and organization of WM connections) in a large cohort of some thousand participants (Beran et al., 2024), however, further MRI techniques to assess blood–brain-barrier permeability or cerebrovascular reactivity and microvascular perfusion at the tissue level could be combined with WM connectivity analysis of DTI (Beran et al., 2024). Multimodal association analyses of DTI with amyloid beta and tau positron emission tomography (PET) show potential to provide information relating to underlying tau deposition in AD (Weston et al., 2023).
DTI can be used to tract-wise map correlates of the sequential disease progression and, therefore, to assess disease stages, e.g., in ALS (Kassubek et al., 2014, 2018). A technical improvement in reliability of the analysis was reached by applying a multistage classifier based on Bayesian statistics (Behler et al., 2022b) with the significant advantage of Bayesian statistics for multimodal issues by incorporating prior knowledge about the patient into the algorithm.
A multiparametric set of variables (including the predictive value of microstructural integrity) could be used for association with clinical phenotype features like cognitive performance (Power et al., 2019), the improvement of diagnostic accuracy (Piersson et al., 2021), or to assess the predictive value on survival (Agosta et al., 2019; Kuan et al., 2023) in NDD.
The predictive value of microstructural integrity has been used by artificial intelligence (AI) as machine learning (ML) tools; especially convolutional neural networks (CNN), support vector machines (SVM), and random Forrest models (RFM) successfully contributed to neuroimaging studies in NDDs.
3.4.1 Convolutional neural networks
Convolutional neural networks consists of neurons in different layers, where the restriction of a set is defined by the number of neurons in the output layer. The restriction is primarily based on the weights and connections of individual neurons and their interdependencies (Le Cun et al., 2015). Neurons are essentially functions, often similar to XOR or functions and have a weight that can be interpreted as a threshold potential to be crossed by the input values.
Multi-Kernel CNN can accurately identify AD and mild cognitive impairment (MCI) features from DTI data, and the generated fiber probability map can represent the risk status of AD and MCI (Deng et al., 2023). A two-layer stacking ensemble learning framework with fusing multimodal features has been developed for accurately identifying early PD from healthy controls by combining several AI algorithms. This model performed an accuracy of 96.88%, a precision of 100% (Yang et al., 2021a).
3.4.2 Support vector machines
In SVMs, a set of parameters is divided into separate groups by a hyperplane (Noble, 2006). This hyperplane is generated by vectors, derived by differentiating parameters associated with a clinical target. The hyperplane is optimized as a decision boundary in a multidimensional space through an AI training process.
Discrimination of NDD patients from controls could be performed by the application of an SVM based on ROI-or TOI-based FA values of previously defined NDD-associated brain structures (AD – Zhang et al., 2011; Houria et al., 2022; PD – Haller et al., 2012; Huang et al., 2023; ALS – Chen et al., 2020; Kocar et al., 2021; Münch et al., 2022).
3.4.3 Random Forrest models
The core of the RFM is the creation of multiple decision trees during the training phase. Each tree is constructed using a random subset of the training data and features, following the principle of bootstrapping (Breiman, 2001); the algorithm incorporates randomness in two primary aspects:
(i) Data Sampling (Bootstrap Aggregating or Bagging): Each decision tree is trained on a randomly sampled subset of the data, known as a bootstrap sample. This sampling ensures diversity among the trees. (ii) Feature Selection: At each split in a tree, a random subset of features is considered. This randomness in feature helps to reduce variance between trees, thereby increasing the overall robustness of the model.
Successful applications of RFM to DTI data from NDD patients were performed in AD (Yang J. et al., 2022), PD (Chen B. et al., 2023), and ALS (Sarica et al., 2017), each discriminating NDD from controls with high accuracy.
3.5 Harmonization of data in multicenter trials
Especially in multicenter trials, different factors may contribute to the variability of DTI data of controls and NDD patients. Although the precise influence of each source of variation could not be delineated, investigating group FA differences between patients and controls on systematic between-center differences should be investigated prior to pooling across centers. Furthermore, center-specific sources of variability on DTI metrics, e.g., scanner-specific variability, environmental noise and specific factors such as scanning time, might be present in single center studies but will only slightly influence comparisons at the group level (Müller et al., 2013). Although multicenter studies could allow a direct merging of DTI metrics across centers (Müller et al., 2013), especially in case of different scan protocols, merging of DTI metrics requires the application of a strategy to regress out confounders such as field strength, echo time, or number of gradient directions (Müller et al., 2016). Especially, FA is influenced by the voxelsize (Oouchi et al., 2007) and thus needs harmonization in case of different scan protocols in different centers. Harmonization could be performed by 3-D voxelwise linear correction matrices (Rosskopf et al., 2015); recently, a post-processing technique based on rotation invariant spherical harmonics features was introduced to mitigate cross-scanner differences in DTI metrics (De Luca et al., 2022).
The development of a Domain Shift Analyzer for MRI (DSMRI) which was designed explicitly for multicenter MRI datasets (Kushol et al., 2023a,b) allows for the identification of NDD as demonstrated for ALS cases (Kushol et al., 2023c), thus offering the possibility to investigate neuroimaging modalities like functional MRI (fMRI) and DTI within a similar environment.
4 Discussion
4.1 Summary of recommendations for a standardized DTI scan protocol and DTI analysis
In addition to the hardware and software already tailored to optimize the SNR of individual recordings by the manufacturer, significant improvements can be achieved in the selection of study participants, the design of the studies, the application of the DTI protocols and the data analysis in pre-and postprocessing with regard to the effect size and thus the sample size in longitudinal clinical studies/trials (Figure 2).

Figure 2. Schematic illustration of optimization options for DTI analysis to establish DTI as a biomarker in NDD. The selection of NDD patients should be optimized to the aim of the study and a representative and matched control sample should be collected. Extending the DTI protocol to a neurite orientation dispersion and density imaging (NODDI) sequence, the repetition of scans at one visit, and an optimized schedule substantially improve the results. Quality control and parameter comparison could lead to drop-outs with the goal to improve the SNR in a study. After (center-, scanner-or protocol-) harmonization, AI/ML methods (with inclusion of additional multimodal analysis parameters) potentially further improve the outcome in a given study. AI, artificial intelligence; CNN, convolutional neural network; FA, fractional anisotropy; GD, gradient direction; ML, machine learning; MRI, magnetic resonance imaging; NDD, neurodegenerative disease; RFM, random forest method; ROI, region of interest; SVM, support vector machine; TOI, tract of interest; WBSS, whole brain-based spatial statistics.
This summary of recommendations was conducted to set up a framework for a standardized DTI scanning and DTI analysis protocol in studies in NDD (Figure 2):
i. The healthy control sample measured at baseline should be representative, i.e., controls should be carefully selected (age-and gender-matched as well as similar level of education and living conditions) and there should be no hesitation in excluding measurements of poor quality from the control sample. Under the condition of outliers or a high variability in controls data, the reduction of the control sample (to a more representative one) leads to an increase in the effect size.
ii. Simulation studies showed that the statistical power of longitudinal DTI studies in NDD can be substantially increased by multiple scans of the same subject per session, especially in limited sample sizes. Such optimized study protocols can help to establish DTI metrics (like FA) as an imaging biomarker in NDD, especially to monitor disease progression in the natural history.
iii. For longitudinal studies in NDD, one baseline and two follow-up visits were advised (especially for diseases with a rapidly progressive disease course) with the individual schedule for NDD patients that the timing of follow-up 1 does not bisect the entire observation period.
iv. For longitudinal analysis, efforts should be spent to an as large as possible control data set at baseline to obtain higher effect sizes by comparison of data of each visit (of NDD patients) to a large and optimized control sample at baseline.
v. A standardized DTI protocol might be extended by additional b-values of up to 2000 s/mm2 to enable NODDI (a multishell diffusion technique) to enable analysis of further types of microstructural environments. Analysis possibilities of NODDI have been demonstrated to provide additional value for evaluation of NDD (Andica et al., 2020).
vi. The inclusion of ML methods in the analysis cascade allows for improved DTI-based analysis of WM integrity and its affectations by NDD (also in a multimodal setting).
For neuroimaging studies as a part of clinical therapeutic trials in NDD, general clinical recommendations should be considered: first, to obtain a homogeneous study population, i.e., the disease progression rate and also the genetic phenotyping of NDD patients should be part of the inclusion/exclusion criteria. Second, primary endpoint and treatment duration must be matched to the study population, especially for slowly progressive NDD patients.
4.2 Effects of data collection on results quality
The potential of DTI-based metrics as a non-invasive progression marker during the disease progression in NDD is influenced by sample size, scheduling of baseline and follow-up sessions, and measurement uncertainty on the statistical power. Especially for measurements with a limited SNR, for example, due to subject-related factors (Müller et al., 2013), the application of the recommendations of this review will potentially strengthen the reliability of the FA values, in line with SNR improvement by signal-averaging during individual scans (Farrell et al., 2007; Seo et al., 2019). Vice versa, the increased statistical power of a DTI protocol means that lower sample sizes might suffice to measure small effects and/or effects after a short time, respectively (Behler et al., 2022a). Another critical factor is the composition of the groups and the selection of the scans to be included in the analysis. Prior to analysis, the restriction to carefully selected patients and controls saves costs and could increase effect sizes, that way also reducing patient burden and increasing subject motivation. It has to be added that data collection (selection of participants) as well as data quality have to be optimized during the process of data acquisition because subsequent ex post facto correction for age, different study protocols and quality control of movements and other artifacts can only partially correct for such deviations and could, thus, never reach the data quality of optimized (standardized) recordings and subject selections.
The technical aspects of planning medical trials listed here can generally be implemented with little effort, but when implemented in full or in part, they have the potential for a significant improvement in results with a simultaneous potential reduction in costs.
4.3 DTI as a tool to distinguish between different NDD
Based on characteristic alteration patterns of cross-sectional comparison of NDD patients to controls, DTI appears to be useful at distinguishing frontotemporal dementia (FTD) from patients with AD, also at the individual level (Grossman, 2010). DTI has shown to be able to classify subjects diagnosed with PD, atypical parkinsonism, and essential tremor and to distinguish them from control subjects (Prodoehl et al., 2013). DTI indicators of white matter impairment have the potential to emerge as useful clinical tools for differentiating diagnostic groups in studies of AD, MCI, and normal aging (Nir et al., 2013, 2015). ALS and FTD encompass a clinical, pathological and genetic continuum, and ALS could be mainly distinguished from ALS with frontotemporal dementia (ALS-FTD) and behavioral variant FTD by different white matter microstructure alteration pattern, especially corticospinal tract degeneration (Lillo et al., 2012).
4.4 Application of machine learning
DTI has been used to study the effects of NDD on neural pathways which may lead to more reliable and early diagnosis of these diseases as well as a better understanding of how they affect the brain. In AD, ML methods were applied for defining DTI metrics (Konukoglu et al., 2016; Lombardi et al., 2020; Xu et al., 2021; Agostinho et al., 2022) to characterize MCI (Velazquez and Lee, 2022; Zhou et al., 2022a,b; Cheng et al., 2023) and to predict AD early (Savarraj et al., 2022). The characterization of MCI and cognitive impairment in PD (Xu et al., 2021; Yang Y. et al., 2022; Chen B. et al., 2023; Huang et al., 2023) or the investigation of progression in PD (Prasuhn et al., 2020; Yang et al., 2021a,b) has also been addressed by the application of ML methods. Furthermore, ML was applied to the differentiation of parkinsonian syndromes (Haller et al., 2012; Du et al., 2017; Chougar et al., 2021; Talai et al., 2021). Since first applications of ML methods to ALS (Welsh et al., 2013; Sarica et al., 2017), ML was used to improve diagnostic accuracy (Kocar et al., 2021; Behler et al., 2023) and clinical associations (Li et al., 2021). For the evaluation of imaging biomarkers in HD, ML methods have been applied for many years (Klöppel et al., 2008; Rizk-Jackson et al., 2011; Hu B. et al., 2023). Thus, ML and AI are exponentially improving medical imaging and diagnosis: by ML techniques (especially SVM or RFM), the combination of multiparametric/multimodal imaging data allow for a multidimensional analysis beyond (simple) association analysis (Tae et al., 2018; Weston et al., 2023; Takahashi et al., 2024). Moreover, CNNs might enable estimations of the risk status, and thus, prediction of the disease course including survival in NDDs (Agosta et al., 2019; Kuan et al., 2023). Altogether, it seems safe to expect that ML methods will help to define the future of DTI-based analysis of WM integrity in the brain and its affectations by NDD.
4.5 Consideration and limitations of the DTI in neurodegenerative diseases
Technical considerations are presented that improve the information contents in DTI recordings and subsequent statistical analysis in clinical DTI-based neuroimaging trials in NDD. In summary, this study and the included recommendations potentially might enhance the role of DTI as a biomarker in NDD by standardized scan protocols and analysis cascades.
Especially AI-based techniques improved the performance of multimodal MRI including DTI in survival prediction and the prognostic value in NDD (Agosta et al., 2019). Furthermore, AI-aided DTI analysis provides high-precision automatic diagnosis and simultaneously output feature probability maps to provide clinical auxiliary diagnosis in NDD (Deng et al., 2023). Thus, there is the urgent need for the translation of advanced brain MRI techniques into clinical practice, e.g., for an assessment of prognostic factors and a stratification of patients in the design of pharmacological trials (Agosta et al., 2019). That way, the predictive value of microstructural integrity by AI-based algorithms, especially in a multiparametric or multimodal setting, could be developed as a non-invasive in vivo biomarker in NDD.
Author contributions
H-PM: Conceptualization, Formal analysis, Methodology, Visualization, Writing – original draft, Writing – review & editing. JK: Conceptualization, Formal analysis, Methodology, Visualization, Writing – original draft, Writing – review & editing.
Funding
The author(s) declare that no financial support was received for the research, authorship, and/or publication of this article.
Disclosure
The authors disclose the use of generative AI and AI-assisted technologies.
Conflict of interest
The authors declare that the research was conducted in the absence of any commercial or financial relationships that could be construed as a potential conflict of interest.
The author(s) declared that they were an editorial board member of Frontiers, at the time of submission. This had no impact on the peer review process and the final decision.
Publisher’s note
All claims expressed in this article are solely those of the authors and do not necessarily represent those of their affiliated organizations, or those of the publisher, the editors and the reviewers. Any product that may be evaluated in this article, or claim that may be made by its manufacturer, is not guaranteed or endorsed by the publisher.
References
Agosta, F., Pagani, E., Petrolini, M., Caputo, D., Perini, M., Prelle, A., et al. (2010). Assessment of white matter tract damage in patients with amyotrophic lateral sclerosis: a diffusion tensor MR imaging tractography study. AJNR Am. J. Neuroradiol. 31, 1457–1461. doi: 10.3174/ajnr.A2105
Agosta, F., Spinelli, E. G., Riva, N., Fontana, A., Basaia, S., Canu, E., et al. (2019). Survival prediction models in motor neuron disease. Eur. J. Neurol. 26, 1143–1152. doi: 10.1111/ene.13957
Agostinho, D., Caramelo, F., Moreira, A. P., Santana, I., Abrunhosa, A., and Castelo-Branco, M. (2022). Combined structural MR and diffusion tensor imaging classify the presence of Alzheimer's disease with the same performance as MR combined with amyloid positron emission tomography: a data integration approach. Front. Neurosci. 15:638175. doi: 10.3389/fnins.2021.638175
Alexander, A. L., Hasan, K. M., Lazar, M., Tsuruda, J. S., and Parker, D. L. (2001). Analysis of partial volume effects in diffusion-tensor MRI. Magn. Reson. Med. 45, 770–780. doi: 10.1002/mrm.1105
Andica, C., Kamagata, K., Hatano, T., Saito, Y., Ogaki, K., Hattori, N., et al. (2020). MR biomarkers of degenerative brain disorders derived from diffusion imaging. J. Magn. Reson. Imaging 52, 1620–1636. doi: 10.1002/jmri.27019
Atkinson-Clement, C., Pinto, S., Eusebio, A., and Coulon, O. (2017). Diffusion tensor imaging in Parkinson's disease: review and meta-analysis. Neuroimage Clin. 16, 98–110. doi: 10.1016/j.nicl.2017.07.011
Basaia, S., Filippi, M., Spinelli, E. G., and Agosta, F. (2019). White matter microstructure breakdown in the motor neuron disease Spectrum: recent advances using diffusion magnetic resonance imaging. Front. Neurol. 10:193. doi: 10.3389/fneur.2019.00193
Basser, P. J., and Jones, D. K. (2002). Diffusion-tensor MRI: theory, experimental design and data analysis - a technical review. NMR Biomed. 15, 456–467. doi: 10.1002/nbm.783
Basser, P. J., Mattiello, J., and LeBihan, D. (1994).MR diffusion tensor spectroscopy and imaging. Biophys. J. 66, 259–267. doi: 10.1016/S0006-3495(94)80775-1
Bastin, M. E., Armitage, P. A., and Marshall, I. (1998). A theoretical study of the effect of experimental noise on the measurement of anisotropy in diffusion imaging. Magn. Reson. Imaging 16, 773–785. doi: 10.1016/S0730-725X(98)00098-8
Behler, A., Kassubek, J., and Müller, H. P. (2021). Age-related alterations in DTI metrics in the human brain-consequences for age correction. Front. Aging Neurosci. 13:682109. doi: 10.3389/fnagi.2021.682109
Behler, A., Lulé, D., Ludolph, A. C., Kassubek, J., and Müller, H. P. (2022a). Longitudinal monitoring of amyotrophic lateral sclerosis by diffusion tensor imaging: Power calculations for group studies. Front. Neurosci. 16:929151. doi: 10.3389/fnins.2022.929151
Behler, A., Müller, H. P., Ludolph, A. C., and Kassubek, J. (2023). Diffusion tensor imaging in amyotrophic lateral sclerosis: machine learning for biomarker development. Int. J. Mol. Sci. 24:1911. doi: 10.3390/ijms24031911
Behler, A., Müller, H.-P., Ludolph, A. C., Lulé, D., and Kassubek, J. (2022b). A multivariate Bayesian classification algorithm for cerebral stage prediction by diffusion tensor imaging in amyotrophic lateral sclerosis. Neuroimage Clin. 35:103094. doi: 10.1016/j.nicl.2022.103094
Beran, M., van Gennip, A. C. E., Stehouwer, C. D. A., Jansen, J. F. A., Gupta, M. D., Houben, A. J. H. M., et al. (2024). Microvascular dysfunction and whole-brain white matter connectivity: the Maastricht study. J. Am. Heart Assoc. 13:e9112. doi: 10.1161/JAHA.123.031573
Bourbon-Teles, J., Jorge, L., Canário, N., Martins, R., Santana, I., and Castelo-Branco, M. (2023). Associations between cortical β-amyloid burden, fornix microstructure and cognitive processing of faces, places, bodies and other visual objects in early Alzheimer's disease. Hippocampus 33, 112–124. doi: 10.1002/hipo.23493
Braak, H., Neumann, M., Ludolph, A. C., Ravits, J., and Del Tredici, K. (2017). Does sporadic amyotrophic lateral sclerosis spread via axonal connectivities? Neurol. Int. Open 1, E136–E141. doi: 10.1007/s00401-016-1633-2
Caan, M. W., de Vries, A. W., Khedoe, H. G., Akkerman, E. M., van Vliet, L. J., Grimbergen, C. A., et al. (2007). Generating fiber crossing phantoms out of experimental DWIs. Med. Image Comput. Comput. Assist. Interv. 10, 169–176. doi: 10.1007/978-3-540-75757-3_21
Canu, E., Agosta, F., Riva, N., Sala, S., Prelle, A., Caputo, D., et al. (2011). The topography of brain microstructural damage in amyotrophic lateral sclerosis assessed using diffusion tensor MR imaging. AJNR Am. J. Neuroradiol. 32, 1307–1314. doi: 10.3174/ajnr.A2469
Cardenas-Blanco, A., Machts, J., Acosta-Cabronero, J., Kaufmann, J., Abdulla, S., Kollewe, K., et al. (2016). Structural and diffusion imaging versus clinical assessment to monitor amyotrophic lateral sclerosis. Neuroimage Clin. 11, 408–414. doi: 10.1016/j.nicl.2016.03.011
Chen, Y., Wang, Y., Song, Z., Fan, Y., Gao, T., and Tang, X. (2023). Abnormal white matter changes in Alzheimer's disease based on diffusion tensor imaging: a systematic review. Ageing Res. Rev. 87:101911. doi: 10.1016/j.arr.2023.101911
Chen, B., Xu, M., Yu, H., He, J., Li, Y., Song, D., et al. (2023). Detection of mild cognitive impairment in Parkinson's disease using gradient boosting decision tree models based on multilevel DTI indices. J. Transl. Med. 21:310. doi: 10.1186/s12967-023-04158-8
Chen, Q. F., Zhang, X. H., Huang, N. X., and Chen, H. J. (2020). Identification of amyotrophic lateral sclerosis based on diffusion tensor imaging and support vector machine. Front. Neurol. 11:275. doi: 10.3389/fneur.2020.00275
Cheng, X., Li, D., Peng, J., Shu, Z., and Xing, X. (2023). Prediction of mild cognitive impairment progression to Alzheimer's disease based on diffusion tensor imaging-derived diffusion parameters: construction and validation of a nomogram. Eur. Neurol. 86, 408–417. doi: 10.1159/000534767
Chougar, L., Faouzi, J., Pyatigorskaya, N., Yahia-Cherif, L., Gaurav, R., Biondetti, E., et al. (2021). Automated categorization of parkinsonian syndromes using magnetic resonance imaging in a clinical setting. Mov. Disord. 36, 460–470. doi: 10.1002/mds.28348
Corbo, D., Caiazzo, G., Trojsi, F., Monsurrò, M. R., Gallo, A., Bonavita, S., et al. (2014). Advantages of QBI in TBSS analyses. Magn. Reson. Imaging. 32, 184–189. doi: 10.1016/j.mri.2013.09.002
Cui, Z., Zhong, S., Xu, P., He, Y., and Gong, G. (2013). PANDA: a pipeline toolbox for analyzing brain diffusion images. Front. Hum. Neurosci. 7:42. doi: 10.3389/fnhum.2013.00042
Damestani, N. L., Jacoby, J., Michel, C. B., Rashid, B., Salat, D. H., and Juttukonda, M. R. (2024). MRI assessment of cerebral white matter microvascular hemodynamics across the adult lifespan. J. Magn. Reson. Imaging. doi: 10.1002/jmri.29217
De Luca, A., Karayumak, S. C., Leemans, A., Rathi, Y., Swinnen, S., Gooijers, J., et al. (2022). Cross-site harmonization of multi-shell diffusion MRI measures based on rotational invariant spherical harmonics (RISH). NeuroImage 259:119439. doi: 10.1016/j.neuroimage.2022.119439
Deng, L., and Wang, Y.Alzheimer’s Disease Neuroimaging Initiative (2023). Fully connected multi-kernel convolutional neural network based on Alzheimer's disease diagnosis. J. Alzheimers Dis. 92, 209–228. doi: 10.3233/JAD-220519
DiPietroPaolo, D., Müller, H. P., and Erné, S. N. (2005). A novel approach for the averaging of magnetocardiographically recorded heart beats. Phys. Med. Biol. 50, 2415–2426. doi: 10.1088/0031-9155/50/10/016
Donaghy, P. C., Firbank, M., Petrides, G., Lloyd, J., Barnett, N., Olsen, K., et al. (2020). Diffusion imaging in dementia with Lewy bodies: associations with amyloid burden, atrophy, vascular factors and clinical features. Parkinsonism Relat. Disord. 78, 109–115. doi: 10.1016/j.parkreldis.2020.07.025
Douaud, G., Behrens, T. E., Poupon, C., Cointepas, Y., Jbabdi, S., Gaura, V., et al. (2009). In vivo evidence for the selective subcortical degeneration in Huntington's disease. NeuroImage 46, 958–966. doi: 10.1016/j.neuroimage.2009.03.044
Douaud, G., Jbabdi, S., Behrens, T. E., Menke, R. A., Gass, A., Monsch, A. U., et al. (2011). DTI measures in crossing-fibre areas: increased diffusion anisotropy reveals early white matter alteration in MCI and mild Alzheimer's disease. NeuroImage 55, 880–890. doi: 10.1016/j.neuroimage.2010.12.008
Du, G., Lewis, M. M., Kanekar, S., Sterling, N. W., He, L., Kong, L., et al. (2017). Combined diffusion tensor imaging and apparent transverse relaxation rate differentiate Parkinson disease and atypical parkinsonism. AJNR Am. J. Neuroradiol. 38, 966–972. doi: 10.3174/ajnr.A5136
Dubois, J., Kulikova, S., Hertz-Pannier, L., Mangin, J. F., Dehaene-Lambertz, G., and Poupon, C. (2014). Correction strategy for diffusion-weighted images corrupted with motion: application to the DTI evaluation of infants' white matter. Magn. Reson. Imaging 32, 981–992. doi: 10.1016/j.mri.2014.05.007
Farrell, J. A. D., Landman, B. A., Jones, C. K., Smith, S. A., Prince, J. L., van Zijl, P. C. M., et al. (2007). Effects of signal-to-noise ratio on the accuracy and reproducibility of diffusion tensor imaging–derived fractional anisotropy, mean diffusivity, and principal eigenvector measurements at 1.5T. J. Magn. Reson. Imaging 26, 756–767. doi: 10.1002/jmri.21053
Filippi, M., Agosta, F., Grosskreutz, J., Benatar, M., Kassubek, J., Verstraete, E., et al. (2015). Progress towards a neuroimaging biomarker for amyotrophic lateral sclerosis. Lancet Neurol. 14, 786–788. doi: 10.1016/S1474-4422(15)00134-9
Gorges, M., Müller, H. P., Liepelt-Scarfone, I., Storch, A., and Dodel, R.LANDSCAPE Consortium, et al. (2019). Structural brain signature of cognitive decline in Parkinson's disease: DTI-based evidence from the LANDSCAPE study. Ther. Adv. Neurol. Disord. 12:1756286419843447. doi: 10.1177/1756286419843447
Gregory, S., Cole, J. H., Farmer, R. E., Rees, E. M., Roos, R. A., Sprengelmeyer, R., et al. (2015). Longitudinal diffusion tensor imaging shows progressive changes in white matter in Huntington's disease. J Huntingtons Dis. 4, 333–346. doi: 10.3233/JHD-150173
Grossman, M. (2010). Biomarkers in frontotemporal lobar degeneration. Curr. Opin. Neurol. 23, 643–648. doi: 10.1097/WCO.0b013e32833fd540
Haller, S., Badoud, S., Nguyen, D., Garibotto, V., Lovblad, K. O., and Burkhard, P. R. (2012). Individual detection of patients with Parkinson disease using support vector machine analysis of diffusion tensor imaging data: initial results. AJNR Am. J. Neuroradiol. 33, 2123–2128. doi: 10.3174/ajnr.A3126
Hobbs, N. Z., Farmer, R. E., Rees, E. M., Cole, J. H., Haider, S., Malone, I. B., et al. (2015). Short-interval observational data to inform clinical trial design in Huntington's disease. J. Neurol. Neurosurg. Psychiatry 86, 1291–1298. doi: 10.1136/jnnp-2014-309768
Houria, L., Belkhamsa, N., Cherfa, A., and Cherfa, Y. (2022). Multi-modality MRI for Alzheimer's disease detection using deep learning. Phys. Eng. Sci. Med. 45, 1043–1053. doi: 10.1007/s13246-022-01165-9
Hu, Z., Sun, P., George, A., Zeng, X., Li, M., Lin, T. H., et al. (2023). Diffusion basis spectrum imaging detects pathological alterations in substantia nigra and white matter tracts with early-stage Parkinson's disease. Eur. Radiol. 33, 9109–9119. doi: 10.1007/s00330-023-09780-0
Hu, B., Younes, L., Bu, X., Liu, C. F., Ratnanather, J. T., Paulsen, J., et al. (2023). Mixed longitudinal and cross-sectional analyses of deep gray matter and white matter using diffusion weighted images in premanifest and manifest Huntington's disease. Neuroimage Clin. 39:103493. doi: 10.1016/j.nicl.2023.103493
Huang, X., He, Q., Ruan, X., Li, Y., Kuang, Z., Wang, M., et al. (2023). Structural connectivity from DTI to predict mild cognitive impairment in de novo Parkinson's disease. Neuroimage Clin. 41:103548. doi: 10.1016/j.nicl.2023.103548
Jenkinson, M., Beckmann, C. F., Behrens, T. E., Woolrich, M. W., and Smith, S. M. (2012). FSL. NeuroImage 62, 782–790. doi: 10.1016/j.neuroimage.2011.09.015
Kadam, P., and Bhalerao, S. (2010). Sample size calculation. Int. J. Ayurveda Res. 1, 55–57. doi: 10.4103/0974-7788.59946
Kalra, S., Müller, H. P., Ishaque, A., Zinman, L., Korngut, L., Genge, A., et al. (2020). A prospective harmonized multicenter DTI study of cerebral white matter degeneration in ALS. Neurology 95, e943–e952. doi: 10.1212/WNL.0000000000010235
Kassubek, J., Müller, H. P., Del Tredici, K., Brettschneider, J., Pinkhardt, E. H., Lulé, D., et al. (2014). Diffusion tensor imaging analysis of sequential spreading of disease in amyotrophic lateral sclerosis confirms patterns of TDP-43 pathology. Brain 137, 1733–1740. doi: 10.1093/brain/awu090
Kassubek, J., Müller, H.-P., Del Tredici, K., Lulé, D., Gorges, M., Braak, H., et al. (2018). Imaging the pathoanatomy of amyotrophic lateral sclerosis in vivo: targeting a propagation-based biological marker. J. Neurol. Neurosurg. Psychiatry 89, 374–381. doi: 10.1136/jnnp-2017-316365
Klöppel, S., Draganski, B., Golding, C. V., Chu, C., Nagy, Z., Cook, P. A., et al. (2008). White matter connections reflect changes in voluntary-guided saccades in pre-symptomatic Huntington's disease. Brain 131, 196–204. doi: 10.1093/brain/awm275
Kocar, T. D., Behler, A., Ludolph, A. C., Müller, H. P., and Kassubek, J. (2021). Multiparametric microstructural MRI and machine learning classification yields high diagnostic accuracy in amyotrophic lateral sclerosis: proof of concept. Front. Neurol. 12:745475. doi: 10.3389/fneur.2021.745475
Konukoglu, E., Coutu, J. P., Salat, D. H., and Fischl, B.Alzheimer's disease neuroimaging initiative (ADNI) (2016). Multivariate statistical analysis of diffusion imaging parameters using partial least squares: application to white matter variations in Alzheimer's disease. NeuroImage 134, 573–586. doi: 10.1016/j.neuroimage.2016.04.038
Krupa, K., and Bekiesińska-Figatowska, M. (2015). Artifacts in magnetic resonance imaging. Pol. J. Radiol. 80, 93–106. doi: 10.12659/PJR.892628
Kuan, L. H., Parnianpour, P., Kushol, R., Kumar, N., Anand, T., Kalra, S., et al. (2023). Accurate personalized survival prediction for amyotrophic lateral sclerosis patients. Sci. Rep. 13:20713. doi: 10.1038/s41598-023-47935-7
Kushol, R., Luk, C. C., Dey, A., Benatar, M., Briemberg, H., Dionne, A., et al. (2023c). SF2Former: amyotrophic lateral sclerosis identification from multi-center MRI data using spatial and frequency fusion transformer. Comput. Med. Imaging Graph. 108:102279. doi: 10.1016/j.compmedimag.2023.102279
Kushol, R., Parnianpour, P., Wilman, A. H., Kalra, S., and Yang, Y. H. (2023b). Effects of MRI scanner manufacturers in classification tasks with deep learning models. Sci. Rep. 13:16791. doi: 10.1038/s41598-023-43715-5
Kushol, R., Wilman, A. H., Kalra, S., and Yang, Y. H. (2023a). DSMRI: domain shift analyzer for multi-center MRI datasets. Diagnostics (Basel). 13:2947. doi: 10.3390/diagnostics13182947
Le Bihan, D., Mangin, J. F., Poupon, C., Clark, C. A., Pappata, S., Molko, N., et al. (2001). Diffusion tensor imaging: concepts and applications. J. Magn. Reson. Imaging 13, 534–546. doi: 10.1002/jmri.1076
Le Bihan, D., Poupon, C., Amadon, A., and Lethimonnier, F. (2006). Artifacts and pitfalls in diffusion MRI. J. Magn. Reson. Imaging 24, 478–488. doi: 10.1002/jmri.20683
Le Cun, Y., Bengio, Y., and Hinton, G. (2015). Deep learning. Nature 521, 436–444. doi: 10.1038/nature14539
Li, W., Wei, Q., Hou, Y., Lei, D., Ai, Y., Qin, K., et al. (2021). Disruption of the white matter structural network and its correlation with baseline progression rate in patients with sporadic amyotrophic lateral sclerosis. Transl. Neurodegener. 10:35. doi: 10.1186/s40035-021-00255-0
Lillo, P., Mioshi, E., Burrell, J. R., Kiernan, M. C., Hodges, J. R., and Hornberger, M. (2012). Grey and white matter changes across the amyotrophic lateral sclerosis-frontotemporal dementia continuum. PLoS One 7:e43993. doi: 10.1371/journal.pone.0043993
Loane, C., Politis, M., Kefalopoulou, Z., Valle-Guzman, N., Paul, G., Widner, H., et al. (2016). Aberrant nigral diffusion in Parkinson's disease: a longitudinal diffusion tensor imaging study. Mov. Disord. 31, 1020–1026. doi: 10.1002/mds.26606
Lombardi, A., Amoroso, N., Diacono, D., Monaco, A., Logroscino, G., De Blasi, R., et al. (2020). Association between structural connectivity and generalized cognitive spectrum in Alzheimer's disease. Brain Sci. 10:879. doi: 10.3390/brainsci10110879
Mattiello, J., Basser, J. P., and Le Bihan, D. (1994). Analytical expression for the b-matrix in NMR diffusion imaging and spectroscopy. J. Magn. Reson. A 108, 131–141. doi: 10.1006/jmra.1994.1103
Mori, S., and van Zijl, P. C. M. (2002). Fiber tracking: principles and strategies – a technical review. NMR Biomed. 15, 468–480. doi: 10.1002/nbm.781
Moseley, M. E., Cohen, Y., Kucharczyk, J., Mintorovitch, J., Asgari, H. S., Wendland, M. F., et al. (1990). Diffusion-weighted MR imaging of anisotropic water diffusion in cat central nervous system. Radiology 176, 439–445. doi: 10.1148/radiology.176.2.2367658
Mueller, H. P., Unrath, A., Sperfeld, A. D., Ludolph, A. C., Riecker, A., and Kassubek, J. (2007). Diffusion tensor imaging and tractwise fractional anisotropy statistics: quantitative analysis in white matter pathology. Biomed. Eng. Online 6:42. doi: 10.1186/1475-925X-6-42
Mühler, R., and von Specht, H. (1999). Sorted averaging-principle and application to auditory brainstem responses. Scand. Audiol. 28, 145–149. doi: 10.1080/010503999424716
Müller, H. P., Behler, A., Landwehrmeyer, G. B., Huppertz, H. J., and Kassubek, J. (2021). How to arrange follow-up time-intervals for longitudinal brain MRI studies in neurodegenerative diseases. Front. Neurosci. 15:682812. doi: 10.3389/fnins.2021.682812
Müller, H. P., Behler, A., Münch, M., Dorst, J., Ludolph, A. C., and Kassubek, J. (2023). Sequential alterations in diffusion metrics as correlates of disease severity in amyotrophic lateral sclerosis. J. Neurol. 270, 2308–2313. doi: 10.1007/s00415-023-11582-9
Müller, H.-P., Grön, G., Sprengelmeyer, R., Kassubek, J., Ludolph, A. C., Hobbs, N., et al. (2013). Evaluating multicenter DTI data in Huntington’s disease on site specific effects: an ex post facto approach. Neuroimage Clin. 2, 161–167. doi: 10.1016/j.nicl.2012.12.005
Müller, H.-P., Kassubek, J., Grön, G., Sprengelmeyer, R., Ludolph, A. C., Klöppel, S., et al. (2014). Impact of the control for corrupted diffusion tensor imaging data in comparisons at the group level: an application in Huntington disease. Biomed. Eng. Online 13:128. doi: 10.1186/1475-925X-13-128
Müller, H.-P., Turner, M. R., Grosskreutz, J., Abrahams, S., Bede, P., Govind, V., et al. (2016). A large-scale multicentre cerebral diffusion tensor imaging study in amyotrophic lateral sclerosis. J. Neurol. Neurosurg. Psychiatry 87, 570–579. doi: 10.1136/jnnp-2015-311952
Müller, H.-P., Unrath, A., Ludolph, A. C., and Kassubek, J. (2007). Preservation of diffusion tensor properties during spatial normalization by use of tensor imaging and Fiber tracking on a Normal brain database. Phys. Med. Biol. 52, N99–N109. doi: 10.1088/0031-9155/52/6/N01
Münch, M., Müller, H. P., Behler, A., Ludolph, A. C., and Kassubek, J. (2022). Segmental alterations of the corpus callosum in motor neuron disease: a DTI and texture analysis in 575 patients. Neuroimage Clin. 35:103061. doi: 10.1016/j.nicl.2022.103061
Nieuwenhuys, R, Voogd, J, and van Huijzen, C. The human central nervous system. Berlin: Steinkopff-Verlag (2019).
Nir, T. M., Jahanshad, N., Villalon-Reina, J. E., Toga, A. W., Jack, C. R., Weiner, M. W., et al. (2013). Effectiveness of regional DTI measures in distinguishing Alzheimer's disease, MCI, and normal aging. Neuroimage Clin. 3, 180–195. doi: 10.1016/j.nicl.2013.07.006
Nir, T. M., Villalon-Reina, J. E., Prasad, G., Jahanshad, N., Joshi, S. H., Toga, A. W., et al. (2015). Diffusion weighted imaging-based maximum density path analysis and classification of Alzheimer's disease. Neurobiol. Aging 36, S132–S140. doi: 10.1016/j.neurobiolaging.2014.05.037
Noble, W. (2006). What is a support vector machine? Nat. Biotechnol. 24, 1565–1567. doi: 10.1038/nbt1206-1565
Oishi, K., Mielke, M. M., Albert, M., Lyketsos, C. G., and Mori, S. (2011). DTI analyses and clinical applications in Alzheimer's disease. J. Alzheimers Dis. 26, 287–296. doi: 10.3233/JAD-2011-0007
Oouchi, H., Yamada, K., Sakai, K., Kizu, O., Kubota, T., Ito, H., et al. (2007). Diffusion anisotropy measurement of brain white matter is affected by voxel size: underestimation occurs in areas with crossing fibers. AJNR Am. J. Neuroradiol. 28, 1102–1106. doi: 10.3174/ajnr.A0488
Pajevic, S., and Pierpaoli, C. (1992). Color schemes to represent the orientation of anisotropic tissues from diffusion tensor data: application to white matter fiber tract mapping in the human brain. Magn. Reson. Med. 42, 526–540. doi: 10.1002/(SICI)1522-2594(199909)42:3<526::AID-MRM15>3.3.CO;2-A
Penny, W. D., Friston, K. J., Ashburner, J. T., Kiebel, S. J., and Nichols, T. E. (2006). Statistical parametric mapping: the analysis of functional brain images. 1st Edn. Cambridge, Massachusetts, USA: Academic Press.
Pierpaoli, C., and Basser, P. J. (1996). Toward a quantitative assessment of diffusion anisotropy. Magn. Reson. Med. 36, 893–906. doi: 10.1002/mrm.1910360612
Piersson, A. D., Ibrahim, B., Suppiah, S., Mohamad, M., Hassan, H. A., Omar, N. F., et al. (2021). Multiparametric MRI for the improved diagnostic accuracy of Alzheimer's disease and mild cognitive impairment: research protocol of a case-control study design. PLoS One 16:e0252883. doi: 10.1371/journal.pone.0252883
Power, M. C., Su, D., Wu, A., Reid, R. I., Jack, C. R., Knopman, D. S., et al. (2019). Association of white matter microstructural integrity with cognition and dementia. Neurobiol. Aging 83, 63–72. doi: 10.1016/j.neurobiolaging.2019.08.021
Prasuhn, J., Heldmann, M., Münte, T. F., and Brüggemann, N. (2020). A machine learning-based classification approach on Parkinson's disease diffusion tensor imaging datasets. Neurol. Res. Pract. 2:46. doi: 10.1186/s42466-020-00092-y
Prodoehl, J., Li, H., Planetta, P. J., Goetz, C. G., Shannon, K. M., Tangonan, R., et al. (2013). Diffusion tensor imaging of Parkinson's disease, atypical parkinsonism, and essential tremor. Mov. Disord. 28, 1816–1822. doi: 10.1002/mds.25491
Rizk-Jackson, A., Stoffers, D., Sheldon, S., Kuperman, J., Dale, A., Goldstein, J., et al. (2011). Evaluating imaging biomarkers for neurodegeneration in pre-symptomatic Huntington's disease using machine learning techniques. NeuroImage 56, 788–796. doi: 10.1016/j.neuroimage.2010.04.273
Rompelman, O., and Ros, H. (1986). Coherent averaging technique: a tutorial review: Part 1. Noise reduction and the equivalent filter J. Biomed. Eng. 8, 24–29.
Rosskopf, J., Müller, H. P., Dreyhaupt, J., Gorges, M., Ludolph, A. C., and Kassubek, J. (2015). Ex post facto assessment of diffusion tensor imaging metrics from different MRI protocols: preparing for multicentre studies in ALS. Amyotroph. Lateral. Scler. Frontotemporal. Degener. 16, 92–101. doi: 10.3109/21678421.2014.977297
Salat, D. H., Tuch, D. S., Greve, D. N., van der Kouwe, A. J., Hevelone, N. D., Zaleta, A. K., et al. (2005). Age-related alterations in white matter microstructure measured by diffusion tensor imaging. Neurobiol. Aging 26, 1215–1227. doi: 10.1016/j.neurobiolaging.2004.09.017
Sarica, A., Cerasa, A., Valentino, P., Yeatman, J., Trotta, M., Barone, S., et al. (2017). The corticospinal tract profile in amyotrophic lateral sclerosis. Hum. Brain Mapp. 38, 727–739. doi: 10.1002/hbm.23412
Savarraj, J. P. J., Kitagawa, R., Kim, D. H., and Choi, H. A. (2022). White matter connectivity for early prediction of Alzheimer's disease. Technol. Health Care 30, 17–28. doi: 10.3233/THC-192012
Seo, Y., Rollins, N. K., and Wang, Z. J. (2019). Reduction of bias in the evaluation of fractional anisotropy and mean diffusivity in magnetic resonance diffusion tensor imaging using region-of-interest methodology. Sci. Rep. 9:13095. doi: 10.1038/s41598-019-49311-w
Shen, Y., Larkman, D. J., Counsell, S., Pu, I. M., Edwards, D., and Hajnal, J. V. (2004). Correction of high-order Eddy current induced geometric distortion in diffusion-weighted Echo-planar images. Magn. Reson. Med. 52, 1184–1189. doi: 10.1002/mrm.20267
Shih, Y. C., Ooi, L. Q. R., Li, H. H., Allen, J. C., Hartono, S., Welton, T., et al. (2023). Serial deep gray nuclear DTI changes in Parkinson's disease over twelve years. Front. Aging Neurosci. 15:1169254. doi: 10.3389/fnagi.2023.1169254
Smith, S. M., Jenkinson, M., Johansen-Berg, H., Rueckert, D., Nichols, T. E., Mackay, C. E., et al. (2006). Tract-based spatial statistics: voxelwise analysis of multi-subject diffusion data. NeuroImage 31, 1487–1505. doi: 10.1016/j.neuroimage.2006.02.024
Soares, J. M., Marques, P., Alves, V., and Sousa, N. (2013). A hitchhiker's guide to diffusion tensor imaging. Front. Neurosci. 7:31. doi: 10.3389/fnins.2013.00031
Tae, W. S., Ham, B. J., Pyun, S. B., Kang, S. H., and Kim, B. J. (2018). Current clinical applications of diffusion-tensor imaging in neurological disorders. J. Clin. Neurol. 14, 129–140. doi: 10.3988/jcn.2018.14.2.129
Talai, A. S., Sedlacik, J., Boelmans, K., and Forkert, N. D. (2021). Utility of multi-modal MRI for differentiating of Parkinson's disease and progressive Supranuclear palsy using machine learning. Front. Neurol. 12:648548. doi: 10.3389/fneur.2021.648548
Takahashi, H., Takami, Y., Takeda, S., Hayakawa, N., Nakajima, T., Takeya, Y., et al. (2024). Imaging Biomarker for Early-Stage Alzheimer Disease: Utility of Hippocampal Histogram Analysis of Diffusion Metrics. Am. J. Neuroradiol. 45 320–327. doi: 10.3174/ajnr.A8106
Torso, M., Ridgway, G. R., Hardingham, I., Schwarz, A. J., and Chance, S. A. (2022). In vivo detection of changes related to cortical columnar organization and neuroinflammation across the AD continuum. J. Prev Alzheimers Dis. 9, 769–779. doi: 10.14283/jpad.2022.59
Turner, M. R., Grosskreutz, J., Kassubek, J., Abrahams, S., Agosta, F., Benatar, M., et al. (2011). Towards a neuroimaging biomarker for amyotrophic lateral sclerosis. Lancet Neurol. 10, 400–403. doi: 10.1016/S1474-4422(11)70049-7
Velazquez, M., and Lee, Y. (2022). Multimodal ensemble model for Alzheimer's disease conversion prediction from early mild cognitive impairment subjects. Comput. Biol. Med. 151:106201. doi: 10.1016/j.compbiomed.2022.106201
Welsh, R. C., Jelsone-Swain, L. M., and Foerster, B. R. (2013). The utility of independent component analysis and machine learning in the identification of the amyotrophic lateral sclerosis diseased brain. Front. Hum. Neurosci. 7:251. doi: 10.3389/fnhum.2013.00251
Wen, Q., Risacher, S. L., Xie, L., Li, J., Harezlak, J., Farlow, M. R., et al. (2021). Tau-related white-matter alterations along spatially selective pathways. NeuroImage 226:117560. doi: 10.1016/j.neuroimage.2020.117560
Westlye, L. T., Walhovd, K. B., Dale, A. M., Bjørnerud, A., Due-Tønnessen, P., Engvig, A., et al. (2010). Life-span changes of the human brain white matter: diffusion tensor imaging (DTI) and volumetry. Cereb. Cortex 20, 2055–2068. doi: 10.1093/cercor/bhp280
Weston, P. S. J., Coath, W., Harris, M. J., Malone, I. B., Dickson, J., Aigbirhio, F. I., et al. (2023). Cortical tau is associated with microstructural imaging biomarkers of neurite density and dendritic complexity in Alzheimer's disease. Alzheimers Dement. 19, 2750–2754. doi: 10.1002/alz.13011
Xu, X., Wang, T., Li, W., Li, H., Xu, B., Zhang, M., et al. (2021). Morphological, structural, and functional networks highlight the role of the cortical-subcortical circuit in individuals with subjective cognitive decline. Front. Aging Neurosci. 13:688113. doi: 10.3389/fnagi.2021.688113
Yang, J., Sui, H., Jiao, R., Zhang, M., Zhao, X., Wang, L., et al. (2022). Random-Forest-algorithm-based applications of the basic characteristics and serum and imaging biomarkers to diagnose mild cognitive impairment. Curr. Alzheimer Res. 19, 76–83. doi: 10.2174/1567205019666220128120927
Yang, Y., Wei, L., Hu, Y., WuY, H. L., and Nie, S. (2021a). Classification of Parkinson's disease based on multi-modal features and stacking ensemble learning. J. Neurosci. Methods 350:109019. doi: 10.1016/j.jneumeth.2020.109019
Yang, Y., Yang, Y., Pan, A., Xu, Z., Wang, L., Zhang, Y., et al. (2022). Identifying depression in Parkinson's disease by using combined diffusion tensor imaging and support vector machine. Front. Neurol. 13:878691. doi: 10.3389/fneur.2022.878691
Yang, Y., Ye, C., Sun, J., Liang, L., Lv, H., Gao, L., et al. (2021b). Alteration of brain structural connectivity in progression of Parkinson's disease: a connectome-wide network analysis. Neuroimage Clin. 31:102715. doi: 10.1016/j.nicl.2021.102715
Zhang, Y., and Burock, M. A. (2020). Diffusion tensor imaging in Parkinson's disease and parkinsonian syndrome: a systematic review. Front. Neurol. 11:531993. doi: 10.3389/fneur.2020.531993
Zhang, J., Gregory, S., Scahill, R. I., Durr, A., Thomas, D. L., Lehericy, S., et al. (2018). In vivo characterization of white matter pathology in premanifest Huntington's disease. Ann. Neurol. 84, 497–504. doi: 10.1002/ana.25309
Zhang, H., Schneider, T., Wheeler-Kingshott, C. A., and Alexander, D. C. (2012). NODDI: practical in vivo neurite orientation dispersion and density imaging of the human brain. NeuroImage 61, 1000–1016. doi: 10.1016/j.neuroimage.2012.03.072
Zhang, Y., Schuff, N., Woolley, S. C., Chiang, G. C., Boreta, L., Laxamana, J., et al. (2011). Progression of white matter degeneration in amyotrophic lateral sclerosis: a diffusion tensor imaging study. Amyotroph. Lateral Scler. 12, 421–429. doi: 10.3109/17482968.2011.593036
Zhang, Y., Wu, I. W., Tosun, D., Foster, E., and Schuff, N. (2016). Parkinson’s progression markers initiative. Progression of regional microstructural degeneration in Parkinson's disease: a multicenter diffusion tensor imaging study. PLoS One 11:e0165540. doi: 10.1371/journal.pone.0165540
Zhang, Y., and Zhan, F. (2023). Diffusion tensor imaging (DTI) analysis based on tract-based spatial statistics (TBSS) and classification using multi-metric in Alzheimer's disease. J. Integr. Neurosci. 22:101. doi: 10.31083/j.jin2204101
Zhou, Y., Si, X., Chao, Y. P., Chen, Y., Lin, C. P., Li, S., et al. (2022a). Automated classification of mild cognitive impairment by machine learning with Hippocampus-related white matter network. Front. Aging Neurosci. 14:866230. doi: 10.3389/fnagi.2022.866230
Keywords: advances in computational neuroimaging for neurological diseases, magnetic resonance imaging, MRI, diffusion tensor imaging, DTI, neurodegenerative diseases, effect size, signal-to-noise ratio
Citation: Müller H-P and Kassubek J (2024) Toward diffusion tensor imaging as a biomarker in neurodegenerative diseases: technical considerations to optimize recordings and data processing. Front. Hum. Neurosci. 18:1378896. doi: 10.3389/fnhum.2024.1378896
Edited by:
Xing Cheng, The First Affiliated Hospital of Sun Yat-sen University, ChinaReviewed by:
Rohan Gupta, University of South Carolina, United StatesDaniele Corbo, University of Brescia, Italy
Copyright © 2024 Müller and Kassubek. This is an open-access article distributed under the terms of the Creative Commons Attribution License (CC BY). The use, distribution or reproduction in other forums is permitted, provided the original author(s) and the copyright owner(s) are credited and that the original publication in this journal is cited, in accordance with accepted academic practice. No use, distribution or reproduction is permitted which does not comply with these terms.
*Correspondence: Hans-Peter Müller, hans-peter.mueller@uni-ulm.de