Niche characteristics and dynamics of dominant species in arbor layer of 4hm2 Pinus tabuliformis-Quercus wutaishansea mixed forest in Lingkong Mountain
 Lu Ni1
  Donggang Guo
 Quanxi Zhang
- 1College of Environmental and Resource Sciences, Shanxi University, Taiyuan, China
- 2Shanxi Laboratory for Yellow River, Shanxi University, Taiyuan, China
- 3Art and Design Department, Taiyuan University, Taiyuan, China
- 4Taiyue Mountain State-owned Forest Management Bureau of Shanxi Province, Shanxi Forestry and Grassland Bureau, Huozhou, China
The ability of community species to adapt to the environment and use resources and the importance of species in the ecological system in time and space are generally represented by ecological niche. In order to study the niche characteristics and dynamic changes of the dominant species in the arbor layer of the 4hm2 Pinus tabuliformis-Quercus wutaishansea mixed forest sample plot in Lingkong Mountain,and to gain a better understanding of the competition and coexistence among species in the sample plot, this study was conducted based on a typical community investigation. Four indices of important value, niche width, niche overlap, and niche similarity were chosen to calculate and analyze the niche characteristics and examine dynamic changes over a period of 10 years from 2011 to 2021. The results showed that: (1) In 2021, the important values for Quercus wutaishansea and Pinus tabuliformis were 19.906 and 13.906, respectively.The niche widths were 0.962 and 0.555, which showed difference compared to those in 2011. Both were much larger than other species, indicating that they occupied an absolutely dominant position in the community. (2) The mean values of niche overlap and similarity of dominant species in the arbor layer of the Lingkong Mountain sample plot have both increased over the past 10 years. Additionally, the species pairs with the highest overlap and similarity values have changed, suggesting an intensification of competition among these species.
1 Introduction
In the study of ecology, the niche has always been one of the important concepts. It can reveal not only the relationship between species and community stability but also the composition of the ecosystem (Tanentzap et al., 2015). Through niche research, we can gain a deeper understanding of species competition and coexistence within a community. This knowledge allows us to comprehend the structure and stability of the community (Sun et al., 2022). Furthermore, it can be extended to biodiversity research, plant community succession, and forest utilization and protection. At present, research on niches primarily focuses on community composition and characteristics (Xu et al., 2013), spatial structure (Colwell and Futuyma, 1971), and other factors that reflect the fundamental aspects of the community. However, there are few studies on monitoring plant communities in large-scale fixed plots, and limited research on the dynamic changes of niche characteristics. In this study, the niches of dominant species in the arbor layer in 2011 and 2011 were investigated in a fixed plot of 4hm2 Pinus tabuliformis-Quercus wutaishansea mixed forest on Lingkong Mountain, Shanxi Province, China. The results revealed changes in the plant community niche in the sample plot over the past 10 years, which could serve as a reference for future niche studies.
Niche width, niche overlap, and niche similarity are three important concepts in niche research. In general, the wider the niche width, the more intense the competition among species, and the greater the probability of niche overlap (Velázquez et al., 2015). Niche overlap and niche similarity are often utilized to analyze interspecific relationships and contribute to the examination of community succession trends. In previous studies, niche overlap and niche similarity are often used in animal research (Alverson et al., 2001). However, the concept of niche could also be used to explain the biological mechanisms of plant community aggregation and dispersion (Adler et al., 2010). Therefore, the study of niche data is a relatively effective method to indicate the characteristics and dynamic development of plant communities (Lu et al., 2020). The advantage of this method is that it can reflect the degree of resource utilization of different species within the habitat and reveal the role of different populations in community development (Chase and Belovsky, 1994), thereby reflecting the dynamic changes of the entire community.
The research subjects in temperate forest ecology typically consist of trees (Wang et al., 2021). Pinus tabuliformis and Quercus wutaishansea are important components of arbor layers in temperate forests, widely distributed in the North China Plain. The mixed forest of Pinus tabuliformis and Quercus wutaishansea is a typical forest type in Lingkong Mountain Nature Reserve of Shanxi Province. Based on the traditional community quadrat survey, this study monitored a fixed large plot over an extended period and systematically analyzed the recorded data following field investigations. The results reflected the basic situation of the dominant species’ niche in the arbor layer and the dynamic changes over the past 10 years. This information provides a theoretical basis for understanding interspecific competition and symbiosis among different species.
2 Overview of the study area
The 4hm2 Pinus tabuliformis-Quercus wutaishansea mixed forest is situated in Lingkong Mountain Nature Reserve, Qinyuan County, Changzhi City, Shanxi Province, China. It is a typical temperate continental monsoon climate, characterized by high temperatures and rainfall in summer, and cold, dry conditions in winter (Yi et al., 2010). The annual precipitation is about 656.4 mm, the average annual temperature is 8.6°C, and the frost-free period is about 95 days~156 days. The altitude ranges between 1853.5m and 1660.2m, with a complex topography. Meanwhile, the overall trend is low in the north and high in the south. The dominant species of the arbor layer in the plot are Quercus wutaishansea and Pinus tabuliformis. The associated species are Acer tataricum subsp. ginnala, Pyrus betulifolia, Toxicodendron vernicifluum, Fraxinus chinensis and Crataegus kansuensis, etc. Figure 1 shows the geographical location and topographic map of the Lingkong Mountain sample site using ArcMap 10.5.
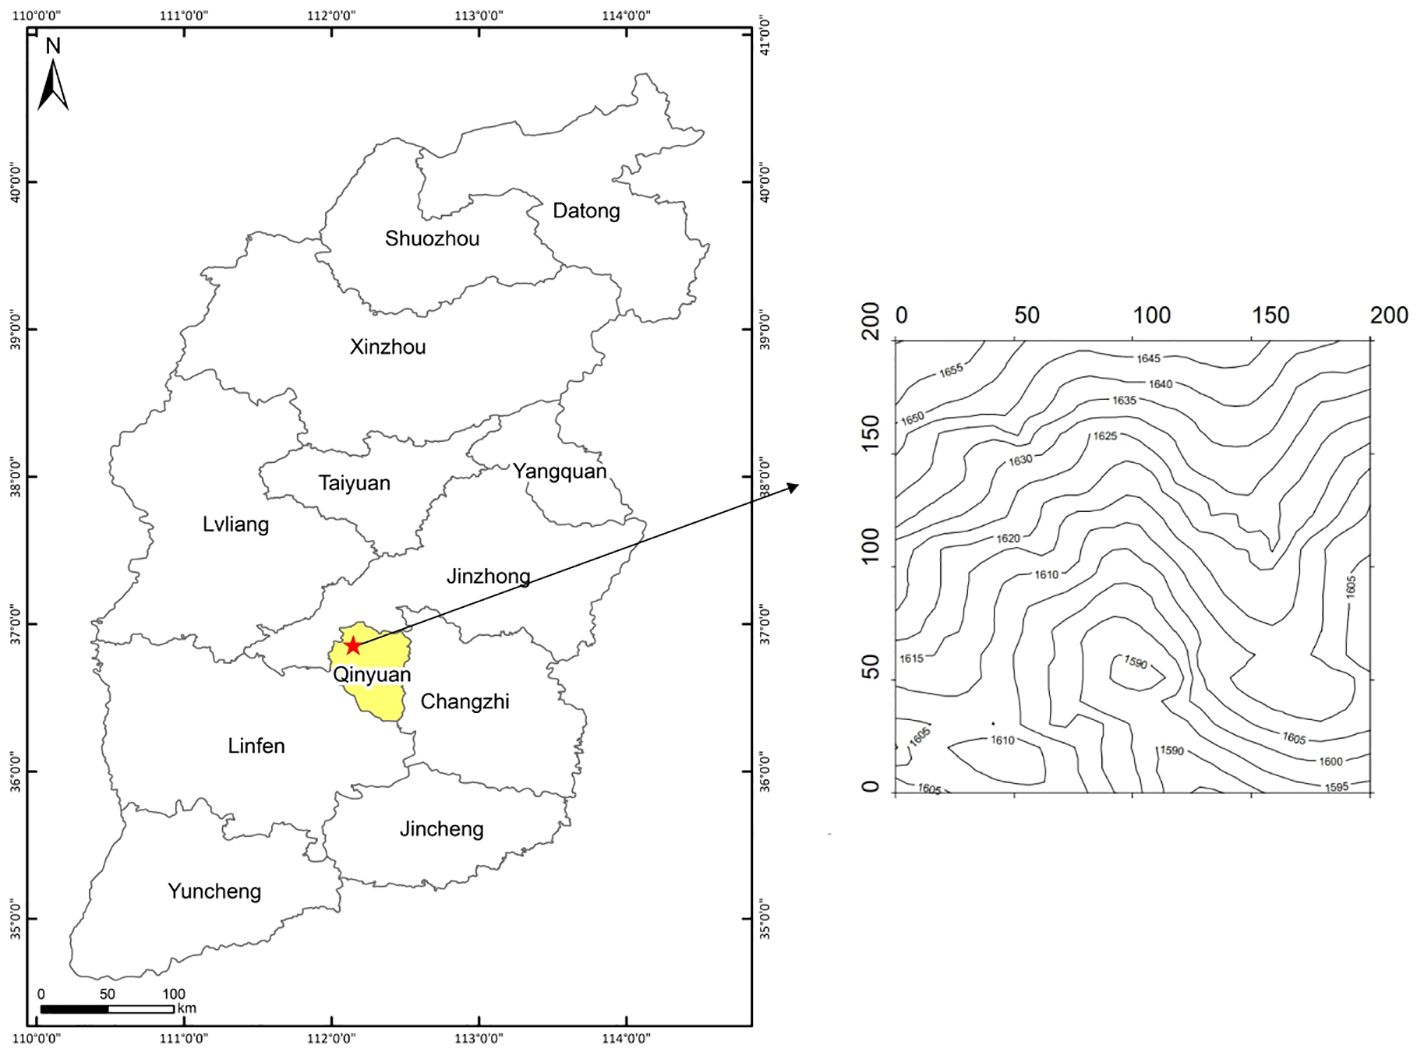
Figure 1 Location and topographic map of Lingkong Mountain sample plot.
3 Investigation methods
3.1 Sample site settings
Based on a survey of a typical community quadrat, all the plants within the quadrat were recorded and classified. This sample plot covered an area of 4hm2, with a total of 400 small plots measuring 10 * 10 meters each. The fixed plots consisted of Pinus tabuliformis and Quercus wutaishansea. In order to establish a sample site with generally consistent habitat conditions, a total station was used to mark points every 10m in the due north and due south directions when designing the sample site, covering a total length of 200m. A sample pile was set up and numbered. This method was repeated until 400 small sample squares were completed. Each plant in every quadrat was meticulously documented, and metal tags were attached to aid in recording during future surveys.
3.2 Community investigation
The sample plot area of this survey was 4hm2, including 400 quadrat plots of 10 * 10 meters. Each quadrat was then divided into four plots measuring 5 * 5 meters. Detailed community investigation was conducted on each quadrat. The coordinates, DBH, tree height, crown width, height under branch, phenological period, and viability of each plant in the sample plot were recorded.
4 Data processing
This data was derived from the general survey of the fixed plot of 4hm2 Pinus tabuliformis-Quercus wutaishansea mixed forest in Lingkong Mountain in 2011 and 2021. Important value, Levins, Shannon niche width index and niche overlap formula were selected to calculate the niche width and niche overlap of arbor layer species in Lingkong Mountain sample plot, and to comprehensively reflect the characteristics of plant community structure in arbor layer and niche characteristics of dominant species in arbor layer. All data were processed and analyzed by Excel 2013, and Origin2023 was applied to map the niche widths, overlapping values and similar values of the dominant species in the arbor layer in the sample plot in 2011 and 2021. The specific calculation method was as follows:
4.1 Important value
The important value was used as a comprehensive index to reflect the characteristics of plant community species (Li et al., 2020). In this study, the mean values of relative height, relative abundance, and relative significance were used as important indicators. The calculation formula is as follows:
In the formula, hi represents the height of species i, ai represents the number of species i, di represents the DBH of species i, and n represents the number of species.
4.2 Niche width
Niche width is an index used to reflect the degree of resource utilization within the territory of different species. It directly and objectively expresses the value and comparison of niche width of each species in the community (Yi et al., 2012; Li and Li, 2021). The specific calculation methods were as follows:
(1) Levins niche width index, calculated by the formula (He et al., 2012):
In the formula, , . Bi represents the niche width of species i; Pij refers to the frequency of utilization of resources j by species i in the total resources; r represents the number of sample plots.
(2)Shannon niche width index:
In the formula, , The range of this equation is [0, log r], which is determined by the importance value in this study. Pij refers to the frequency of utilization of resources j by species i in the total resources; r indicates the number of sample plots.
4.3 Niche overlap
Niche overlap refers to the degree to which two species share the same resources within a specific habitat (Wu and Lu, 2016). The Pianka index was used for calculation, which could objectively reflect the similarity of resource utilization or ecological adaptation among populations and had strong biological significance (Pianka, 1973). The formula is as follows:
Nik refers to the niche overlap index between species i and species k, with a value ranging from 0 to 1. A value of 1 indicates complete overlap of the two species’ niches, while a value of 0 indicates no overlap between the two species’ niches. Pij refers to the frequency of utilization of resources j by species i in the total resources. Pkj is the same, and r represents the number of sample plots.
4.4 Niche similarity
Niche similarity is an important index used to measure the degree of similarity in the utilization of the same resources between species (Liu et al., 2020). The formula is as follows:
Mik is the similarity index between species i and species k, ranging in size from 0 to 1. The larger the value, the greater the degree of similarity between the two species. Pij refers to the frequency of utilization of resources j by species i in the total resources. Pkj is the same, and r is the number of sample plots.
5 Results and analysis
5.1 Dynamic analysis of important value of plant community
In 2021, there were a total of 21,619 trees, 15 families, 19 genera, and 31 species in the 4hm2 mixed forest sample plot of Lingkong Mountain. The important values of each tree species in 2011 and 2021 were calculated according to the formula above. Then, the top 13 species were selected as dominant species and numbered accordingly, as illustrated in Table 1. Important values are calculated by formula (1).
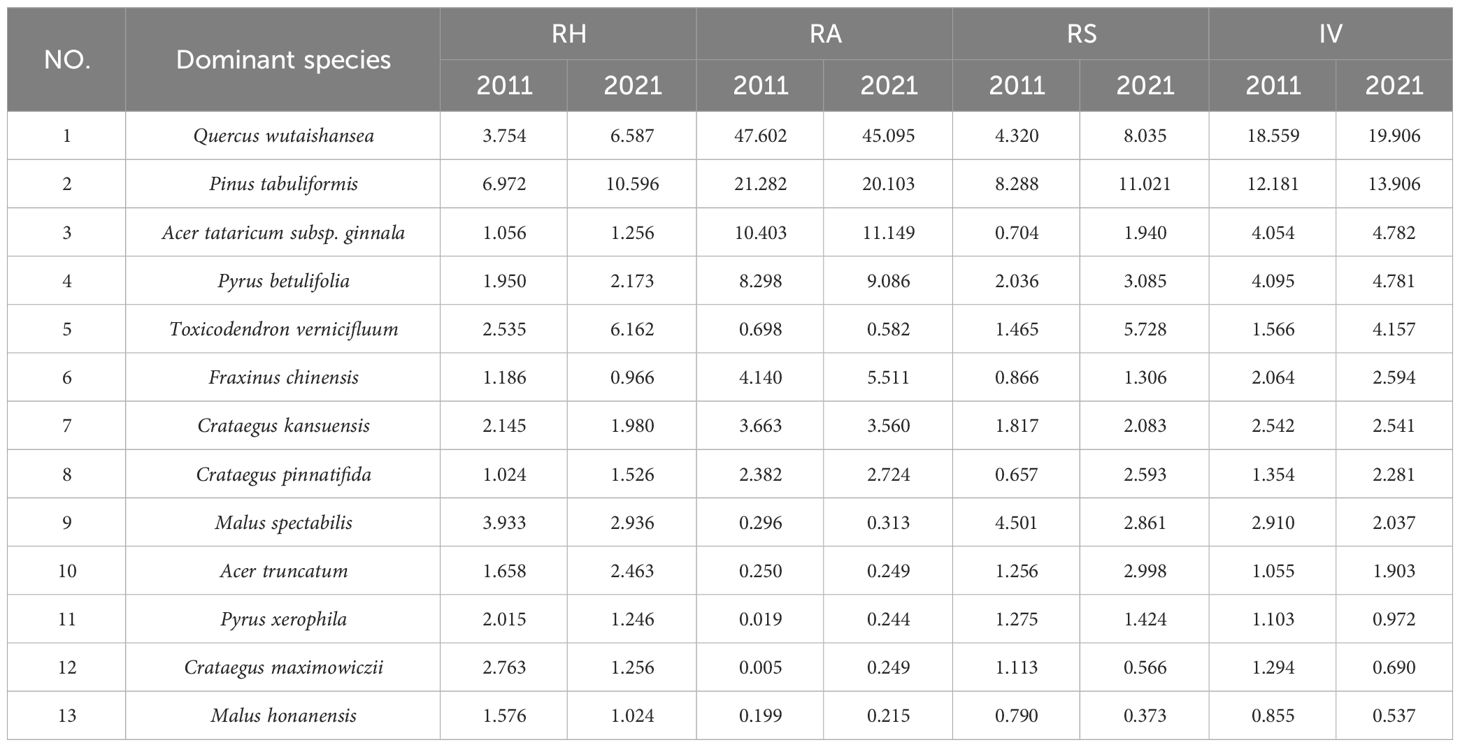
Table 1 Numbers and important values of dominant species in the arbor layer of the sample plot.
As shown in Table 1, the IV of Quercus wutaishansea and Pinus tabuliformis in 2021 were 19.906 and 13.906, respectively, which remained the same as in 2011. These values were significantly higher than those of other species, suggesting that Quercus wutaishansea and Pinus tabuliformis held a dominant position in the Lingkong Mountain sample plot. Their competitiveness for various resources within the community surpassed that of other species, playing a crucial role in the ecosystem. In 2021, the important values of Pyrus xerophila, Crataegus maximowiczii and Malus honanensis were less than 1 in the sample plot. In contrast, in 2011, only Malus honanensis had an IV below 1, indicating that these species did not dominate the whole arbor layer plant community. The important values of other species ranged from 1 to 5, indicating their relatively large presence and dominant position within the community. However, their ability to compete for resources in the sample plot was relatively weak.
Compared with 2011, the important values of Quercus wutaishansea, Pinus tabuliformis, Acer tataricum subsp. Ginnala, Pyrus betulifolia, Toxicodendron vernicifluum, Fraxinus chinensis, Crataegus pinnatifida, and Acer truncatum had increased in 2021.Among them, the increase rate of Toxicodendron vernicifluum’s important value was the largest, which was 2.591. Combined with the growth situation, the increase in relative height (RH) and relative significance (RS) was mainly observed. The average tree height increased by 3.845 meters over 10 years. Among the species studied, Fraxinus chinensis showed the smallest increase (0.530). Notably, the values for Crataegus maximowiczii, Malus honanensis, Pyrus xerophila, Malus spectabilis and Crataegus kansuensis decreased. The most significant decline was observed in Malus spectabilis (0.873), primarily due to reductions in RH and RS. Conversely, the smallest decline was recorded in Crataegus kansuensis (0.001).
5.2 Dynamics of niche characteristics
Niche width could reflect a species’ ability to compete for resources within a specific habitat range, and interspecific competition could reduce niche width to some extent (Parent et al., 2014). Generally, the niche width of dominant species fluctuates less than that of non-dominant species (Hu et al., 2006). Table 2 illustrates the changes in niche width values of the main dominant species in the arbor layer of Lingkong Mountain over the past 10 years.
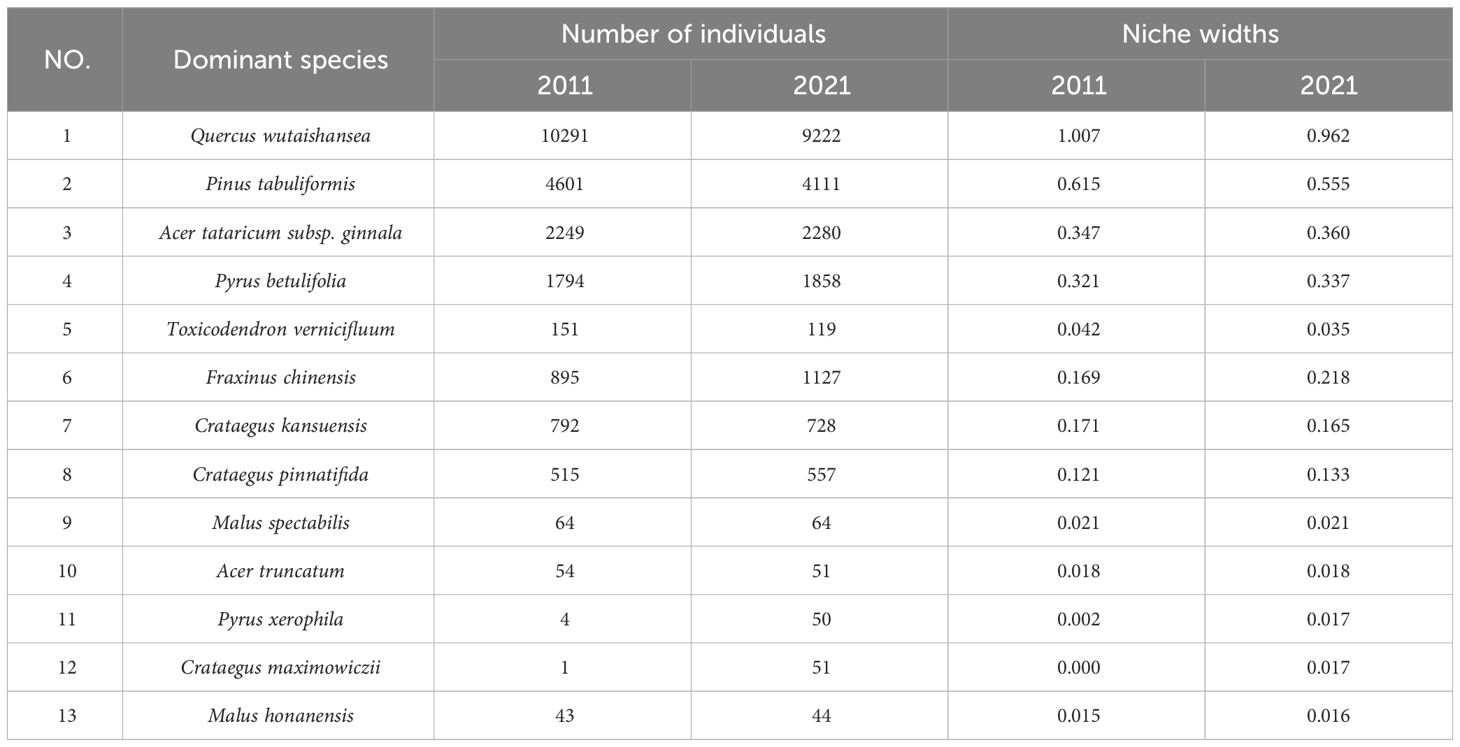
Table 2 Numbers and niche widths of the main dominant species in the arbor layer of the sample plot.
Niche width could be used to measure the degree of resource utilization of the population, and the larger the value, the stronger the adaptability to the environment (Zhang et al., 2016). The values of niche width were calculated by formula (2) and (3). As can be seen from Table 2, the niche width of Quercus wutaishansea was the largest in 2021 (0.962) and was 1.007 in 2011, followed by Pinus tabuliformis (0.555), indicating that they could better utilize various resources in the sample plot and had a larger living space and scope. The niche widths of other species were smaller than those of the two, indicating poorer adaptability to the environment, reduced living space, decreased competition for resources, and lower dominance in the community.
As can be seen from Figure 2, the niche widths of dominant species in the arbor layer in the sample plot did not change significantly overall. The main changes were reflected in the fact that the niche widths of Quercus wutaishansea, Pinus tabuliformis, Toxicodendron vernicifluum and Crataegus kansuensis all decreased in 2021. Among these species, Pinus tabuliformis experienced the largest decrease of 0.059. In combination with the quantitative characteristics, the number in 2011 was 4601, and in 2021, it decreased by 490. This indicates that the decrease in individual numbers eventually led to a reduction in niche width. The largest increase was in Fraxinus chinensis, with a growth of 0.049. In combination with the quantitative characteristics, the number increased to 1127 in the past 10 years, representing a growth of 25.922%, ultimately boosting the niche width value in 2021.
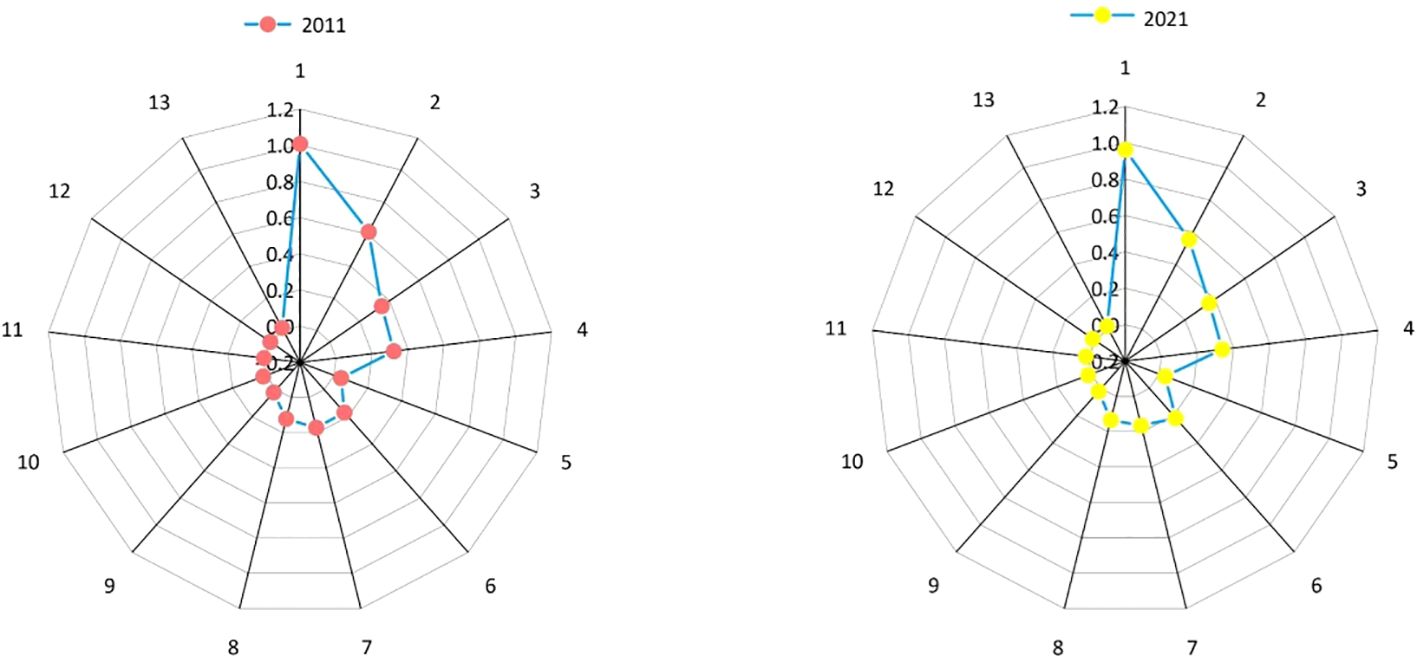
Figure 2 Niche widths of dominant species in the arbor layer in 2011 and 2021.
From the correlation diagram (Figure 3), the niche width and importance value of each dominant species in the arbor layer in the sample plots in 2011 and 2021 showed a significant positive correlation (P< 0.05). In the simulated fitting equation, the slope in 2021 was smaller than that in 2011, indicating that the coefficient of determination in 2011 was larger, and the correlation strength is higher.
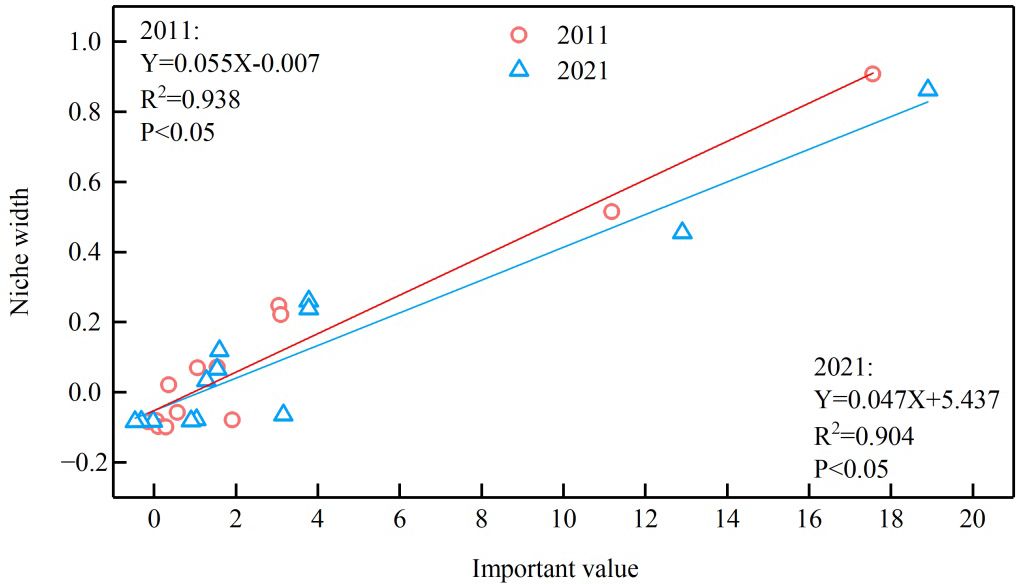
Figure 3 Correlation between important values and niche widths of dominant species in arbor layer in 2011 and 2021.
5.3 Dynamics of niche overlap
Niche overlap refers to the phenomenon where multiple species coexist in the same habitat and compete for shared resources simultaneously (D’Andrea and Ostling, 2017). Thus, the niche overlap of biologically similar species tended to be greater (Elliott and Davies, 2017). Generally speaking, when resources were limited, there would be competition. The higher the degree of overlap, the more intense the competition between species, and the greater the overlap value. If the overlap value was 1, it indicated that the two species shared the same niche, and the niche was completely overlapped, which intensified interspecific competition between them and accelerated the extinction of the species. An overlap value of 0 indicates that the two species have completely different niches, and there is no interspecific competition between them.
The values of niche overlap were calculated by formula (4). Figure 4 shows the values of niche overlap of dominant species in the arbor layer in 2011 and 2021 calculated using the formula above. The average overlap value in 2011 was 0.660, indicating intense competition among the species of the arbor layer in the sample plot. Among the 78 niche overlap indices calculated for 13 dominant species, 75 species pairs (96.154%) had a value greater than 0.2. There were three species pairs with values less than 0.2, which were Fraxinus chinensis-Pyrus xerophila (0.111), Malus spectabilis-Crataegus maximowiczii (0.164), and Acer truncatum-Pyrus xerophila (0.000). The ecological overlap values were much smaller than that of the other species pairs, indicating that the niches of these five species were different, and the degrees of competition for the same resource were relatively small among them. Among the dominant species in the arbor layer, the overlap value between Pinus tabuliformis-Crataegus pinnatifida was the highest (0.999), suggesting that their niche overlap was extremely high and competition was intense.
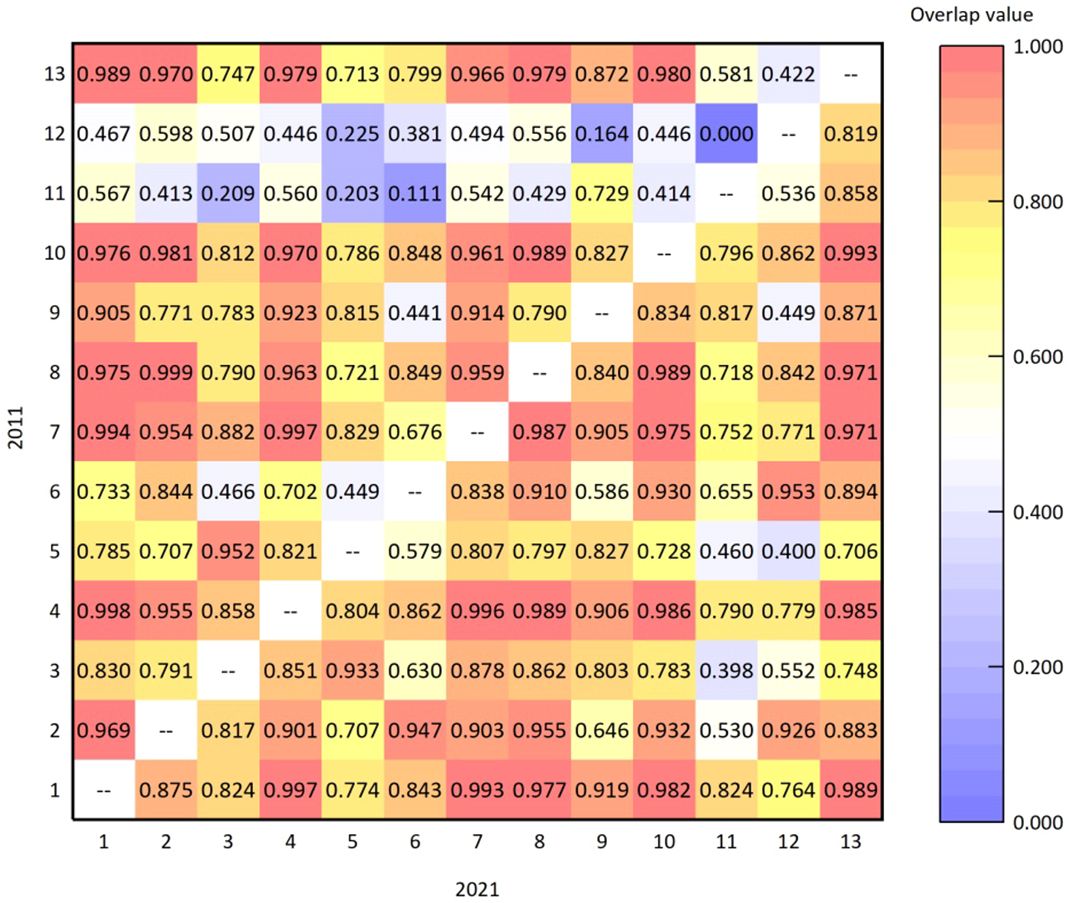
Figure 4 Niche overlap values of dominant species in the arbor layer in 2011 and 2021.
The average niche overlap value of dominant species in the arbor layer of the plot in 2021 was 0.814, which increased from 0.660 in 2011. This indicates that competition among these species in the plot has become more intense over the past 10 years. Among the 78 niche overlap indices, there were 74 species pairs (94.872%) with a value of more than 0.5. The overlap value of Quercus wutaishansea-Pyrus betulifolia (0.997) was the largest among dominant species in the arbor layer, indicating the highest degree of niche overlap and intense competition between them. The species pair with the smallest value was Acer tataricum subsp. ginnala-Pyrus xerophila (0.398), which was slightly smaller than the other species pairs, indicating that the extent of niche overlap between these two species was not very high. The degree of competition for the same resource in the habitat was relatively small.
In the past 10 years, the change in niche overlap values between the main dominant species in the arbor layer of the Lingkong Mountain sample plot has shown an increase in the overall mean value. This suggests that the overall competition among plants in the sample plot has intensified. In addition, the most fiercely competitive species in 2011 were Pinus tabuliformis and Crataegus pinnatifida, while in 2021 they were Quercus wutaishansea and Pyrus betulifolia. Combined with the aforementioned quantitative characteristics, the primary reason for the changes is that, in comparison to other species, the population of Pinus tabuliformis and Pinus tabuliformis and Quercus wutaishansea decreased over the past 10 years, whereas the numbers of Crataegus pinnatifida and Pyrus betulifolia have notably increased. The large-scale changes in individual numbers reflected the intense competition between species, eventually leading to a change in niche overlap value.
5.4 Dynamics of niche similarity
Niche similarity reflects the degree of similarity between two species that use the same resources in the same habitat territory simultaneously. The values of niche similarity were calculated by formula (5). Figure 5 shows the niche similarity values of the main dominant species in the arbor layer of Lingkong Mountain in 2011 and 2021. It can be seen that the mean value of similarity in 2011 was 0.898, indicating that the niche of tree species was generally similar. Among 78 species pairs, 76 pairs with a value of more than 0.5 accounted for 97.436%, indicating that most species had similar ecological niches. There were two pairs with a value of less than 0.5, namely Quercus wutaishansea-Pyrus xerophila (0.497) and Quercus wutaishansea-Crataegus maximowiczii (0.497), accounting for 2.564%. The largest similarity index was 0.999 (Pyrus xerophila- Crataegus maximowiczii), indicating that their niches were very similar. This suggests that the demand for and utilization of resources were also similar, potentially intensifying interspecific competition.
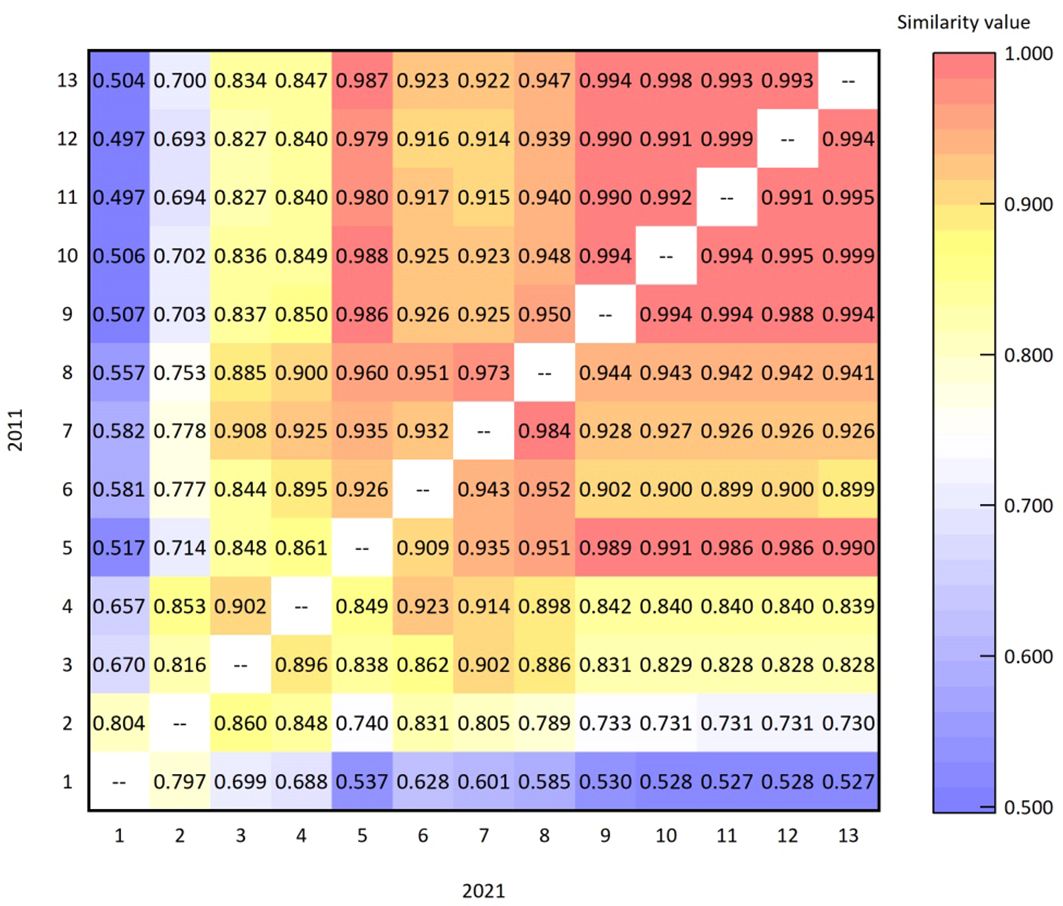
Figure 5 Niche similarity values of dominant species in the arbor layer in 2011 and 2021.
The mean similarity value in 2021 was 0.902, higher than the 0.898 recorded in 2011. In 2021, 78 species pairs had similarity values exceeding 0.5, suggesting a gradual convergence of niches among dominant species in the arbor layer and an intensification of interspecies competition. Among them, the highest similarity index was 0.999 (Acer truncatum-Malus honanensis), indicating that their niches were very similar. This similarity intensified the competition for the same resources within the territory. The similarity indexes of Quercus wutaishansea-Pyrus xerophila and Quercus wutaishansea-Malus honanensis were the lowest among all species pairs (both were 0.527), indicating that their niche similarity was relatively low and the interspecific competition was not particularly fierce.
In the past 10 years, the change in niche similarity values of dominant species in the arbor layer was primarily seen in the increase of the overall mean value. It rose from 0.898 in 2011 to 0.902 in 2021, marking a 0.445% increase. In addition, the species pair with the highest similarity index in 2011 was Pyrus xerophila-Crataegus maximowiczii (0.999), which decreased to 0.991 in 2021. The main reason for the change might be that 46 new plants of Pyrus xerophila and 50 new plants of Crataegus maximowiczii were added in the past 10 years. The number of individuals of both species showed an increasing trend, with little difference in the number of newly added individuals. This indicates that the competition between them had eased, leading to a decrease in the degree of decline. Consequently, the similarity value of this pair declined.
6 Discussion and conclusion
Through the collation and analysis of data up to the present date, it is evident that among the dominant species in the arbor layer of Lingkong Mountain, the highest importance value in 2021 was attributed to Quercus wutaishansea, followed by Pinus tabuliformis. The difference between 2021 and 2011 was not significant, and the values were much higher than those of other species. These results indicate that the two species occupied an absolutely dominant position in the arbor layer of the plot. Their competitiveness for various resources in the plot was far greater than that of other species, and they played an extremely important role in maintaining and developing the community status. This result was consistent with the conclusion drawn by Huo et al. (2014). The importance values of the other species were not more than 5, with the largest being 4.782 (Acer tataricum subsp.). The largest value was 0.637 (Acer ginnala), while the smallest was 0.537 (Malus honanensis). This suggests that Acer ginnala and Malus honanensis were less competitive in resource utilization compared to Quercus wutaishansea and Pinus tabuliformis. They only exhibited a moderate level of dominance and did not fully exploit a wide range of resources.
The niche overlap index reflects the degree of competition between two species for various resources during their lifetime. A larger niche width value often corresponds to a larger niche overlap value, which is consistent with the research results of Gu et al. (Gu et al., 2017). The overlap values of Quercus wutaishansea with other species, which had the largest niche width, were mostly above 0.9. This indicates intense interspecific competition with other species and a significant competition for the utilization of various resources. In the past 10 years, the change in the overlap values of the main dominant species in the arbor layer of Lingkong Mountain was primarily characterized by an increase in the mean value, which rose by 23.333%. In addition, the species pairs with the highest overlap value also changed. In 2011, it was Pinus tabuliformis-Crataegus pinnatifida (0.999), and in 2021, it was Quercus wutaishansea-Pyrus betulifolia (0.997). The main reason for the change might be that the number of individual species involved has changed significantly in the past 10 years.
It was found through calculations that the niche similarity index of dominant species in the arbor layer of Lingkong Mountain sample plot has shown an increasing trend over the past 10 years, with an average value of 0.898 in 2011 and 0.902 in 2021. The species pair with the largest similarity index changed in 2011, namely, Pyrus xerophila-Crataegus maximowiczii (0.999), and in 2021, it was Acer truncatum-Malus honanensis (0.999). Based on the quantitative characteristics mentioned above, the change may be attributed to the small and similar number of individuals of Pyrus xerophila and Crataegus maximowiczii in 2011, as well as the comparable number of newly added individuals over the past 10 years, leading to a certain level of competition. Consequently, the similarity index decreased from 0.999 in 2011 to 0.991 in 2021. The populations of Acer truncatum and Malus honanensis have remained relatively stable over the past 10 years, with the niche similarity value increasing from 0.998 in 2011 to 0.999 in 2021. This increase marked the highest similarity value among all species pairs in 2021.
From the above analysis, Quercus wutaishansea and Pinus tabuliformisare were the absolute advantage species in Lingkong Mountain sample plot, and the associated species were mainly Acer tataricum subsp. Ginnala, Pyrus betulifolia, Toxicodendron vernicifluum, Fraxinus chinensis, Crataegus kansuensis, Crataegus pinnatifida, Malus spectabilis, Acer truncatum, Pyrus xerophila, Crataegus maximowiczii, Malus honanensis etc., with a rich number of species. Various species had similar niche, and the overall niche overlap index was high, indicating that the competition among different species in the arbor layer in Lingkong Mountain sample plot was relatively fierce, and some species disappeared, indicating that they had weak adaptability in the sample plot and were gradually eliminated. On the whole, the structure of the dominant species in the arbor layer of Lingkong Mountain sample plot was stable and the competition between species was intense.
Data availability statement
The raw data supporting the conclusions of this article will be made available by the authors, without undue reservation.
Author contributions
LN: Writing – original draft. DG: Funding acquisition, Project administration, Supervision, Writing – review & editing. QZ: Supervision, Writing – review & editing. YaL: Writing – review & editing. XH: Writing – review & editing. YuL: Writing – review & editing. SF: Writing – review & editing.
Funding
The author(s) declare financial support was received for the research, authorship, and/or publication of this article. This study was supported by Shanxi Scholarship Council of China (No. 2020-010) and Shanxi Laboratory for Yellow River (No. YRL-202110).
Conflict of interest
The authors declare that the research was conducted in the absence of any commercial or financial relationships that could be construed as a potential conflict of interest.
Publisher’s note
All claims expressed in this article are solely those of the authors and do not necessarily represent those of their affiliated organizations, or those of the publisher, the editors and the reviewers. Any product that may be evaluated in this article, or claim that may be made by its manufacturer, is not guaranteed or endorsed by the publisher.
References
Adler P. B., Ellner S. P., Levine J. M. (2010). Coexistence of perennial plants: an embarrassment of niches. Ecol. Lett. 13, 1019–1029. doi: 10.1111/j.1461-0248.2010.01496.x
Alverson A. J., Courtney G. W., Luttenton M. R. (2001). Niche overlap of sympatric Blepharicera larvae (Diptera : Blephariceridae) from the southern Appalachian Mountains. J. North Am. Benthol. Soc. 20, 564–581. doi: 10.2307/1468088
Chase J. M., Belovsky G. E. (1994). Experimental evidence for the included niche. Am. Nat. 143, 514–527. doi: 10.1086/285617
Colwell R. K., Futuyma D. J. (1971). On the measurement of niche breadth and overlap. Ecology 52, 567–576. doi: 10.2307/1934144
D’Andrea R., Ostling A. (2017). Biodiversity maintenance may be lower under partial niche differentiation than under neutrality. Ecology 98, 3211–3218. doi: 10.1002/ecy.2020
Elliott T. L., Davies T. J. (2017). Jointly modeling niche width and phylogenetic distance to explain species co-occurrence. Ecosphere 8, e01891. doi: 10.1002/ecs2.1891
Gu L., Gong Z., Li W. (2017). Niches and interspecific associations of dominant populations in three changed stages of natural secondary forests on Loess Plateau, P. R. China. Sci. Rep. 7, 6604. doi: 10.1038/s41598-017-06689-9
He Z. W., Hu R. C., Huang R. B., Xie Q. (2012). Niche of the major tree species populations in Cathaya argyrophylla forest in Guangxi. For. Res. 25, 761–766. doi: 10.13275/j.cnki.lykxyj.2012.06.017
Hu X. M., Cheng J. M., Wan H. E., Zhao Y. Y. (2006). Studies on the niches of the main populations in different habitats of the Loess Hilly Region, China. Acta Pratacult. Sin. 15, 29–35. doi: 10.3321/j.issn:1004-5759.2006.01.005
Huo M. M., Guo D. G., Zhang J., Wang Z. M., Shangguan T. L., Li R. Q, et al. (2014). Study on Tree Community Characteristics and Spatial Patterns of the Forms Pinus tabulaeformis-Quercus wutaishanica in Lingkong Mountain. Acta Ecol. Sin. 34, 5925–5935. doi: 10.5846/stxb201301220125
Li J., Li X. Y., Cao J., Tan L. Z., Zhao X. H. (2020). Community structure and dynamics of secondary coniferous and broad-leaved mixed forest in Changbai Mountains. Acta Ecol. Sin. 40, 1195–1206. doi: 10.5846/stxb201812132788
Li Z. J., Li S. Q. (2021). Interspecific relationships and niches of dominant species in the wild Hemerocallis spp. community in icheng County, Shanxi, China. J. Shanxi Agric. Univ. (Nature Sci. Edition) 41, 79–89. doi: 10.13842/j.cnki.issn1671-8151.202104050
Liu R. H., Chen L., Tu R. H., Liang S. C., Jiang Y., Li Y. J., et al. (2020). Niche and interspecific association of main species in shrub layer of Cyclobalanopsis glauca community in karst hills of Guilin, southwest China. Acta Ecol. Sin. 40, 2057–2071. doi: 10.5846/stxb201904090689
Lu Y., Chen W., Yao J., Huang Y. Q., Zhang Y., Liu H. C., et al. (2020). Multiple spatial scale analysis of the niche characteristics of the rhododendron dauricum plant communities in Northeast China. Chin. Geogr. Sci. 30, 614–630. doi: 10.1007/s11769-020-1138-8
Parent C. E., Agashe D., Bolnick D. I. (2014). Intraspecific competition reduces niche width in experimental populations. Ecol. Evol. 4, 3978–3990. doi: 10.1002/ece3.1254
Pianka E. R. (1973). The structure of lizard communities. Annu. Rev. Ecol. Syst. 4, 53–74. doi: 10.1146/annurev.es.04.110173.000413
Sun H. B., Gan X. H., Li Y. F., Zhang W. Q., Liu X. J., Liu M. Y., et al. (2022). Niche characteristics of dominant species in forest community of Tiantoushan nature reserve in Shenzhen. Forest. Environ. Sci. 38, 75–86. doi: 10.3969/j.issn.1006-4427.2022.01.010
Tanentzap A. J., Brandt A. J., Smissen R. D., Heenan P. B., Fukami T., Lee W. G. (2015). When do plant radiations influence community assembly? The importance of historical contingency in the race for niche space. New Phytol. 207, 468–479. doi: 10.1111/nph.13362
Velázquez E., Paine C. E. T., May F., Wiegand T. (2015). Linking trait similarity to interspecific spatial associations in a moist tropical forest[J]. F. De Bello. J. Veget. Sci. 26, 1068–1079. doi: 10.1111/jvs.12313
Wang Y., Chen S., He W., Ren J. J., Wen X. C., Wang Y., et al. (2021). Shrub diversity and niche characteristics in the initial Stage of reconstruction of low-efficiency Cupressus funebris stands. Forests 12, 1492. doi: 10.3390/f12111492
Wu Y. Y., Lu X. Z. (2016). Niche characteristics of dominant tree species in the Jubao Mountain suburb park in Nanjing. J. Fujian Forest. Sci. Technol. 43, 89–93. doi: 10.13428/j.cnki.fjlk.2016.01.020
Xu Y. D., Guo D. G., Wang C. H., Zhang Y. L., Lei C. F., Shangguan T. L. (2013). Species Composition and Spatial Pattern of Herbs of Pinus tabulaeformis and Quercus wutaishanica Forest in Lingkong Mountain. J. Shanxi Univ. (Natural Sci. Edition) 36, 628–635. doi: 10.13451/j.cnki.shanxi.univ(nat.sci.).2013.04.024
Yi L. T., Han H. R., Hao S. Q., Kang F. F. (2010). Characters and species biodiversity of Quercus liaotungensis community in Lingkong Mountain. Scientia Silvage Sci. 46, 164–171.
Yi L. T., Hao S. Q., Han H. R., Fan X. H., Kang F. F. (2012). Niche characteristics of a Quercus liaotungensis forest in the Lingkong Mountains. J. Zhejiang A&F Univ. 29, 46–51. doi: 10.3969/j.issn.2095-0756.2012.01.009
Zhang W., He J. H., Hao W. F. (2016). Niche characteristics of dominant plant populations in grassland of loess hilly region of China with different management styles. Pratacul. Sci. 33, 1391–1402. doi: 10.11829/j.issn.1001-0629.2015-0647
Appendix
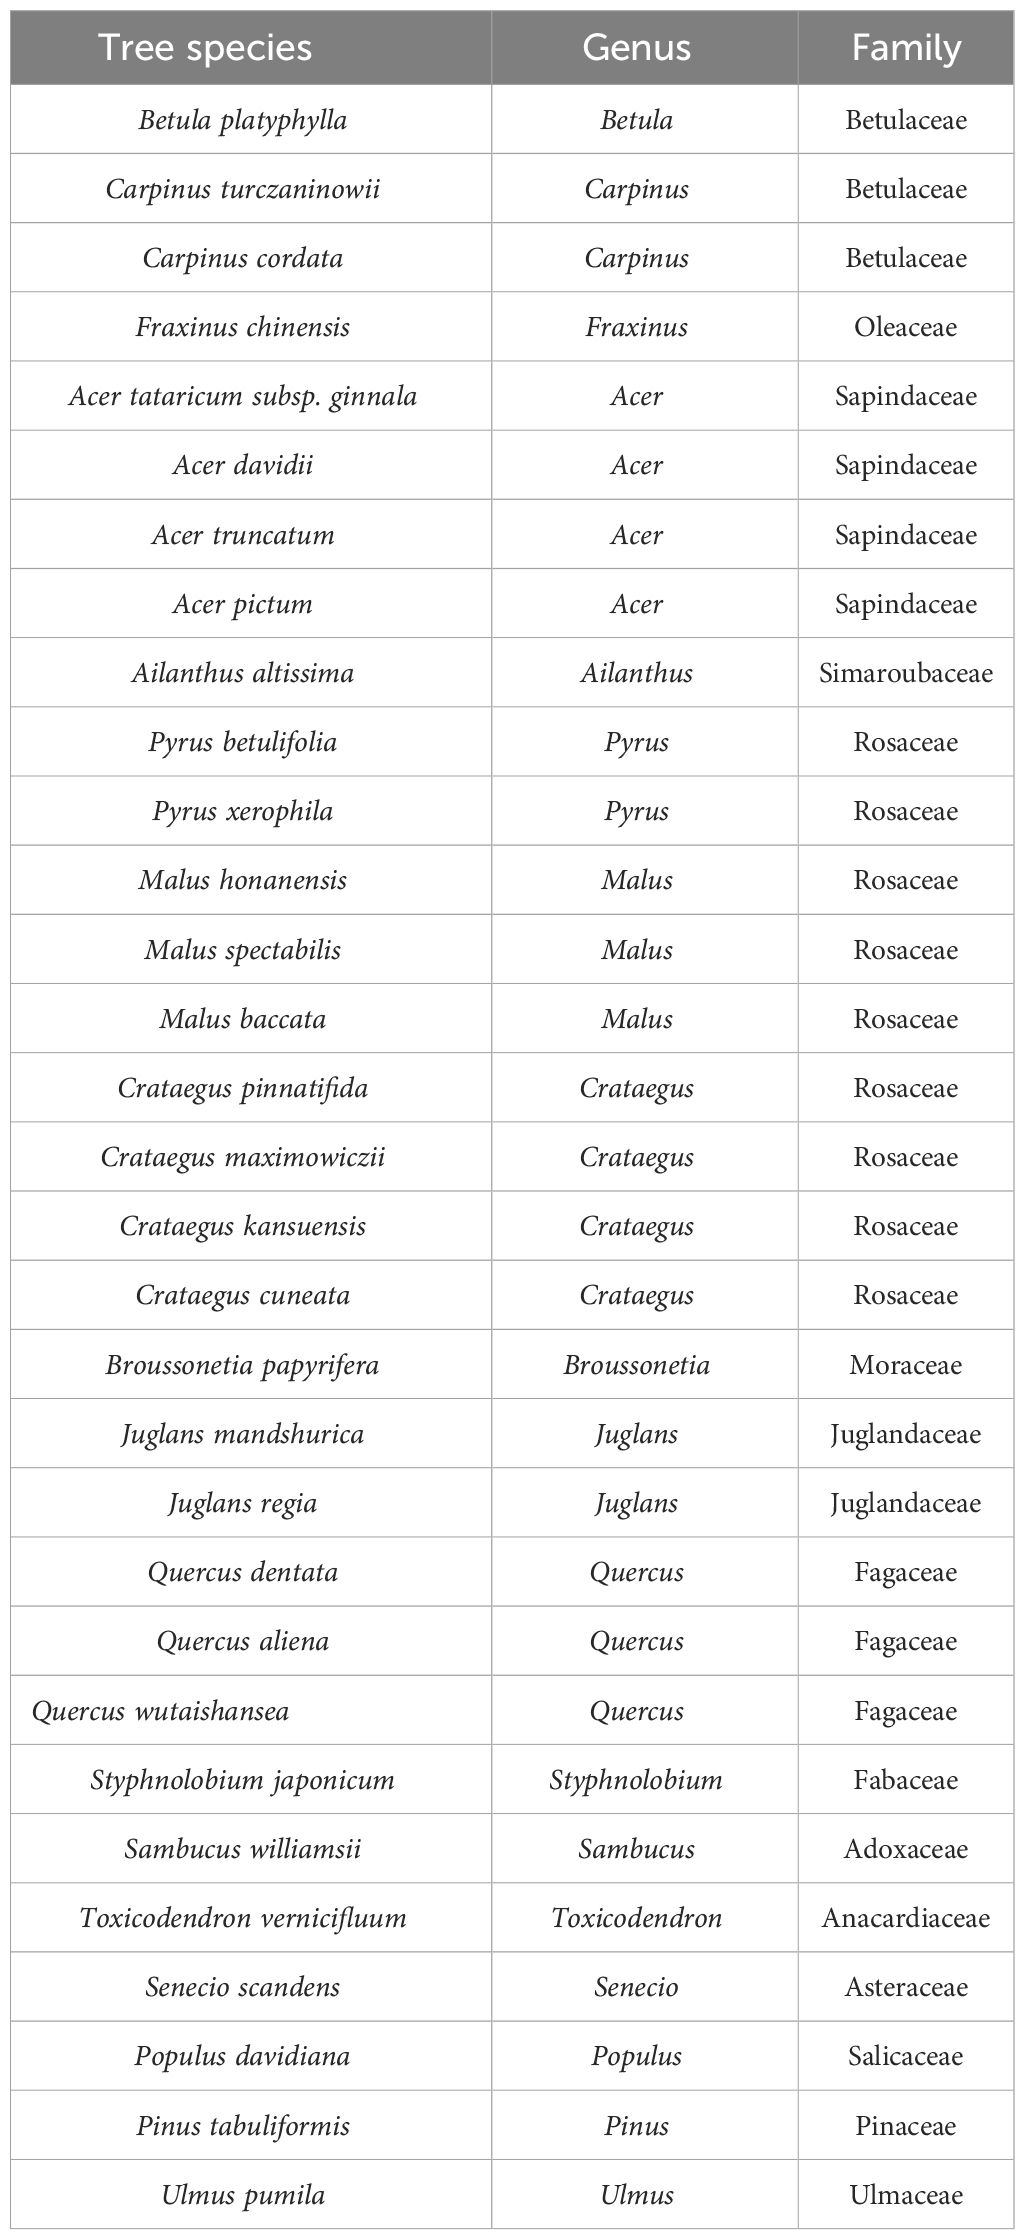
Summary table of tree species in the arbor layer of Lingkong Mountain in 2021.
Keywords: arbor layer, importance value, niche width, niche overlap, niche similarity, dynamic study
Citation: Ni L, Guo D, Zhang Q, Li Y, Hu X, Li Y and Feng S (2024) Niche characteristics and dynamics of dominant species in arbor layer of 4hm2 Pinus tabuliformis-Quercus wutaishansea mixed forest in Lingkong Mountain. Front. Ecol. Evol. 12:1334665. doi: 10.3389/fevo.2024.1334665
Received: 07 November 2023; Accepted: 15 March 2024;
Published: 04 April 2024.
Edited by:
Hugo Fort, Universidad de la República, UruguayReviewed by:
Johny Arteaga, Colorado State University, United StatesAseesh Pandey, Govind Ballabh Pant National Institute of Himalayan Environment and Sustainable Development, India
Copyright © 2024 Ni, Guo, Zhang, Li, Hu, Li and Feng. This is an open-access article distributed under the terms of the Creative Commons Attribution License (CC BY). The use, distribution or reproduction in other forums is permitted, provided the original author(s) and the copyright owner(s) are credited and that the original publication in this journal is cited, in accordance with accepted academic practice. No use, distribution or reproduction is permitted which does not comply with these terms.
*Correspondence: Donggang Guo, gdghjkx@126.com