
Abstract
Fatigue properties are crucial for critical aero-engine components in extreme service environments, which are significantly affected by surface integrity (SI) indexes (especially surface topography, residual stress σres, and microhardness) after machining processes. Normal-direction ultrasonic vibration-assisted face grinding (ND-UVAFG) has advantages in improving the machinability of Inconel 718, but there is a competitive relationship between higher compressive σres and higher surface roughness Ra in affecting fatigue strength. The lack of a quantitative relationship between multiple SI indexes and fatigue strength makes the indeterminacy of a regulatory strategy for improving fatigue properties. In this work, a model of fatigue strength (σf)sur considering multiple SI indexes was developed. Then, high-cycle fatigue tests were carried out on Inconel 718 samples with different SI characteristics, and the influence of ND-UVAFG process parameters on SI was analyzed. Based on SI indexes data, the (σf)sur distribution in the grinding surface layer for ND-UVAFG Inconel 718 samples was determined using the developed model, and then the fatigue crack initiation (FCI) sites were further predicted. The predicted FCI sites corresponded well with the experimental results, thereby verifying this model. A strategy for improving the fatigue life was proposed in this work, which was to transfer the fatigue source from the machined surface to the bulk material by controlling the SI indexes. Finally, a critical condition of SI indexes that FCI sites appeared on the surface or in bulk material was given by fitting the predicted results. According to the critical condition, an SI field where FCI sites appeared in the bulk material could be obtained. In this field, the fatigue life of Inconel 718 samples could be improved by approximately 140%.
Highlights:
A fatigue strength model considering machined surface integrity was developed.
Fatigue crack initiation sites were predicted based on fatigue strength model.
Relationship between surface integrity and fatigue crack initiation was revealed.
A strategy of improving fatigue life by regulating surface integrity was proposed.
A surface integrity field was obtained and fatigue life improved 140% in this field.
Export citation and abstract BibTeX RIS

Original content from this work may be used under the terms of the Creative Commons Attribution 4.0 license. Any further distribution of this work must maintain attribution to the author(s) and the title of the work, journal citation and DOI.
1. Introduction
Critical rotating components of aero-engine typically serve in extreme environments, meanwhile, over 80% of aerospace accidents are attributed to fatigue failure [1]. Upon examining these engine accidents, it has been discovered that fatigue failure mostly originates from machined surface defects, such as tool marks, scratches, and impurities [2]. Consequently, the integrity of the machined surface is crucial in ensuring the reliability and high service fatigue life of these components.
Inconel 718 is predominantly utilized in the critical components of aero-engines, such as turbine blades, turbine discs, and combustion chambers, owing to its superior corrosion resistance, thermal stability, and high-temperature strength [3, 4]. However, there are several disadvantages in machining Inconel 718 through conventional grinding (CG), including excessive grinding force, severe grinding wheel wear, and poor surface quality [3]. Normal-direction ultrasonic vibration-assisted face grinding (ND-UVAFG) is a process method of face grinding samples by applying ultrasonic vibration to the grinding wheel, and the direction of ultrasonic vibration is perpendicular to the workpiece surface. Due to periodic intermittent machining of ultrasonic vibration, ND-UVAFG shows good performance in terms of extending grinding wheel life, increasing grinding efficiency, reducing grinding force, and improving machinability [5]. Surface integrity (SI) can comprehensively evaluate the quality of the machined surface, including surface topography, residual stress, microhardness, etc [6]. Inappropriate machining parameters will precipitate undesirable results, such as excessive surface roughness, surface tensile residual stresses, and microstructural damage [7], all of which can adversely affect the fatigue performance of machined components [8]. Thus, fatigue properties and SI have been considered the critical evaluation indicators for the application of ultrasonic-assisted grinding technology [1].
For metal and metallic alloys, the influence of SI on fatigue properties has been extensively studied. A rougher surface can lead to a higher stress concentration factor, and consequently a lower fatigue life [9]. Additionally, the detrimental effect of surface roughness on the fatigue life has been proposed in both high cycle fatigue (HCF) [10] and low cycle fatigue (LCF) [11]. These studies have proposed an effective strategy to improve the fatigue life of machined components by reducing surface roughness. Hence, it is critical to develop an accurate surface roughness prediction and optimization model to acquire the best surface finish [12].
However, Klotz et al [11] proposed residual stress as the pivotal determinant in high-cycle fatigue life. This revelation is of considerable significance, indicating that residual stress has a significant impact on fatigue life under certain specific conditions. Chiocca et al [13] mapped the residual stress as an initial condition to calculate fatigue damage factors in numerical models and investigated the influence of residual stresses on the fatigue assessment. In the service environment, the superposition of initial residual stress and external stress loads determines the actual stress state of the component, ultimately influencing its fatigue life [14]. Beneficially, compressive residual stress has been shown to reduce the mean stress of alternating stress applied to the components, thereby improving their fatigue life [15]. Another way to improve fatigue life has been proposed, which is to introduce compressive residual stress through strengthening processes. Thus, a higher compressive residual stress is required.
Moreover, microhardness is also regarded as a critical factor of fatigue life; it not only reflects the yield strength of a material but also plays a pivotal role in the initiation and nucleation of fatigue cracks. However, there is currently no consensus among researchers regarding the impact of microhardness on fatigue properties. Suarez et al [16] observed that a high surface hardness of Inconel 718 by ultrasonic-assisted milling had a retarding effect on the propagation of cracks. However, for the Ti6Al4V samples by high-speed grinding, Li et al [17] proposed that the elevated surface microhardness had a detrimental effect on their fatigue life.
Although vast efforts have been made on the effects of various SI indicators on fatigue properties, most of the above studies are based on the analysis of a single SI index or inferred the SI factors that affect the fatigue properties from fatigue test results on samples produced by specific machining methods. However, the fatigue performance of an actual component is a result of the comprehensive effect of each index of SI, whereas no report that can systematically reveal the influence of SI on fatigue properties of components appears to exist at present. As mentioned above, higher compressive residual stress correlates with extended fatigue life, while a rougher machined surface means lower fatigue life. In addition, the role that microhardness plays in influencing fatigue life remains ambiguous. Our previous work indicates that ND-UVAFG can introduce larger compressive residual stress, rougher machined surface, and deeper hardening layer [18]. Thus, an SI field improving the fatigue life of ND-UVAFG Inconel 718 is difficult to obtain, and relevant research has not been published at present.
Thus, in this work, a fatigue strength (σf)sur model for Inconel 718 considering multiple SI indexes (surface morphology, surface residual stress, and surface microhardness) was developed. The fatigue life of Inconel 718 with different SI characteristics was obtained by high-cycle fatigue tensile tests. The surface morphology, surface residual stress, surface microhardness, and fatigue fracture morphology of the ND-UVAFG processed sample were characterized in detail by the optical profiler, x-ray stress analyzer, Vickers microhardness tester, and scanning electron microscope (SEM), respectively. By combining the finite element method (FEM), the stress concentration factor distribution was obtained based on surface topography data, meanwhile, the residual stress distribution on the ground surface layer was calculated. After obtaining the SI index data, the (σf)sur of ND-UVAFG Inconel 718 with different SI characteristics was calculated by the developed model, and fatigue crack initiation (FCI) sites were predicted. Then, a strategy for improving the fatigue life was developed in this work, which was to transfer the FCI sites from the machined surface to the bulk material by controlling the SI indexes. Finally, a critical condition of SI indexes that FCI appeared in the surface or bulk material was given by fitting the predicted results.
2. Fatigue strength model considering surface integrity
2.1. Theoretical basis
Damage mechanics considers fatigue failure as a process of damage variable D evolution [19]. When material accumulates damage variable D from the initial damage D0 to the critical damage Dc with a certain damage evolution law, fatigue failure ensues because of low residual strength [20]. Moreover, the damage evolution law is closely related to alternating loads (for a uni-axial fatigue problem: σ= σm + σasinωt), and stress amplitude σa is a primary dominant factor of damage evolution [21].
Within the S-N curve of metal material, the fatigue life Nf approaches infinity when the applied σa is lower than fatigue strength σf [22]. Consequently, the Nf tends to be infinite, signifying that damage D does not produce in material when σa < σf. In the condition of σa < σf, it has been proposed that there is fatigue damage D accumulation in very high-cycle fatigue; however, within the field of engineering applications, the fatigue damage D accumulation can be negligible due to its extremely slow accumulation rate [23]. Therefore, the σf is regarded as a critical criterion in assessing damage accumulation of metal materials. Furthermore, the precise calculation of σf is important for the prediction of Nf.
The mean stress σm within any region of the machined surface layer will vary due to different surface statuses, subsequently influencing the fatigue strength [24]. Thus, it is extremely important to establish a model that can accurately reflect the σf under any σm. Cai and Xu [25] established a fatigue strength σf prediction model that could accurately describe the relationship between σf and σm of materials, which was expressed by
where σr is the fatigue strength under the cycle ratio R= r; for engineering applications, the critical components are required to be non-plastic deformation, so the Soderberg relation is widely used. Thus, (σr)mod is the modification of σr in equation (1) based on the Soderberg linear equation, it can be expressed as
where σ−1 is the fatigue strength corresponding to symmetrical cyclic loadings (R= −1); σs is the yield strength of the material; η is the material constant, which can be expressed by
where λ and α are material constants. Combining equations (1)–(3), the σf of the material under any σm can be obtained.
The fatigue strength of ground affected layer (GAL) is affected by surface topology, residual stress, and microhardness. Therefore, the influence of SI on σf should be considered to modify the fatigue strength σf model. The ground surface topography can be regarded as composed of numerous micro-notches, which produce a stress concentration under external loading. The stress concentration can precipitate the elevation in local surface stress and the concomitant reduction in fatigue strength σf, ultimately resulting in the initiation of fatigue cracks [26]. The stress concentration factor Kt reflects the degree of stress concentration in the notch, while the fatigue notch factor Kf evaluates the impact of stress concentration on fatigue strength σf. The relationship between Kt and Kf [27, 28] can be expressed as
where, σf and σf, notched represent the fatigue strength of material and fatigue strength considering surface topography; q is the notch sensitivity coefficient, which relates to material and machined surface topography. In engineering applications, due to the difficulty in obtaining q, the conservative calculations using Kt instead of Kf are acceptable (that is, q= 1, Kt = Kf) [29]. The σf, notched can be determined by dividing the nominal fatigue strength σf of the smooth specimen by the Kt, which can be expressed by
where σ1 is the principal stress of each point of surface topography along the loading direction, and σnom is nominal stress.
The residual stress in the machined surface layer is usually equivalent to local mean stress, which is an effectively equivalent method in the calculation of fatigue life or fatigue strength considering residual stress [30]. The equivalent mean stress σmr (that is, σmr = σm + σres) is recognized and used in the numerical calculation process in the impact of residual stress σres on fatigue performance, which indicates that σres changes the actual σm of component.
The refined grains can enhance the mechanical properties of metal materials by improving yield strength [31]. The work-hardening mechanism of GAL is mainly divided into fine grain strengthening and dislocation strengthening. Our previous work [32] established a quantitative relationship between microhardness and microstructure (refined grain region and high-density dislocation region) of Inconel 718. The increment of yield strength Δσs could be converted to the microhardness increment ΔH via equation (6) [33]:

where αT is the Tabor factor of Inconel 718 and its value is 2.918 [34]. Substituting σmr and equations (5) and (6) into equations (1) and (2), a fatigue strength (σf)sur considering multiple SI indexes can be defined by
All material constants in the fatigue strength (σf)sur model need to be determined. Based on the relationship between Nf and σa [35], the S-N curve of the Inconel 718 polished sample (without being influenced by SI) can be calculated under any σm and R. The relationship between Nf and σa can be expressed by
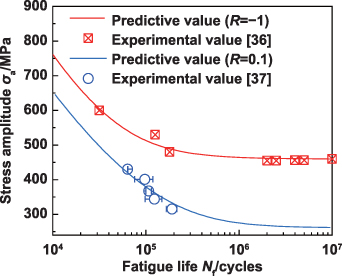
where κ, β, γ, and C−1 are material constants; t(σa) is an integral related to the cyclic waveform, and it represents the form of damage accumulation in a sinusoidal cycle. The S-N curves of Inconel 718 were calculated under R= −1 and R= 0.1 using equations (1)–(3), (9) and (10). Zhong et al [36] and Xu and Lei [37] obtained the S-N curve of the polishing samples of Inconel 718 alloy with R= −1 and R= 0.1, respectively. By comparing with the experimental values from Zhong et al and Xu et al the material constants of Inconel 718 were obtained (table 1). As shown in figure 1, the predicted Nf under R = −1 and R = 0.1 fitted the experimental value well.
Download figure:
Standard image High-resolution imageTable 1. Fatigue strength model parameters of Inconel 718 at room temperature.
| Material | σ−1 | C−1 | β | γ | η | α | κ | λ |
|---|---|---|---|---|---|---|---|---|
| Inconel 718 | 460 MPa | 1.6 × 10¹⁶ | 3 | 18 | 0.6 | 4 | −6.1 | −0.25 |
2.2. Implementation of fatigue strength prediction
The ground surface topography exhibits the characteristics of geometric self-similarity and self-affinity [38], indicating that a length of 200 μm suffices to represent the entirety of ground surface topography. Given that the depth of GAL typically does not exceed 150 μm, an area with a size of 200 μm × 200 μm can be deemed representative of the GAL. The calculation process of (σf)sur distribution in GAL is shown in figure 2(a). The precision of (σf)sur calculation was set as 1 μm, that is, the GAL was divided into elements with a size of 1 μm × 1 μm in the calculation process. Combined with equations (7) and (8), the (σf)sur distribution could be calculated after obtaining the Kt, σres, and microhardness data in GAL.
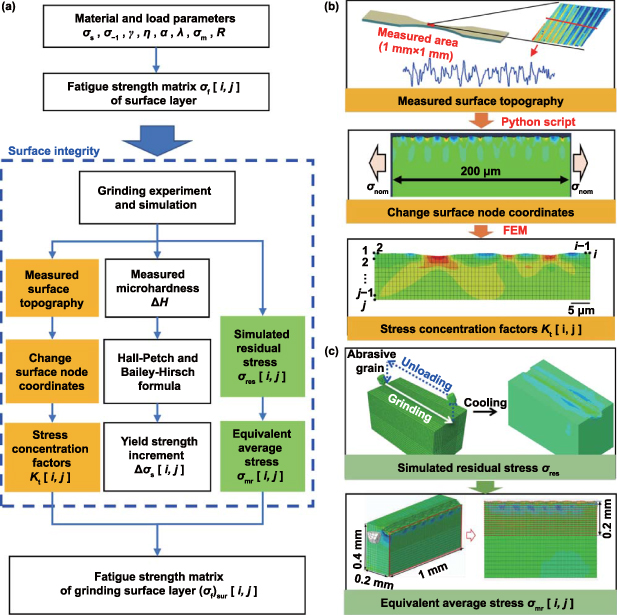
Figure 2. Flow chart for calculating the (σf)sur of the grinding surface layer. (a) Calculating process of (σf)sur. (b) Calculation of Kt using FEM. (c) Calculation of σres using FEM.
Download figure:
Standard image High-resolution imageThe radius of curvature, micro-notches spacing, and micro-notches depth presented considerable challenges in acquisition due to their inherent randomness and the complexity involved in their measurement. Consequently, the Kt caused by the machined surface was calculated using the FEM in tandem with the actual surface topography data. In figure 2(b), a two-dimensional (2D) geometric model of the machined surface was established, and the plane strain hypothesis was supposed for this 2D calculation. The mesh was structured hex elements with a size of 1 μm × 1 μm. The reason for the 2D calculation of Kt was that this work focused on the fatigue strength distribution in the grinding depth direction. As for the transversal position, the ground surface topography was self-similar, which made it impossible (and unnecessary) to determine the exact location of the maximum value of Kt in the transverse direction. Surface node coordinates were altered utilizing a Python script based on the measured ground topography data. According to the σm of high-cycle fatigue tests in this work, a uniform load (σnom = 467.5 MPa) was applied as boundary conditions for the calculation of Kt. The principal stresses σ1[i,j] of all elements were extracted, and then divided by the σnom to obtain a matrix of Kt [i,j].
The distribution of σres within GAL was calculated using FEM. Ordinarily, a CBN abrasive grain manifested as a polyhedral shape with 8–14 faces [39]. To obtain a polyhedral abrasive grain, a parametric Python script was used to randomly cut a cube abrasive grain. The calculation steps included the grinding step, cooling step, and boundary unloading step, which were consistent with the formation process of grinding residual strain (more details provided in Supplementary material A). Since the simulation was based on a single abrasive particle, the calculated σres had a periodic characteristic of abrasive grain trajectory. In the actual grinding process, the periodic characteristic was not significant because there were countless abrasive grains to remove the material. Therefore, it was assumed that the σres distribution of the same depth from the grinding surface was uniform. As shown in figure 2(c), the σres for all elements equidistant from the ground surface was extracted and their average value was computed. Taking the extraction results of σres, the distribution of equivalent average stress σmr within GAL could be obtained. Based on the material constants in table 1 and the calculation method in figure 2, the (σf)sur distribution of GAL under different SI characteristics could be obtained.
3. Experimental results and validation
3.1. Experimental methods
Material subjected to the fatigue test is Nicked-based superalloy Inconel 718. Chemical compositions and mechanical properties of Inconel 718 are shown in tables 2 and 3 respectively. Fatigue test plate samples were obtained by diamond wire saw cutting and then processed by ND-UVAFG to investigate the effect of SI on fatigue characteristics.
Table 2. Chemical compositions of Inconel 718/wt %).
| Al | Co | Cr | C | Fe | Mo | Nb | Ti | Ni |
|---|---|---|---|---|---|---|---|---|
| 0.55 | 0.32 | 17.6 | 0.04 | 20.7 | 2.92 | 5.21 | 1.05 | Balance |
Table 3. Mechanical properties of Inconel 718 (T = 25 °C).
Ultimate tensile strength  /MPa /MPa | Yield strength  /MPa /MPa | Elastic modulus E /GPa | Elongation  /% /% |
|---|---|---|---|
| 1 430 | 1 263 | 200 | 24 |
As shown in figures 3(a) and (b), the fatigue test plate samples were ground using a three-axis high-precision machine (KMC600S UMT). The grinding tool was a resin-bonded CBN grinding wheel with a diameter of 20 mm and a barrel radius of 10 mm, and the grit size was 100#. Ultrasonic amplitude was applied in the axial direction of the grinding wheel by self-developed ultrasonic equipment, and grinding parameters were shown in table 4. In the experiment, the ultrasonic amplitude was set to 4 μm, and the corresponding ultrasonic frequency was 25.6 kHz. Hand-polishing was conducted on the polishing surfaces of the fatigue samples along the fatigue load direction to ensure the fatigue crack preferentially initiated on the ground surface. The size of the polishing abrasive was 2000 #. After the grinding tests, surface topography, surface residual stress, and surface microhardness were characterized. The surface topography was characterized via ZYGO 3D surface optical profilometer, and the surface roughness Ra along the fatigue load direction was measured. The residual stress was measured by Bruker D8 ADVANCEX x-ray diffractometer (Homoclination method: Φ= 0°, and ψ was  45°,
45°,  36°,
36°,  27°,
27°,  18°,
18°,  9°, and 0°, respectively.). The x-ray scanning range was 2θ within [−87.5°, 93.5°]; the scanning angle step interval was 0.03°; the scanning crystal plane was <311> crystal plane, and the x-ray tube target material was copper. The residual stress was measured at five positions in the middle of the fatigue samples and the measured results were averaged. A Vickers microhardness measurement apparatus (Feima) was used for measuring the surface microhardness, and the test force and keeping time were set to 5 g and 10 s. The microhardness at the same depth was measured five times and measured results were averaged.
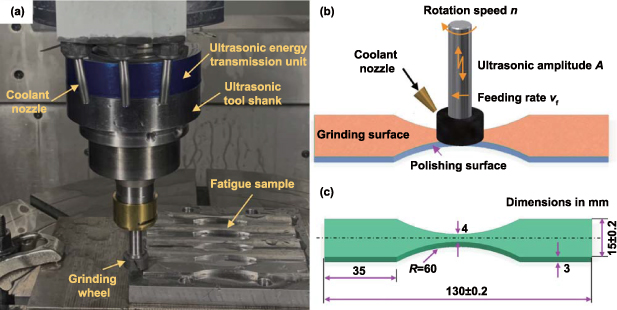
Figure 3. Schematics of fatigue specimen and fatigue sample preparation. (a) Equipment for ND-UVAFG. (b) The processing methods of fatigue sample. (c) The size of the fatigue sample.
Download figure:
Standard image High-resolution imageTable 4. Grinding parameters of fatigue samples.
| Sample number | Rotation speed  /rpm /rpm | Feed rate vf /(mm·min−1) | Grinding depth ap/ μm | Ultrasonic amplitude A/μm |
|---|---|---|---|---|
| #1/#2 | 4 000 | 40 | 20 | 0/4 |
| #3/#4 | 2 000 | 20 | 20 | 0/4 |
| #5/#6 | 2 000 | 40 | 40 | 0/4 |
| #7/#8 | 1 000 | 60 | 40 | 0/4 |
Room temperature fatigue tests were performed using an SDS-200 electro-hydraulic servo static/dynamic testing machine and repeated five times for each group. A sinusoidal waveform circle load was applied with a frequency of 20 Hz. The maximum circle load σmax was set to 850 MPa and the cyclic stress ratio R= 0.1. It should be emphasized that the machined surface textures and orientations would affect the fatigue life, but fatigue failure tended to occur in the most dangerous situations. Therefore, the ground surface texture direction with the lowest fatigue life was selected in obtaining surface topography data and in designing the fatigue test. Chen et al [40] found that the fatigue life of surface texture transverse to the fatigue loading direction samples and surface texture obliques 45° to the fatigue loading direction samples was relatively lower. Due to the circular arc texture of the ground surface, all fatigue samples in this work were carried out based on the surface texture transverse to the fatigue loading direction. After the fatigue test, the microscopic analysis of the fatigue fracture was performed using a SEM.
3.2. Experimental results
3.2.1. Surface integrity of ND-UVAFG.
As shown in figure 4, the trajectories of abrasive grains in CG were the superpositions of rotation motion and feed motion, resulting in the ground surface presenting a typical gully feature. Then, ND-UVAFG introduced an additional hammering effect that produced a fish-scale texture to the ground surface. The ND-UVAFG also extended the arc length of the abrasive grain, resulting in more serious plastic deformation than CG [41]. Consequently, the combined effects of harming effect and severe plastic deformation during ND-UVAFG deteriorated the ground surface quality by comparing the Ra of CG and ND-UVAFG. Sample #2 exhibited a 67% increase in Ra over Sample #1 due to an amplified arc length at higher rotation speed n in ND-UVAFG. The plastic deformation of sample #2 was serious, and deep pits appeared on the surface of ND-UVAFG under the action of axial vibration, as shown in figure 4(a). Conversely, the decrease of rotation speed n reduced the plastic deformation significantly of ND-UVAFG during material removal, improving the deterioration of Ra. As a result, sample #6 displayed only a 33.5% increase in Ra compared to sample #5, and the Ra of sample #4 increased by only 10% compared to sample #3 due to a lower feed rate. The correlation between Ra and rotation speed n was inversely proportional; hence, the Ra was larger at n= 1000 rpm, leading to a slight difference (9.8%) in Ra between samples # 7 and # 8. In conclusion, a decrease in rotation speed n could reduce the deterioration degree of Ra for NA-UVAFG, but excessively low spindle speed (1000 rpm) would still lead to poor ground surface quality (Ra > 0.2 μm).

Figure 4. Influence of ultrasonic vibration on surface topography under different grinding parameters. (a) Surface topography of samples #1 and #2. (b) Surface topography of samples #3 and #4. (c) Surface topography of samples #5 and #6. (d) Surface topography of samples #1 and #2.
Download figure:
Standard image High-resolution imageIn figure 5(a), as d increased, the microhardness first increased and reached its maximum value in the high-density dislocation region, then gradually decreased to the bulk material value (410 HV0.05). This phenomenon was attributed to dynamic recrystallization caused by high temperature and high strain near the ground surface region, culminating in the formation of a refined grain region. The temperature in the region adjacent to the refined grain region was lower, which restrained the dynamic recrystallization, resulting in the formation of a high-density dislocation region. According to the Hall–Petch formula, the microhardness increment ΔH in the refined grain region was 150.4 HV due to grain boundary strengthening. The main mechanism of the high-density dislocation region was dislocation strengthening, and the calculated microhardness increment ΔH was 189 HV. The extrusion and impact of abrasive grain on the ground surface were enhanced under the action of ultrasonic vibration, resulting in the increase in the degree of ground surface plastic deformation and its influence depth; in addition, the ultrasonic vibration reduced the grinding temperature, which weakened the softening effect of grinding heat on the ground surface [18]. Therefore, ND-UVAFG increased microhardness, surface hardening depth, and surface hardening degree.
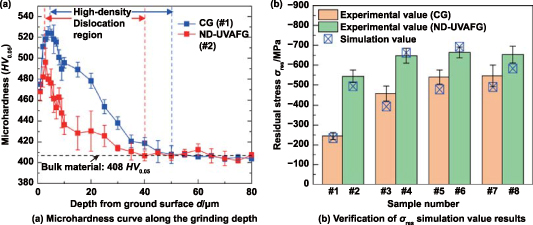
Figure 5. Microhardness and residual stress of CG and ND-UVAFG. (a) Microhardness along the grinding depth direction. (b) Verification of residual stress σres simulation results.
Download figure:
Standard image High-resolution imageAs shown in figure 5(b), the ND-UVAFG improved the compressive σres on the ground surface compared to CG. The increase in compressive σres was attributed to ultrasonic vibration enhancing squeezing effect [42] and work-hardening degree [43] in GAL. Additionally, the high-frequency separation of the abrasive grain from the workpiece led to a reduction in grinding temperature, thereby decreasing the tensile σres induced by thermal effects [44, 45]. Given that the penetration depth of x-ray was generally 20 μm, the surface σres measured by XRD was the average value within 0–20 μm from the ground surface. Therefore, the average simulation value of σres within the L < 20 μm was compared with the experimental value. Since the simulation was based on a single abrasive grain grinding, the ratios of the simulation values of σres to the measured values were in the range of 1.9–2.8 (further details in supplementary material A3). After introducing the equivalent transformation coefficient keq = 2.45, the average error between the simulation values and the experimental values of σres was 8.81%. Therefore, the simulation value of σres obtained by the FEM in section 2.2 could be used for fatigue strength calculation. It should be noted that the σres would be released when the material was plastically deformed under alternating loading [46]. However, all of the σres obtained from the grinding experiments in this work were compressive σres (σres < 0) and the Kt < 1.2, indicating that the maximum stress σ1max = Kt (σmax + σres) during fatigue loading was less than σs. Therefore, the release of σres in this work could be ignored [47], and the main reason why this work did not consider σres release during FCI was due to the σres release law at the crack tip requiring further investigation.
3.2.2. Fatigue performance of samples machined with ND-UVAFG.
The fatigue fracture morphology is usually divided into three typical regions, i.e. fatigue source (fatigue crack initiation region), fatigue crack propagation region, and transient fracture region. The initiation mechanism of fatigue cracks includes surface initiation and internal initiation, corresponding to surface fatigue source and interior fatigue source. In figure 6, the machining flaw on the ground surface was identified as the fatigue source for samples #7 (figure 6(b)) and #8 (figure 6(d)), and the fatigue crack propagated radially. For samples #1 (figure 7(a)) and #3 (figure 7(c)) with Ra < 0.1 μm, the fatigue sources were also located on the ground surface. In figure 7(b), it was shown that the fatigue source of sample #2 located in GAL was within 50 μm from the ground surface. Although sample #2 exhibited a higher Ra compared to samples #1 and #3, its ground surface defects were less prone to initiate fatigue crack due to significant compressive σres. According to the SI data, the GAL depth of sample #4 was about 170 μm, and the fatigue source of sample #4 was located in bulk material far away from the ground surface. The fatigue sources of samples #5 and #6 were also located in the bulk material.

Figure 6. Fatigue fracture morphology of samples #7 and #8. (a) Macro morphology of sample #7. (b) Surface fatigue source of sample #7. (c) Macro morphology of sample #8. (d) Surface fatigue source of sample #8.
Download figure:
Standard image High-resolution image
Figure 7. Fatigue fracture morphology of samples #1 to #6. (a) Sample #1, surface fatigue source. (b) Sample #2, fatigue source in GAL. (c) Sample #3, interior fatigue source. (d) Sample #4, interior fatigue source. (e) Sample #5, interior fatigue source. (f) Sample #6, interior fatigue source.
Download figure:
Standard image High-resolution imageThe fatigue life Nf of CG samples (#1, #3, #5, and #7) and ND-UVAFG samples (#2, #4, #6, and #8) was shown in figure 8(a). Except for samples #7 and #8, the ND-UVAFG samples generally exhibited a higher Nf compared to the CG samples. Specifically, ND-UVAFG samples #2 and #4 both demonstrated an increase in Nf exceeding 90% when contrasted with CG samples #1 and #3. The Nf of ND-UVAFG sample #6 was the highest, which was 22% higher than that of CG sample #5. However, the Nf of ND-UVAFG sample #8 was lower than that of CG sample #7.
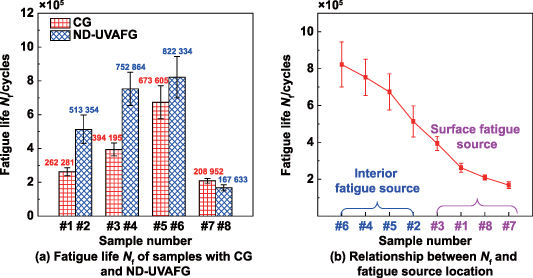
Figure 8. Fatigue life of samples and its relationship with the location of fatigue source. (a) Influence of ultrasonic vibration on fatigue life compared to CG. (b) Relationship between fatigue life and the location of fatigue source.
Download figure:
Standard image High-resolution imageIn figure 8(b), the Nf of samples #1, #3, #7, and #8, of which feature fatigue sources located on the ground surface, was comparatively low. For high-cycle fatigue, the fatigue crack initiation life Ni and fatigue crack growth life Np accounted for more than 80% of the total fatigue life Nf, especially the Ni would consume a lot of time. The propensity for machining flaws on the ground surface to act as nucleation sites for fatigue cracks meant the acceleration of the fatigue crack initiation process. This acceleration resulted in the fatigue life of samples #1, #3, #7, and #8 being relatively low due to the surface fatigue source. Conversely, samples (#2, #4, #5, and #6) with interior fatigue sources were less susceptible to early fatigue crack initiation attributable to machining defects. Therefore, samples #2, #4, #5, and #6 had a higher fatigue life than samples with surface fatigue sources.
3.3. Experimental validation
Fatigue cracks were prone to initiate at the location with the minimum fatigue strength, which was [(σf)sur]min or (σf)bm. Thus, FCI sites could be predicted by the location of the minimum fatigue strength. For the polishing surface of the fatigue sample, the Ra of the polishing surface was less than 0.03 μm, and the calculated minimum fatigue strength was about 368 MPa, which was nearly equivalent to the fatigue strength of bulk material ((σf)bm = 375 MPa). As a result, the influence of the polished surface on fatigue strength was deemed negligible, and the polished surface was representative of the bulk material. Taking samples #1 and #4 as examples, the accuracy of the fatigue strength model needed to be verified. In figure 9, the (σf)sur distribution of sample #1 indicated that minimum fatigue strength in the GAL [(σf)sur]min appeared at the stress concentration position caused by the surface topography, and the fatigue crack was easily initiated on the ground surface. For sample #4, the compressive σres introduced by ND-UVAFG could restrains the stress concentration effect on the ground surface, resulting in the [(σf)sur]min greater than the (σf)bm. Therefore, the fatigue crack was initiated in the bulk material of sample #4 and on the ground surface of sample #1, respectively. The predicted FCI sites with different SI characteristics were consistent with the location of the fatigue source in experimental results, which verified the developed fatigue strength model.
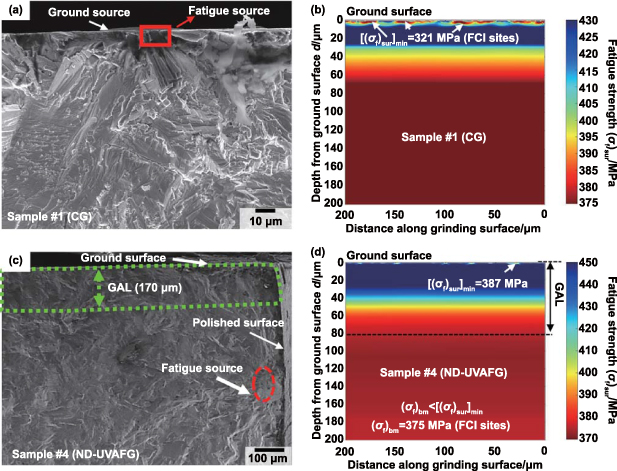
Figure 9. Fatigue fracture morphology and prediction of (σf)sur distribution. (a) Fatigue source of sample #1 is located on sample #1, surface fatigue source. (b) The minimum fatigue strength of sample #1 is located on ground surface. (c) Fatigue source of sample #4 is located in bulk material. (d) The minimum fatigue strength of sample #4 is the (σf)bm.
Download figure:
Standard image High-resolution imageIn conclusion, the location of the fatigue source was directly related to SI and indirectly determined the fatigue life of the sample. According to the above results, a strategy for improving the fatigue life was proposed in this work, which was to transfer the fatigue source from the machined surface to the bulk material by controlling the SI indexes. To achieve this strategy, it was necessary to analyze the influence mechanism of SI on FCI sites based on the (σf)sur distribution of GAL in detail.
4. Discussion
4.1. Relationship between FCI site and SI
Elements with (σf)sur below σa (382.5 MPa) would accumulate fatigue damage D. The rate of damage accumulation for D was inversely proportional to the fatigue strength, indicating that elements with the minimum fatigue strength were most susceptible to becoming fatigue sources due to their higher rates of damage accumulation. The minimum fatigue strength could be either the minimum fatigue strength of ground surface [(σf)sur]min or the fatigue strength of bulk material (σf)bm. Under the experimental conditions of this work, the fatigue strength (σf)bm of bulk material was calculated to be 375 MPa. When [(σf)sur]min < (σf)bm, the FCI sites tended to appear on the ground surface, otherwise FCI sites would locate in the bulk material. Owing to the σres simulation values used in calculating the (σf)sur, the σres on the ground surface in subsequent analyses was based on the average values of simulations within 0–5 μm close to the ground surface.
The ground surface topography was composed of countless micro-notches, and the (σf)k represented the fatigue strength considering only the stress concentration caused by surface micro-notch. As shown in figure 10, the Kt at the trough of the surface micro-notches could reach 1.19, while the Kt at the peak of surface micro-notches was all less than 1. This localized stress concentration at the troughs of the surface micro-notch led to the FCI sites ([(σf)k]min) on the ground surface, resulting in the fatigue cracks easily initiating on the ground surface (surface fatigue source). In figure 11, without the influence of the σres and the microhardness, the stress concentration led the [(σf)k]min to appear easily on the ground surface, even for samples #1, #3, and #4 with Ra < 0.1 μm. For samples #2, #5, #6, #7, and #8, the [(σf)k]min was relatively lower due to the severe stress concentration effect induced by the greater surface roughness (Ra > 0.13 μm). In essence, micro-notches-induced stress concentrations invariably led to FCI sites appearing on the ground surface of all samples, which deviated from the experimental results of actual fatigue source locations. Therefore, an evaluation of ground surface fatigue properties could not be limited to considering only ground surface topographical influences. The σres and the microhardness of GAL also played crucial roles by enhancing fatigue strength and thus altering the location of FCI sites.

Figure 10. Stress concentration on ground surface and fatigue strength (σf)k considering only the stress concentration.
Download figure:
Standard image High-resolution image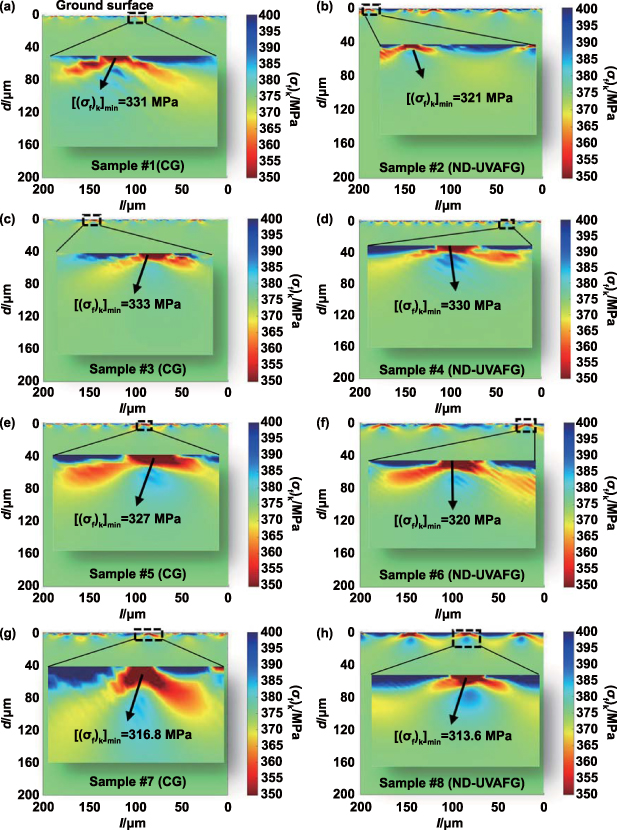
Figure 11. Fatigue strength (σf)k distribution of samples. (a) Sample #1, [(σf)k]min = 331 MPa. (b) Sample #2, [(σf)k]min = 321 MPa. (c) Sample #3, [(σf)k]min = 333 MPa. (d) Sample #4, [(σf)k]min = 330 MPa. (e) Sample #5, [(σf)k]min = 320 MPa. (f) Sample #6, [(σf)k]min = 320 MPa. (g) Sample #7, [(σf)k]min = 316.8 MPa. (h) Sample #8, [(σf)k]min = 313.6 MPa.
Download figure:
Standard image High-resolution imageAfter considering the impact of residual stress and microhardness on fatigue strength, the fatigue strength (σf)sur distribution of samples with FCI sites on the ground surface was shown in figure 12. The FCI sites ([(σf)sur]min) were located on the ground surface for samples #7 and #8, despite their compressive σres both exceeding 300MPa, owing to their large surface roughness (Ra > 0.2 μm). A high compressive σres did not guarantee that FCI sites would avoid locating on the ground surface. Indeed, the effect of compressive σres and microhardness on improving fatigue strength was not significant at poor surface roughness Ra. Similarly, a minimum Ra did not ensure an absence of FCI sites from the ground surface either. It is important to recognize that although the surface roughness Ra of samples #1 and #3 was less than 0.1 μm, FCI sites were still located on the ground surface because of the lower compressive σres. The beneficial impacts of compressive σres and microhardness on fatigue strength were insufficient to offset the deterioration of fatigue strength caused by the stress concentration effect, resulting in the FCI sites ([(σf)sur]min) located at the micro-notches on the ground surface. The predicted locations for FCI sites of samples #1, #3, #7, and #8 were consistent with the experimental observations where the fatigue source was located on the ground surface. The above conclusion indicated that the stress concentration had a more substantial negative effect on fatigue strength than the positive influence exerted by residual stress or microhardness, which explained why the FCI sites were located on the ground surface.

Figure 12. Fatigue strength (σf)sur distribution of samples with FCI sites on the ground surface. (a) Sample #1, [(σf)sur]min = 355 MPa. (b) Sample #3, [(σf)sur]min = 367 MPa. (c) Sample #7, [(σf)sur]min = 321 MPa. (d) Sample #8, [(σf)sur]min = 332 MPa.
Download figure:
Standard image High-resolution imageAlthough the significantly higher Ra of sample #2 (Ra = 0.149 μm) compared to sample #1, the [(σf)sur]min of sample #2 was 377.8 MPa due to the introduction of large compressive σres by ND-UVAFG. Therefore, the [(σf)sur]min of sample #2 surpassed its (σf)bm, resulting in the FCI sites being transferred to the bulk material. For sample #4, the surface roughness Ra (0.082 μm) was almost equivalent to that of sample #1, but the [(σf)sur]min (387 MPa) was higher than the (σf)bm (375 MPa) due to the improvement of (σf)sur by compressive σres (−387 MPa) and work hardening. As a result, the bulk material of sample #4 easily initiated fatigue cracks compared with the GAL at σa = 382.5 MPa, unifying with observed fatigue source location in fatigue fracture morphology. For sample #5 (Ra = 0.134 μm), the [(σf)k]min was located on the ground surface, and compressive σres transferred the FCI sites from the ground surface ([(σf)sur]min = 378.07 MPa) to the bulk material. In figure 11(f), it was evident that the stress concentration of sample #6 was obvious due to its rougher ground surface (Ra = 0.155 μm), and the difference between the [(σf)k]min of samples #6 and #7 was not significant. However, under the action of compressive σres, the FCI sites of sample #6 were not presented on the ground surface but rather located in the bulk material. As shown in figure 13, the compressive σres ultimately strengthened the fatigue strength of the ground surface, resulting in the minimum fatigue strength of (σf)bm, and FCI sites were located in the bulk material. For samples #2, #4, #5, and #6, the prediction results of FCI sites were consistent with fatigue source in experimental observation, which indicated that the larger compressive σres could transfer the FCI sites from the ground surface to the bulk material, thus improving the fatigue life of the sample.
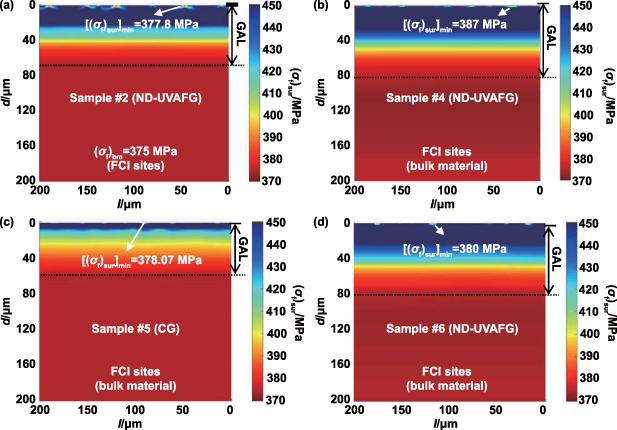
Figure 13. Fatigue strength (σf)sur distribution of samples with FCI sites in bulk material. (a) Sample #2, [(σf)sur]min = 377.8 MPa. (b) Sample #4, [(σf)sur]min = 387 MPa. (c) Sample #5, [(σf)sur]min = 378.07 MPa. (d) Sample #6, [(σf)sur]min = 380 MPa.
Download figure:
Standard image High-resolution imageIn conclusion, the FCI sites were determined by SI indexes (stress concentration, σres, and microhardness). The fatigue strength of the ground surface was a result of competition between the deteriorating effect caused by stress concentration and the strengthening effect by compressive σres, microhardness. When the deteriorating effect was greater than the strengthening effect, the ground surface became the FCI sites ([(σf)sur]min < (σf)bm), and the ground surface would initiate fatigue crack. In contrast, when the strengthening effect was greater than the deteriorating effect, the ground surface was strengthened ([(σf)sur]min > (σf)bm) and did not become the FCI sites, resulting in the bulk material was prone to initiate fatigue crack. Therefore, a strategy for improving the fatigue life could be proposed, which was to transfer the FCI sites from the machined surface to the bulk material by controlling the SI indexes. Effectively controlling this transition of FCI sites depended on quantifying the competitive relationship between strengthening and deteriorating effects. Following this strategy required calculating an SI field where FCI sites were more likely to be located in bulk material based on this developed model.
4.2. SI field of fatigue life improving
In figure 14, the trends of (σf)sur to the σm were analyzed under varying conditions of microhardness increment ΔH (Kt = 1, σres = 0 MPa). It was observed that the increment of (σf)sur caused by work-hardening was only 1.03% at σm = 467.5 MPa (experiment value). For ND-UVAFG Inconel 718, the influence of microhardness on (σf)sur proved to be minimal at this specific σm level; therefore, when calculating the SI field for improving fatigue life, only Kt and σres were taken into account. In this work, the microhardness was not a key indicator for calculating the SI field improving fatigue life, which only represented the microhardness was not the main influencing factor for the (σf)sur of ND-UVAFG Inconel 718 at σm = 467.5 MPa. However, whether microhardness was the main influencing factor on fatigue strength still requires to be determined by materials, mean stress, and machining processing [48].

Figure 14. Trends of (σf )sur with σm under different microhardness increments ΔH.
Download figure:
Standard image High-resolution imageThe (σf)sur was a result of competition between Kt and compressive σres. Due to the stress concentration, the [(σf)sur]min was generally located on the ground surface and was lower than (σf)bm, which led to the FCI sites appearing on the ground surface. On the contrary, the [(σf)sur]min would be greater than the (σf)bm because of compressive σres, and then FCI sites were located in the bulk material. To quantify this competitive relationship in (σf)sur, the fatigue strength difference Δσf between [(σf)sur]min and (σf)bm was introduced, that was, Δσf = [(σf)sur]min—(σf)bm. Subsequently, the influence of Kt and σres on the Δσf was analyzed. A positive Δσf (Δσf > 0, [(σf)sur]min > (σf)bm) suggested that the fatigue cracks were easier initiated in bulk material, which would prolong the fatigue life; a negative Δσf (Δσf < 0, [(σf)sur]min < (σf)bm) indicated that the fatigue cracks were prone to be initiated at stress concentration on the ground surface, and the fatigue life reducing. Therefore, a critical condition of SI indexes that FCI appeared in the ground surface or bulk material was Δσf = 0. The SI field with Δσf > 0 was defined as the fatigue life improving region, and the SI field with Δσf < 0 was defined as the fatigue life deteriorating region.
In figure 15(a), a compressive σres of −150 MPa was required to achieve the fatigue life improving region at Kt = 1.05; however, this became challenging at Kt = 1.3, where a much higher compressive σres of −550 MPa was required. For samples #7 and #8, with maximum values of Kt on the ground surface were 1.176 and 1.196 respectively, their compressive σres values were both less than −350 MPa. As a result, samples #7 and #8 were in fatigue life deteriorating region with FCI sites emerging on the ground surface, which led to them exhibiting the lowest Nf. The fatigue life improving region could be achieved when the compressive σres on the ground surface reached −350 MPa for samples #1—#6 (Kt < 1.15). Specifically, when analyzed samples #1 and #3 with the maximum Kt on their ground surfaces being 1.13 and 1.126 respectively, the FCI sites was still located on the ground surface due to insufficient compressive σres (−227 MPa and −307 MPa). This resulted in relatively low Nf for both samples #1 and #3 due to compressive σres did not reach the requirement, but sample #3 demonstrated higher Nf than sample #1. On the other hand, the FCI sites of samples #2, #4, #5, and #6 were located in bulk material because these samples exhibited substantial compressive σres (−387 MPa, −395 MPa, −356 MPa, and −423 MPa) at the ground surface. The overall comparison revealed that average fatigue life increased by approximately 140% for samples in the fatigue life improving region compared to samples in the fatigue life deterioration region. The calculation results were consistent with the experimental results, which verified the effectiveness of the critical condition.

Figure 15. Determination of SI field of fatigue life improvement. (a) Effect of Kt and σres on Δσf. (b) A determined critical condition of Δσf = 0 by Kt and σres.
Download figure:
Standard image High-resolution image
The ND-UVAFG process has been successful in introducing significant compressive σres, but it would also bring the issue of increasing Kt caused by impact pits on the ground surface. Previously, the process parameters of ND-UVAFG that could improve the fatigue life were not unclear. To improve Nf effectively, the SI field should be within the fatigue life improving region. In figure 15(b), the σres and Kt were calculated when the Δσf = 0, and the relation of Δσf = 0 was obtained by fitting, that was σres = 778.3 × Kt −4.398–786.3. The fatigue life improving region could be achieved corresponding to conditions where σres and Kt satisfied the equation: 778.3 × Kt −4.398–σres > 786.3. Rotation speed n is an important factor that determines the Ra and its deterioration degree. Since Ra inversely correlates with n, a smaller Kt can be obtained with a higher rotation speed (n > 1 000 rpm). Nonetheless, ND-UVAFG induces greater arc length than CG at n= 4 000 rpm, resulting in serious plastic deformation during material removal processes. Under the action of high-frequency ultrasonic vibration, the obvious pits will be formed on the ground surface, leading to the Kt > 1.15. In addition, the compressive σres is positively correlated with the rotation speed n. To introduce a larger compressive σres, the rotation speed n should be controlled within 2000–3000 rpm considering the Kt and σres. To fully utilize the advantages of compressive σres introduced by ND-UVAFG while ensuring that Kt remains below critical levels (<1.15), a small grinding depth ap (20–40 μm) and feeding speed vf (20 mm·min−1) are recommended for grinding the Inconel 718.
5. Conclusion
In this work, a fatigue strength (σf)sur model of Inconel 718 considering multiple SI indexes was developed. The (σf)sur distribution in GAL was calculated and the influence mechanism of SI on (σf)sur was analyzed in detail. The main conclusions are summarized as follows:
- (1)The developed fatigue strength (σf)sur model for Inconel 718 considered comprehensive effects of stress concentration factor Kt (attributed to surface topography), residual stress σres, and microhardness on (σf)sur. Based on the developed model, the FCI sites where the (σf)sur was minimum were predicted. The predicted FCI sites of samples with different SI characteristics were consistent with the location of the fatigue sources in experimental results.
- (2)For ND-UVAFG Inconel 718, the increase in (σf)sur due to microhardness (ΔH: 0 HV to 200 HV) was less than 2% when the σm < 600 MPa. Thus, the Kt and the σres were the dominant factors affecting fatigue strength (σf)sur of ND-UVAFG Inconel 718 rather than microhardness.
- (3)The proposed strategy for improving fatigue life was effective, which was to transfer the FCI sites from the ground surface to the bulk material by controlling the SI indexes. An SI filed of Inconel 718 (778.3 × Kt −4.398–σres > 786.3) where FCI sites appeared in the bulk material was calculated. In this SI field, the fatigue life of samples could be increased by 140%.
- (4)The developed model and strategy proposed in this work can be extended to other metal materials or machining processing, which is greatly significant for improving fatigue properties of components in machining processing.
Acknowledgments
The authors are grateful to the financial support from the National Science Fund of China (52325506), the National Science and Technology Major Project (2017-VII-0002-0095), and Fundamental Research Funds for the Central Universities (DUT22LAB501).
The authors declare that they have no known competing financial interests or personal relationships that could have appeared to influence the work reported in this paper.
Supplementary data (0.9 MB PDF)