First study using a fixed-wing drone for systematic measurements of aerosol vertical distribution close to a civil airport
 Barbara Harm-Altstädter1*
  Anna Voß1†
  Sebastian Aust2 Konrad Bärfuss1 Lutz Bretschneider1 Maik Merkel3 Falk Pätzold1 Andreas Schlerf1 Kay Weinhold3 Alfred Wiedensohler3 Ulf Winkler3 Astrid Lampert1
- 1Institute of Flight Guidance, Technische Universität Braunschweig, Braunschweig, Germany
- 2Flughafen Berlin Brandenburg (FBB) GmbH, Berlin, Germany
- 3Department of Atmospheric Microphysics, Leibniz Institute for Tropospheric Research (TROPOS), Leipzig, Germany
A profound knowledge of pollutant emissions and transport processes is essential to better assess the impact on local air quality, which ultimately affects human health. This is of special importance in the proximity of airports, as flight activities are a major source of ultrafine aerosol particles (UFP) that are associated with adverse health effects. A quantification of the aerosol population in the horizontal and in particular in the vertical distribution has not been sufficiently characterized so far, but is of crucial relevance, as the atmospheric boundary layer (ABL) is strongly interacting with aerosols. For this purpose, the fixed-wing research drone called ALADINA (Application of Light-weight Aircraft for Detecting in-situ Aerosol) was operated at a distance of approximately 4 km downwind of the German airport Berlin Brandenburg (BER) on October 11–19, 2021. During the investigation period, 140 vertical profiles of different meteorological parameters and aerosol particle sizes were obtained on six measurement days between the surface and up to a maximum altitude of 750 m above ground level (a.g.l.). The investigations indicate several features: The stability of the ABL is a key characteristic for the vertical distribution of aerosol population with highest concentrations close to ground. Inversion layers further enhance horizontal transport so that airport pollutants can be moved to a further distance away. The airborne observations of total particle number concentration (TNC) coincide with ground-based data from fix-point sites. They show a high variability depending on the distance to the plume as well as upwind position and highest concentrations of TNC related to rush hours of airport operations.
1 Introduction
Air traffic is negatively influencing the air quality in the immediate vicinity of airports (Unal et al., 2005) and plays a significant role in noise pollution (e.g., Rodriguez-Diaz et al., 2017). In addition to this, aircraft emissions are substantially contributing to the global anthropogenic climate change (Campbell et al., 2018; Lee et al., 2021), in particular at higher altitudes. These aspects may increase their impacts in future scenarios in consequence of growing demands in air transportation, which are around 4.5–5.2% per year, as prognosticated by the ICAO (International Civil Aviation Organization). Aircraft pollutant emissions consist of several different sources at ground, i.e., relevant support equipment, passenger transport, terminal boiler (e.g., Peace et al., 2006; Mazaheri et al., 2011; Masiol and Harrison, 2014), but are dominated by combustion processes of the jet engines that mainly release carbon dioxide (CO2), nitrogen oxides (NOx), carbon monoxide (CO), sulphur oxides (SOx), constituents of volatile organic compounds, particulate matter (PM) and black carbon (BC) (e.g., Lighty et al., 2000; Karcher, 2018). Winther et al. (2015) presented that half of the calculated PM emissions relate to the sulphur content of the used fuel. In particular, ultrafine aerosol particles (UFP) with a diameter less than 100 nm are emitted, which constitute a considerable factor in a possible deterioration of air quality and human health. Due to their small size, that is further accompanied by a high mobility, UFP can be directly inhaled via respiratory tracts. Thus, UFP can deeply infiltrate into lungs, which ultimately implies pulmonary diseases, and they may have the ability to penetrate into bloodstreams (e.g., Schwartz, 2001; Frampton et al., 2006). In consequence, UFP are associated with a higher potential of chronic illnesses like asthma and have been connected to a more frequent incidence of cancer (e.g., Habre et al., 2018; Bendtsen et al., 2021; Riley et al., 2021).
For this purpose, UFP are subject to current environmental studies and were investigated worldwide close to large size airports, as well as at wider surroundings, comprising measurements at fixed-point sites and based on mobile platforms that allow to better assess the role of UFP at greater horizontal distances. In general, the total particle number concentration (TNC) tended to peak in close proximity to airports, contrasting with lower aerosol particle concentrations observed upwind from airports or at larger distances away (Stacey, 2019). For example, Westerdahl et al. (2008) measured averaged concentrations of UFP of 5 × 104 cm−3 at a distance of 500 m downwind of the Los Angeles International Airport (LAX) and determined a domination of the very small particles with a size of 10–15 nm of the ambient PM. Additionally, a dependence of number of emitted UPF on the maximum takeoff weight (MTOW) of aircraft was shown in Zhu et al. (2011), who further identified an increase of UFP with a size of 15 nm in relation to aircraft with enhanced MTOW at LAX. Other investigations were conducted at the Santa Monica Airport (SMO), for instance Hu et al. (2009) presented that UFP reached 10 times higher concentrations at a close distance of 100 m compared to background concentrations. At a larger distance of 660 m away, UFP reached values up to 2.5 times higher than the background data downwind of SMO. The appearance of enhanced UFP measured close to and nearby airports, conclude a high impact of air traffic pollutants that are emitted into the ambient atmosphere. Other investigations of Hudda and Fruin (2016) showed that a significant increase of UFP appeared indoors at residences living downwind of the Boston Logan International Airport (BOS). Stafoggia et al. (2016) presented that TNC increased within minutes after takeoffs at the Rome Ciampino city airport (CIA) but found no specific relevance of TNC depending on the exhaust of different types of aircraft. Up to now, largest UFP concentrations were observed during all procedures of airport operation, covering takeoff, climb-out, taxiing, idling at gates and landings, which was for instance shown in Keuken et al. (2015), who measured at a distance of 7 km downwind of the Amsterdam Airport Schiphol (AMS). Other studies presented that emission rates of UFP strongly depend on the actual fuel flow (Kinsey et al., 2010).
Besides pollutants that are directly linked to aircraft, car traffic is also a signification contributor to pollutant emissions that needs to be validated and studied at close distance to airports. This means for instance assessing the amount of PM which is emitted by commuter traffic, transportation of passengers, shuttle services and other sources for pollution nearby. This raises the question how the existent aerosol population can be attributed to different types of sources. For instance, Austin et al. (2021) demonstrated that higher concentrations of UFP (10–100 nm) were connected to roadway traffic and concurrent with increased values of black carbon (BC) concentrations. The authors concluded that aircraft traffic consisted of lower BC and lower concentrations of PM compared to road traffic, which was dominated by the appearance of UFP in smaller sizes than 20 nm. The study of Austin et al. (2021) was carried out with hybrid-electric vehicles along transects north and south of the Seattle-Tacoma International Airport (SEA), where UFP strongly appeared below landing paths of aircraft. Thus, it is of particular significance to consider diverse types of the atmospheric aerosol population, like simultaneous measurements of aerosol particles in different sizes, BC and the fraction of volatile constituents.
So far, intensive field investigations were solely conducted near ground. However, a detailed picture of UFP and BC as constituents of airport pollutants in the vertical distribution have not yet been considered, which is crucial to better understand transport and mixing of the emissions and the interaction with the atmospheric boundary layer (ABL). For this purpose, the research drone ALADINA was used during the ULTRAFLEB (EN: UFP caused by airports in Berlin) project at the German airport Berlin Brandenburg (BER) in October 2021. The data of the performed research flights comprise vertical profiles of UFP (size 5–11 nm), TNC (size 5 nm–1 μm), accumulation mode (size 300–500 nm) and equivalent black carbon mass concentration (eBC), influenced by different ABL properties. For assessing the source apportionment, the profiles were separated into three distinguished surface wind sections that occurred at the site during the measurement period.
This article is structured as following: Sect. Two provides an overview of the used methods, including the measurement site, instrumentation which was used during the study, data post-processing of ALADINA and the applied wind cluster analysis. The results are shown in Sect. Three which focus on the vertical distribution of aerosols and ABL parameters that are dedicated to the specified surface wind sectors. In addition, different case studies are presented that consider time series of TNC, depending on upwind and downwind surface observations at BER, in comparison with vertical profiles of TNC. Another study shows that emissions assigned to arrival and departure were transported to the ALADINA investigation area on 19 October 2021. The outcome of the study is discussed and summed up in Section 4.
2 Materials and methods
2.1 Measurement site
The airport Berlin Brandenburg (BER, appr. 45 m a.s.l.) is located in the middle of Europe in Germany and lies in the county of Brandenburg, around 5 km away from the city boundary of the capital city Berlin (see Figure 1A). In October 2020, BER commenced flight operations, and it is the only airport in Berlin since spring 2021. In this year, the passenger volume was almost 10 million passengers, and approximately 105,700 aircraft movements at BER. It is the third largest airport in Germany nowadays. The destination airports are primarily located in the southern European holiday regions or within Germany (Friedmann and Belz, 2022). The operations maintain a ban on night flights, mainly between 23:00 and 05:00 CET (Central European Time). In the following, the surrounding of BER is discussed. The municipality of Schönefeld, the city boundary of Berlin and the highway B96a are located north of BER. East of BER lies the route of the motorway A113, which is the third most frequented route in Berlin and links the city center of Berlin with the motorway A10 (called Berlin ring road), both can be seen in Figures 1A,B. The region south of BER is mainly characterized by rural land that comprises meadows, moors, swamps and forests as well as the less frequented road L402. West of BER is the municipality of Mahlow and the highway B96. The industrial park Dahlewitz is located south-west of BER and contains, e.g., a RollsRoyce factory at a distance of around 7 km. As there is a predominantly westerly wind in the region, the two runways are orientated in east-west direction at BER. The COVID-19 pandemic caused reductions in the flight schedule and only one runway was in operation during the ULTRAFLEB period. There is a northern runway (07L/25R) and a southern runway (07R/25L). Between April 2021 until November 2021, the runway in use alternated in a monthly sequence.
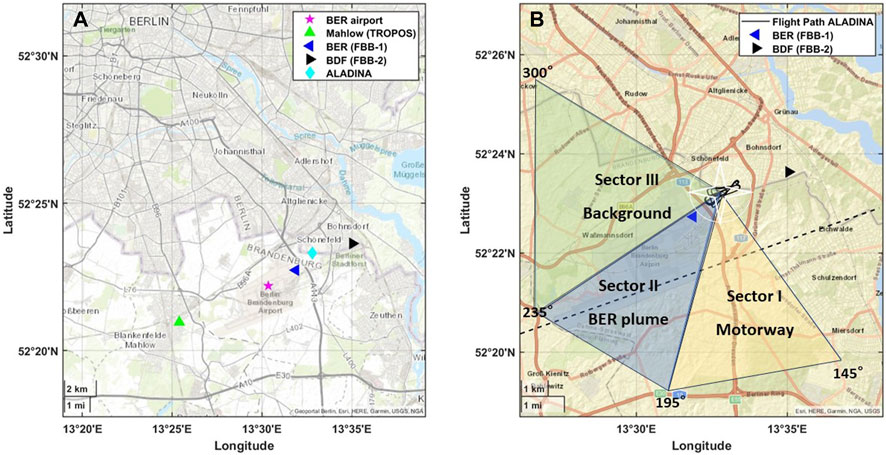
Figure 1. (A) The map presents the position of the ALADINA investigating area (cyan diamond) around the airport Berlin Brandenburg (BER) and the locations of the three surface measurements FBB-1 (blue), FBB-2 (black) and Mahlow (green). (B) Three main wind sectors were defined during the drone period (black line), calculated from the surface wind direction at FBB-1 and FBB-2. Yellow: Sector I, including the motorway A113, representative for surface wind directions from 145° to 195°. Blue: Sector II with wind directions from 195° to 235°, mainly impacted by aircraft traffic at the southern runway and at the main buildings of BER. Green: Sector III with regard to surface wind directions between 235° and 300°, coming from the northern runway as well as background site of BER and as an additional source pollutants from the highway B96a. Source: Geoportal Berlin, Esri, Garmin, USGS.
Continuously measured surface data of TNC was available from three different stations that were deployed during ULTRAFLEB (see Figure 1A), spanning an axis downwind and upwind of BER.
The TROPOS (Leibniz Institute for Tropospheric Research) site, which was situated around 5 km west and upwind of BER in Blankenfelde-Mahlow, hereafter referred to Mahlow, was equipped with a mobility particle size spectrometer (MPSS). The MPSS was made by TROPOS, measurements conformed to the standard CEN/TS 17434 and to ACTRIS recommendations. Recordings of particle number size distribution were conducted at 5 min intervals, alternatingly between recording all particles and non-volatile particles only. Here, only the recordings for all particles were used which were hence available at 10 min intervals. From the recorded distributions, the integral particle number concentrations for the size range 8–800 nm was calculated.
In addition, aerosol and wind data were observed at two different surface locations (see Figures 1A,B), coordinated by the Flughafen Berlin Brandenburg (FBB). The station named FBB-1 is located at the eastern end of the northern runway of the BER, which was not operational during the ALADINA measurements. The site termed as FBB-2 lies in a residential area in Bohnsdorf (BDF). Seen from the BER terminal and from the middle of the operational southern runway (located immediately south of the terminal), both stations are located downwind in about the same direction (northeast), but station FBB-2 is more than 3 times (7 km) further away from the terminal than station FBB-1 (2 km). The observed TNC data was derived from two condensation particle counters (CPC): model type 5420 (GRIMM Aerosol Technik GmbH & Co. KG, Germany) at FBB-1 and model type 3010 (TSI Inc., USA, provided by TROPOS) at FBB-2. Before deployment, both instruments were tested at TROPOS, by comparing them to a reference instrument and none of these instruments showed systematic deviations from the reference.
For the analysis shown here, surface wind speed and wind direction are taken into account from FBB-1 and FBB-2 in 1 h temporal interval for deriving the current wind field during the time of the drone measurements.
2.2 ALADINA instrumentation
The uncrewed aerial vehicle (UAV) ALADINA was designed by the Technische Universität Braunschweig (TU Braunschweig) and developed for atmospheric research based on the aircraft type Carolo P360 (Figures 2A–D). The latest version of the UAV was presented in Lampert et al. (2020). For the operation at BER, ALADINA was implemented with a more accurate and newer version of the inertial measurement unit (IMU, model ADIS16488, Analog Devices, Inc., USA) and Global Navigation Satellite System (GNSS, uBlox ZED-F9P, u-blox Holding AG, Switzerland) that is used for an external orientation and position estimation. The data from the uBlox ZED-F9P is also used for generating the time standard of the measurement system. Both devices (IMU and GNSS module) are independent of the autopilot, thus a redundant observation of the UAV position is available. In addition, ALADINA was equipped with a premier FAA TSO (Federal Aviation Authority Technical Standard Order) certified Mode-S transponder (model Ping200X TSO, uAvionix Corporation, USA, see. Figure 2C, number 6), which enables the visibility of the UAV and ADS-B (Automatic Dependent Surveillance-Broadcast) transponder, and which is relevant for noticing actions in TCAS (Traffic Alert and Collision Avoidance System) of landing aircraft. The measurement data is synchronized via a central bus system called messBUS with a sampling rate of up to 100 Hz (see Bretschneider et al., 2022).
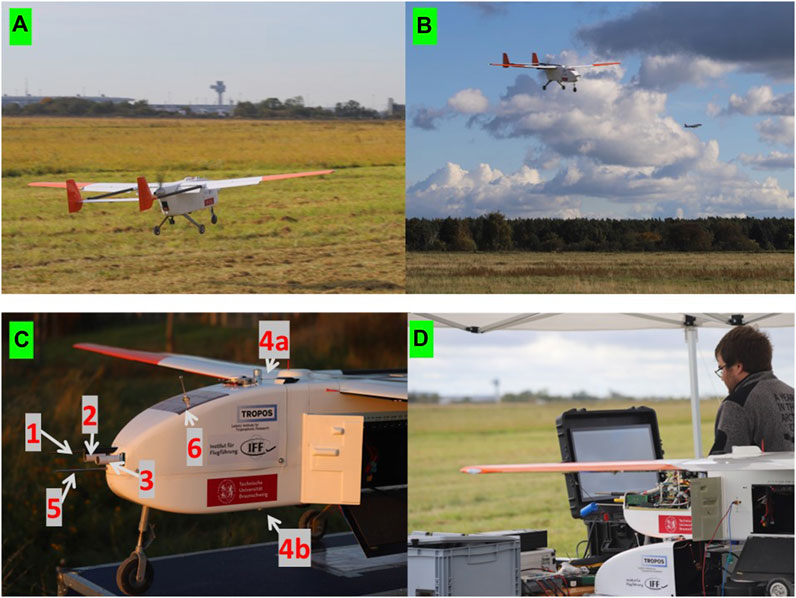
Figure 2. (A) ALADINA during takeoff, in the background the airport Berlin Brandenburg (BER) with the tower visible in the middle of the picture. (B) ALADINA during measurement flight with an aircraft in the background. (C) Front part of ALADINA, including meteorological sensors (1–4), aerosol inlet (5) and the transponder (6). (D) ALADINA aerosol compartment and ground tests of the ALADINA flight crew before performance of the next measurement flight. Source: TU BS.
The meteorological sensors and the aerosol inlet are mounted at the tip of the aircraft nose (see. Figure 2C, numbers 1–3 and 5) to assure an undisturbed incoming flow of the sampled air probe. The horizontal wind direction and wind speed are determined from a multi-hole probe (Figure 2C, number 1), the setup and post-processing of the wind data is shown in detail in Barfuss et al. (2018). During the ULTRAFLEB operation, two different temperature sensors were in use: a slow temperature sensor (HMP110, Vaisala, Finland, number 2) with a temporal resolution of 1 Hz and a fast temperature sensor of type platinum-fine wire (FW) resistance thermometer, manufactured by the Institute of Flight Guidance (TU Braunschweig, Germany, number 3) with a high temporal resolution of 100 Hz. During post-processing, complimentary filtering was applied for the temperature signals to combine the data with different temporal resolutions, more information about the methods are presented in (Barfuss et al., 2023). Further, a humidity sensor (model HMP110, Vaisala, number 2) was deployed that measures the water vapor content with a temporal resolution of 1 Hz. Two pyranometers (model ML01, Eko Instruments Co., Ltd., Japan, Figure 2C, number 4a, 4b) are installed at the top and bottom of ALADINA, for measuring the up- and downwelling shortwave irradiance with a fast response time of less than 1 ms, which are not considered in this study shown here.
Two CPCs of the same type (model 3007, TSI Inc., USA) are deployed in the inner compartment, which is kept at a stable temperature range. Both CPCs are tuned to different lower threshold diameters, and work in a size of a few nm up to around 1 μm. The two CPCs were tested and modified by TROPOS, and the individual cut-off sizes were determined to be 5 and 11 nm. They have a concentration measurement uncertainty of ±20%. Thus, the concentration difference between both sensors provides an identification of UFP, valid for the size between 5 and 11 nm, here after termed as N5−11. The total particle number concentration (TNC) is derived from a CPC with the lower cut-off size, thus valid for a size range between 5 nm and 1 μm. Further, an optical particle counter (OPC, model GT-526S, Met One Instruments Inc., USA) is integrated that counts particles within six size channels valid for a size between 300 nm and up to around 5 μm. For this study, the aerosol particle number concentration of the smallest channel is used for the size bin of 300–500 nm, referred to as N300−500 with a measurement uncertainty of ±15% (Altstädter et al., 2015). The CPCs and OPC are driven critically with a single pump which further allows a working operation for the aerosol sensors with a controlled volume flow (see Harm-Altstädter et al., 2023). A micro aethalometer (microAeth® model AE51, AethLabs, USA) is implemented on board for detecting eBC, based on the light absorbing measurement principle for a single wavelength of λ = 880 nm at a flow rate of 150 mL min−1. The measurement error is of ±0.2 μg m−3, determined from a previous field campaign (Altstädter et al., 2020). For a better orientation, the main specifications of the aerosol sensors onboard are summarized in Table 1.
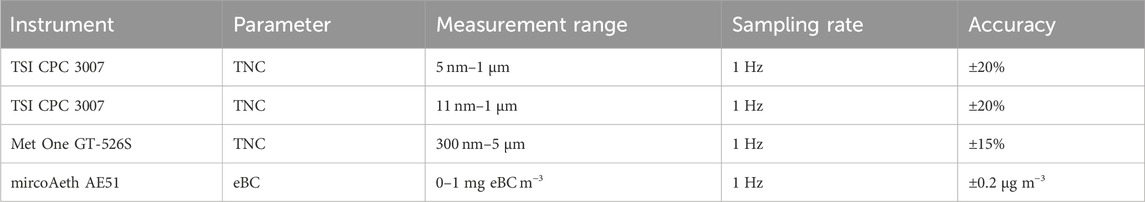
Table 1. Aerosol instrumentation deployed on the research drone ALADINA. TNC: total aerosol particle number concentration, eBC: equivalent black carbon mass concentration.
2.3 ALADINA flight operation
During the ALADINA flight period, the southern runway (07R/25L) was in operation, marked in Figure 1B and the UAV was used at a distance of 4.9 km away from the center of the southern runway and around 4 km away from the main buildings of the airport (see Figure 1B). Measurement flights were limited to specific weather conditions, covering no precipitation and wind speed less than 15 m s−1. A daily briefing was performed with the German Air Traffic Control Authorities (GE: Deutsche Flugsicherung, DFS) and the flight procedures fulfilled all safety requirements, e.g., by issuing a NOTAM (Notice to Airmen), UAV operation at least at a safety horizontal distance of 1 NM (around 1.9 km) away from the runway, and by using a transponder so that a real-time information was available for others. Thus, ALADINA was apparent to ATC (Air Traffic Control) and in publicly available applications like FlightRadar 24. Takeoff and landing of ALADINA were performed by remote control, but the flight mission was conducted via the autopilot system Pixhawk 2.1 Cube (Hex-Aero/ProfiCNC, Singapore) after sending a predefined flight path at a safe altitude range, typically at the height of 100 m above ground. Each research flight consisted of at least four vertical profiles (see Figure 3A) and the second ascent was performed along with horizontal legs at constant altitudes, which is further displayed in Figures 3B–C. The horizontal path was orientated regarding the current wind direction (perpendicular and in parallel) and is necessary for the calculation of the wind speed and wind direction derived from ALADINA. Further, the UAS was steadily flying the same sequences of the vertical profiles and horizontal legs in order to provide the highest reproducibility of the studied area.
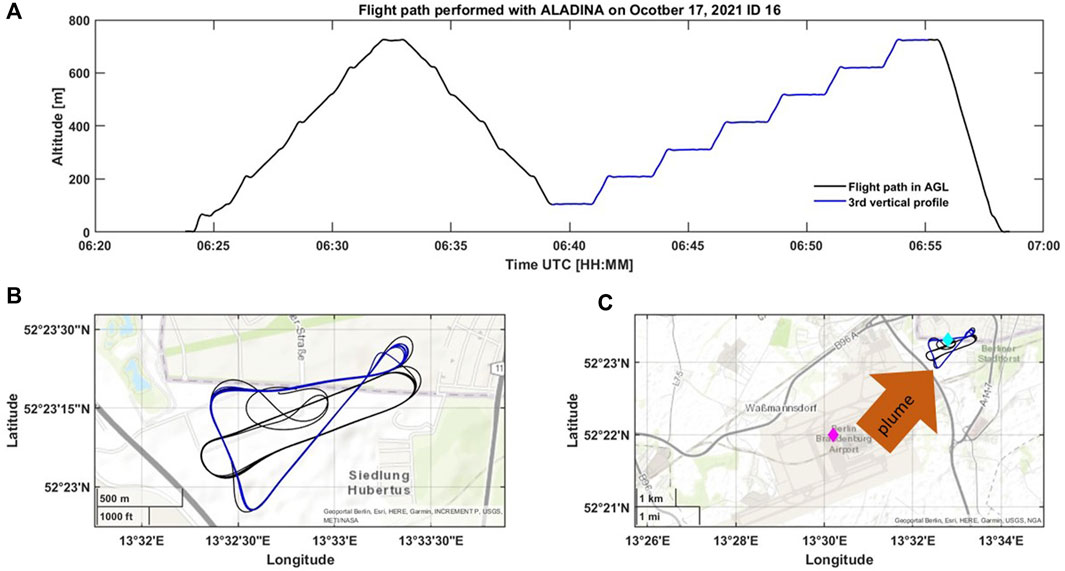
Figure 3. (A) Measurement flight (black line) performed with ALADINA close to BER on 17 October 2021 (Flight ID 16). (B) Bird’s eye view of the flight path, showing the orientation of the horizontal legs during the third vertical profile (blue line). (C) Top view with greater distance to present the UAV measurement area and the impact of the BER plume according to the current wind direction. Source: (B) Geoportal Berlin, Esri, HERE, Garmin, INCREMENT P, USGS, METI/NASA and (C) Geoportal Berlin, Esri, HERE, Garmin, USGS, NGA.
2.4 Data post-processing and wind sector clustering
Table 2 shows an overview of the individual times of the research flights which are contributing to the study shown here. During ULTRAFLEB, 44 measurement flights were performed with ALADINA on October 11–19, 2021, with an average flight time of 29 min. After quality check of the airborne data, 34 research flights were considered, ensuring a full data availability of the horizontal wind. In total, 140 vertical profiles are available between the surface and up to a typical maximum altitude of 750 m a.g.l. Further, the overall flight activity is shown which was recorded by FBB. A sum of 520 flight movements occurred simultaneously during the UAV flight periods. By considering only individually performed research flights, an averaged number of eight arrivals plus seven departures proceeded at the same time, mainly by medium size aircraft, according to the wake turbulence category, for instance aircraft type A320, and lower contributions of smaller categories. Table 2 provides also information on weekdays of the research flights. Four out of the six ALADINA measurement days were during workdays (20 ALADINA flights, 302 flight movements at BER), and only two out of 6 days were operated on weekend (14 ALADINA flights, 218 flight movements at BER). At this point, it should be mentioned that the UAV investigation was within the COVID-19 pandemic but during school holidays, valid for several areas, including Berlin and Brandenburg. Thus, the airport was at the maximum intensity of operation with one runway in use.
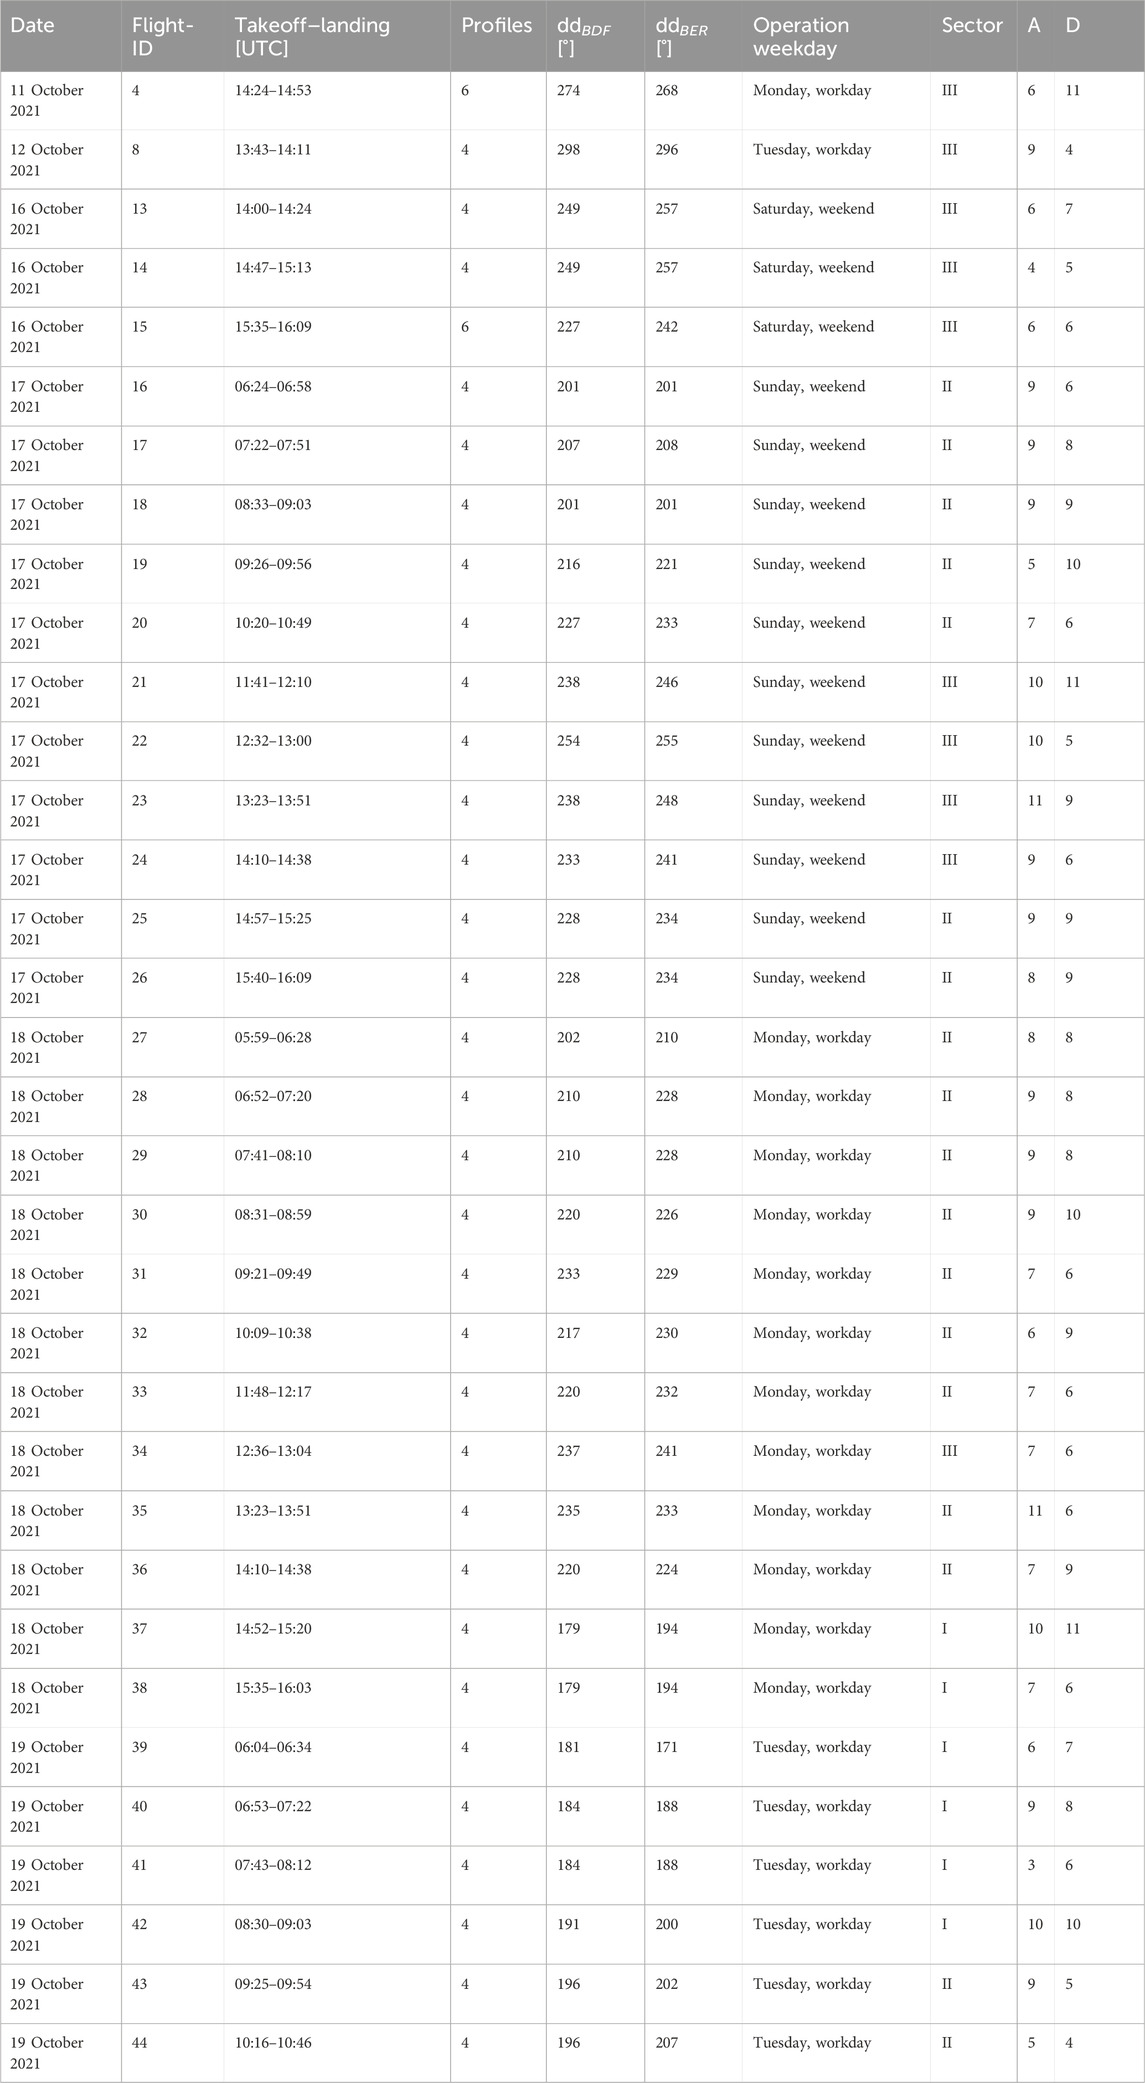
Table 2. Measurement flights performed with ALADINA at the airport Berlin-Brandenburg (BER). From left to right: date, Flight ID, takeoff and landing time in UTC (CET+2 h), number of vertical profiles, surface wind direction (dd) measured at BER and Bohnsdorf (BDF), day of week, and classification of the three sectors, namely, Sector I (motorway A113), Sector II (southern runway) as well as Sector III (airport-B96a). In addition, the flight activity is inserted, consisting of the number of aircraft summed up in the same time period as the individual research flights of ALADINA (A: arrival, D: departure).
For the analysis shown here, wind sectors were clustered in a geometric scheme according to the surface wind direction measured at the two ground based stations at BER (FBB-1), as well as at Bohnsdorf (FBB-2), spanning an axis downwind of BER and with the ALADINA measurements in between (Figures 1A,B). The observed surface wind direction was assigned to the single performed research flights (see Table 2). During the ALADINA period, the site was influenced by a wind direction ranging from 145° to 300°. Considering the large impact of different sources of surface aerosols according to the span of wind direction, three main wind sectors were chosen that represent distinguish sources for the measured aerosol population. The dedicated wind sectors are only considering the surface wind direction but due to continuously measurements, the data provides an appropriate basis for analyzing dynamically driven impacts in the spatial scale. The classified wind sectors are further illustrated in Figure 1B.
The potential constituents of pollutants are explained in the following in a clockwise order.
• Sector I includes the motorway A113, is assigned to surface wind direction from 145° to 195° and should represent the aerosol population near ground mainly released from car traffic, as the sector covers the highly frequented motorway in the south-north axis coming from Berlin. Wind directions within this sector occurred less frequently during six research flights, summarizing 24 vertical profiles in the evening hours on 18 October 2021 and in the morning on 19 October 2021.
• Sector II covers the southern runway, and consists of surface wind direction from 195° to 235°. The results should consider the major impact of aircraft traffic that occurred at the southern runway and emissions from the main buildings of BER. Thus, Sector II should stand for an aerosol population representative for the plume of BER. This sector was present during 18 measurement flights, comprising a total number of 72 vertical profiles, which were performed on three different measurement days between 17 October 2021 and 19 October 2021.
• Sector III spans the northern part of the airport and the route B96a, characterized by surface wind direction between 235° and 300°, implying activities from the northern runway, which was, however, not in use at the period, and car traffic at the highway B96a that is generally less frequently used in comparison with the main motorway A113. This sector should typify a background situation, and the results are representative for ten research flights, leading to a sum of 44 vertical profiles. Wind direction from this sector occurred on five measurement days, most pronounced on October 11–16, 2021, as well as sporadically in the afternoon on 17 October 2021 and once less pronounced in the afternoon on 18 October 2021.
Subsequently, the results are shown in terms of a consolidation of the 140 individual vertical profiles which were obtained from ALADINA. For a comparison with the airport dispersion model LASPORT (e.g., Lorentz et al., 2019), the ALADINA data was averaged in 20 m altitude intervals and all profiles of the same flight were averaged. This procedure was carefully checked. The variability in the vertical scale was negligible by considering two successive profiles for a case with a high grade of turbulence during morning hours. The data of the respective calculated median, minimum and maximum were merged into single profiles and are displayed together in the vertical scale according to the three wind sectors. This separation was done in order to differentiate the potential impacts of different emission sources on the vertical variability of the aerosol population. As shown in the following, the illustrations maintain the same sequences from left to right showing the Sector I (motorway A113), Sector II (BER plume) and Sector III (northern part of the airport).
3 Results
3.1 ABL properties during the ALADINA measurement period at BER
First, Figure 4 and Figure 5 are discussed to visualize the influence of meteorological parameters on the aerosol population in the vertical scale. Each graph shows two different measured values depending on altitude, e.g., potential temperature and specific humidity in Figure 4 and wind speed along with wind direction in Figure 5. According to the ABL observations for Sector I (see Figure 4A), the median vertical profile of potential temperature (green line) indicates a strong inversion layer with an increase of 8 K between the height of 300 and 700 m a.g.l. Which concludes a stably stratified ABL, where vertical particle movement is inhibited. Measurements during Sector II (see Figure 4B), involving major impacts originating from BER, illustrate the existence of a pronounced surface inversion layer that is solely visible in the lowermost several meters and a second weak inversion layer with a gradient of 2.5 K above 100 m a.g.l. and up to 400 m a.g.l. The median averaged data of the potential temperature is not clearly interpretable, as it is based on a mixture of different daytime as well as carried out on three measurement days. For Sector III, ALADINA flights were solely performed after 11:41 UTC (coordinated universal time, +2 h CET) (see Figure 4C). and the median average of the potential temperature is uniform in the vertical scale, which resulted in a generally well-mixed ABL. However, an inversion layer is visible above 600 m a.g.l. Which is most likely associated with a sink of the ABL height, as flights were performed in the late afternoon so that a lower solar irradiance is available. In principle, the vertical distribution of the median calculated specific humidity (black line) shows higher values close to ground and strong gradients in the vertical scale in correlation with inversion layers.
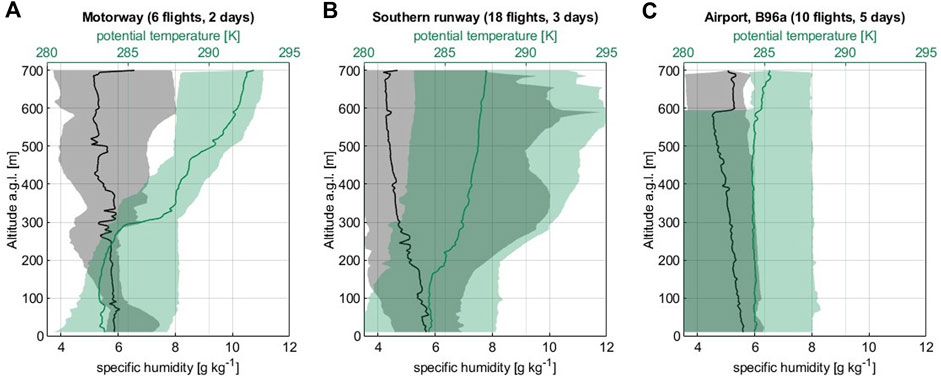
Figure 4. Vertical profiles between ground and 700 m a.g.l. Of the median potential temperature in K (green line) and specific humidity in g kg−1 (black line), measured with ALADINA near BER in October 2021 for (A) Sector I, (B) Sector II, and (C) Sector III. The vertical profiles were averaged in 20 m altitude steps and gathered according to the selected Sectors, based on the sum of 140 individual vertical profiles.
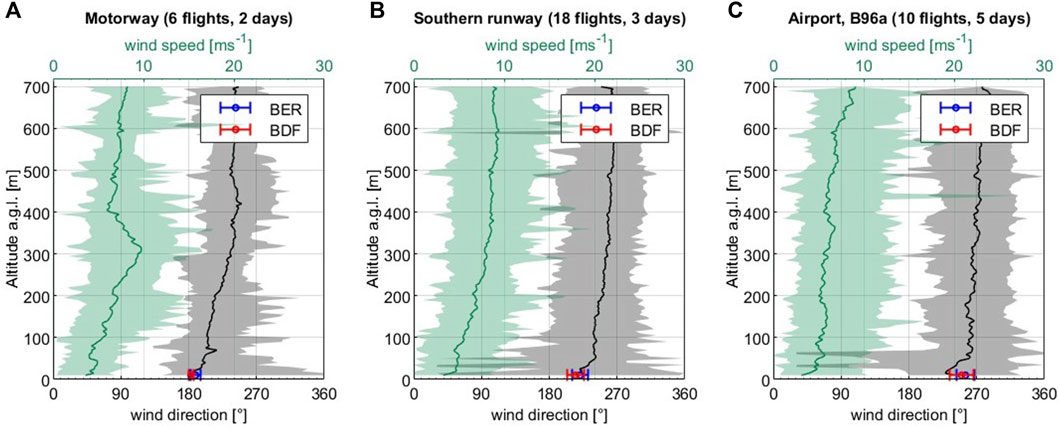
Figure 5. Vertical profiles of median wind direction in degree (green line) and median wind speed in m s−1 (black line) measured with ALADINA near BER during the ULTRAFLEB project in the time period October 11–19, 2021 for (A) Sector I, (B) Sector II and (C) Sector III. The vertical profiles are based on 20 m steps averaged for the total number of 140 individual profiles and separated along with the surface wind sector. The median ground measurements of the wind direction at BER (blue) and BDF (red) measured by the German Weather Service are also provided.
Figure 5 presents the same clusters but valid for the vertical profiles of the mean wind direction (black line) and mean wind speed (green line). The observations of the two ground-based sites from FBB at BER and BDF are indicated as well for a comparison. For Sector I (see Figure 5A), the vertical profile of the median wind speed shows an increase from 3.5 to 10 m s−1 between the surface and up to the altitude of around 300 m a.g.l., where the ABL is mainly neutrally stratified. The wind direction is rotating from 180° to 245° between ground and the height of 400 m a.g.l. For Sector II (see Figure 5B), the median wind speed increases steadily with altitude and reaches values between 3.5 and 9.5 m s−1, where the wind direction turns from 215° to 260° in the lowermost 300 m a.g.l. For Sector III (airport-B96a), the mean wind direction is rotating from 235° to 265° in the lowermost 100 m a.g.l., but remains constant above this height in accordance with a neutrally stratified ABL (see Figure 5C).
3.2 Impact of ABL stability on the vertical distribution of the measured aerosol population
Figure 6 displays vertical profiles of the averaged aerosol particle number concentration, in relation to the three different sectors. The aerosol profiles are based on the median TNC (blue line) in a direct comparison with the median calculated UFP for the size between 5 and 11 nm (red line), as well as the ratio of UFP to TNC (gray dashed line). This correlation is most pronounced for Sector I (see Figure 6A), identified by maximum values of TNC with 3.4 × 104 cm−3 which occur near the surface and strongly decreases to around 2.1 × 103 cm−3 at the height of 350 m a.g.l. This is in good agreement with the vertical distribution of the mean UFP that reaches a maximum of 8.8 × 103 cm−3 close to ground and consists of a proportion with 31% of TNC below the persistent inversion layer. A significant gradient of the UFP/TNC fraction is visible at the height of 300 m a.g.l., representative for only about 10%, which, however, significantly increases to 35% with growing altitude. For Sector II (see Figure 6B), the highest median concentrations of TNC are measured near ground and reach values up to 2.9 × 104 cm−3. Above, TNC decreases with altitude to a median concentration of around 6.6 × 103 cm−3. Above the height of 300 m a.g.l., the median TNC is almost uniform with low concentrations. The vertical profile of UFP follows the same distribution, similar to TNC, with a maximum of 2.0 × 104 cm−3. This characteristic is similar to the observations for Sector I, but with a sharper gradient of enhanced concentrations at a specifically confined altitude region of 100 m a.g.l. and an additional low enhancement at the height of 400 m a.g.l. The actual reason for the increase of UFP is not clearly identified. The authors consider most likely an additional source for UFP apart from emissions of BER. However, it cannot be excluded whether the increase is linked to transported pollutants that originate from the approaching sector of air traffic. Nevertheless, in this case, the UFP/TNC fraction reaches 20% close to ground and is generally decreasing with altitude, characterized by a median proportion of about 14%, but increases above the height of 650 m a.g.l. To 27%. In contrast to this, the vertical distribution of TNC and UFP show a consistency of both measured values that are related to Sector III (see Figure 6C). TNC reaches concentrations up to 1.0 × 104 cm−3 near ground and decreases marginally up to the maximum altitude of 750 m a.g.l., represented by a value of 2.4 × 103 cm−3. UFP occur with low concentrations between 2.4 and 7.9 × 103 cm−3. The fraction of UFP to TNC varies between 3 and 31% in the whole investigation altitude and reaches marginally higher concentrations between the height of 300 and 650 m a.g.l., where the top of the inversion layer is apparent (see Figure 4C). By taking into account the extreme events, the total maximum of TNC reaches a value of 1.2 ± 0.24 × 105 cm−3, influenced by surface wind coming from BER. However, this high value of the measured TNC is apparent at an altitude of 400 m a.g.l. and does not occur at ground. In addition, this maximum is far exceeding the highest concentration measured at ground level with a value of 8.5 × 104 cm−3. The discrepancy of the two maxima of TNC at different altitudes is most likely attributed to an overlap of previously emitted sources, as different populations may coexist at the same time due to impacts of a stably stratified ABL, which prevents mixing in the vertical scale.
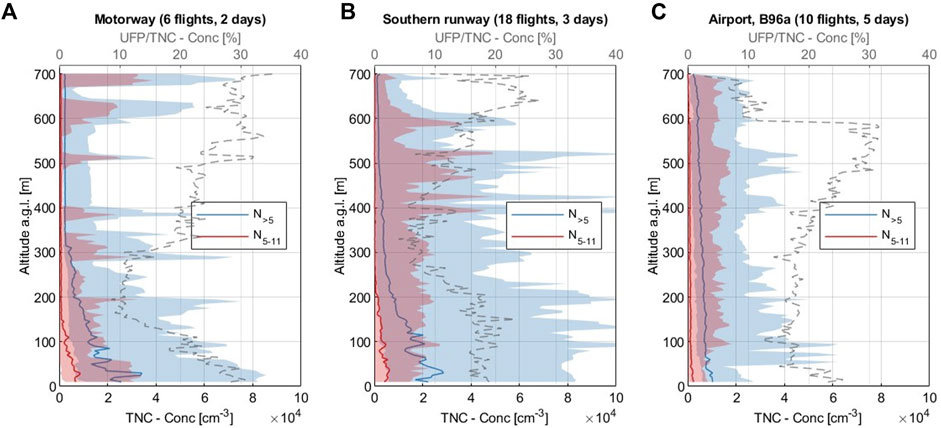
Figure 6. Vertical profiles of median aerosol particle number concentration, measured with both CPCs as an indicator for UFP with a size between 5 nm and 11 nm referred to as N5−11 (red line), TNC for the size between 5 nm and 1 μm (blue line) and the fraction of UFP/TNC (dashed line), valid for (A) Sector I, (B) Sector II and (C) Sector III. The parameters were calculated according to 20 m altitude steps and are based on 140 individual profiles performed with ALADINA at BER in October 2021.
Figure 7 shows the proportion of accumulation mode, here referred to N300−500 (black line) and eBC (green line) to the measured TNC. For Sector I (Figure 7A), a pronounced enhancement of the two median parameters is visible below the existent inversion layer, resulting in a highest medium concentration of 140 cm−3 for N300−500 and in a highest value of the median eBC with 1.2 μg m−3. Above, the concentrations of both parameters decrease in the vertical scale to a median value of 23 cm−3 for accumulation mode particles and 0.2 μg m−3 for eBC, respectively. Here it is important to note that with respect to the shown eBC data, a lower temporal resolution of 1 Hz was chosen for the analysis. Due to high variability of the attenuation signal, only the median profile is shown to maintain a good readability of the figure. For Sector II (Figure 7B), the vertical distribution of N300−500 indicates highest concentrations at the lowermost 200 m a.g.l., reaching a median maximum of 43 cm−3. With increasing altitude, the vertical distribution of the median N300−500 decreases to a minimum of 14 cm−3 and is generally uniform in the vertical scale. A similar vertical distribution is apparent for eBC, characterized by a steady reduction from 0.7 μg m−3 to 0.2 μg m−3 between ground and the maximum height, with highest value close to surface. For Sector III (Figure 7C), the median N300−500 varies between 17 and 27 cm−3, and is almost uniformly dispersed with growing altitude. This shape is consistent with the median eBC data that reaches values between 0.2 and 0.52 μg m−3.
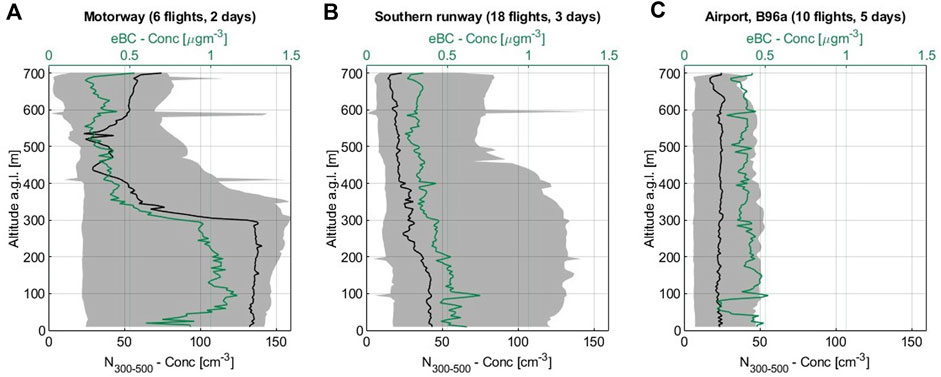
Figure 7. Vertical profiles of median aerosol particle number concentration, measured with an OPC for the particle size between 300 and 500 nm in cm−3 (black line) and equivalent black carbon mass concentration (eBC) derived from an AE51 in μg m−3 (green line) for (A) Sector I, (B) Sector II and (C) Sector III, based on 20 m altitude steps, via 140 individual profiles measured with ALADINA at BER during ULTRAFLEB in October 2021.
3.3 Variability of aerosol concentration in and outside of the BER plume
Summarizing the main findings shown above, the aerosol population is strongly influenced by the ABL stability in the vertical scale, here once only discussed independently of the overlaying impact of the respective surface wind conditions. In order to better elucidate the variability of TNC that occurs close to ground, one single measurement day is shown in Figure 8. For this purpose, the observations are chosen for 18 October 2021, as the ALADINA site was mainly influenced by Sector II, thus this day is most representative for characterizing emissions originating from BER (see Table 2, Flight ID 27-ID 38). The figure displays time series of vertical profiles of TNC (Figure 8A) and wind speed (Figure 8B) derived from ALADINA compared to continuously measured TNC data, obtained from the two ground-based stations at BER from FBB-1 (dashed line) and from the TROPOS site at Mahlow (solid line). During the measurement day, ALADINA performed 12 research flights, each consisting of four vertical profiles, comprising of two ascents and two descents that were conducted below the limiting height of 750 m a.g.l. The color coded profiles (ranging from blue to red) of TNC demonstrate that particularly in the morning hours between 06:00 and 07:30 UTC, TNC peaks close to ground and highest concentrations are solely visible below the height of 100 m a.g.l., indicated by a sharp gradient at this altitude. During the day, TNC is transported up to higher altitudes but reaches lower maximum values, most thinned out in the afternoon between 12:00 and 13:30 UTC. At around 15:30 UTC, the total maximum of TNC is only apparent at the lowermost 100 m a.g.l., similar to the observations in the morning hours. The surface TNC data at Mahlow ranges between 0.4 and 2.1 × 104 cm−3, characterized by a general minimal variability during the day, apart from an increase after 16:15 UTC. This is in a large contrast when considering measurements of TNC at BER, as this data varies between 0.8 and 5.5 × 104 cm−3, thus exceeding concentrations by a factor of four in comparison with Mahlow.
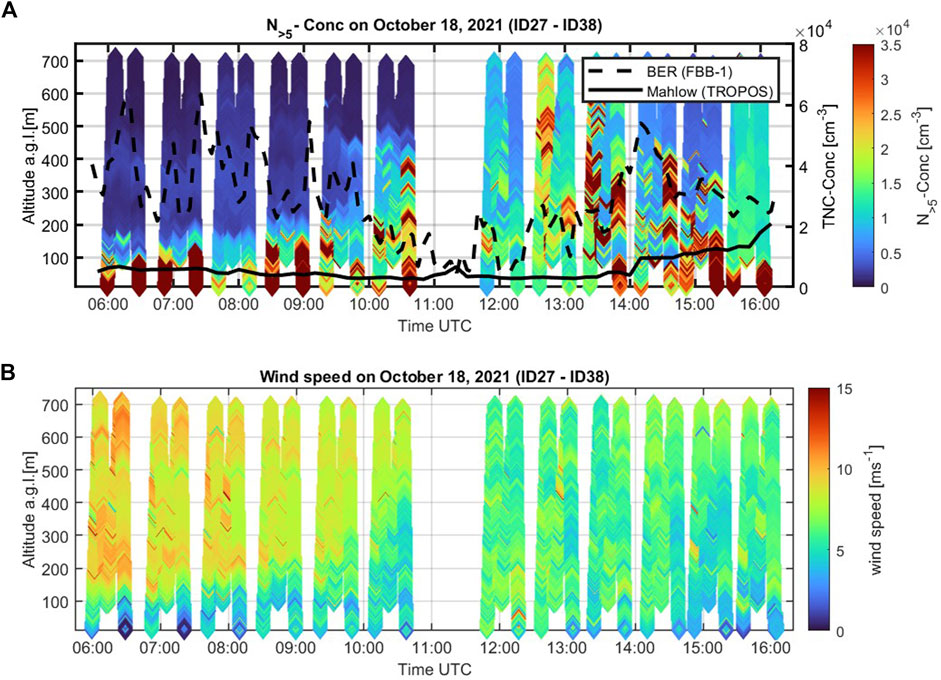
Figure 8. (A) Time series of vertical profiles of TNC and (B) wind speed, measured with ALADINA and surface data on October 19, 2021. The color bar ranges from blue (minimal) to red (maximal) according to the specific shown parameters. Surface observations of TNC are measured continuously during the ULTRAFLEB-project at the TROPOS Mahlow station (solid black line) and at FBB-1 close to BER (dashed black line) in 5 min intervals, respectively.
The strong variability of TNC during the day is linked to rush hours at BER, most pronounced between 06:30 and 08:00 UTC. The high difference of both surface TNC data set is attributed to the location of the two stations, as FBB-1 measurements are carried out in the BER plume and Mahlow is situated upwind of BER. In general, TNC measured at BER exceeds the observed TNC with ALADINA at ground, which can be explained by the horizontal distance of both sites. The ALADINA investigations are further away from the plume, so that a higher degree of diffusion has already taken place that reduces TNC in the ambient atmosphere.
All in all, the vertical distribution of TNC coincides with the lifting of the inversion layer and it is significantly coupled with enhanced wind bands at the altitude of the temperature inversion (see Figure 8B). This phenomenon was visible on all studied days, but most pronounced in the morning hours on 19 October 2021 (Sector I). This correlation is presented in detail in the following case study (see. Section 3.4).
3.4 Assessing aircraft emissions during arrival and departure
As Sector I covers the final approach at BER (see Figure 9A), it is expected to detect aircraft emissions that have been transported to the ALADINA site, influenced by wind from south. By assuming a −3° approach angle of the aircraft (see Figure 9B), Sector I should be crossed at an altitude within a range of 60–180 m a.g.l. By considering that a typical civil aircraft holds a cruising speed of around 220 km h−1 during final approach, aircraft most likely pass through Sector I in 38 s before touchdown. However, by cross-referencing the actual landing times of aircraft at BER in comparison with the measurement flights of ALADINA, aircraft generally enter Sector I a few minutes before ALADINA passed the same altitude at a distance of 2.44 km (appr 1.32 NM) away from the main approach sector. The possible overlap, which may allow to measure transported emissions exposed during arrival, is attributed to Sector I. On 19 October 2021, ALADINA performed six research flights, and four were influenced by Sector I (see Table 2, Flight ID 39-ID 42).
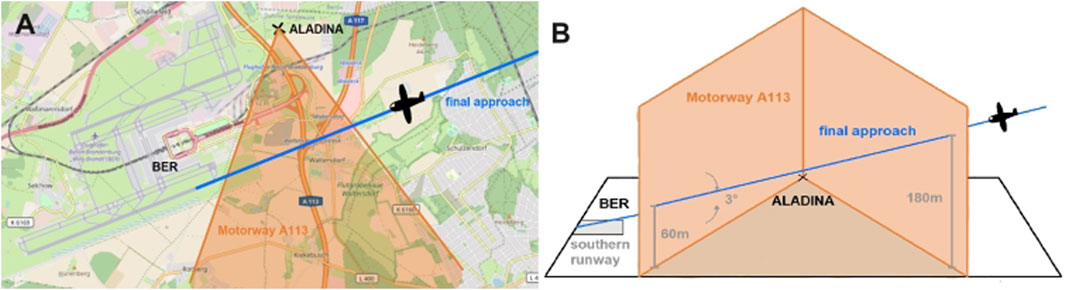
Figure 9. (A) Scheme of the case study for analysing potentially exposed emissions during the final approach for Sector I (marked in bright orange). (B) Perspective view of final approach entering Sector I and crossing the same altitude with ALADINA (black cross) at a horizontal distance of around 2.4 km.
Figure 10 shows time series of TNC profiles and wind speed profiles derived from ALADINA in comparison with surface data of TNC obtained from the two ground stations at BER from FBB-1 and at Mahlow. The vertical profiles of TNC (see Figure 10A) show highest concentrations close to ground and below the height of 100 m a.g.l., valid for the period between 06:00 and 08:30 UTC. Afterwards, enhanced TNC is visible up to 500 m a.g.l. and exhibit a high spatial variability. The continuous measurements at Mahlow present a maximum TNC of 2.8 × 104 cm−3 at around 09:45 UTC, which is attributed to the period when the wind direction changed at ground. In principle, TNC reaches almost a constant value of 0.4 × 104 cm−3 by considering the whole period except for the sporadic peak. The observation of TNC at FBB-1 varies between 0.5 and 4.8 × 104 cm−3, but peaks are less frequent and less pronounced compared to the day before (see Section 3.3). The vertical distribution of wind speed (see Figure 10B) indicates stronger wind speeds between the height of 300 and 400 m a.g.l., a so-called low level jet (LLJ). This phenomenon is still subject to current investigations (e.g., Emeis, 2014) but was firstly described in Blackadar (1957). The appearance of the LLJ strongly influences the aerosol distribution in the spatial scale. This is further shown for specific vertical profiles of ID 41 and ID 42 in Figure 11. The core of the LLJ is at an altitude of around 300 m a.g.l., which is further indicated by gray boxes in the graph. This altitude area coincides with highest gradients of potential temperature (Figure 11E), an inversion layer. This layer prevents mixing in the vertical distribution which can be seen by two different aerosol populations of TNC (Figure 11A) and N300−500 (Figure 11B) in the vertical scale.
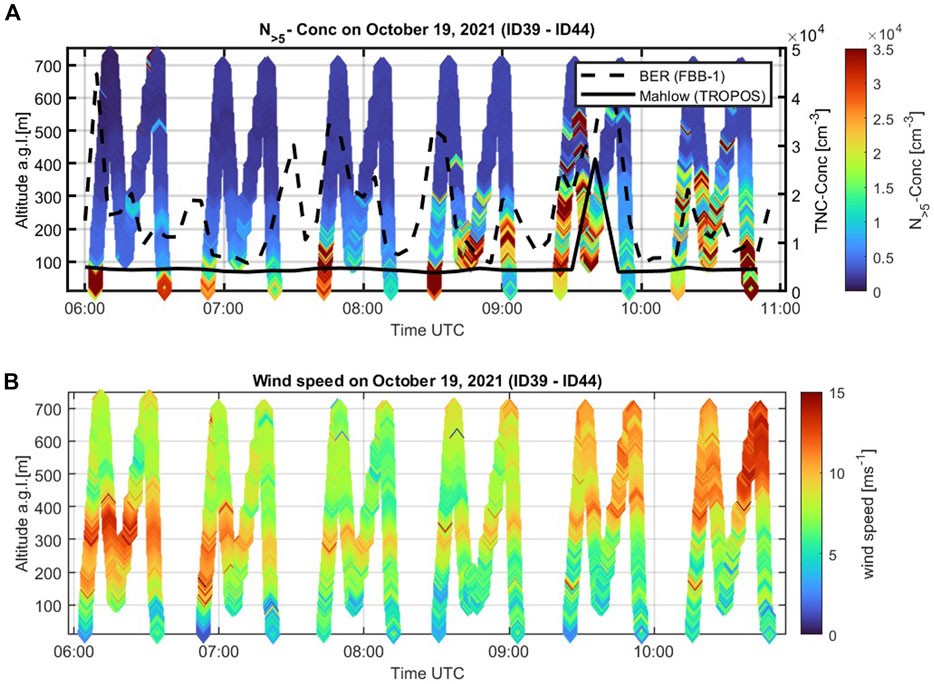
Figure 10. The same as Figure 8 but for the measurement day influenced by motorway (Sector I) on 19 October 2021. The diamonds in the graph indicate the time series of the specific investigations shown in Figure 12.
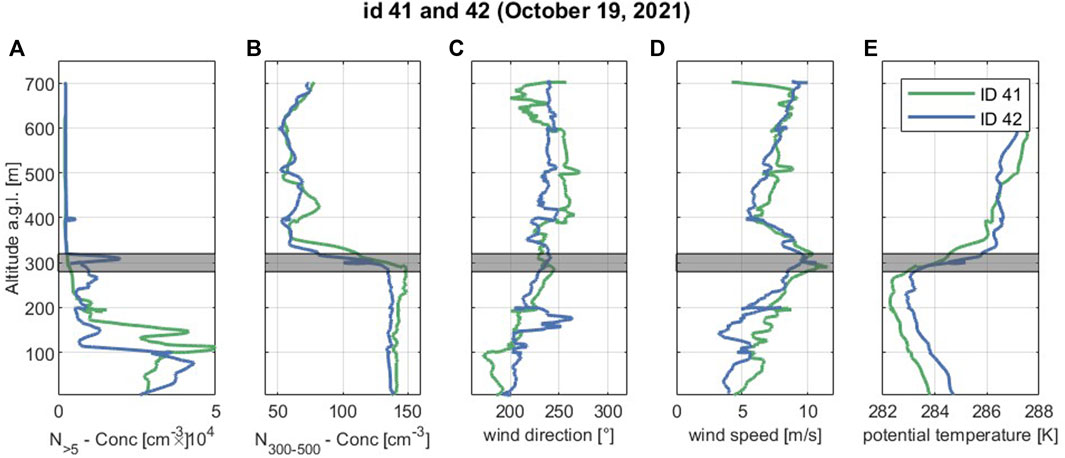
Figure 11. Vertical profiles of (A) TNC, (B) N300−500, (C) wind direction, (D) wind speed and (E) potential temperature measured with ALADINA during Flight ID 41 and Flight ID 42 on October 19, 2021.
The question is where the enhanced aerosol concentrations have their origin. In order to examine possible sources, the wind direction in the vertical distribution is considered in more detail (see Figure 11C). Close to ground, emissions are most likely dominated by car traffic from the motorway sector. Above and apart from the surface, the wind direction lies between 220° and 240° at the altitude region of the LLJ. This height area covers influences from the runway, including departures of aircraft from BER. This correlation leads to the hypothesis that aircraft emissions are transported to the ALADINA measurement site. Due to the onset of the LLJ, the horizontal transport is enhanced. To verify this assumption, a further examination is displayed in Figure 12. This graph shows time series of TNC regarding the first vertical profiles of the two measurement flights with ID 41 (Figure 12A) and ID 42 (Figure 12B), which were performed with ALADINA at 07:43–07:49 UTC and at 08:31–08:36 UTC. To consider the departing time of aircraft, an angle of climbing with 10° was assumed. The black dashed line represents the actual takeoff of the aircraft, assuming that the aircraft reaches an altitude of 700 m a.g.l. With a departure speed of 150 kts (approx. 280 km h−1). The gray dots indicate the time when the aircraft’s emissions may have reached the measurement site of ALADINA. Another requirement is taking into account that the takeoff point is approximately 6.3 km away from the measurement site of ALADINA, so that at each altitude step, the same horizontal distance is added. It is important to note that other takeoffs belong to the shown time range as well, but they are excluded in this graph. The reason for this is that their potential emissions do not intersect the displayed vertical profiles of ALADINA, as they do not fullfil the mentioned requirements. Both vertical profiles of TNC exceed the maximum of 3.5 × 104 cm−3 at an altitude below 100 m a.g.l. and decrease with growing altitude. The calculated emissions cross the two profiles at different altitudes, between ground and the lowermost 100 m a.g.l. (see Figure 12A), as well as at 300 m a.g.l., by considering the profile shown in Figure 12B. For the first case, it cannot be ruled out that car traffic from the motorway is the dominant source for the appearance of the enhanced concentrations, as they are limited in the vertical scale. However, during the second case, the time series coincides with the backwards estimated departing time of a Boeing 737–800, which is heading toward Palma de Mallorca (PMI).
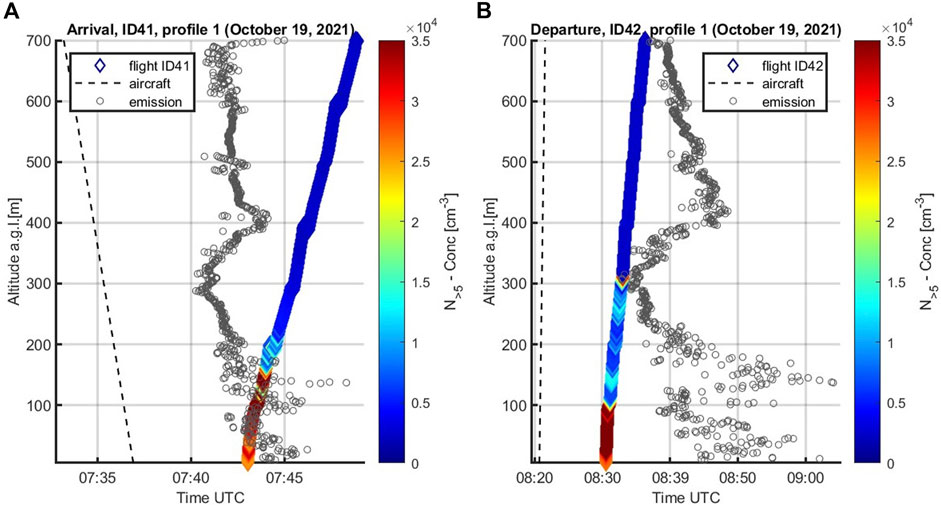
Figure 12. Time series of vertical profiles of the estimated emissions which were transported to the investigation site (gray circle), as well as profiles of TNC (the same as in Figure 11A), measured with ALADINA during Flight ID 41 (A) and Flight ID 42 (B). The emission source was assigned to takeoff of an aircraft, the corresponding departing time is shown as a dashed black line.
4 Discussion
The findings of the drone investigation address different aspects, which are recapped in relation to main topics and discussed in the following.
4.1 Comparing UAV wind observations with continuously measured surface data
By considering the surface wind direction derived from the two ground-based stations deployed at BER (FBB-1) and located further away at BDF (FBB-2) and in comparison with the ALADINA wind direction, the data is in good agreement. Lower data availability exists regarding the drone measurements near ground. This can be explained by the fact that the safety altitude for research flights is 100 m a.g.l., so that measurements at lower altitudes are considered only twice during one research flight, involving takeoff and landing. Thus, surface wind data measured with ALADINA is available to a lower degree of 24% in comparison with the results of the horizontal wind displayed for the altitude of 100–750 m. Further, the wind direction was measured at different locations, so that the minor deviation of wind direction between the two surface measurements, as well by a comparison with ALADINA, is justified due the fact of different surroundings at the surface that imply a variability in roughness properties.
4.2 Inversion layer enhances level of pollution
The vertical profiles of the median estimated meteorological parameters show that ABL properties strongly influence the vertical distribution of aerosols. This is markedly visible for Sector I, when TNC, UFP, N300−500 and eBC show highest concentrations below the inversion layer, as mixing is suppressed in the vertical. As known so far, ABL plays a crucial role in the formation of air pollution, for instance it favors conditions of phenomena like smog due to a higher potential of accumulation of the aerosol population (Petaja et al., 2016; Li et al., 2017), which is also shown here. At this point, it is important to note that a clear difference of daytime existed between the drone measurement flights that are separated into the three main surface wind sectors (see Table 2). This further allows to study the significance of the stratification of the ABL on the vertical distribution of aerosol particles. The aerosols are well-mixed during noon, mainly present for Sector III and are confined in specific altitudes with regard to inversion layers that are apparent during morning hours, here relevant for Sector I and main parts assigned to Sector II, thus favoring conditions for an increased degree of air pollution.
4.3 Role of emission sources on the appearance of UFP, accumulation mode and eBC
Principally, UFP decrease with increasing altitude and the UFP follow a similar vertical distribution as larger particles that are considered in the TNC data. Interestingly, the highest fraction of UFP/TNC is apparent for Sector I close to ground and peaks at an altitude of 500 m a.g.l. and above 650 m a.g.l. as well. The vertical distribution of UFP and TNC is characterized by a high variability, and this altitude region is influenced by a rotation of the median wind direction, indicating air masses coming from BER. The high appearance of UFP at ground is linked to car traffic, as UFP are a major source emitted from the exhaust of vehicles (Zhu et al., 2002; Ronkko et al., 2017). Although UFP do not stand out in PM with a proportion of 1–20% in relation to accumulation and coarse mode, they account for 80–90% of PN, as measured near a busy highway (e.g., Virtanen et al., 2006). Further, Shi et al. (1999) showed that traffic is the main source in an urban environment, and more than half of the measured particles belong to sizes smaller than 30 nm. According to the vertical profiles, UFP was observed to a lower extent of TNC for Sector II and for Sector III, but show a high vertical variability. By considering measurements in the lowermost 200 m, UFP are dominated by sources coming from car traffic. A clear difference between the BER plume and background site is not indicated.
Increased concentrations of the median calculated N300−500 and eBC are present for Sector I and Sector II at lower altitudes, but most pronounced for Sector I in the lowermost 300 m a.g.l. The median concentration of accumulation mode particles is higher by a factor of three in comparison with observations close to ground for Sector II and Sector III. One explanation for this may relate to aging of the pre-population, and as a dominant inversion layer is present during this case, particles’ growth might have been favored as well as a high potential for coagulation of aerosols with others. However, a possibly additional source for accumulation mode particles cannot be excluded at the ALADINA site. The increased emissions may have been transported from an area that is composed of a higher part of a rural land compared to the two other sectors that are more characterized by infrastructure, as the size distribution encompasses a broader size range. In consequence, a clear identification of sources for enhanced accumulation mode and increased eBC is not possible. Nevertheless, a significant effect of higher emissions from ground is visible in the first place that is associated with car traffic and to a smaller degree by air pollutants from Sector II.
A detailed comparison with other results is limited to ground observations. Nevertheless, the main results of the observations are in agreement with other mobile measurements that were carried out near ground, for instance like shown in Austin et al. (2021). In this study, the highest UFP concentrations were associated with a major roadway and no clear difference of the measured PN of UFP was identified between emissions linked to roadway or airport. However, emissions coming from roadway traffic were characterized by larger UFP sizes and higher concentrations of BC.
4.4 Limitations and assessments regarding the observations
As the ALADINA measurements period fell within the COVID-19 pandemic, the measured airport pollutants are most probably underestimated in comparison with periods of more frequent flight operations, which is the case apart from the limitations that were imposed in consequence of the specific pandemic regulations at BER. By considering the study of Fritz et al. (2022), TNC was measured at the Berlin-Tegel Airport (TXL), which was, however, closed in 2021. Two different measurement periods during the active phase and after closure allow a direct comparison and the results imply that 3 times lower TNC concentrations occurred after shut down. Mueller et al. (2022) showed that during the start of the pandemic, flight activity was reduced to an average of 48% and road traffic declined to 39% at BOS.
Besides a very likely underestimation of emitted pollutants during the ULTRAFLEB project due to COVID-19 reductions, a depletion of emissions is associated with the distance of the ALADINA investigation area to BER, which is around 4 km away from the center point of the runway. Gerling and Weber (2023) concluded an exponential decrease of TNC with growing distance to BER but hypothesized a domination of TNC associated to airport emissions within a horizontal range of 5 km so that the ALADINA investigation site is influenced by the plume but on minor degree in comparison with the ground station at BER (FBB-1). Further, the drone observations consider solely non-VOCs so that gas phase constitutes are of special relevance for considering the whole picture of an airport plume. Lorentz et al. (2019) investigated airport pollutants by using models of different spatial scales applied for the largest airport in Germany Frankfurt/Main (FRA). The main engines of aircraft were identified as the dominant source of the airport emissions, namely, responsible for 90% of the non-volatile components, and a strong dependence of the emissions on distance was verified by annual mean data. For instance, less than 10% of the total UFP were modelled at a distance of 2.5 km north of FRA, so that residences in the proximity should not be affected by the highest concentrations emitted from airports, but are nevertheless concerned about airport pollution emissions.
At this point, it is also important to discuss that a distinct classification of the particles’ population is not feasible by the used instrumentation, as the measured TNC covers a size range between 5 nm and 1 μm, and UFP are considered for the small size of 5–11 nm. This implies that it is currently not possible to give a reliable statement regarding the main contributor of airport pollutants, which most likely fall into a size of UFP in larger size than 11 nm. However, the study of Stacey et al. (2023) showed the highest concentrations of UFP for a size of 10 nm (mobility diameter) during departures and arrivals. This leads to the hypothesis that UFP in the very small size, as measured here, are of major relevance for airport pollutant assessments.
5 Conclusion
In contrast to other studies that have been published so far, this is the first investigation which addresses vertical profiles of airport pollutants mainly in terms of TNC, UFP and eBC, which were measured with the fixed-wing drone called ALADINA at a close distance to a runway in use. In total, 140 vertical profiles were obtained with a distance of around 4 km downwind of BER in the lowermost 750 m during the ULTRAFLEB project in October 2021. The vertical profiles were clustered according to three different surface wind regimes that represent distinguish constituents of possible pollutants, covering road traffic, airport pollutants via the BER plume and background conditions. The results of the ALADINA investigation point out that all studied vertical profiles of aerosols in different sizes are affected by the ABL stability.
The study shows that significant gradients of UFP coincide with altitude regimes where the meteorological parameters are affected by inversion layers. Further, the vertical profiles of UFP indicate that the ambient aerosol population consists to a high degree of particles in this very small size of 5–11 nm. However, those UFP occur with a high variability (3–35%) and appeared most pronounced when influenced by the road traffic sector. In addition, highest concentrations of accumulation mode (N300−500) and eBC are linked to this Sector I as well, hypothesizing that road traffic is the dominant source for air pollutants.
Nevertheless, highest TNC appear close to ground, confined by a stably stratified ABL that was most pronounced during the observations attributed to Sector II (BER plume). Therefore, it can be concluded that highest TNC are linked to sources from the southern runway at BER, thus are confined within the plume. The comparison of vertical profiles with surface measured TNC data demonstrates several characteristics. First, the degree of exposure at BER depends on the horizontal distance of the measurement site. Second, the most important target is assessing data in the plume. Third, the highest pollutants are attributed to rush hours and are confided in the vertical by the prevailing ABL properties. This relation is obvious by comparison of the vertical distribution of TNC with the vertical profiles of wind speed. In the morning hours, when TNC reaches highest values, the wind speed is low below the height of 100 m a.g.l., so that horizontal transport is limited, which further favors the increase of exposure due to a high possibility of accumulation of the pre-population. During midday, when the inversion layer is generally lifted to higher altitudes, TNC is spread over the whole ABL which goes along with a decrease of the total maximum concentrations.
There is a lot more to discover by considering a possible emission of aircraft during landing and takeoff in the spatial distribution. The investigations of the case study shown here suggest that airport pollutants can be transported in the horizontal scale further distances away. Depending on the current wind direction, a transport of aircraft pollutants is likely up to a distance of around 6 km, or even more. This was shown by cross-referencing an approaching time slot with the ALADINA measurement site. During the whole investigation period, there was no aircraft in operation of a larger size than an Airbus A320, so that this effect might play a more pronounced role at airports where flight operations are carried out with larger aircraft.
Based on the drone investigations shown here, a unique investigation of the small-scale vertical variability of TNC, UFP and eBC is derived which allows to better understand dynamic processes of airport pollutants and the results should be validated with dispersion models to complete the role of airport pollutants in the spatial scale.
Data availability statement
The raw data supporting the conclusion of this article will be made available by the authors, without undue reservation.
Author contributions
BH-A: Investigation, Validation, Visualization, Writing–original draft, Writing–review and editing, Methodology. AV: Investigation, Methodology, Validation, Visualization, Writing–review and editing. SA: Methodology, Resources, Validation, Writing–review and editing. KB: Investigation, Methodology, Validation, Writing–review and editing. LB: Conceptualization, Investigation, Methodology, Writing–review and editing. MM: Investigation, Methodology, Resources, Writing–review and editing. FP: Investigation, Methodology, Writing–review and editing. AS: Investigation, Methodology, Writing–review and editing. KW: Investigation, Methodology, Resources, Writing–review and editing. AW: Methodology, Project administration, Resources, Writing–review and editing. UW: Investigation, Methodology, Project administration, Resources, Writing–review and editing. AL: Funding acquisition, Investigation, Methodology, Project administration, Resources, Writing–review and editing.
Funding
The author(s) declare that financial support was received for the research, authorship, and/or publication of this article. This research is part of the project ULTRAFLEB (DE: Ultrafeinstaubbelastung durch Flughäfen in Berlin; EN: UFP caused by airports in Berlin) and is funded by the German Environment Agency (Umweltbundesamt) under grant REFOPLAN FKZ 3720 52 201 0. The drone ALADINA has been developed by funding of the German Research Foundation under grant LA 2907/5-1.
Acknowledgments
The authors from TU Braunschweig thank the whole ULTRAFLEB team for the opportunity of being part of the project and acknowledge Ralf Käthner from TROPOS for calibration of the aerosol sensors that are integrated in ALADINA. We want to thank Ulf Janicke, Holger Gerwig and the two referees for the valuable discussions regarding the manuscript. Further, we acknowledge support by the Open Access Publication Funds of Technische Universität Braunschweig.
Conflict of interest
The authors declare that the research was conducted in the absence of any commercial or financial relationships that could be construed as a potential conflict of interest.
The handling editor GT declared a past co-authorship with the authors MM and AW.
Publisher’s note
All claims expressed in this article are solely those of the authors and do not necessarily represent those of their affiliated organizations, or those of the publisher, the editors and the reviewers. Any product that may be evaluated in this article, or claim that may be made by its manufacturer, is not guaranteed or endorsed by the publisher.
References
Altstädter, B., Deetz, K., Vogel, B., Babić, K., Dione, C., Pacifico, F., et al. (2020). The vertical variability of black carbon observed in the atmospheric boundary layer during DACCIWA. Atmos. Chem. Phys. 20, 7911–7928. doi:10.5194/acp-20-7911-2020
Altstädter, B., Platis, A., Wehner, B., Scholtz, A., Wildmann, N., Hermann, M., et al. (2015). ALADINA – an unmanned research aircraft for observing vertical and horizontal distributions of ultrafine particles within the atmospheric boundary layer. Atmos. Meas. Tech. 8, 1627–1639. doi:10.5194/amt-8-1627-2015
Austin, E., Xiang, J., Gould, T. R., Shirai, J. H., Yun, S., Yost, M. G., et al. (2021). Distinct ultrafine particle profiles associated with aircraft and roadway traffic. Environ. Sci. Technol. 55, 2847–2858. doi:10.1021/acs.est.0c05933
Bärfuss, K., Pätzold, F., Altstädter, B., Kathe, E., Nowak, S., Bretschneider, L., et al. (2018). New setup of the UAS ALADINA for measuring boundary layer properties, atmospheric particles and solar radiation. Atmosphere 9, 28. doi:10.3390/atmos9010028
Bärfuss, K., Schmithüsen, H., and Lampert, A. (2023). Drone-based meteorological observations up to the tropopause – a concept study. Atmos. Meas. Tech. 16, 3739–3765. doi:10.5194/amt-16-3739-2023
Bendtsen, K. M., Bengtsen, E., Saber, A. T., and Vogel, U. (2021). A review of health effects associated with exposure to jet engine emissions in and around airports. Environ. Health 20, 10–455. doi:10.1186/s12940-020-00690-y
Blackadar, A. K. (1957). Boundary layer wind maxima and their significance for the growth of nocturnal inversions. Bull. Am. Meteorological Soc. 38, 283–290. doi:10.1175/1520-0477-38.5.283
Bretschneider, L., Schlerf, A., Baum, A., Bohlius, H., Buchholz, M., Düsing, S., et al. (2022). MesSBAR–multicopter and instrumentation for air quality research. Atmosphere 13, 629. doi:10.3390/atmos13040629
Campbell, P., Zhang, Y., Yan, F., Lu, Z., and Streets, D. (2018). Impacts of transportation sector emissions on future U.S. air quality in a changing climate. Part II: air quality projections and the interplay between emissions and climate change. Environ. Pollut. 238, 918–930. doi:10.1016/j.envpol.2018.03.016
Emeis, S. (2014). Wind speed and shear associated with low-level jets over Northern Germany. Meteorol. Z. 23, 295–304. doi:10.1127/0941-2948/2014/0551
Frampton, M. W., Stewart, J. C., Oberdörster, G., Morrow, P. E., Chalupa, D., Pietropaoli, A. P., et al. (2006). Inhalation of ultrafine particles alters blood leukocyte expression of adhesion molecules in humans. Environ. Health Perspect. 114, 51–58. doi:10.1289/ehp.7962
Friedmann, A., and Belz, C. (2022). Luftverkehr in Deutschland Mobilitätsbericht 2021 (DFS Deutsche Flugsicherung GmbH).
Fritz, S., Aust, S., and Sauter, T. (2022). Impact of the closure of Berlin-Tegel Airport on ultrafine particle number concentrations on the airfield. Front. Environ. Sci. 10, 1–9. doi:10.3389/fenvs.2022.1061584
Gerling, L., and Weber, S. (2023). Mobile measurements of atmospheric pollutant concentrations in the pollutant plume of BER airport. Atmos. Environ. 304, 119770. doi:10.1016/j.atmosenv.2023.119770
Habre, R., Zhou, H., Eckel, S. P., Enebish, T., Fruin, S., Bastain, T., et al. (2018). Short-term effects of airport-associated ultrafine particle exposure on lung function and inflammation in adults with asthma. Environ. Int. 118, 48–59. doi:10.1016/j.envint.2018.05.031
Harm-Altstädter, B., Bärfuss, K., Bretschneider, L., Schön, M., Bange, J., Käthner, R., et al. (2023). Spatial distribution and variability of boundary layer aerosol particles observed in Ny-Ålesund during late spring in 2018. Aerosol Res. 1, 39–64. doi:10.5194/ar-1-39-2023
Hu, S., Fruin, S., Kozawa, K., Mara, S., Winer, A. M., and Paulson, S. E. (2009). Aircraft emission impacts in a neighborhood adjacent to a general aviation airport in southern California. Environ. Sci. Technol. 43, 8039–8045. doi:10.1021/es900975f
Hudda, N., and Fruin, S. A. (2016). International airport impacts to air quality: size and related properties of large increases in ultrafine particle number concentrations. Environ. Sci. Technol. 50, 3362–3370. doi:10.1021/acs.est.5b05313
Kärcher, B. (2018). Formation and radiative forcing of contrail cirrus. Nat. Commun. 9, 1824. doi:10.1038/s41467-018-04068-0
Keuken, M., Moerman, M., Zandveld, P., Henzing, J., and Hoek, G. (2015). Total and size-resolved particle number and black carbon concentrations in urban areas near Schiphol airport (The Netherlands). Atmos. Environ. 104, 132–142. doi:10.1016/j.atmosenv.2015.01.015
Kinsey, J. S., Dong, Y., Williams, D. C., and Logan, R. (2010). Physical characterization of the fine particle emissions from commercial aircraft engines during the Aircraft Particle Emissions eXperiment (APEX) 1–3. Atmos. Environ. 44, 2147–2156. doi:10.1016/j.atmosenv.2010.02.010
Lampert, A., Altstädter, B., Bärfuss, K., Bretschneider, L., Sandgaard, J., Michaelis, J., et al. (2020). Unmanned aerial systems for investigating the polar atmospheric boundary layer—technical challenges and examples of applications. Atmosphere 11, 416–1639. doi:10.3390/atmos11040416
Lee, D., Fahey, D., Skowron, A., Allen, M., Burkhardt, U., Chen, Q., et al. (2021). The contribution of global aviation to anthropogenic climate forcing for 2000 to 2018. Atmos. Environ. 244, 117834. doi:10.1016/j.atmosenv.2020.117834
Li, Z., Guo, J., Ding, A., Liao, H., Liu, J., Sun, Y., et al. (2017). Aerosol and boundary-layer interactions and impact on air quality. Natl. Sci. Rev. 4, 810–833. doi:10.1093/nsr/nwx117
Lighty, J. S., Veranth, J. M., and Sarofim, A. F. (2000). Combustion aerosols: factors governing their size and composition and implications to human health. J. Air Waste Manag. Assoc. 50, 1565–1618. doi:10.1080/10473289.2000.10464197
Lorentz, H., Janicke, U., Jakobs, H., Hellebrandt, P., Ketzel, M., and Gerwig, H. (2019). “Ultrafine particle dispersion modelling at and around Frankfurt airport (FRA), Germany,” in 19th International Conference on Harmonisation within Atmospheric Dispersion Modelling for Regulatory Purposes, Bruges, Belgium, 3 - 6 June 2019.
Masiol, M., and Harrison, R. M. (2014). Aircraft engine exhaust emissions and other airport-related contributions to ambient air pollution: a review. Atmos. Environ. 95, 409–455. doi:10.1016/j.atmosenv.2014.05.070
Mazaheri, M., Johnson, G., and Morawska, L. (2011). An inventory of particle and gaseous emissions from large aircraft thrust engine operations at an airport. Atmos. Environ. 45, 3500–3507. doi:10.1016/j.atmosenv.2010.12.012
Mueller, S. C., Hudda, N., Levy, J. I., Durant, J. L., Patil, P., Lee, N. F., et al. (2022). Changes in ultrafine particle concentrations near a major airport following reduced transportation activity during the COVID-19 pandemic. Environ. Sci. Technol. Lett. 9, 706–711. doi:10.1021/acs.estlett.2c00322
Peace, H., Maughan, J., Owen, B., and Raper, D. (2006). Identifying the contribution of different airport related sources to local urban air quality. Environ. Model. Softw. 21, 532–538. doi:10.1016/j.envsoft.2004.07.014
Petäjä, T., Järvi, L., Kerminen, V.-M., Ding, A., Sun, J., Nie, W., et al. (2016). Enhanced air pollution via aerosol-boundary layer feedback in China. Sci. Rep. 6, 18998. doi:10.1038/srep18998
Riley, K., Cook, R., Carr, E., and Manning, B. (2021). A systematic review of the impact of commercial aircraft activity on air quality near airports. City Environ. Interact. 11, 100066. doi:10.1016/j.cacint.2021.100066
Rodríguez-Díaz, A., Adenso-Díaz, B., and González-Torre, P. (2017). A review of the impact of noise restrictions at airports. Transp. Res. Part D Transp. Environ. 50, 144–153. doi:10.1016/j.trd.2016.10.025
Rönkkö, T., Kuuluvainen, H., Karjalainen, P., Keskinen, J., Hillamo, R., Niemi, J. V., et al. (2017). Traffic is a major source of atmospheric nanocluster aerosol. Proc. Natl. Acad. Sci. 114, 7549–7554. doi:10.1073/pnas.1700830114
Schwartz, J. (2001). Air pollution and blood markers of cardiovascular risk. Environ. Health Perspect. 109, 405–409. doi:10.1289/ehp.01109s3405
Shi, J. P., Khan, A., and Harrison, R. M. (1999). Measurements of ultrafine particle concentration and size distribution in the urban atmosphere. Sci. Total Environ. 235, 51–64. doi:10.1016/S0048-9697(99)00189-8
Stacey, B. (2019). Measurement of ultrafine particles at airports: a review. Atmos. Environ. 198, 463–477. doi:10.1016/j.atmosenv.2018.10.041
Stacey, B., Harrison, R. M., and Pope, F. D. (2023). Emissions of ultrafine particles from civil aircraft: dependence upon aircraft type and passenger load. npj Clim. Atmos. Sci. 6, 161. doi:10.1038/s41612-023-00477-1
Stafoggia, M., Cattani, G., Forastiere, F., Di Menno di Bucchianico, A., Gaeta, A., and Ancona, C. (2016). Particle number concentrations near the Rome-Ciampino city airport. Atmos. Environ. 147, 264–273. doi:10.1016/j.atmosenv.2016.09.062
Unal, A., Hu, Y., Chang, M. E., Talat Odman, M., and Russell, A. G. (2005). Airport related emissions and impacts on air quality: application to the Atlanta International Airport. Atmos. Environ. 39, 5787–5798. doi:10.1016/j.atmosenv.2005.05.051
Virtanen, A., Rönkkö, T., Kannosto, J., Ristimäki, J., Mäkelä, J. M., Keskinen, J., et al. (2006). Winter and summer time size distributions and densities of traffic-related aerosol particles at a busy highway in Helsinki. Atmos. Chem. Phys. 6, 2411–2421. doi:10.5194/acp-6-2411-2006
Westerdahl, D., Fruin, S. A., Fine, P. L., and Sioutas, C. (2008). The Los Angeles International Airport as a source of ultrafine particles and other pollutants to nearby communities. Atmos. Environ. 42, 3143–3155. doi:10.1016/j.atmosenv.2007.09.006
Winther, M., Kousgaard, U., Ellermann, T., Massling, A., Nøjgaard, J. K., and Ketzel, M. (2015). Emissions of NOx, particle mass and particle numbers from aircraft main engines, APU’s and handling equipment at Copenhagen Airport. Atmos. Environ. 100, 218–229. doi:10.1016/j.atmosenv.2014.10.045
Zhu, Y., Fanning, E., Yu, R. C., Zhang, Q., and Froines, J. R. (2011). Aircraft emissions and local air quality impacts from takeoff activities at a large International Airport. Atmos. Environ. 45, 6526–6533. doi:10.1016/j.atmosenv.2011.08.062
Keywords: airport pollution, aerosol particles, atmospheric boundary layer, drone, vertical measurements, surface wind sector, road traffic emissions
Citation: Harm-Altstädter B, Voß A, Aust S, Bärfuss K, Bretschneider L, Merkel M, Pätzold F, Schlerf A, Weinhold K, Wiedensohler A, Winkler U and Lampert A (2024) First study using a fixed-wing drone for systematic measurements of aerosol vertical distribution close to a civil airport. Front. Environ. Sci. 12:1376980. doi: 10.3389/fenvs.2024.1376980
Received: 30 January 2024; Accepted: 25 March 2024;
Published: 05 April 2024.
Edited by:
Gloria Titos, University of Granada, SpainReviewed by:
Fernando Rejano, Generalized Retrieval of Atmosphere and Surface Properties (GRASP), FranceAna Isabel Calvo, University of León, Spain
Copyright © 2024 Harm-Altstädter, Voß, Aust, Bärfuss, Bretschneider, Merkel, Pätzold, Schlerf, Weinhold, Wiedensohler, Winkler and Lampert. This is an open-access article distributed under the terms of the Creative Commons Attribution License (CC BY). The use, distribution or reproduction in other forums is permitted, provided the original author(s) and the copyright owner(s) are credited and that the original publication in this journal is cited, in accordance with accepted academic practice. No use, distribution or reproduction is permitted which does not comply with these terms.
*Correspondence: Barbara Harm-Altstädter, b.altstaedter@tu-braunschweig.de
†Present address:
Anna Voß, Institute of Aeronautics and Astronautics, Technische Universität Berlin, Berlin, Germany