Strategy for evaluating the status of relay protection equipment for the new generation of intelligent substations
 Dapeng Liu*
  Jinjing Zhang
- State Grid Jilin Electric Power Co., LTD., Jilin, China
With the rapid development of power grid, the structure and technology of the secondary system in substations are also constantly innovating. The new generation of intelligent substations has achieved online monitoring functions for secondary equipment, making some state variables of relay protection equipment become observable indicators. Based on this, this paper proposes a novel relay protection equipment status evaluation strategy. Firstly, considering the fuzziness and uncertainty of the boundary division of relay protection evaluation levels, a relay protection risk assessment method based on normal cloud model has been proposed. Then, due to the particularity of historical statistical data, a weight calculation method combining analytical hierarchy process (AHP) and entropy weight method is adopted to eliminate subjective factors in the weight calculation process. Meanwhile, the equipment operation risk level was determined by calculating the certainty of the corresponding evaluation level for each indicator. Finally, in case study, the proposed method is used to evaluate the status of relay protection equipment, and the feasibility and accuracy of this method are verified through the analysis of the results.
1 Introduction
1.1 Background and motivation
At present, the development of the national economy largely depends on the continuity of power transmission. To ensure the reliability of electricity consumption, it is necessary to ensure the safety and stability of electricity consumption (Tse et al., 2020; Hatziargyriou et al., 2021; Wu et al., 2023). With the continuous evolution of the power grid structure, its operational uncertainty is increasing year by year, posing new challenges to the reliable operation of relay protection equipment (Castellani et al., 2014; Ahmed et al., 2016; Jia et al., 2024). Due to the influence of certain factors such as equipment aging, external interference, incorrect parameter settings, communication failures and so on, the state of relay protection equipment may undergo changes, affecting the normal operation of the equipment. According to the requirements of the “four characteristics” of relay protection (i.e., reliability, selectivity, sensitivity, and speed), once there is a fault within the power grid, it is necessary to accurately, quickly, and effectively limit it to the minimum range to avoid the chain development and expansion of accidents. Against the backdrop of such rapid development in the power system, it remains to be tested whether traditional relay protection and setting principles can adapt to the constantly improving and complex topology of the power grid. Especially in the case of internal hidden faults in relay protection devices, it is necessary to quantify and evaluate the impact of their abnormal operation on the power grid, and quantitatively evaluate the correctness of relay protection actions and operational risks (Hao et al., 2018; Xia and Zhang, 2018).
1.2 Literature review
Relay protection status evaluation has evolved with the development of condition based maintenance technology, mainly based on online monitoring data and offline statistical data, as well as combining with actual operating environment, to obtain information that characterizes the operating status of equipment. By establishing a suitable evaluation model to comprehensively judge the operating status of equipment, it provides a theoretical basis for condition based maintenance and fault diagnosis, and helps to improve the level of lean equipment operation management. The commonly used state evaluation theories currently include fuzzy set theory (Bansal, 2003), evidence theory (Li et al., 2013), grey theory (Guo et al., 2014), and rough set theory (Jiang et al., 2007). In (Hu et al., 2023), the authors employ the Arrhenius model and consider various environmental and reliability factors. This approach offers a more accurate representation of the actual operation status of relay protection equipment (Guo et al., 2022). Introduces a relay protection status evaluation method based on fuzzy support vector machines. Based on status inspection and fault records, the remaining life percentage of each inspection point equipment can be calculated. The original unstructured record data of relay protection device defects may pose challenges for data mining due to a lack of quantitative assessment. Therefore, (Zheng et al., 2023), introduces an evaluation method for the quality of unstructured defect record texts of relay protection equipment based on the relay protection device fault text ontology and knowledge graph. This method reveals the characteristics of data quality in terms of text length, defect level, and dispatching area (Gama et al., 2021). Assesses the function of differential protection for transmission lines based on incremental current from both mathematical and experimental perspectives, and tests different fault scenarios for application (Srivastava et al., 2023). Introduces an experimental validation of a transmission line protection scheme based on dynamic state estimation under different fault types and conditions. The protection scheme utilizes real-time high-frequency sampling measurements from advanced sensors, avoiding potential issues with relay coordination. The reliability analysis of vertically integrated protection devices is crucial for the design of substations based on the International Electrotechnical Commission (IEC) 61850 standard (Li et al., 2023). Constructs a reliability analysis model for protection devices and their protection systems using the functional information transmission chain of protection devices, measurement and control devices, merging units, and intelligent terminals based on the fault tree analysis method. Reference (Wang et al., 2018) has established a relatively complete evaluation index system for intelligent substation relay protection devices from the perspective of maintenance and operation. It proposes a fuzzy comprehensive evaluation method based on the membership trapezoidal cloud model, which takes into account the ambiguity and randomness of indicator information. When the evaluation results are similar, the principle of maximum member-ship degree is adopted, which can easily lead to indistinguishable evaluation results and misjudgment. Reference (Xu and Lin, 2018) proposes a generalized evidence theory evaluation method for line relay protection, which first combines the output results of cloud models and fuzzy comprehensive evaluation methods, and obtains the initial probability distribution of the evidence theory through confidence correction. The application of fuzzy evidence theory in equipment condition assessment has improved the accuracy and reliability of the assessment to a certain extent. Unfortunately, there are still limitations such as over-dependence on parameter settings and high computational complexity.
1.3 Contributions and organization
Evaluating the operational status of relay protection equipment is essentially a comprehensive consideration of the uncertainty, fuzziness, and dynamic changes of various factors. How to effectively utilize the operational status information is the key to the relay protection status evaluation methods. However, there are still several challenges in the current evaluation of relay protection status:
(1) Firstly, the existing state evaluation model is not yet comprehensive. The evaluation of relay protection status is a multi-indicator and multi-level evaluation process, with different weight calculation methods, and the evaluation process is fuzzy and uncertain.
(2) The processing method of evaluation results is not considered. The evaluation principle generally adopts maximum membership or other reliability criteria, and the judgment method ignores the fuzziness of the evaluation level. Therefore, there is still room for improvement in accurately expressing and describing the operating status of the equipment.
To overcome the shortcomings mentioned above, this paper proposes a relay protection equipment status evaluation strategy for the new generation of intelligent sub-stations, from the perspective of real-time operation status and historical risk of relay protection equipment, which can provide theoretical basis for intelligent operation and maintenance of relay protection equipment and fault diagnosis technology. The innovation of this paper are as follows:
(1) Considering the actual needs of relay protection equipment status evaluation and the fuzziness in the process of qualitative and quantitative evaluation transformation, and the advantage of cloud model theory is that it considers the random characteristics of the evaluation process. In all, the introduction of cloud model theory in relay protection equipment status evaluation can overcome the shortcomings of previous fuzzy evaluation and be more in line with engineering practice.
(2) This article uses the AHP entropy weight method to combine and assign weights to the evaluation system, achieving complementary advantages and disadvantages of subjective objective evaluation methods. It can not only overcome the one-sidedness and conservatism of subjective methods, but also accurately reflect the importance of indicators, thereby achieving accurate evaluation of the status of relay protection equipment.
The framework of this article is arranged as follows: in Section 2, the cloud theory is introduced to describe the random characteristics of the evaluation process and detailed status evaluation model for relay protection is given. Then, Section 3 makes a detailed description of evaluation boundary fuzzy processing and cloud model parameter determination methods. Then, a real-world case study is used to demonstrate the effectiveness and feasibility of the proposed method. Finally, Section 5 concludes the whole paper.
2 Evaluation model for relay protection based on cloud theory
This paper introduces the cloud model method to handle the randomness and fuzziness of historical statistical data information in Section 2.1. Meanwhile, Section 2.2 gives status evaluation indicators for relay protection equipment. Finally, a combination model based on AHP and Entropy Weight (EW) Method are used to determine the wigth, which is given in Section 2.3, thus making the evaluation system weights more in line with engineering practice.
2.1 Introduction to cloud model
Cloud model is a mapping theory based on probability theory and fuzzy mathematics theory, used to achieve the uncertainty transformation between qualitative concepts and their quantitative values. The basic mathematical expression of the cloud model is as follows:
Firstly, make the following definition. W represents the domain, and K represents a qualitative concept related to W. Let
The cloud distribution map reflects the distribution characteristics of the concept through three feature parameters: mathematical expectations Ex, entropy En, and hyperentropy He. Among them, Ex reflects the distribution center of cloud droplets and can significantly characterize the qualitative quantitative transformation center; En represents the degree of dispersion of cloud droplets; He represents the stability of cloud droplets and the uncertainty of entropy. The indicator diagram of cloud model is shown in Figure 1.
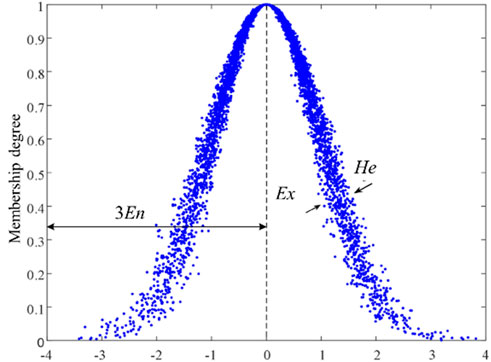
Figure 1. The indicator diagram of cloud model.
It should be noted here that due to the special mathematical connections between cloud parameters, the special structure of the cloud model only requires input of relaxed constraints compared to fuzzy set theory, which can obtain membership functions with stronger ability to describe uncertainty. Considering the actual needs of relay protection equipment status evaluation and the fuzziness in the process of qualitative and quantitative evaluation transformation, and the advantage of cloud model theory is that it considers the random characteristics of the evaluation process. In all, the introduction of cloud model theory in relay protection equipment status evaluation can overcome the shortcomings of previous fuzzy evaluation and be more in line with engineering practice.
Cloud generators mainly include forward cloud generators and reverse cloud generators, and this paper mainly uses forward cloud generators. In detail, based on the digital features of the cloud model and the number of cloud droplets N, a normal cloud generator can be used to calculate the quantitative values of the output cloud droplets. These cloud droplets can form a cloud map. The standard definition of a normal cloud model is given below: let U be a quantitative domain represented by precise numerical values, and T be a qualitative concept on U. If a quantitative value
To gain a better understanding, the forward cloud generator algorithm can be described as follows:
(1) Input the characteristic values of the cloud model, and first generate a normally distributed random number
(2) Generate a normal random number x, x = Norm (Ex, En), where the expected value is Ex, the standard deviation is En, and x is the a cloud droplet on a cloud model;
(3) Determine the degree of certainty μ that cloud droplet x belongs to the cloud model through steps (1) and (2);
(4) Repeat steps (1) and (3) and set the number of cloud droplets N to output a positive cloud model with characteristic values of (Ex, En, He).
2.2 Status evaluation indicators for relay protection equipment
The historical operation information of relay protection equipment contains hidden information that characterizes equipment faults, aging, and operational risks. By evaluating the historical operation level of equipment, it is possible to predict equipment operation risks in advance and provide decision-making for maintenance and fault diagnosis. The evaluation of the historical operation level of equipment is essentially a comprehensive consideration of the relative quality of the equipment, by analyzing statistical data during operation, to identify weak links in the relay protection system. When not considering the operating conditions before the protection equipment is put into operation, the historical information of the secondary equipment is mainly obtained from the equipment’s historical operation and maintenance records, which mainly includes the following two aspects: historical operation status and maintenance status. The historical operation status mainly includes the defects and faults of the equipment since its operation, equipment operation assessment indicators, and family operation data of the same model (batch) of equipment. The equipment maintenance situation mainly includes the regular inspection and countermeasures of the equipment, as well as supplementary verification in case of equipment modification or plug-in updates. This paper selects historical statistical data from a certain device, as shown in Table 1, and the indicator scoring criteria are shown in Table 2.
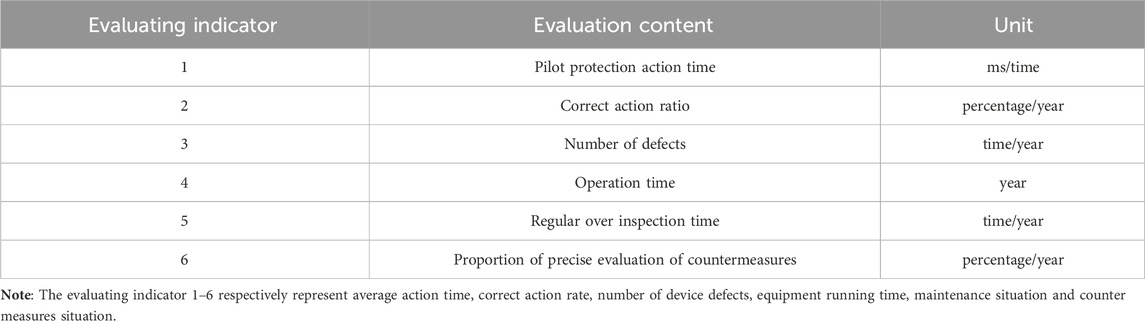
Table 1. Evaluation indicators and their content.
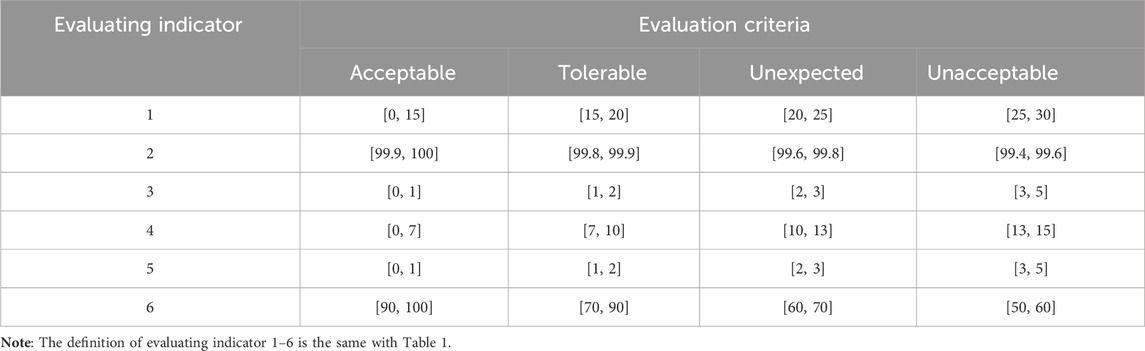
Table 2. Evaluation criteria for different indicators.
2.3 Weight calculation method
The existing weight calculation methods are usually divided into subjective weighting methods and objective weighting methods. The subjective weighting method involves collecting opinions from relevant experts and unifying their opinions through a multi-round scoring model to achieve a subjective evaluation. Its advantage is that the conclusions drawn are usually intuitive and consistent with the basic experience of system operation. The objective weighting method evaluates the operational status through the relevant digital features of its operational indicators, with the advantage that it is usually more in line with the actual operational situation. This paper adopts the AHP-EW combined method and assign weights to the evaluation system, in order to complement the advantages and disadvantages of the subjective objective evaluation method and make the weight of the evaluation system more in line with engineering practice. Analytical Hierarchy Process (AHP) and Entropy Weight Method are two commonly used multi-criteria Decision Analysis methods. AHP mainly determines the weights of various factors through steps such as constructing a hierarchical structure model, constructing a judgment matrix, single-level sorting, and consistency testing. On the other hand, the Entropy Weight Method determines the weights by calculating the information entropy of each indicator based on the theory of information entropy. Combining the two methods for the assessment of relay protection status allows for the comprehensive consideration of both experts’ subjective judgments and the objective information inherent in the data, thus improving the accuracy of the assessment. Below are the detailed steps for combining AHP and Entropy Weight Method in relay protection status assessment:
(1) Define Assessment Objectives and Indicators: Determine the overall objectives of the relay protection status assessment, such as the overall performance, safety, and reliability of the equipment. Select and identify specific assessment indicators based on the overall objectives, such as equipment operation time, fault frequency, maintenance records, etc.
(2) Construct a Hierarchical Structure Model: Build a hierarchical structure model for the assessment objectives and indicators, typically including the goal level, criterion level, and indicator level.
(3) Create a Judgment Matrix: For each element in the criterion and indicator levels, construct a pairwise comparison judgment matrix through expert scoring or group discussion. The elements of the judgment matrix are generally assigned using the 1–9 scale method, indicating the relative importance among various elements.
(4) Single-Level Sorting and Consistency Testing: Utilize the judgment matrix to calculate the weight vectors of each element and perform consistency testing. If the consistency test fails, readjust the judgment matrix until it meets the consistency requirements. Calculate Entropy Values and Entropy Weights
(5) Collect actual data and construct a decision matrix: Calculate the entropy values of each indicator based on the decision matrix. Determine the entropy weights of each indicator based on the entropy values, reflecting the objective information of the data.
(6) Determine the Combined Weights: Combine the weights obtained from the analytical hierarchy process and the Entropy Weight Method to determine the combined weights through a certain method (such as weighted averaging).
(7) Conduct Status Assessment: Calculate the comprehensive scores of each assessment object based on the combined weights and the decision matrix. Rank and evaluate the relay protection status based on the comprehensive scores.
(8) Result Analysis and Improvement: Analyse the assessment results to identify the key factors affecting the relay protection status. Develop appropriate improvement measures based on the analysis results to enhance the performance and safety of the equipment.
By following these steps, an accurate and comprehensive assessment of relay protection status can be achieved, taking into account both subjective expert opinions and objective data information.
3 Evaluation boundary fuzzy processing and cloud model parameter determination
3.1 Boundary division method
As mentioned in Table 2, this paper divides the risk level status of various indicators of relay protection into four levels: acceptable level, tolerable level, unexpected level, and unacceptable level, represented by V1, V2, V3, and V4, respectively. The specific status is determined by searching for relevant information and regulations, and the risk level classification of relay protection devices is shown in Table 3.
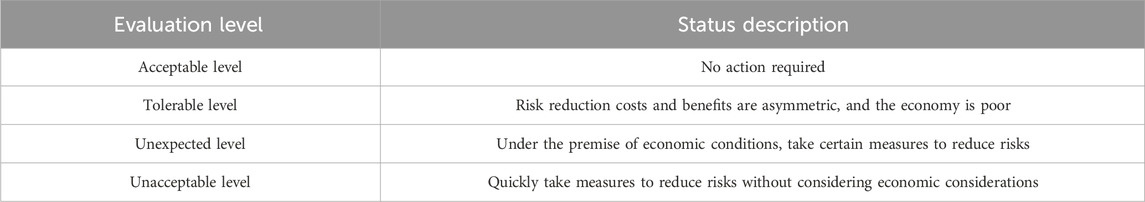
Table 3. Classification of relay protection evaluation levels.
To facilitate the determination of the risk level of each evaluation indicator and eliminate the impact of indicator category differences, the evaluation values and risk level standard set of each indicator are uniformly normalized to the interval [0,1]. 0 represents acceptable risk of relay protection equipment, and 1 represents unacceptable risk. The larger the standardized value, the more unacceptable the risk of the protection equipment. Below, the selected status information is classified and processed.
The state parameters represented by the number of times should be handled using a normal distribution function. Generally speaking, the distribution pattern of historical data is difficult to characterize with a certain type of probability distribution. Normal distribution, due to its good mathematical form, reflects the probability distribution of random variables well. Therefore, a normal distribution function is applied to fuzzily quantify degree type indicators. For increasing and decreasing indicators, they can be represented by larger/smaller normal distribution functions, as shown in Eqs 2, 3:
Here,
The statistical data on the aging degree of the reaction device, such as operating years and action time, should be processed in the form of indicators, as shown in Eq. 4.
3.2 Cloud parameter determination
Because the qualitative concepts represented by cloud droplets have randomness and fuzziness, which can weaken the subjective randomness of indicator evaluation, a hard grading of the risk level boundary of relay protection operation is performed to construct the cloud model. By combining the eigenvalues (Ex, En, He) of the normal cloud model, considering the level constraints of each evaluation indicator, and considering the uncertainty of the level boundary conditions, a relay protection risk level based on cloud model is established after moderate expansion. The basic principle of the comprehensive evaluation method using cloud models is to treat the qualitative indicator level of the research problem as a concept of natural language, and map it to a cloud. Based on the evaluation indicator standard set and the normalization method of the level standard, the corresponding cloud digital features of the level are calculated. Then, based on entropy and super entropy, normal distribution random numbers are generated to form cloud droplets, and the cloud generator generates the evaluation factor belonging to a certain level of cloud model; Based on the statistical data of the samples to be evaluated, calculate the certainty of each indicator belonging to each level, and combine the corresponding factor weights to obtain the comprehensive certainty. Considering the reliability of the cloud model’s comprehensive evaluation method, use the evaluation model to analyze the risk level of relay protection devices, and finally apply the level characteristic values to determine the risk level of the evaluation samples. To gain a better understanding, a case is given. For example, given a certain evaluation indicator xi, the interval after fuzzy processing of the evaluation level is set to [x1, x2], [x3, x4], [x5, x6], [x7, x8].
(1) Solve mathematical expectation Ex. The expectation of the cloud model is obtained through boundary constraint conditions at each level, and the calculation formula is shown as Eq. 5:
(2) Solve entropy En. The adjacent evaluation levels have a dynamic transition characteristic, and the artificial hard grading has fuzziness and subjectivity. Obviously, if the two point values in xi and xi+1 belong to different states with the same degree of certainty, then Eqs 6–8 are satisfied
Here, xi and xi+1 represent the adjacent boundaries of two levels; s is a constant, and based on the correlation between the fuzziness and randomness of the corresponding evaluation object, this paper takes 0.005. This article comprehensively considers the risk assessment boundary and calculates the cloud feature parameters of the risk boundary using the above formulas.
3.3 Full process description of relay protection equipment status evaluation
The basic principle of the comprehensive evaluation method using cloud models is to treat the qualitative indicator level as a natural language concept and map it to a cloud. Based on the evaluation indicator standard set and the normalization method of the level standard, the corresponding cloud digital features of the level are calculated. Then, based on entropy and hyperentropy, normal distribution random numbers are generated to form cloud droplets, and the cloud generator generates the evaluation factor belonging to a certain level of cloud model. Based on the statistical data of the samples to be evaluated, calculate the certainty of each indicator belonging to each level, and combine the corresponding factor weights to obtain the comprehensive certainty. Considering the reliability of the evaluation method using cloud model, analyze the risk level of relay protection devices, and finally apply the level characteristic values to determine the risk level.
The detailed calculation steps are as follows:
(1) Determine the classification indicators and category standard set of the research object, and perform fuzzy processing on the classification indicators and category standard set according to the standardized Formula 1–4.
(2) Based on the evaluation indicator digital features of the cloud model, a normal cloud generator is applied to generate cloud models for each evaluation indicator level. The evaluation indicators for cloud digital features of a certain level standard can be calculated using Formula 6–8.
(3) Based on the collected historical statistical data, the uncertainty of each indicator level is calculated to form a comprehensive evaluation matrix A. Combined with the weight w of the indicator calculated using unascertained rational numbers, the variable fuzzy evaluation model Formula 9 is used to calculate the comprehensive membership degree of the corresponding level by analyzing the values of different model parameters.
Here,
(4) Finally, by analysing the level characteristics and obtaining comprehensive evaluation results, the risk level of each indicator is determined.
In summary, the specific operation process of the cloud model comprehensive evaluation method is shown in Figure 2.
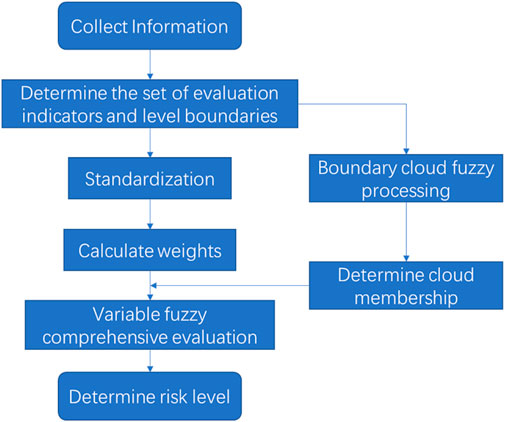
Figure 2. Process of the cloud model comprehensive evaluation method.
4 Case study
4.1 The introduction of test data
In this section, we selected a newly built 220 kV intelligent substation and used a differential protection device for a certain line as the research object to verify the effectiveness and feasibility of the method proposed in this paper. Compared to smart stations of other voltage levels, 220 kV smart stations have a relatively high degree of technological maturity and have been widely applied in actual operation. This means that conducting relay protection status estimation research on 220 kV smart stations can yield more reliable data and results. Firstly, obtain the historical status information of the protection device and the risk assessment statistical data is shown in Table 4. The data collection in this article is mainly obtained through online monitoring. For intelligent substations, according to the DL/T860 engineering implementation standard, the network topology of relay protection system intelligent substations is divided into three layers, namely, station control layer, interval layer, and process layer. The operation status of the microcomputer protection device comes from the self-check of the device, mainly including CPU status, sampling status, memory status, as well as the input and output status of the device. Smart substations integrate advanced information technology, automation control, and communication technology, enabling them to automatically collect equipment status information. The collected data is automatically analysed and processed by computers, providing real-time understanding of the grid’s operational status and enabling prompt detection and handling of issues, thus eliminating the need for manual data recording. In contrast, conventional substations require the installation of additional status monitoring units on primary equipment to achieve similar data collection capabilities, resulting in lower levels of automation and intelligence in data acquisition. Accurate evaluation data reflecting the status of relay protection equipment can be obtained through backend monitoring equipment. Five experts were selected, all of whom have a bachelor’s degree or above and are engaged in relay protection related work. Information is collected by distributing electronic questionnaires. Before the evaluation, researchers first solicited the willingness of experts to participate to ensure the smooth progress of the evaluation.
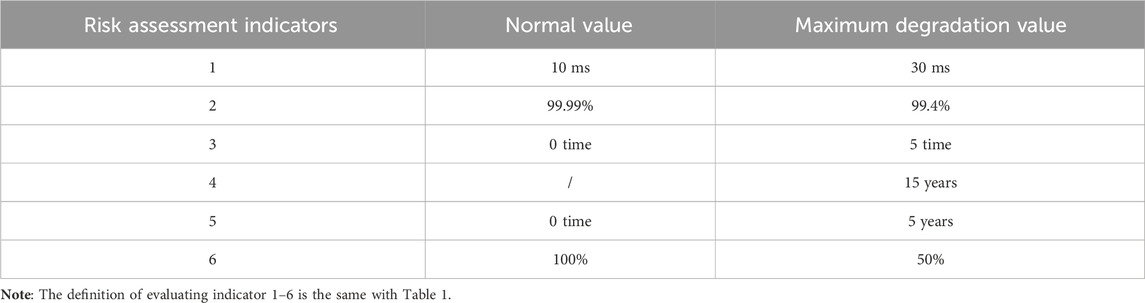
Table 4. Risk assessment statistical data.
Based on historical statistical data of relay protection, the risk assessment model established in this paper is adopted. Firstly, based on the AHP-EW method, the weight of the selected indicators is solved. Then, the risk level boundary is fuzzily quantified using cloud model calculation method. After obtaining the cloud membership degree of each risk level corresponding to a single indicator, an evaluation matrix is established. Finally, the operational risk level of the protection device is determined by combining the variable fuzzy set evaluation model.
4.2 Weight calculation
Investigate the importance evaluation of historical status information evaluation indicators by multiple experts in relay protection operation and maintenance, and assign weights to the evaluation values of multiple authoritative experts based on the AHP-EW combined method. In this paper, the number of experts is 4. Detailed quantitative standards for authoritative experts is given in Table 5.
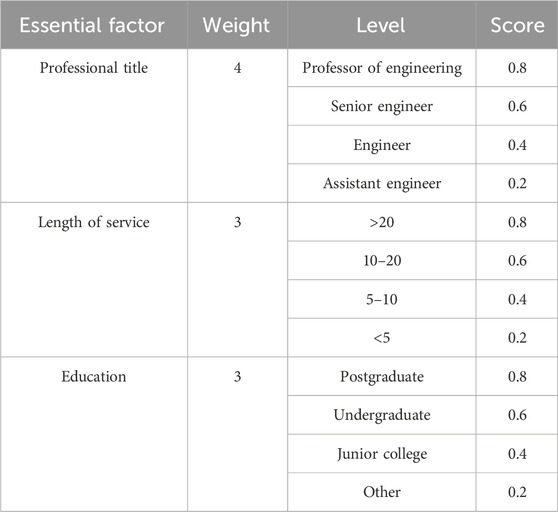
Table 5. Detailed quantitative standards for authoritative experts.
According to the weight calculation strategy, the weight assignment value of average action time is 5.6848. Similarly, the weight assignment values for correct action rate, number of device defects, operation time, maintenance situation, and precise evaluation of countermeasures can be obtained, which is shown in Figure 3.
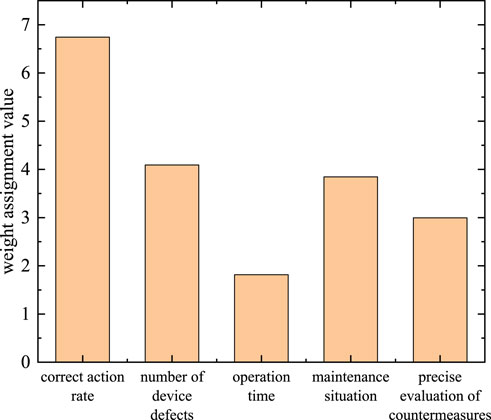
Figure 3. Weight assignment values for different evaluating indicators.
4.3 Analysis of risk assessment results for relay protection equipment
Based on the operation specifications of relay protection devices and practical operation and maintenance experience, the evaluation level boundary standards of relay protection state parameters are processed and hard graded. The calculation results of each state level Vi (i = 1, 2, 3, 4) are shown in Table 6.
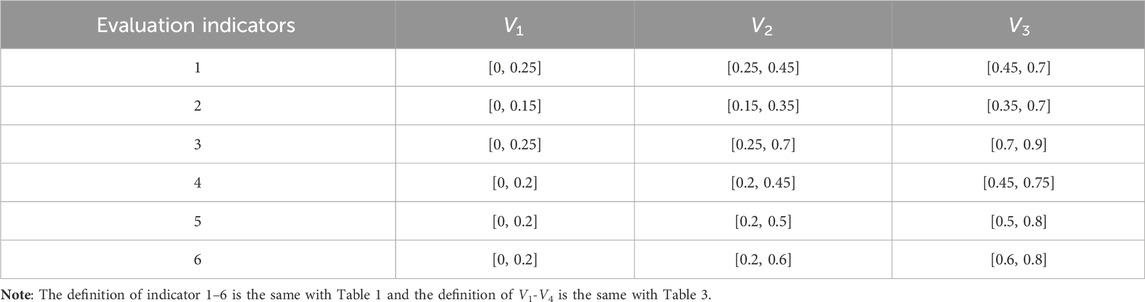
Table 6. Detailed quantitative standards for authoritative experts.
Treat the boundary of relay protection level as a double constraint condition [xi, xi+1], apply the interval eigenvalue formula of the cloud model mentioned earlier, calculate the boundary level eigenvalue Ex, En and He for each indicator, and finally output the normal cloud model of relay protection evaluation indicators to achieve softening of the boundary. The characteristic values of each indicator cloud model are shown in Figure 4.
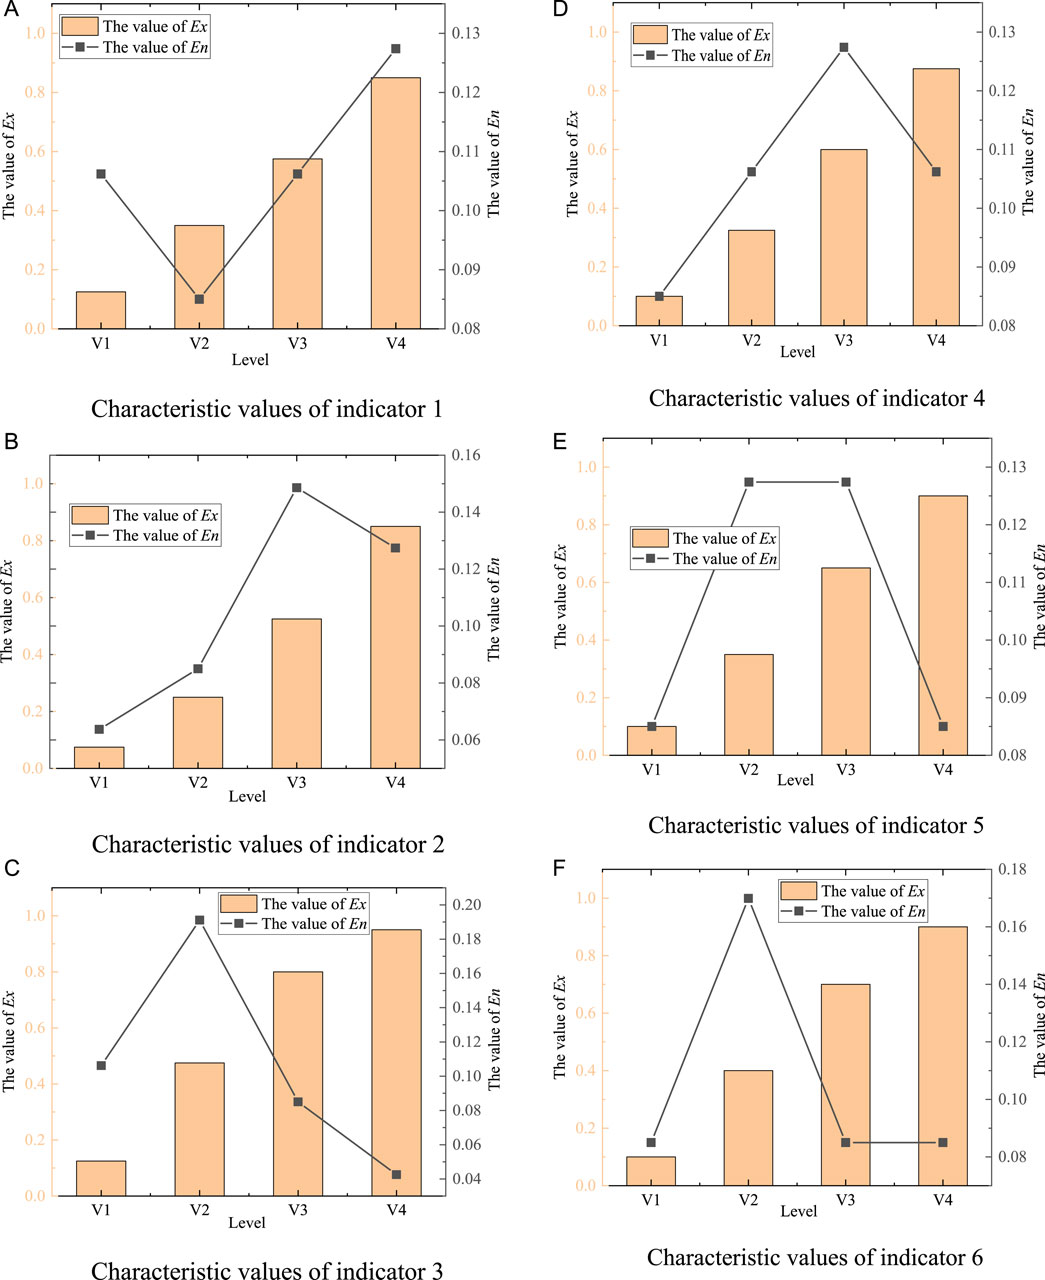
Figure 4. The characteristic values of each indicator cloud model. (A) Characteristic values of indicator 1. (B) Characteristic values of indicator 2. (C) Characteristic values of indicator 3. (D) Characteristic values of indicator 4. (E) Characteristic values of indicator 5. (F) Characteristic values of indicator 6.
According to Figure 4, the expectation and entropy of the cloud model can be calculated to obtain the level boundary for each indicator. The statistical data of evaluation indicators are standardized according to Formula 1–4, and the calculation results are shown in Table 7.
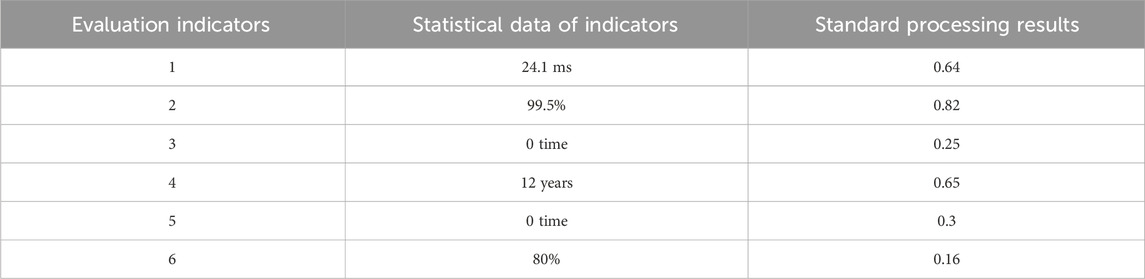
Table 7. Standard processing results of evaluation indicators.
If the evaluation value of a certain indicator is known, it is easy to determine the risk level of the indicator from the level boundary cloud model. By using Formula 9, the comprehensive membership degree of evaluation indicators can be calculated to obtain the membership degree of evaluation levels under four different model parameters. The calculation results are shown in Table 8, and the risk level assessment is easily completed based on the principle of eigenvalue judgment.
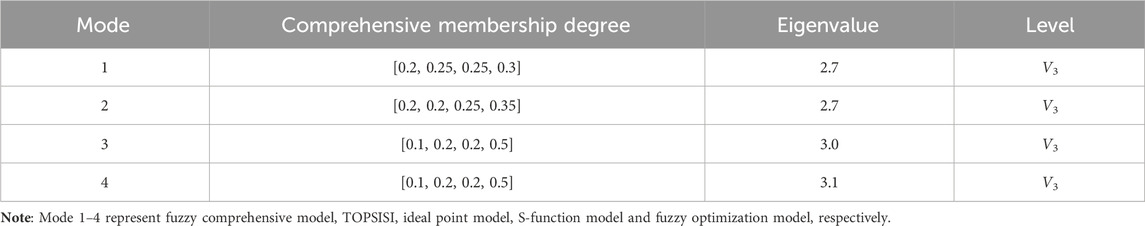
Table 8. Calculation results of comprehensive membership degree using different modes.
From Table 8, it can be seen that the distribution of the comprehensive membership degree vector at each level is relatively uniform and tends towards level V4. According to the principle of eigenvalue evaluation, only the fuzzy optimization model determines that the result is unacceptable level V4, and the rest are unexpected level V3. The average eigenvalue of the level is obtained to be 2.875, which comprehensively determines that the risk of the protection device is unexpected level V3, and points out that the risk of the device is further increasing. Based on the real-time status evaluation of protection devices, the current analysis shows that there are three indicators in the statistical data that are at the V3 risk level, one indicator that is at the V2 risk level, and two indicators that are at the V1 risk level. After analysis, the indicator at the V3 level is related to the reliability of the device. Obviously, the reliability of the device has decreased due to its long service life, and its maintenance status and real-time operation status cannot be ignored. Based on the actual operation status of the protection device, it is evaluated as an abnormal state. After timely maintenance, it can meet its normal operation. In combination with the risk assessment standards in this paper, it is comprehensively determined that the operating status of the protection device is an unexpected risk level V3.
5 Conclusion
This paper considers the characteristics in the status evaluation process of relay protection. A cloud model that can handle random features is introduced and a variable fuzzy evaluation method is adopted to handle the randomness and fuzziness of historical statistical data information. The weight calculation adopts the AHP-EW combined method, which effectively avoids the subjective randomness of weights in the calculation process. Finally, the risk level of relay protection devices is determined using the variable fuzzy comprehensive evaluation method. Finally, the feasibility and effectiveness of the proposed method are verified through case study. In all, the calculation process of the method proposed in this article is simple and can to some extent eliminate subjective influence. Due to limitations in research time and experience, there are still some issues that need further improvement.
(1) The indicator system is not comprehensive enough. Based on the development of state monitoring technology, it is necessary to further explore the state variables that affect the normal operation of equipment, and consider the state of the secondary system circuit.
(2) Variable fuzzy sets have strong operability and complex calculation processes. Consider combining artificial neural networks to design a more intelligent state evaluation model.
Data availability statement
The original contributions presented in the study are included in the article/Supplementary material, further inquiries can be directed to the corresponding author.
Author contributions
DL: Methodology, Writing–original draft. KW: Methodology, Writing–original draft. ZG: Methodology, Writing–original draft. YC: Data curation, Writing–original draft. WL: Data curation, Methodology, Writing–original draft. JZ: Formal Analysis, Writing–review and editing.
Funding
The author(s) declare that financial support was received for the research, authorship, and/or publication of this article. This research was funded by State Grid Jilin Electric Power Co., Ltd. Technology Project (No. 2023-54): Research and Application of Virtual Debugging Technology for a New Generation Intelligent Substation Based on Intermediate Model Library and Configuration Template. The authors declare that this study received funding from State Grid Jilin Electric Power Co., Ltd. The funder was not involved in the study design, collection, analysis, interpretation of data, the writing of this article, or the decision to submit it for publication.
Conflict of interest
Authors DL, KW, ZG, YC, WL, and JZ were employed by State Grid Jilin Electric Power Co., LTD.
Publisher’s note
All claims expressed in this article are solely those of the authors and do not necessarily represent those of their affiliated organizations, or those of the publisher, the editors and the reviewers. Any product that may be evaluated in this article, or claim that may be made by its manufacturer, is not guaranteed or endorsed by the publisher.
References
Ahmed, M. T., Concalves, T., and Tlemcani, M. (2016). “Single diode model parameters analysis of photovoltaic cell,” in Birmingham: IEEE International Conference on Renewable Energy Research and Applications(ICRERA), Birmingham, UK, November, 2016, 396–400.
Bansal, R. C. (2003). Bibliography on the fuzzy set theory applications in power systems (1994-2001). IEEE Trans. Power Syst. 18 (4), 1291–1299. doi:10.1109/tpwrs.2003.818595
Castellani, F., Garinei, A., Terzi, L., Astolfi, D., and Gaudiosi, M. (2014). Improving windfarm operation practice through numerical modelling and supervisory control and data acquisition data analysis. IET Renew. Power Gener. 8 (4), 367–379. doi:10.1049/iet-rpg.2013.0182
Disturbance Analysis Working Group (1979). Review of selected electric system disturbances in North America. Princeton: Disturbance Analysis Working Group.
Gama, L. A., Almeida, M. L. S., Honorato, T. R., Serpa, V. R., and Silva, K. M. (2021). Mathematical and experimental evaluation of an incremental differential protection function embedded in a real transmission line relay. Electr. Power Syst. Res. 196, 107158. doi:10.1016/j.epsr.2021.107158
Guo, L., Li, K., Liang, Y., et al. (2014). State evaluation of high-voltage circuit breakers based on grey fuzzy comprehensive evaluation. Power Autom. Equip. 034 (11), 161–167.
Guo, W., Wang, F., and Long, L. (2022). “Intelligent substation relay protection condition monitoring based on support vector machine algorithm,” in 2022 2nd International Conference on Networking, Communications and Information Technology (NetCIT), Manchester, United Kingdom, December, 2022, 638–642.
Hao, L., Zhang, R., Ren, Y., and Wang, F. (2018). Design of comprehensive early-warning system based on risk assessment. Electron. Des. Eng. 26 (3), 138–141.
Hatziargyriou, N., Milanovic, J., Rahmann, C., Ajjarapu, V., Canizares, C., Erlich, I., et al. (2021). Definition and classification of power system stability – revisited and extended. IEEE Trans. Power Syst. 36 (4), 3271–3281. doi:10.1109/tpwrs.2020.3041774
Hu, H., Kang, Y., Zhang, Y., Ye, X., Guo, P., and Yan, Z. (2023). “A relay protection state evaluation method with multiple influencing factors,” in 2023 IEEE Sustainable Power and Energy Conference (iSPEC), Chongqing, China, November, 2023, 1–5.
Jia, H., Hou, Q., Yong, P., Liu, Y., Zhang, N., Liu, D., et al. (2024). Voltage stability constrained operation optimization: an ensemble sparse oblique regression tree method. IEEE Trans. Power Syst. 39 (1), 160–171. doi:10.1109/tpwrs.2023.3236164
Jiang, T., Han, F., and Fan, W. (2007). Evaluation of the operational status of overhead transmission lines based on rough set theory. Electr. Technol. (04), 63–65.
Li, H., Feng, D., and Song, J. (2013). Fuzzy evidence theory online state evaluation model for medium voltage vacuum circuit breakers. High. Volt. Electr. Appliances (1), 40–45.
Li, Y., Wang, W., Zhang, L., Liang, Z., Xu, Z., and Liang, Y. (2023). Reliability analysis for vertical integration of protection, measurement, merge unit, and intelligent terminal device. Glob. Energy Interconnect. 6 (6), 772–784. doi:10.1016/j.gloei.2023.11.010
Srivastava, A., Anh Tuan, Le, Steen, D., Carlson, O., Omar, M., and Bijwaard, D. (2023). Dynamic state estimation based transmission line protection scheme: performance evaluation with different fault types and conditions. Int. J. Electr. Power & Energy Syst. 148, 108994. doi:10.1016/j.ijepes.2023.108994
Tse, C. K., Huang, M., Zhang, X., Liu, D., and Li, X. L. (2020). Circuits and systems issues in power electronics penetrated power grid. IEEE Open J. Circuits Syst. 1, 140–156. doi:10.1109/ojcas.2020.3020633
Wang, Y., Chen, M., Jiang, Z., et al. (2018). State evaluation of secondary equipment in intelligent substations based on cloud theory. Power Syst. Prot. Control 46 (1), 71–77.
Wu, H., et al. (2023). Control and stability of large-scale power system with highly distributed renewable Energy generation: viewpoints from six aspects. CSEE J. Power Energy Syst. 9 (1), 8–14.
Xia, Y., and Zhang, X. (2018). Research on risk assessment and maintenance decision and secondary equipment of distribution automation. Electr. Power Eng. Technol. 26 (3), 155–160.
Xu, F., and Lin, Y. (2018). State evaluation of line relay protection based on generalized evidence theory. Hydroelectr. Energy Sci. 36 (3), 196–200.
Keywords: intelligent substations, relay protection equipment, status evaluation strategy, cloud model, power system
Citation: Liu D, Wu K, Guo Z, Cui Y, Liu W and Zhang J (2024) Strategy for evaluating the status of relay protection equipment for the new generation of intelligent substations. Front. Energy Res. 12:1342793. doi: 10.3389/fenrg.2024.1342793
Received: 22 November 2023; Accepted: 20 March 2024;
Published: 08 April 2024.
Edited by:
Ningyi Dai, University of Macau, ChinaReviewed by:
Dhivya Swaminathan, Vellore Institute of Technology (VIT), IndiaWenguo Wu, Chongqing University, China
Copyright © 2024 Liu, Wu, Guo, Cui, Liu and Zhang. This is an open-access article distributed under the terms of the Creative Commons Attribution License (CC BY). The use, distribution or reproduction in other forums is permitted, provided the original author(s) and the copyright owner(s) are credited and that the original publication in this journal is cited, in accordance with accepted academic practice. No use, distribution or reproduction is permitted which does not comply with these terms.
*Correspondence: Dapeng Liu, ldp4505@163.com