Low-carbon optimal operation of the integrated energy system considering integrated demand response and oxygen-rich combustion capture technology
 Xiu Ji1
  Meng Li
 Meiyue Li
 Huanhuan Han
- 1National Local Joint Engineering Research Center for Smart Distribution Grid Measurement and Control with Safety Operation Technology, Changchun Institute of Technology, Changchun, China
- 2Changchun Institute of Technology, Changchun, China
In view of the current operating constraints and environmental pollution problems of traditional units, in this article, oxygen-rich combustion capture technology is introduced to transform gas-fired units, demand response technology is used on the load side, the energy conversion equipment such as power-to-gas equipment is combined to form an integrated energy system, and then, a low-carbon optimization approach of the integrated energy system is proposed. First, the system architecture is constructed, and a model with an oxygen-rich combustion unit and integrated demand response is established. Second, a power-to-gas equipment model considering reaction waste heat utilization and oxygen recovery is established. Finally, a stepped carbon trading mechanism is introduced to establish a low-carbon economic scheduling model for the integrated energy system with the goal of minimizing the operating cost of the integrated energy system. The simulation results show that the total cost and carbon emissions of the integrated energy system are reduced by 6.44% and 44.24%, respectively, under this model. At the same time, the operation adjustment capability and the oxygen production efficiency of the internal units of the system are improved.
1 Introduction
The issues of environmental pollution and energy shortage have accelerated the global development trend of low-carbon emission and clean energy. In order to achieve the grand development goal of “carbon peaking and carbon neutrality,” the complementary and coordinated optimization of an integrated energy system (IES) has become a key technical direction for addressing the contradiction between energy supply and demand and improving energy conversion capabilities. Research on its optimized operation has become a hot topic (Han et al., 2021).
At present, the main measures taken to achieve the low-carbon IES can be classified into two categories: policy, such as establishing carbon trading mechanisms, and technology, such as carbon capture technology and demand-side response technology. The low-carbon economic operation of the entire system can be achieved by coordinating the above two main measures.
Currently, the main research method for achieving low-carbon scheduling is to introduce carbon trading mechanisms into the IES. Qin et al. (2018) introduced carbon trading mechanisms into the electricity–gas–heat integrated energy system, which can be conducive to the low-carbon economic operation of the system, promoting the development of low-carbon units. Zhou et al. (2018) introduced carbon trading mechanisms into the IES, and the results showed that carbon trading mechanisms can effectively promote the consumption of new energy, improving the low-carbon and economic efficiency of the IES. Wang et al. (2019) used the life-cycle analysis method to analyze the carbon emissions generated by different energy chain migration and transformation processes in the IES. The results showed that reasonable planning of the carbon market can promote the low-carbon development of the IES.
In the above research, the carbon trading mechanism can only function on gas-fired units within the IES. As thermal power serves as the external supply base load of the IES, the carbon trading mechanism cannot be effectively optimized. Therefore, the coordination of technology and policy should be considered.
Lu et al. (2018) established a minimum coordination relationship model between the heat storage and release rate and the electric boiler power under the condition of extreme wind power consumption. The results showed the effectiveness of the heat storage and coordinated heating relationship between extreme wind power consumption and the electric boiler. Gao et al. (2019) introduced power-to-gas (P2G) carbon capture power plants into the IES. The results showed that power-to-gas-carbon capture power plants can effectively improve the absorption capacity of wind power and reduce system carbon emissions and operating costs. He et al. (2018) analyzed the flexible operation modes of carbon capture systems and P2G equipment in the IES. The results showed that the proposed model and flexible operation mode can effectively reduce carbon emissions and operating costs of integrated energy systems.
It is worth mentioning that currently, limited research exists on the introduction of carbon capture technology in the IES. Among them, some scholars have adopted post-combustion capture technology for the low-carbon transformation of gas turbines, but there are shortcomings such as a huge covering area for the equipment, weak capture capacity, and high capture cost, which are suitable for thermal power units (Liu et al., 2010). The pre-combustion capture technology requires significant modifications to the unit, resulting in low applicability. The oxygen-rich combustion capture technology combines the advantages of pre- and post-combustion capture technologies, with little impact on the power generation process of the units and strong carbon capture ability. However, it has high requirements for the cleanliness of the fuel itself and is suitable for gas-fired units, with good development prospects (Dai et al., 2023).
Current research at home and abroad is mainly focused on the economics and operating characteristics of oxygen-rich combustion technology. Gao et al. (2014) analyzed the impact of changes in unit operating parameters and different flue gas re-circulation methods on air separation oxygen generation equipment and gas capture equipment and then established a calculation model for the operating energy consumption of the related equipment. Cui et al. (2021) established a dynamic cycle model and a dynamic change model of flue gas composition for oxygen-rich combustion flue gas and analyzed the energy consumption of power plants at different oxygen concentrations in oxygen-rich combustion scenarios. Oboirien et al. (2014) analyzed the energy consumption and economic performance of oxygen-rich combustion equipment under different parameters. Koiwanit et al. (2014) established a full process model of the oxygen-rich combustion system and proposed a utilization plan for residual heat based on thermodynamic principles to improve the operational economy of the system. Zaharia et al. (2019), Yang et al. (2022), and Guo et al. (2023) conducted an economic analysis of the investment cost, operating cost, and CO2 emission reduction cost of oxygen-rich combustion power plants.
With the continuous enrichment and expansion of resources on the demand side, considering only oxygen-rich combustion technology and carbon trading mechanisms cannot meet the needs of the low-carbon operation of the IES. At present, utilizing demand-side resources for carbon reduction has become a research hotspot, but most of it focuses on the demand-side resource interaction from the perspective of “electricity.” Zhou et al. (2018) and Ji et al. (2022) introduced the “electricity price” demand response (DR) model into the IES, and the results showed that the proposed model can effectively reduce carbon emissions and operating costs of the IES. Cui et al. (2022) proposed a new carbon reduction mechanism for power systems, which guides users to actively respond and reduce carbon emissions from a “carbon perspective” (Zhou et al., 2018; Malehmirchegini et al., 2022). Overall, whether from the perspective of users or the system, demand response mechanisms can bring carbon reduction benefits.
In summary, this paper proposes an optimal operation scheduling model of the IES that considers integrated demand response and oxygen-rich combustion capture technology. The main contributions of this paper are as follows:
1. An oxygen-rich combustion technology is introduced to transform the gas-fired unit, and a model of the oxygen-rich combustion capture unit is established for solving the operational constraints and environmental pollution problems of traditional units within the IES.
2. An integrated demand response model of price and subsidy incentives is constructed based on the price elasticity matrix principle and response subsidy policy to provide full play to the adjustment ability of demand-side response resources.
3. A stepped carbon trading mechanism is proposed, the impact of the base price of the carbon trading mechanism on system costs and carbon emissions is discussed, and the low-carbon operation model of the IES considering the stepped carbon trading mechanism is constructed.
2 Architecture of an integrated electricity–heat–gas-cooling energy system
The structure of the IES is shown in Figure 1. Here, the gas-fired unit adopts the oxygen-rich combustion capture technology for low-carbon transformation; electric power is supplied by the combined heat and power unit, wind power, and purchased electricity; the heat load is supplied by the combined heat and power unit and the residual heat from the P2G converter; the gas load is supplied by the external gas network and the P2G converter; the cold load is supplied by the air-conditioning and refrigeration, the residual heat from lithium bromide, and the liquefied natural gas tanks in the gasification process to supply the loads; and the oxygen required by the oxygen-rich combustion capture unit is supplied by the P2G converter, air oxygen generator, and oxygen storage tank. Oxygen for the oxygen-rich combustion capture unit is supplied by electric gas conversion equipment, air oxygen generating equipment, and oxygen storage tanks (Kang et al., 2022).
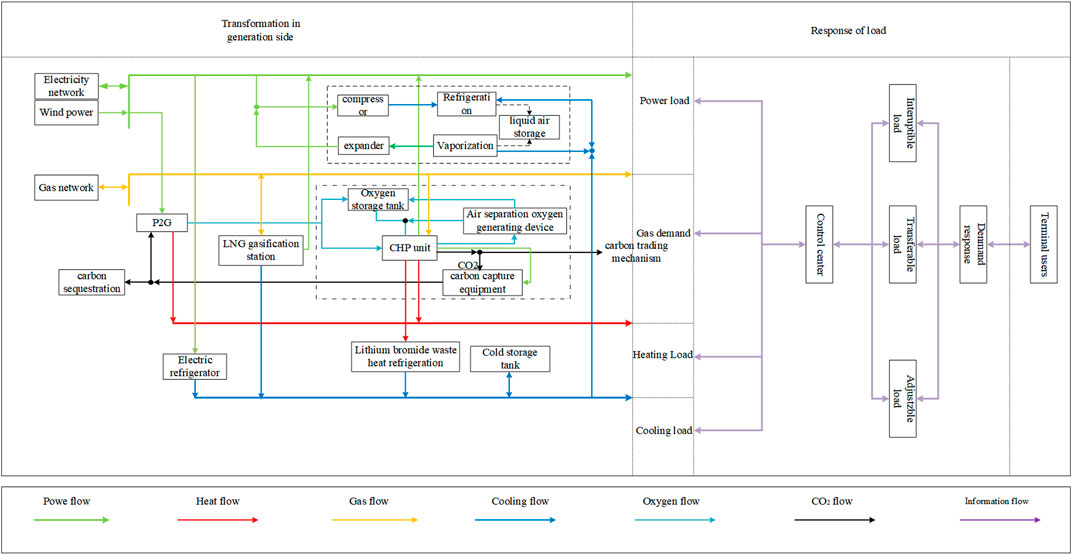
Figure 1. Integrated energy system structure.
2.1 The modeling and combined heating-supply principle of the oxygen-rich combustion unit
2.1.1 Modeling of oxygen-rich combustion capture units
Oxygen-rich combustion capture technology increases the concentration of CO2 in flue gas after combustion using high-purity oxygen or pure oxygen, which can be helpful for purification or storage after capture. The energy flow diagram of the oxygen-rich combustion unit is shown in Figure 2.
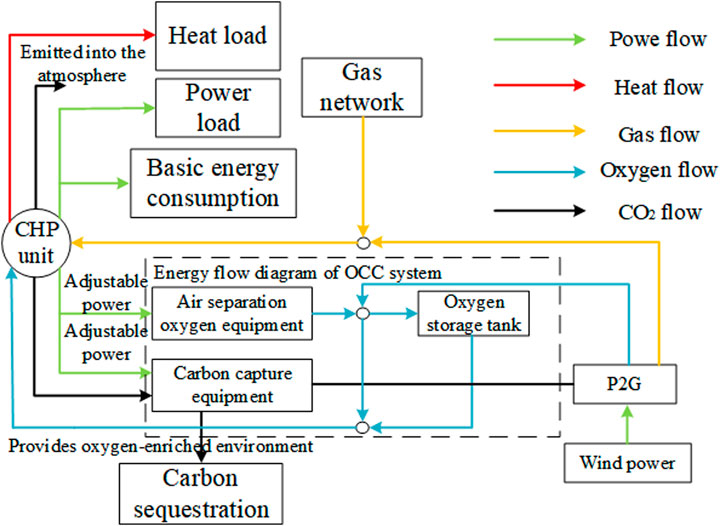
Figure 2. Energy flow diagram for oxygen-rich combustion capture units.
The main energy destinations of the oxygen-rich combustion capture unit are the system electrical load, carbon capture equipment, air separation oxygen generation equipment, and system heat load (Zhu et al., 2022).
Oxygen-rich combustion capture technology has a higher degree of fuel cleanliness, and back-pressure gas-fired units are selected as the object of transformation. The oxygen-rich combustion capture units in the following paragraph refer to the gas-fired units transformed by the oxygen-rich combustion capture technology. The relationship between electricity generation
where
The heating power of the oxygen-rich combustion capture unit is the heating power of the gas-fired unit, and the electricity-generating power and heat-producing power of the back-pressure unit present a linear mathematical relationship in an approximate manner, with the specific expression as follows:
where
The introduction of the oxygen-rich combustion capture system will change the structure of the gas-fired unit to cause part of the energy loss, known as the baseline energy consumption
where
The oxygen consumption
where
Zhang et al. (2022) proved the process flow and equipment operation steps of traditional air technology to be basically the same as those of oxygen-rich combustion capture technology. Technically, the two operation modes can be converted to each other, and the switching time is usually less than 1/3 h. Thus, the influence of different modes of conversion is ignored. The restart time of the air separation oxygen generation equipment is longer with larger start-up energy consumption and minimum operating power. Therefore, the carbon capture equipment will stop running in the air operation mode, the unit exits the oxygen-rich combustion operation state, and the oxygen produced by the air separation oxygen generation equipment is stored in the oxygen tank. Then, the oxygen-rich combustion capture system collectively consumes energy as follows:
where
The net output power of the oxygen-rich combustion capture unit
The
Zhu et al. (2022) defined the correlation between the net external power generation output and the net carbon emissions of a carbon capture unit as the “electro–carbon characteristic” of the unit, which is expressed as follows for an oxygen-rich combustion capture unit:
where
When the oxygen-rich combustion capture unit is in operation, the
where
Based on the above analysis, the upper and lower limits of the net output power of the oxygen-rich combustion capture unit are introduced as follows:
In addition, the following power constraints need to be met when operating the air separation oxygen generation equipment:
Oxygen storage tanks can achieve the use of oxygen across different time periods and store the oxygen in the form of liquid. Regarding the storage or discharge period, the form of oxygen is usually gaseous. In addition, the model for oxygen storage tanks in the gaseous form is presented as follows:
where
Point A:
Point B:
Point C:
Point D:
Point E:
Point F:
Point G:
Point H:
In Figure 3, assuming that the amount of oxygen produced by the air separation oxygen generation equipment at point N exactly meets the demand for oxygen-rich operation, when approaching from point N to point H, the carbon emission increases, the air separation oxygen generation equipment that maintains the minimum power cannot meet the demand for oxygen-rich unit operation, and the difference in oxygen can be supplied by the oxygen storage tank. Therefore, ABCDNGE is the oxygen-rich operation area of the unit when using the oxygen storage tank. At this time, the phenomena of discarding oxygen occur. Pentahedron NHGEF presents the extra oxygen-rich operation area in the unit equipped with the oxygen storage tank, which indicates that when the net output of the oxygen-rich combustion capture unit is larger, the energy consumption of the air separation oxygen equipment is reduced, and the oxygen storage tank can be used to supplement for the difference in oxygen. When the net output of the unit is smaller, the energy consumption of the air oxygen equipment can be improved to add oxygen into the oxygen storage tank. The analysis shows that the oxygen-rich combustion capture unit equipped with the oxygen storage tank can expand the scope of operation.
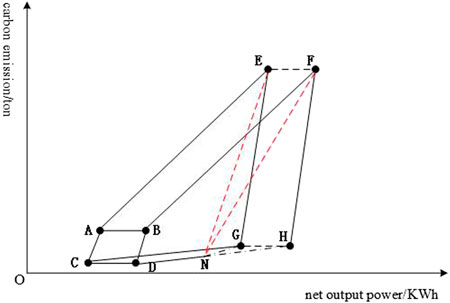
Figure 3. Electric carbon characteristics of oxygen-rich combustion capture units.
Therefore, the operation and maintenance (O&M) cost of the oxygen-rich combustion capture unit is shown as follows:
where
Detailed modeling of the internal equipment in the IES can be found in Supplementary Material. Air liquid energy storage architecture is shown in Figure 4.
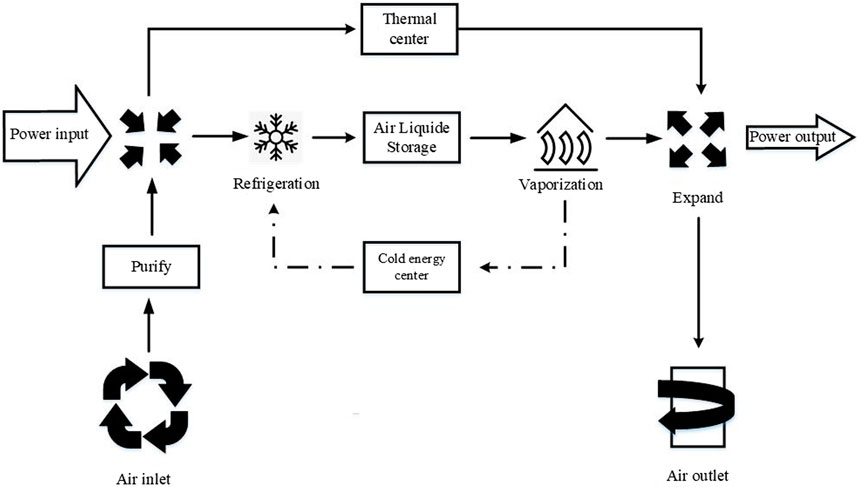
Figure 4. Air liquid energy storage architecture.
3 Low-carbon strategies based on low-carbon demand response
DR resources mainly include price-based demand response (PDR) and incentive-based demand response (IDR). PDR guides users to engage in reasonable electricity consumption behavior by changing electricity prices, thereby adjusting electricity consumption plans. IDR includes interruptible loads, demand-side bidding, emergency demand-side response, and direct load control. The power department usually first signs a contract with the load agency (aggregator) to classify and integrate various users who can improve DR resources, and finally, it is uniformly regulated by the dispatch center (Tian et al., 2023).
DR resources can optimize the output plans of units with different carbon emission intensities by changing the load curve (Zhang et al., 2021), thereby achieving the effect of reducing system carbon emissions. The low-carbon principle of price-based demand response is shown in Figure 5.
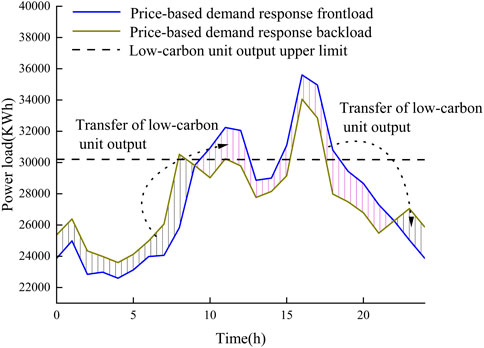
Figure 5. Demand response low-carbon principles.
As shown in Figure 5, the demand response can shift some load from the peak period to the valley period. During the peak period, when the net output of low-carbon units has reached the upper limit, the output of high-cost and high-carbon emission thermal power units supplies the difference in the load. After the price-based demand response, this part of the load is supplied by the output of low-cost, low-carbon emission carbon capture units during the valley period, or additional consumption of low-marginal cost, carbon-neutral wind power generation, which effectively reduces the carbon emissions of the system.
3.1 Price-based demand response models
The electricity load demand response model in this article adopts the price demand response elasticity matrix method. The electricity load change rate and electricity price change rate can be characterized by the elasticity index of electricity consumption and electricity price, and its expression is as follows:
where
Based on the ratio of the time-of-use electricity price to the fixed electricity price, the following elasticity matrix is established:
where
Based on the electricity elasticity matrix
where
Since gas energy has the same commodity property as electricity, the gas load can be adjusted based on the published time-of-day gas price, so the IDR model of the gas load can also be modeled by the method of the price-type elasticity matrix. Analogous to the electricity price-based IDR model, the relationship between the gas load and the time-of-day gas price also exists, as shown in Eq. (29), which is expressed as follows:
where
3.2 Incentive-based demand response
Incentive-based demand response refers to the direct reduction or interruption of a portion of the load by users based on compensation and incentive mechanisms established by energy operators during the peak period of load or in emergency situations. The incentive demand response constructed in this article includes electricity load, gas load, heat load, and cooling load.
3.2.1 Incentive-based electricity load and gas load
When the system is in peak operation, the electricity/gas consumer has a prior agreement with the energy operator to curtail part of the load, and its mathematical model is shown as follows:
where
For the reduction in electricity and gas loads, in order to prevent too much impact on the life of users, the amount of adjustment of electricity and gas loads at moment t should be within a certain range, and the total load change within 1 day should also meet the limit as follows:
where
3.2.2 Modeling of heat/cooling load
Considering the time delay and perceptual ambiguity of heat and cooling loads, adjusting the temperature within the comfort range will not have a significant impact on users. The quantitative relationship between the heat/cooling load demand and indoor and outdoor temperatures is shown as follows:
where
The mathematical model of the demand response for the heat load and cooling load can be expressed as follows:
where
Due to the time delay and ambiguity of user requirements for indoor temperature comfort, the impact of small changes in the heat/cooling load on user comfort is relatively small. However, when the heat/cooling load changes significantly, the impact on user comfort is significant, so the impact of the heat/cooling load change on user comfort is not linearly correlated. Therefore, this article adopts a stepped compensation method to encourage users to change the heat/cooling load. The compensation cost for the user heat/cooling load at time t is shown as follows:
where
Taking the heat load incentive compensation as an example, the greater the deviation degree of heat load, the greater the impact on user comfort. This article adopts a stepped subsidy coefficient, which varies in a stepped manner based on the impact of the actual load on user comfort. The greater the deviation degree, the greater the subsidy coefficient, which can be expressed as follows:
where
Similarly, the subsidy coefficients for changes in cooling loads can be expressed as follows:
where
4 Stepped carbon trading models
At present, the domestic carbon emission trading market has started trial operation, guiding various industries to achieve low-carbon emissions through policies. The main methods of allocating carbon emission reduction quotas include free allocation, paid allocation, and mixed allocation. Currently, free allocation is mainly used in China. The stepped carbon trading mechanism mainly consists of three parts: initial carbon emission quotas, actual carbon emissions, and carbon trading costs (Guan et al., 2018; Chrispim, 2021; Liang et al., 2021).
4.1 Modeling of carbon emission quotas
The main source of carbon emissions in the system consists of two components, namely, the oxygen-rich combustion unit and the equivalent emissions from power purchases. The model of carbon emission quotas is shown as follows:
where
4.2 Modeling of actual carbon emissions
In this system, it is assumed that all purchased electricity comes from coal-fired units and that the P2G converter in the system will reduce some of the carbon emissions. Therefore, the model of the actual carbon emissions is shown as follows:
where
4.3 Modeling of the stepped carbon transaction cost
In order to ensure a reasonable control system of carbon emissions, this paper adopts a stepped carbon transaction cost model. The stepped pricing mechanism divides multiple purchase intervals, and the more carbon emission rights to be purchased, the higher the purchase price of the corresponding interval. The stepped carbon transaction cost model can be expressed as follows:
where
5 Optimization model of the integrated energy system
5.1 Objective function
The model proposed in this article comprehensively considers the cost of purchasing natural gas from the system, the cost of purchasing electricity from the power grid, the cost of operation and maintenance, the cost of carbon storage, the cost of carbon trading, the cost of wind abandonment penalty, and the cost of load loss penalty, with the objective function of minimizing the total operating cost for optimization. The objective function is shown as follows:
where
5.1.1 Cost of the purchased electricity
The system purchased energy cost includes two components: the purchased electricity cost and purchased gas cost. In addition, the price of the purchased electricity is decided by using the time-of-day electricity price mechanism:
where
5.1.2 Cost of operation and maintenance
where
5.1.3 Cost of carbon sequestration
Carbon sequestration costs are required to sequester the remaining
where
5.1.4 Cost of wind abandonment penalty and load loss penalty
In order to make the system realize the full consumption of new energy and reduce the occurrence of the wind abandonment phenomenon, the wind abandonment penalty cost is used to improve the wind power consumption rate of the system. The cost of the wind abandonment penalty is shown as follows:
where
5.1.5 Cost of the demand response
5.2 Constraints
5.2.1 System balance constraints
• Electrical power balance constraints
where
• Gas power balance constraints
where
• Heat power balance constraint
where
• Cold power balance constraint
where
• Oxygen balance constraint
where
• Wind power operation constraint
5.2.2 LAES constraint
The liquid air energy storage (LAES) and discharge constraints and storage capacity constraints are shown as follows:
where
5.2.3 System electrical load loss constraint
This article constructs a complete low-carbon economic optimization model for the IES, taking into account the system energy purchase cost, operation and maintenance cost, carbon trading cost, carbon sequestration cost, demand response cost, wind abandonment penalty, and load loss penalty. The optimal output plan for each unit and equipment with the minimum sum of multiple costs during the scheduling cycle can be obtained, resulting in the lowest total operating cost of the system.
6 Example analyses
6.1 Parameters of the algorithm
The structure of the algorithm is shown in Figure 1. The carbon emission intensity of the gas turbine is 1.964 kg/m3, the climbing rate is 10,000 kW/h, and the operation and maintenance cost is 0.02 yuan/KW; the maximum storage/discharge rate and efficiency of the oxygen storage tank are 2,500 m3/h and 95%, respectively, the maximum oxygen storage capacity is 10,000 m3/h, the dissipation coefficient is 0.02%, and the operation and maintenance coefficient is 0.02 yuan/m3; the base price of carbon emission is taken as 200 CNY/ton, the interval length is taken as 2t, and the growth rate is taken as 0.25; the operation and maintenance cost of the P2G equipment is taken as 0.02 yuan/kWh; the penalty for wind abandonment of wind power is 0.6 CNY/KWh, and the operation and maintenance cost is 0.2 yuan/kWh; and the cost of the load loss penalty is 10 CNY/kWh. Figure 6 shows the power load prediction curve of the IES, which contains the power of each load and the predicted power of wind power. Table 1 shows the time-of-use electricity price and time-of-use natural gas price; Table 2 shows the parameters of the IES equipment; Table 3 shows the basic parameters of oxygen-rich combustion capture technology. In the calculation analysis, t means the time period of t in the scheduling day. For example, when t = 1, it means the first scheduling time period of the day.
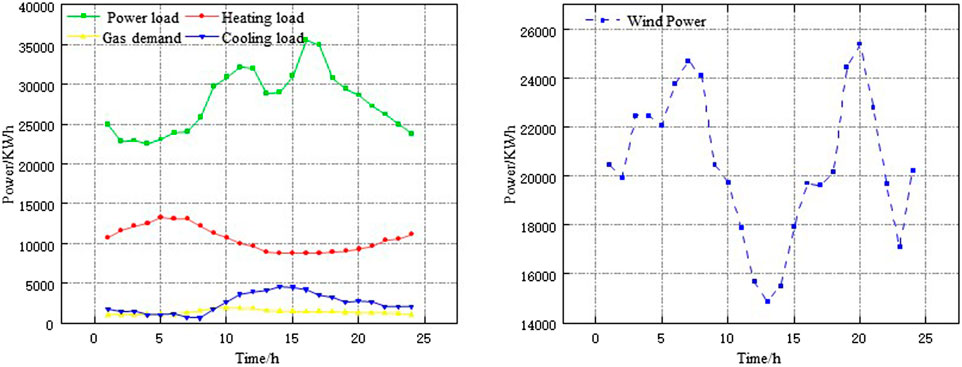
Figure 6. Comprehensive energy system load and wind power forecasts.
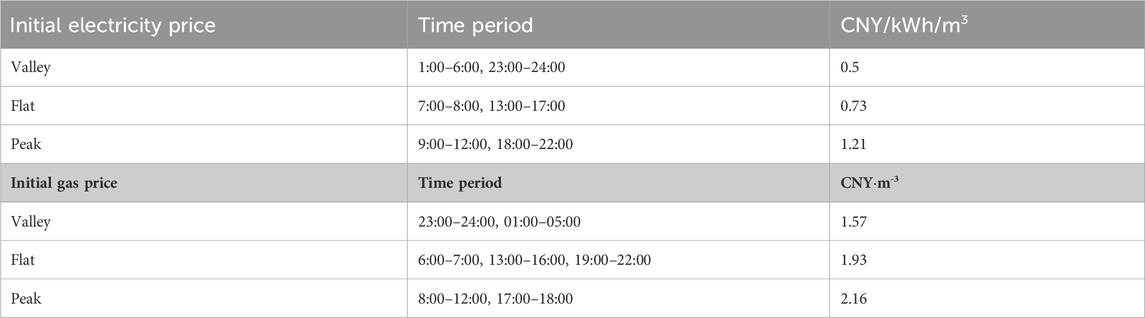
Table 1. Time-of-use electricity price and time-of-use gas price.
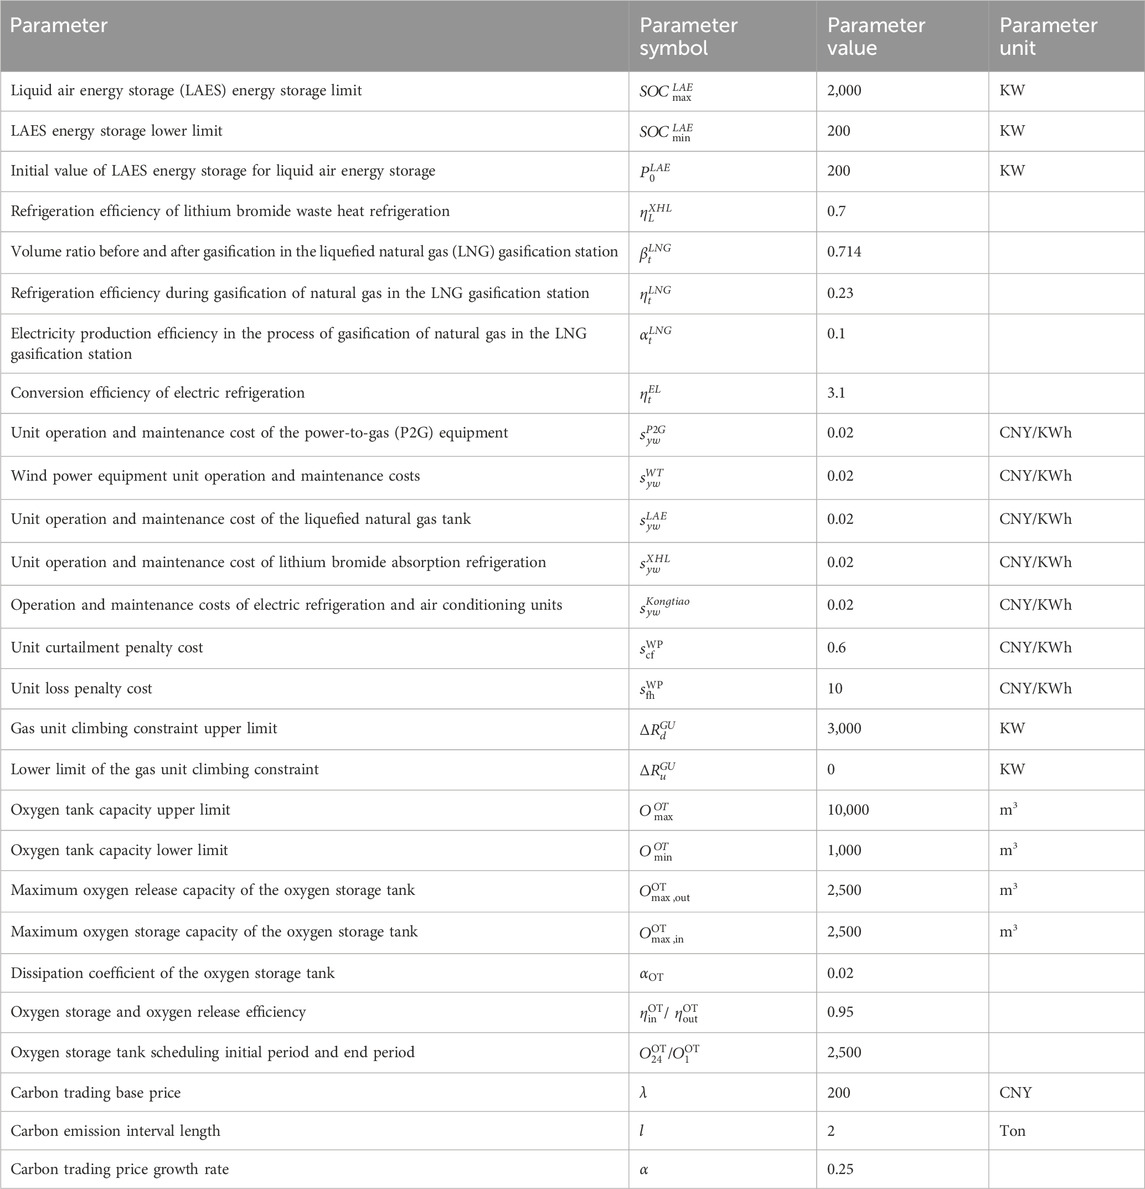
Table 2. Basic parameters of the integrated energy system.
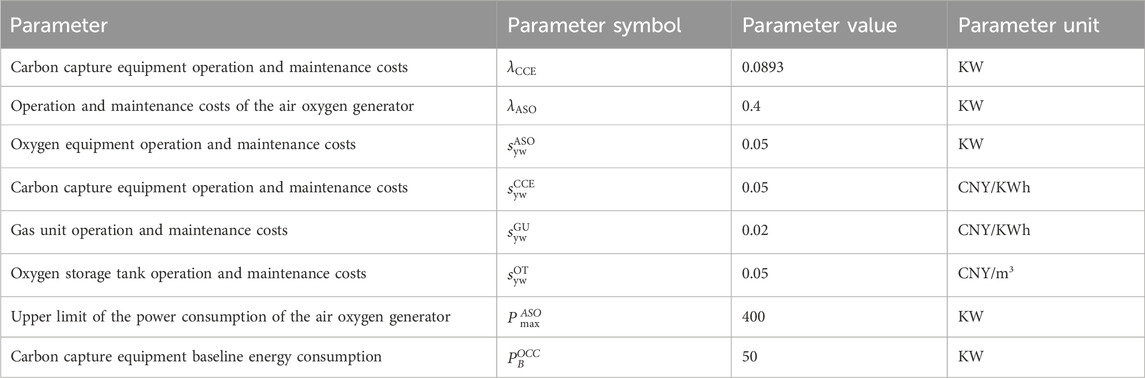
Table 3. Basic parameters of oxygen-rich combustion capture technology.
6.2 Analysis of basic operational results
In order to verify that the proposed strategy can satisfy the system supply and demand balance, the operational results obtained from the proposed model are analyzed.
Figure 7A shows that the IES only purchases electricity from the grid at the time periods of T = 11, 13, 14, and 18, and the electric load at other times mainly comes from the oxygen-rich combustion capture unit and wind power, which indicates that the IES has high self-sufficiency in electric energy. Figure 7B shows that the residual heat from the reaction of the oxygen-rich combustion unit and the P2G equipment can meet the system heat load. Figure 7C shows that the gas load mainly consists of the upper gas network, liquefied natural gas, and natural gas produced by machination, which can meet the gas turbine and system gas load. Similarly, Figure 7D shows that the output of each unit in the system can meet the system cooling load.
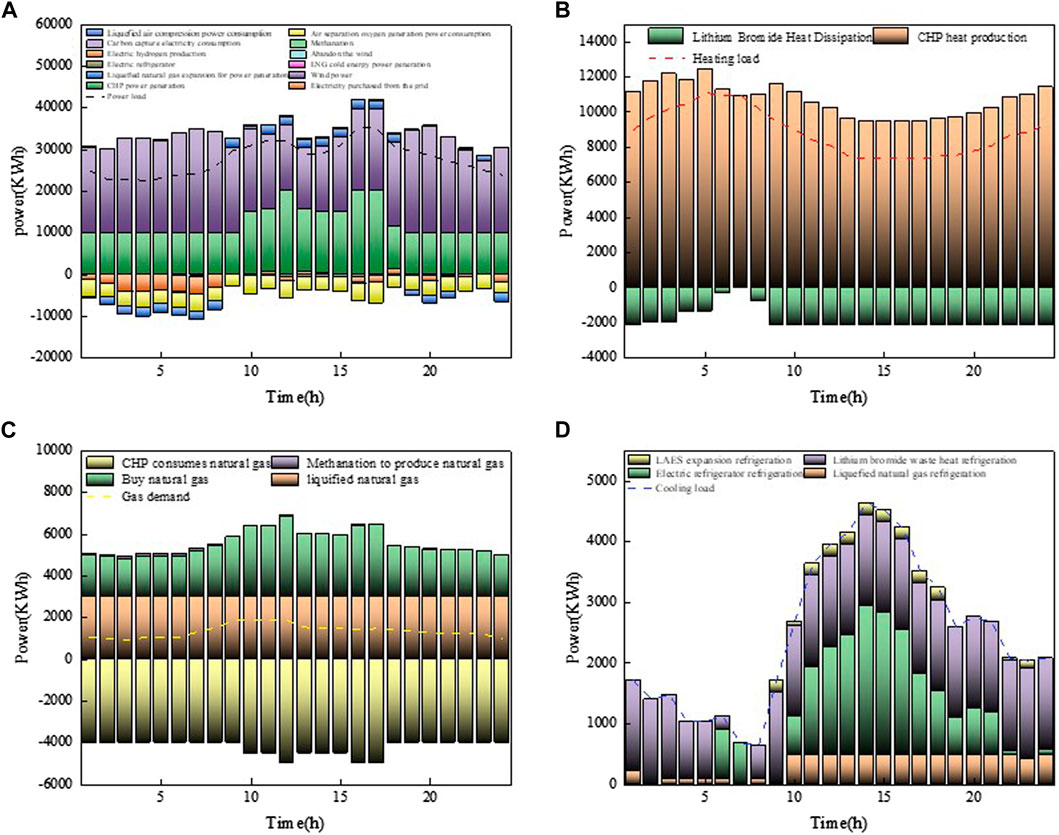
Figure 7. Power balance diagram of the integrated energy system.
Figure 8 shows that most of the CO2 generated by the IES is sequestered after the carbon quota, while the other part is used as raw material for the reaction of the P2G equipment, which reduces the cost of carbon trading. In addition, the natural gas generated from it can be used as a raw material for gas turbine units, achieving internal carbon resource circulation and improving the clean efficiency of system operation.
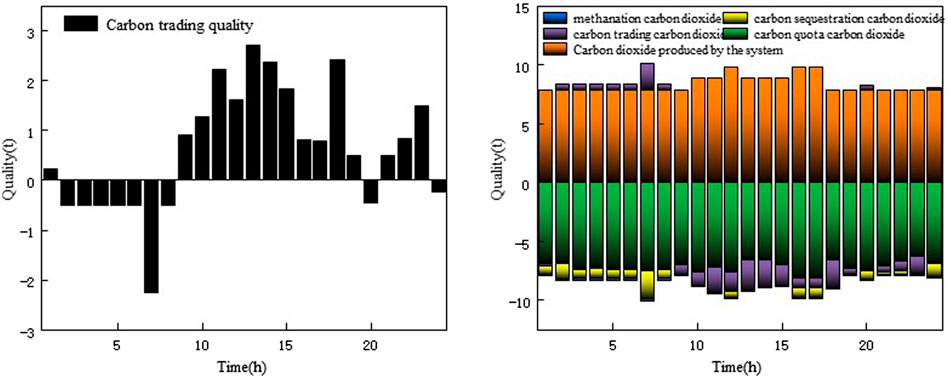
Figure 8. Carbon dioxide emissions from integrated energy systems.
Figure 9 shows that the higher electric power consumption of the P2G equipment at night reduces the wind loss caused by the reverse peaking characteristic of wind power, and the total amount of methane generated by the equipment accounts for approximately 6.05% of the total consumption of the system, which, to a certain extent, reduces the dependence of the system on the external gas source, improves the internal energy conversion capability of the system, and further improves the carbon trading revenue of the system due to the carbon reduction characteristic of the system itself. In addition, the amount of the residual heat heating volume of the P2G equipment accounts for approximately 1.57% of the total heat energy demand, indicating that the P2G equipment also shows certain heating potential. Thus, the P2G equipment has manifold potentials, which can effectively improve the operational flexibility and economic revenues of the system.
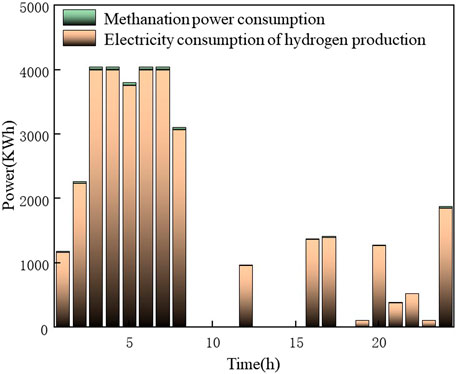
Figure 9. Power-to-gas (P2G) device operation results.
6.3 Effectiveness analysis of the operational strategies
In order to verify the effectiveness of the proposed strategy, four different operational scenarios are set up for comparison and verification, and details of the scenarios are shown in Table 4.
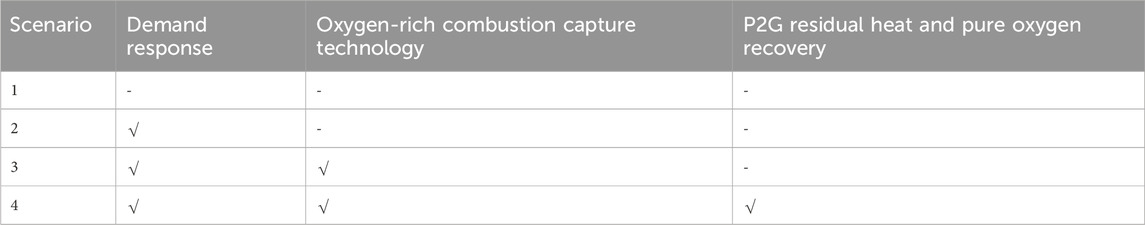
Table 4. Settings of different scenarios.
Table 5 shows that the carbon emission and total cost of scenario 2 are higher than those of scenario 1, indicating that the demand response can change the energy use habits of users on the load side, promote the consumption of wind power, and improve the economy and low-carbon of the IES. The carbon transaction cost and carbon emissions of scenarios 3 and 4 are much better than those of scenarios 1 and 2, indicating that the introduction of oxygen-rich combustion capture technology and demand response technology not only reduces the carbon emissions of the system to obtain higher economic benefits but also improves the flexibility of the system and reduces the amount of the system wind abandonment.
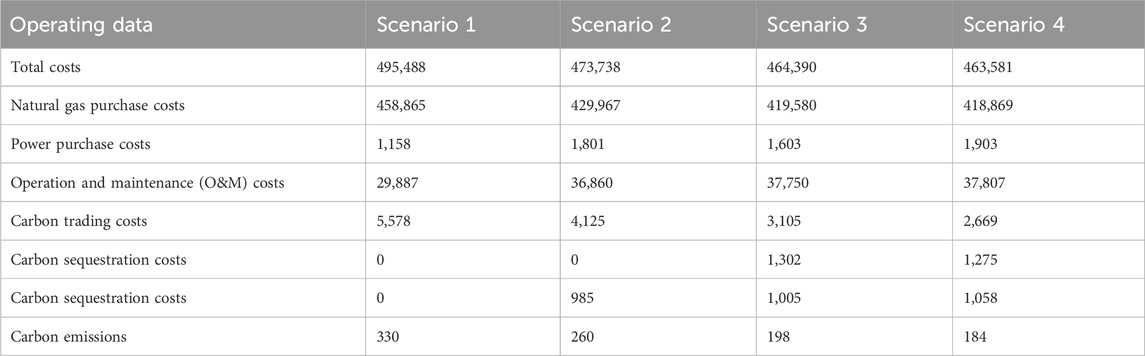
Table 5. Operation strategy in different scenarios.
Figure 10 shows that the electricity, gas, heat, and cooling loads change in scenarios 2 and 3 before and after introducing the demand response and oxygen-rich combustion capture technology. Under the guidance of time-of-use pricing, the electric and gas loads are transferred from the peak period of energy consumption to the valley period, achieving the effect of load “peak shaving and valley filling.” On the other hand, the cooling and heat loads are reasonably adjusted within the comfort level according to the indoor temperature, water temperature changes, and external heat disturbance factors, and certain adjustment incentive subsidies are provided. For electricity and gas loads, after considering the incentive-based IDR, different reductions occur during the later time periods of electricity and gas consumption, respectively. After the introduction of oxygen-rich combustion capture technology and demand response technology, the electricity load is guided by the time-of-use electricity price to transfer to the peak period of the wind power output. The oxygen-rich combustion capture technology regulates the output of gas units in the IES, and the proportion of clean energy increases significantly, indicating that the power supply capacity within the system has increased. In addition, the carbon emissions have been reduced significantly so as to realize the low-carbon and economic operation of the IES.
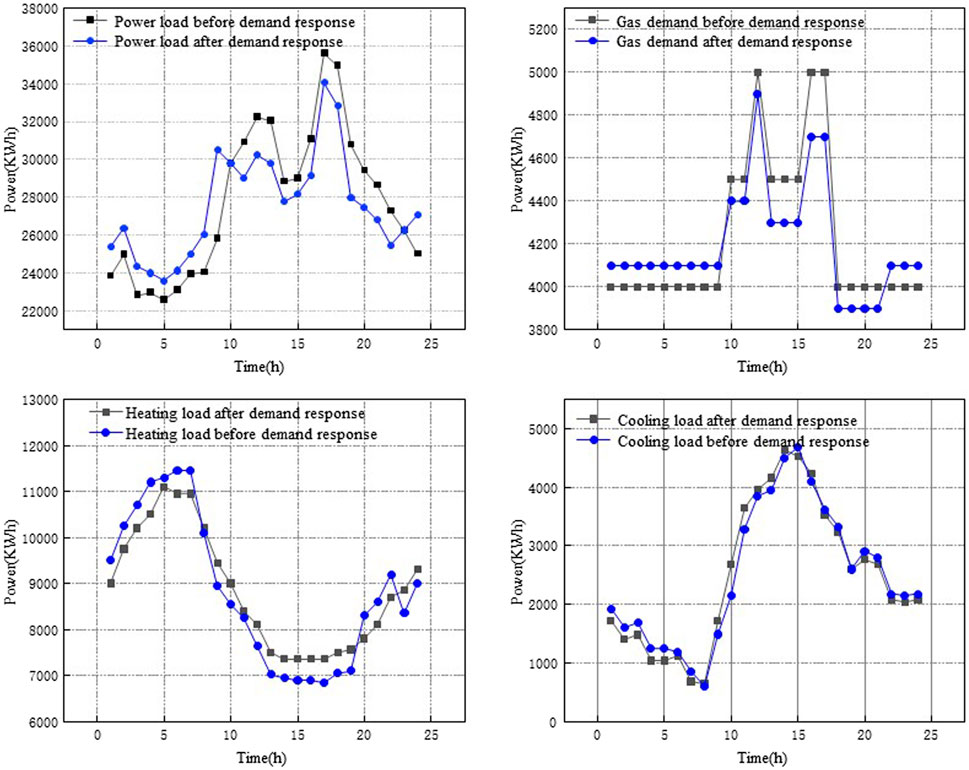
Figure 10. Load comparison and after integrated energy system demand response.
Combined with Table 6 and Figure 11, it can be seen that in the time period from 5 to 10 o’clock, the power consumption of the air separation oxygen generation equipment in scenario 4 is significantly lower than that in scenario 3, and the oxygen supply of the P2G equipment in scenario 4 accounts for approximately 4.17% of the total oxygen generation of the system, which effectively reduces the oxygen consumption of the gas turbine. Moreover, the gas turbine output of scenario 4 accounts for approximately 75.55% of the total output of the turbine, which is approximately 2.1% higher than that of scenario 3, which shows that the oxygen recovery of the power conversion equipment can effectively reduce the oxygen consumption, improve the net output level of the gas turbine, and reduce the operating cost of the integrated energy system.
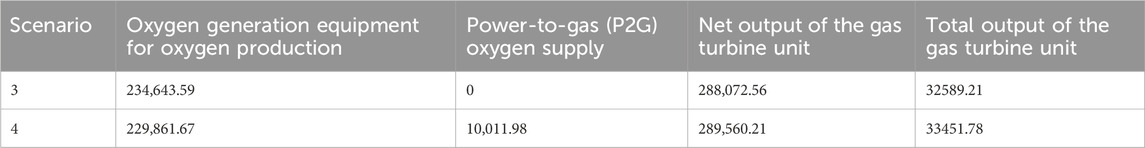
Table 6. Oxygen blending ratio and oxygen consumption of air separation oxygen generation in scenario 4.
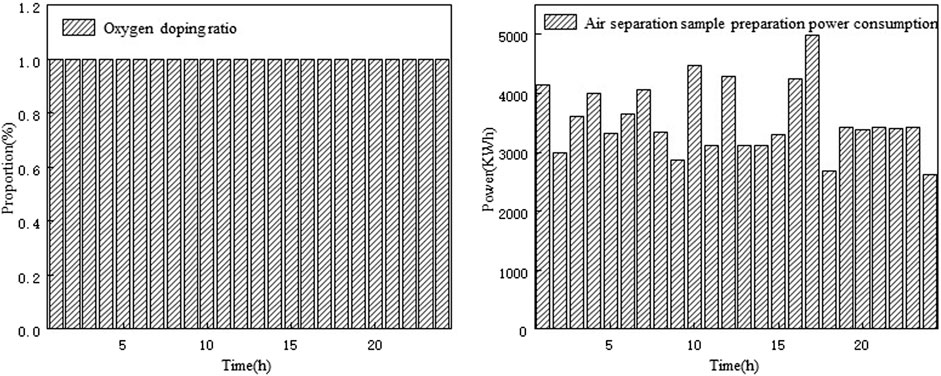
Figure 11. Air separation oxygen generation unit operation.
In summary, this strategy can improve the output level of the system units, improve the consumption of wind power, tap the operating potential of the P2G equipment and the oxygen equipment, and take into account the low-carbon and economic operation of the system, which verifies the effectiveness of this strategy in the low-carbon and economic operation of the IES.
6.4 Capacity configuration analysis of the air separation oxygen generation equipment and oxygen storage tank
Figure 12 shows that the change trend of the total cost of the system first decreases and then increases with the capacity increase of the oxygen storage tank and air separation oxygen generation equipment, and there is a minimum point (30%, 10,000, 454370.14). The reason is that with the increase in the capacity of the oxygen storage tank and air separation oxygen generation equipment, the maintenance cost of the equipment gradually increases, but the carbon capture volume is also in the upward trend. The oxygen storage tank capacity has little effect on the carbon emission, while air separation capacity has a greater effect on it, and the overall trend of the carbon emission is to decrease with the increase in air separation capacity. In addition, the trend levels are off after 10,000 m3 because the capacity of the installed 1-MW thermal power unit requires up to 10,000 m3/h oxygen.
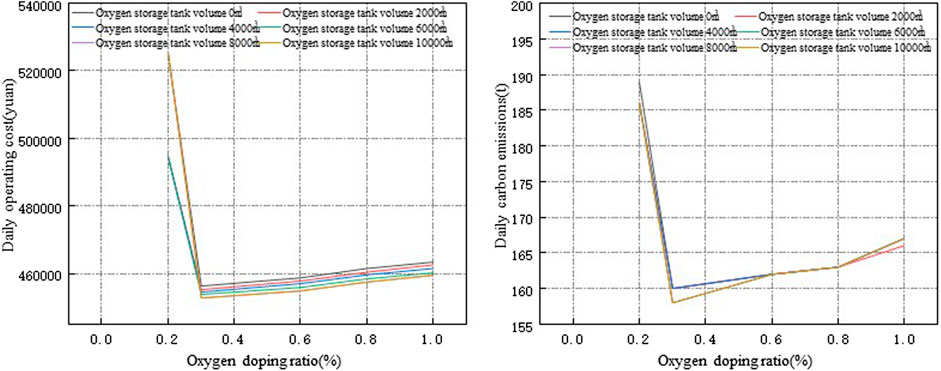
Figure 12. Capacity of the oxygen storage tank and oxygen mixing ratio of the oxygen storage tank.
6.5 Analysis of the carbon trading price
With the proposal of the “dual-carbon” goal, low-carbon emission has become a development trend, and carbon trading prices have changed accordingly. Different carbon trading prices are analyzed in this article, and the analysis of the system economy and low-carbon emission under four options is conducted, which proves the rationality of introducing demand response and oxygen-rich combustion units.
Figure 13 shows that the costs of option 1 and option 2 have been continuously increasing, and the capture of oxygen-rich combustion first increases and then decreases after combustion. The reason is that with the increase in carbon trading, oxygen-rich combustion capture units after combustion can do carbon capture and obtain profits. The reason for the high cost of oxygen-rich combustion units at 10–50 CNY/t is that the oxygen generation unit and P2G equipment produce oxygen at low-carbon trading prices but do not consume carbon dioxide. The oxygen-rich combustion capture units start to do the carbon capture when the carbon trading price is over 50 CNY/t, resulting in a decrease in the cost. When the carbon trading price is 120 CNY/t, the system cost of oxygen-rich combustion power plants is lower than that of conventional power plants, while the system cost capture of power plants after combustion are not lower than that of conventional power plants, proving the economic advantages of oxygen-rich combustion power plants. The P2G equipment in option 4 consumes a portion of CO2, resulting in a lower carbon trading price than that in option 3.
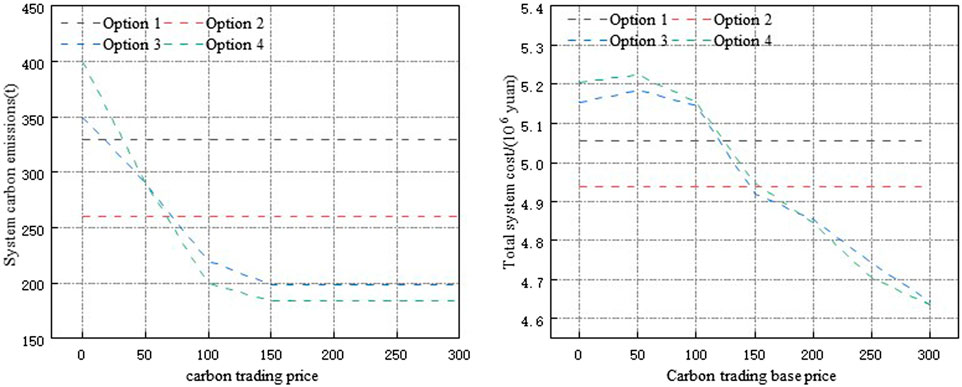
Figure 13. Analysis of the impact of the carbon trading base price on operating costs and carbon emissions.
It can be seen that in most cases, the carbon emissions of the oxygen-rich combustion power plant system are lower than that of the post-combustion capture power plant. The reason for the high carbon trading price of 10–50 CNY/t is that they have not undergone carbon capture, and the oxygen-rich combustion power plant also needs to supply air separation and oxygen production facilities for operation, consuming additional electricity and generating additional CO2. When the carbon trading price is 30 CNY/t, the carbon emissions of the oxygen-rich combustion power plant system decrease first compared to the post-combustion capture system, and there is more room for the decrease, proving the advantages of oxygen-rich combustion power plants in carbon capture.
7 Conclusion
This article introduces the oxygen-rich combustion capture unit and demand response into the IES, considering the residual heat recovery and oxygen utilization of the P2G equipment. In addition, an IES operation optimization method considering carbon trading efficiency is proposed. The following conclusions can be drawn through the example analysis:
1. The introduction of oxygen-rich combustion capture technology and demand response can meet the multi-energy requirements within the system, achieve the bi-directional conversion of multiple energies, improve the operational flexibility of the system, and have good carbon reduction effects and economic efficiency.
2. The capacity of the air separation oxygen generation equipment and oxygen storage tank has the most cost advantage. However, at this time, the carbon emissions are not optimal and need to be configured according to the actual situation.
3. Under the action of the integrated demand response, the IES has achieved the effect of load “peak shaving and valley filling,” with a significant increase in the proportion of clean energy and an increase in the output of low-carbon units within the system, improving the low-carbon and economic efficiency of the IES.
4. By comparing the costs and carbon emissions under different carbon trading prices, it has been proven that the scheduling scheme of the oxygen-rich combustion power plant system can achieve the optimal effect in terms of economy and low-carbon performance.
Data availability statement
The raw data supporting the conclusion of this article will be made available by the authors, without undue reservation.
Author contributions
XJ: writing–review and editing, project administration, methodology, and conceptualization. LMn: writing–review and editing, methodology, and conceptualization. LMi: writing–original draft, methodology, and conceptualization. HH: writing–review and editing and formal analysis.
Funding
The author(s) declare that financial support was received for the research, authorship, and/or publication of this article. This work was supported by “Land Scenery Three Gorges” High-Quality Development Major Science and Technology Project-Park-Level Multi-Micro-Grid System, Jilin Province, participating in key technology research projects for grid-friendly interaction (No. 20230303003SF).
Conflict of interest
The authors declare that the research was conducted in the absence of any commercial or financial relationships that could be construed as a potential conflict of interest.
Publisher’s note
All claims expressed in this article are solely those of the authors and do not necessarily represent those of their affiliated organizations, or those of the publisher, the editors, and the reviewers. Any product that may be evaluated in this article, or claim that may be made by its manufacturer, is not guaranteed or endorsed by the publisher.
Abbreviations
IES, integrated energy system; LAES, liquid air energy storage; P2G, power-to-gas; PDR, price-based demand response; IDR, incentive-based demand response; DR, demand response; LNG, liquefied natural gas.
References
Chrispim, M. C. (2021). Resource recovery from wastewater treatment: challenges, opportunities and guidance for planning and implementation. Front. Neurosci. 14 (1).
Cui, Y., et al. (2021). Low-carbon economic dispatch of electro-gas-thermal integrated energy system based on oxy-combustion technology. Zhongguo Dianji Gongcheng Xuebao/Proceedings Chin. Soc. Electr. Eng. 41 (2). doi:10.13334/j.0258-8013.pcsee.191708
Cui, Y., et al. (2022). Multi-time scale source-load dispatch method of power system with wind power considering low-carbon characteristics of carbon capture power plant. Zhongguo Dianji Gongcheng Xuebao/Proceedings Chin. Soc. Electr. Eng. 42 (16). doi:10.13334/j.0258-8013.pcsee.210697
Dai, K., Zhang, K., Li, J., Liu, L., Chen, Z., and Sun, P. (2023). Low-carbon optimal scheduling model for peak shaving resources in multi-energy power systems considering large-scale access for electric vehicles. Processes 11 (5), 1532. doi:10.3390/pr11051532
Gao, D., et al. (2014). Flue gas dynamic characteristics and operation economic analysis of oxy-fuel combustion circulating fluidized bed boiler. Zhongguo Dianji Gongcheng Xuebao/Proceedings Chin. Soc. Electr. Eng. 34. doi:10.13334/j.0258-8013.pcsee.2014.S.016
Gao, D., et al. (2019). Influence factor analysis of circulating fluidized bed boiler oxy-fuel combustion and CO2 capture power generation unit operation energy consumption. Zhongguo Dianji Gongcheng Xuebao/Proceedings Chin. Soc. Electr. Eng. 39 (5). doi:10.13334/j.0258-8013.pcsee.180505
Guan, Y., Han, Y., Wu, M., Liu, W., Cai, L., Yang, Y., et al. (2018). Simulation study on the carbon capture system applying LNG cold energy to the O2/H2O oxy-fuel combustion. Nat. Gas. Ind. B 5 (3), 270–275. doi:10.1016/j.ngib.2017.11.011
Guo, Z., and Zhou, S. (2023). Modeling and multi-stage planning of cement-IIES considering carbon-green certificate trading. Processes 11 (4), 1219. doi:10.3390/pr11041219
Han, X., et al. (2021). New issues and key technologies of new power system planning under double carbon goals. Gaodianya Jishu/High Volt. Eng. 47 (9). doi:10.13336/j.1003-6520.hve.20210809
He, L., Liao, C., and Tjong, S. C. (2018). Scalable fabrication of high-performance transparent conductors using graphene oxide-stabilized single-walled carbon nanotube inks. Appl. Energy 8, 224. doi:10.3390/nano8040224
Ji, X., et al. (2022). Coordinated optimal dispatch of transmission and distribution power systems considering operation flexibility of integrated energy system. Dianli Xit. Zidonghua/Automation Electr. Power Syst. 46 (23). doi:10.7500/AEPS20220215008
Kang, L., et al. (2022). Low-carbon economic dispatch of integrated energy system containing LNG cold energy utilization. Gaodianya Jishu/High Volt. Eng. 48 (2). doi:10.13334/j.0258-8013.pcsee.2010.s1.028
Koiwanit, J., Manuilova, A., Chan, C., Wilson, M., and Tontiwachwuthikul, P. (2014). A life cycle assessment study of a hypothetical Canadian oxy-fuel combustion carbon dioxide capture process. Int. J. Greenh. Gas Control 28, 257–274. doi:10.1016/j.ijggc.2014.07.001
Liang, Z., Mu, L., and He, C. (2021). Robust optimal dispatch of interconnected micro-energy network based on cooperative game. J. Renew. Sustain. Energy 13 (4). doi:10.1063/5.0051157
Liu, Y., Zhu, L., and Yan, W. (2010). Economic assessment for the CO2 capture technologies applied in the coal-firing power plant. Zhongguo Dianji Gongcheng Xuebao/Proceedings Chin. Soc. Electr. Eng. 30. SUPPL. doi:10.13336/j.1003-6520.hve.20201844
Lu, Z., et al. (2018). Low-carbon economic dispatch of the integrated electrical and heating systems based on benders decomposition. Zhongguo Dianji Gongcheng Xuebao/Proceedings Chin. Soc. Electr. Eng. 38 (7). doi:10.13334/j.0258-8013.pcsee.2010.s1.028
Malehmirchegini, L., and Farzaneh, H. (2022). Demand response modeling in a day-ahead wholesale electricity market in Japan, considering the impact of customer risk aversion and dynamic price elasticity of demand. Energy Rep. 8, 11910–11926. doi:10.1016/j.egyr.2022.09.027
Masoud, M., Siamak, H., and Astiaso, D. G. (2024). Developing particle-based models to predict solar energy attenuation using long-term daily remote and local measurements. J. Clean. Prod., 434139690. doi:10.13334/j.0258-8013.pcsee.171058
Masoud, N., Laureano, J., et al. (2023). Carbon footprint of low-energy buildings in the United Kingdom: effects of mitigating technological pathways and decarbonization strategies. Sci. total Environ., 882163490–163490. doi:10.1016/j.jclepro.2023.139690
Oboirien, B. O., North, B. C., and Kleyn, T. (2014). Techno-economic assessments of oxy-fuel technology for South African coal-fired power stations. Energy 66, 550–555. doi:10.1016/j.energy.2013.12.032
Qin, T., et al. (2018). Carbon trading based low-carbon economic dispatch for integrated electricity-heat-gas energy system. Dianli Xit. Zidonghua/Automation Electr. Power Syst. 42 (14). doi:10.1016/j.energy.2013.12.032
Siamak, H., Daniele, G., Scarlet, A. S., Di Matteo, U., and Astiaso Garcia, D. (2022). The PRISMI plus toolkit application to a grid-connected mediterranean island. Energies 15 (22), 8652. doi:10.3390/en15228652
Siamak, H., Davide, G. A., and Lizhen, H. (2023). Grid-connected renewable energy systems flexibility in Norway islands’ Decarbonization. Renew. Sustain. Energy Rev., 185.
Tian, N. J., et al. (2023). Optimization method for medium and long term dispatch schedule considering schedule execution and new energy consumption. Shenyang Gongye Daxue Xuebao/Journal Shenyang Univ. Technol. 45 (2). doi:10.3390/EN15228652
Wang, Z., et al. (2019). Low carbon economy operation and energy efficiency analysis of integrated energy systems considering LCA energy chain and carbon trading mechanism. Zhongguo Dianji Gongcheng Xuebao/Proceedings Chin. Soc. Electr. Eng. 39 (6). doi:10.13334/j.0258-8013.pcsee.180754
Yang, D., et al. (2022). Economic-emission dispatch problem in integrated electricity and heat system considering multi-energy demand response and carbon capture Technologies. Energy, 253. doi:10.1016/J.ENERGY.2022.124153
Zaharia, A., Diaconeasa, M. C., Brad, L., Lădaru, G. R., and Ioanăș, C. (2019). Factors influencing energy consumption in the context of sustainable development. Sustain. Switz. 11 (15), 4147. doi:10.3390/su11154147
Zhang, D., et al. (2022). Operational optimization of integrated cooling, heating and power energy system considering concentrating solar power plant and heat balance of building. Gaodianya Jishu/High Volt. Eng. 48 (7).
Zhang, T., She, X., and Ding, Y. (2021). A power plant for integrated waste energy recovery from liquid air energy storage and liquefied natural gas. Chin. J. Chem. Eng. 34, 242–257. doi:10.1016/j.cjche.2021.02.008
Zhou, R., et al. (2018). Coordinated optimization of carbon utilization between power-to-gas renewable energy accommodation and carbon capture power plant. Dianli Zidonghua Shebei/Electric Power Autom. Equip. 38 (7).
Keywords: oxygen-rich combustion capture unit, demand response, integrated energy system, low carbon, carbon trading mechanism
Citation: Ji X, Li M, Li M and Han H (2024) Low-carbon optimal operation of the integrated energy system considering integrated demand response and oxygen-rich combustion capture technology. Front. Energy Res. 12:1296709. doi: 10.3389/fenrg.2024.1296709
Received: 19 September 2023; Accepted: 21 February 2024;
Published: 08 April 2024.
Edited by:
Simona Liguori, Clarkson University, United StatesReviewed by:
Omid Jazani, Clarkson University, United StatesSiamak Hoseinzadeh, Sapienza University of Rome, Italy
Copyright © 2024 Ji, Li, Li and Han. This is an open-access article distributed under the terms of the Creative Commons Attribution License (CC BY). The use, distribution or reproduction in other forums is permitted, provided the original author(s) and the copyright owner(s) are credited and that the original publication in this journal is cited, in accordance with accepted academic practice. No use, distribution or reproduction is permitted which does not comply with these terms.
*Correspondence: Meng Li, 18569896803@163.com