Mechanism of rapid accretion-erosion transition in a complex hydrodynamic environment based on refined in-situ data
 Jie Jiang1
  Weiming Xie1* Naiyu Zhang1
  Yuan Xu1,2
  Chunyan Zhu1 Jianliang Lin3,4
  Leicheng Guo1
  Jian Shen5
  Qing He1
- 1State Key Laboratory of Estuarine and Coastal Research, East China Normal University, Shanghai, China
- 2Key Laboratory of Ocean Space Resources Management Technology, Ministry of Natural Resources, Hangzhou, China
- 3Institute of Estuarine and Coastal Research/State and Local Joint Engineering Laboratory of Estuarine Hydraulic Technology, School of Ocean Engineering and Technology, Sun Yat-Sen University, Zhuhai, China
- 4Guangdong Provincial Engineering Research Center of Coasts, Islands and Reefs/Southern Marine Science and Engineering Guangdong Laboratory, Zhuhai, China
- 5Virginia Institute of Marine Science, College of William and Mary, Gloucester Point, VA, United States
Morphological changes in estuaries are typically discussed on decadal time scales, with reported changes often exceed several decimeters. In our study, we utilized refined in-situ data to investigate bed-level changes and rapid accretion-erosion transitions during tidal cycles off the Changjiang Estuary. A field study employing a high-resolution bottom tripod system was conducted, measuring various parameters such as water level, waves, velocity profiles, near-bottom suspended sediment concentration (SSC), and bed level changes over ten tidal cycles. Our findings reveal significant and intense bed level changes occurring at the scale of tidal cycles. The data suggests that downward sediment transport plays a dominant role in the overall accretion tendency throughout the study period. Additionally, our research introduces a dynamic critical bed shear stress that increases during tidal cycles, deviating from fixed values. We also present a new quadrant analysis method to elucidate the primary processes controlling near-bed sediment transport. The results highlight the importance of horizontal advective sediment transport in frequent accretion-erosion transitions at tidal-cycle timescales. This implies a frequent exchange of sediment between adjacent shoals and channels in the seaward region of the North Channel in the Changjiang Estuary, which holds significance for future navigation and construction management.
Highlights
• We differentiate horizontal and vertical processes in controlling the rapid accretion-erosion transition in tidal cycles.
• Dynamic critical bed shear stress in tidal cycles should be proposed instead of fixed values.
• We introduce a new quadrant analysis method to clarify the near-bed sediment budget.
1 Introduction
Morphological changes in estuaries and coastal areas are important for navigation and coastal development. River flow, tidal currents, wave fields, and sediment transport are generally the major factors controlling the morphological changes in estuaries (van der Wal et al., 2002; Lane, 2004; Blott et al., 2006; Wang et al., 2008; Wheeler et al., 2010; Wang et al., 2013).
Previous studies on morphological changes mainly concern either long-term changes or short-term (seasonal); For long-term morphological changes, process-based models are valuable tools due to the restrictions of in-situ measurements (Hibma et al., 2003; Reeve and Karunarathna, 2009; Zhou et al., 2014, 2016). Analysis of historical data and numerical models are both good methods for short-term morphological changes. Generally, morphological changes are discussed at yearly and decadal timescales (Cowell and Thom, 1995; Zhu et al., 2016; Zhao et al., 2018; Zhu et al., 2019, 2021). Although many modeling studies have investigated morphological changes on tidal flats, tidal creeks and in channels (Zhu et al., 2017; Wu et al., 2023; Sun et al., 2024), these studies assume that bottom morphology does not change during tidal cycle and hydrodynamics and sediment transport are equilibrium with the bed in several days. However, morphodynamics at tidal-cycle timescale should be considered as they may have strong implications for larger spatial and temporal scales. The region outside the North Channel of the Changjiang Estuary is an exception, where the hydrodynamics is complex and bottom bed elevation changes frequently. This is a typically high-turbid area under the combined influence of river, tide and waves, which has been studied mostly by numerical models (Zhu et al., 2016; Ren et al., 2021). Numerical modelling studies mainly rely on historical bathymetric data, which may not as reliable as in-situ studies in understanding sediment transport processes and providing accurate sediment budgets linked bed level changes. In-situ studies on hydro-morphodynamic processes are relatively limited due to challenge of strong variations of hydrodynamic environments. Specifically, this region has the characteristics of rotated currents and strong tidal energy dissipation, which are vital to the intense vertical sediment exchange. Moreover, this region has significant topography changes so that the front of the Hengsha Shoal is hardly accreted, which is in contrast to the continuous accretion of the adjacent East Chongming Shoal and Jiuduan Shoal (Luan et al., 2016; Zhao et al., 2018).
A tripod system equipped with instruments placed on the seabed is an effective method to investigate the near-bed sediment exchange processes. This method has been widely used in estuarine environments and is regarded as convincing in understanding mechanisms (Wren et al., 2000; Xie et al., 2018; Lin et al., 2020). However, the six-layer measurements used in many studies are insufficient to understand the near-bed sediment exchanges, requiring higher resolutions of data collection and more innovative data analysis.
In this study, we obtained synchronous morphological changes at millimeter level and refined hydrodynamics data by the bottom tripod system. Based on the high-resolution data, we introduced a new quadrant analysis method to clarify the sediment budget in the bottom boundary layer and understand the rapid accretion-erosion transition in tidal cycles. The paper is structured as follows. It begins with a description of the study area, followed by an overview of the instrument setting, available data, and data processing methods. In the results section, we present the observed and calculated tidal currents, velocity profiles, vertical suspended sediment flux, and bed level changes. The discussion section interprets the mechanisms contributing to the rapid accretion-erosion transition. Finally, we conclude the paper with our findings.
2 Study area
The Changjiang Estuary is known for high turbidity and cohesive sediment with multiple outlets in the estuary. There are four entrances (including North Branch, North Channel, North Passage and South Passage) which are divided by various intertidal flats towards the East China Sea (Figure 1A). The averaged wet/dry season river discharge is up to 45,000/13,000 m3/s (1953-2018). The annual mean sediment flux decreased significantly from 0.427 billion tons to 0.143 billion tons before and after 2003 (the year when the Three Gorge Dams was in operation) based on the hydrological data at the Datong gauge station.
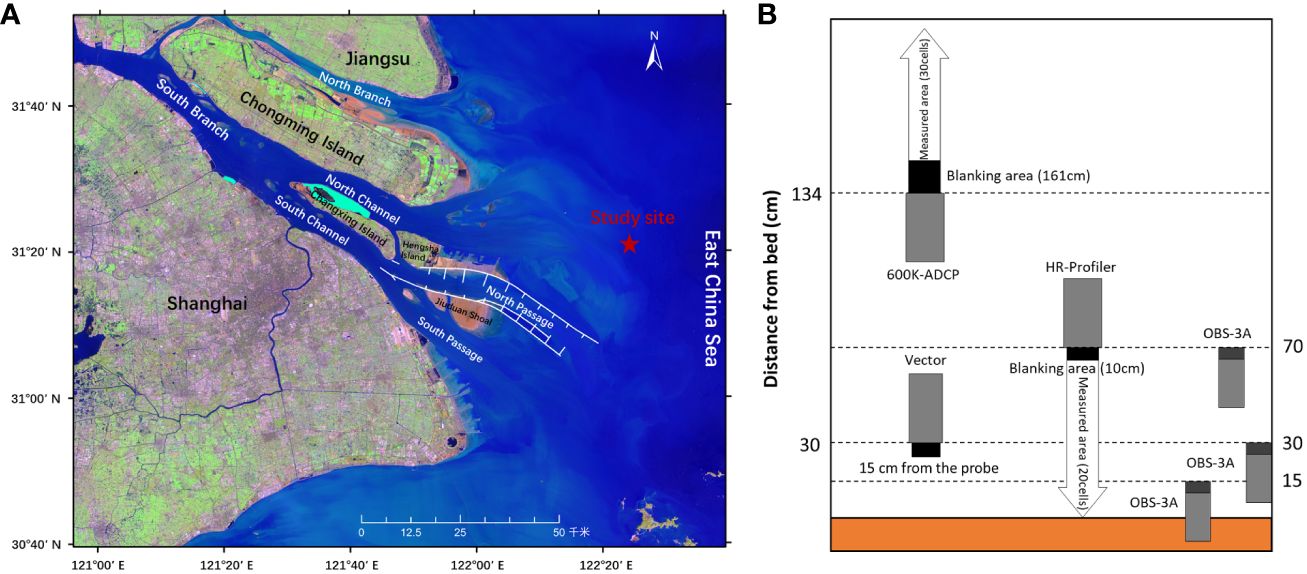
Figure 1 (A) Topography of the Changjiang Estuary. Location of the study site marked by red star seaward the North Channel. (B) Bottom tripod system and the equipped instruments.
The Changjiang Estuary is a typical mesotidal estuary with a mean tidal range of 2.66 m and a maximum of 4.62 m at the river mouth (Shen et al., 2003). Its tidal current limit can reach Jiangyin and the tidal limit can extend to Datong. The tide outside of the mouth (20 m isobath) exhibits regular semi-diurnal spring-neap signals. When tides propagats into the estuary, it turns to be an irregular semi-diurnal signal because of the shallow water effect. Wind speed is approximately 4 m/s (maximum 36 m/s) on average and the mean wave height is 1.0 m (maximum 6.2 m) at the 10-m isobath.
The North Channel (Figure 1A) is a branching channel of the Changjiang Estuary to the sea, with a total length of about 32 km and opened as the main waterway of Shanghai Port in 1870. The tide in the North Channel is irregular and semi-diurnal with progressive tidal waves. As a secondary branch of the Changjiang Estuary, the water diversion ratio to the South Channel is about 55.2%, and the sediment diversion ratio is about 55% (Bao and Zhu, 2017). The annual mean tidal range is 2.45 m, up to 3.38 m maximum and the minimum tidal range is only 0.64 m (Yang et al., 2012). The median particle size of the bed surficial sediment is 55.9 μm on average, and the ratio of cohesive sediment is up to 48.3%. Silty sand and sandy silt are the main constituent parts of the sediment (Li, 2018).
3 Methodology
3.1 Data collection
The field observations took place during September 07-11, 2018 at the lower North Channel in the high turbidity region in the Changjiang Estuary (Figure 1A). We implemented a bottom tripod system here to obtain the high-resolution near-bed data and therefore understanding the vertical and horizontal hydrodynamics and sediment processes (Figure 1B).
We collected depth, significant wave height, velocity profile, near-bottom 3D high-frequency velocity and turbidity (Figure 1B). An upward-looking acoustic Doppler current profiler (ADCP-wave, 600 kHz) placed 1.34 m above the bed (ab) with a 1.61 m blanking distance and the vertical resolution (bin size) was 0.5 m. A downward- looking HR-profiler was fixed at 0.7 mab (meters above bed) with a 0.1 m blanking distance, and the bin size was 0.03 m. The velocity profile within the water column was acquired by the measurements at 10 min intervals from ADCP and HR-profiler. To measure the near-bottom 3D high-frequency velocity, an acoustic Doppler velocimeter (ADV, 12 MHz Nortek Vector) was equipped 0.3 mab measuring the current velocity at 0.15 mab. The burst mode was set for the sensor at 10 min intervals. The ADV burst duration was 1 min, and the sampling frequency within each burst was 32 Hz (i.e., 1920 data points per burst). There were three optical backscatter sensors (OBS-3A, D&A Instrument Company, Washington, USA) mounted at 0.15, 0.3, 0.7 mab to measure near-bottom turbidity with a sampling interval of 10 min. The information of sampling frequency, interval and resolution of all instruments is summarized in Table 1. Wave parameters (significant wave height, peak period, peak direction) were extracted from the ADCP-wave referred above.
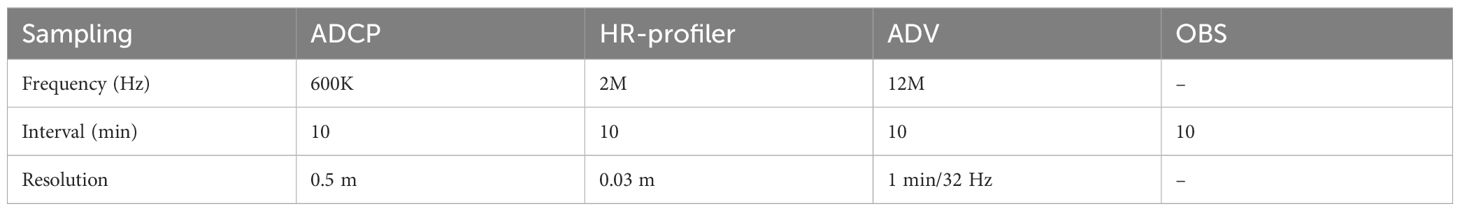
Table 1 Summary of all instrument settings.
The instruments worked well during the observation period. The Changjiang River discharge measured at the Datong station was approximately 32,000 m3/s during this field survey, which was close to the climatological value during the wet season. The prevailing wind was east to northeast, 4.6 m/s averaged and 9.3 m/s maximum during this field work.
3.2 Suspended sediment concentration estimates
To calibrate the turbidity (NTU) measured by the OBS, mud on the bed were sampled for the laboratory calibration experiment. We converted measured turbidity value into suspended sediment concentration (SSC) using the well-defined relationship between NTU and SSC . The correlation coefficients, R2, of the NTU-SSC relationship were greater than 0.95, indicating a good calibration of our turbidity data (Figure 2).
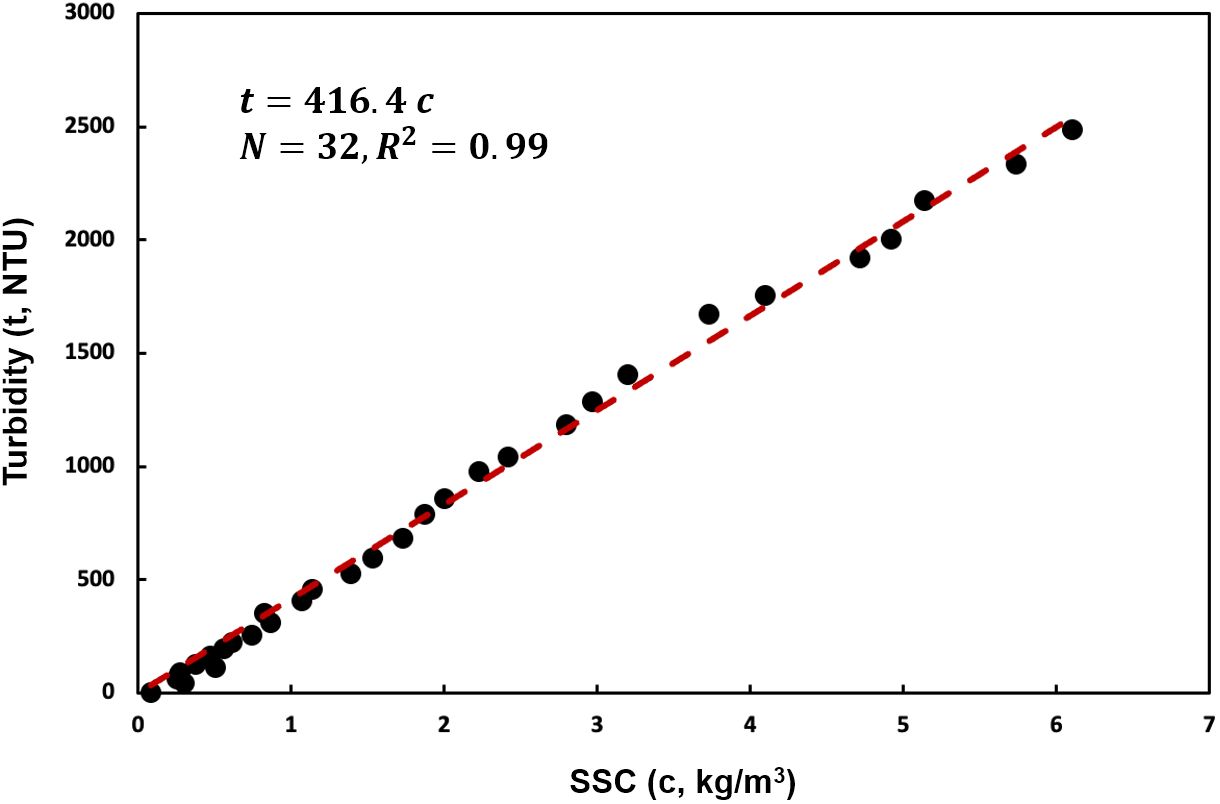
Figure 2 Relationship between measured turbidity and suspended sediment concentration.
3.3 Calculation of bed shear stress
3.3.1 Current-induced shear stress
The bed shear stress can be computed using measured velocity time series and turbulent flow theory. Based on measured instantaneous current velocities (Equations 1-2), different methods have been developed in the literature for the calculation of bed shear stress values: the Logarithmic velocity Profile (LP) method (Soulsby and Dyer, 1981; Kim et al., 2000; Andersen et al., 2007), the Turbulent Kinetic Energy (TKE) method (Soulsby, 1983; Williams et al., 1999; Talke and Stacey, 2003), the Reynolds Stress (RS) method (Kim et al., 2000; Andersen et al., 2007; Salehi and Strom, 2012) and the Inertial Dissipation (ID) method (Huntley, 1988; Kim et al., 2000; Trembanis et al., 2004). Considering that our observations included wave effects while the LP method is based on time-averaged flow velocity, which is not suitable. On the other hand, the RS method has been found to be sensitive to the probe orientation (Soulsby and Humphery, 1990). The ID method requires the measurement of turbulent spectra at a height above the seabed that is within the constant stress layer. Therefore, we chose the TKE method to estimate the current-induced shear stress.
is time-averaged velocity, is current-induced fluctuating velocity, is wave-induced fluctuating velocity (Soulsby and Humphery, 1990). Here we applied a simple spectral-filter method (typically between 1 and 0.1 Hz for wind waves) based on the Fast Fourier Transform (FFT) to filter out the fluctuations related to the waves. The current-induced bed shear stress (Equation 3) according to the TKE method is determined from the turbulent kinetic energy K,
where is the turbulent kinetic energy. Various values are proposed in publications for different estuaries, ranging from 0.18−0.21 (Soulsby, 1983; Kim et al., 2000; Talke and Stacey, 2003). was used for our study. derived from the TKE method is good estimation of the bed shear stress attributable to current in the presence of waves (Williams et al., 1999).
3.3.2 Wave-induced shear stress
Wave-induced bed shear stress (Equation 4) is usually obtained based on the wave friction coefficient and wave orbital velocity (m/s) at the edge of the wave boundary layer (van Rijn, 1993):
where is the seawater density (kg/m3). According to the linear wave theory, the peak orbital excursion (Equation 5) and peak orbital velocity (Equation 6) can be expressed respectively as:
where is the wave height (m), is the wave number (m-1), is the wavelength (m), is acceleration due to gravity (9.8 m/s2), is angular velocity (s-1), T is wave period (s), and h is water depth (m). The wave friction coefficient (Equation 7) depends on the hydraulic regime (Soulsby, 1997):
where is the wave Reynolds number, is the Nikuradse roughness, is the median grain size of the bed sediment (20.1 μm in our study site), and is the kinematic viscosity of water (m2/s). In addition, we used the significant wave height and spectral peak wave period in the equations mentioned above.
3.3.3 Combined wave and current shear stress
The magnitude of bed shear stress depends highly on wave-current interactions. Many parametric models have been developed to determine the combined wave-current shear stress (Grant and Madsen, 1979; Soulsby and Clarke, 2005). Here, we used the Wave-Current Interaction (WCI) model proposed by Soulsby (2005) to estimate the shear stress . Considering the non-linear interaction between waves and currents, this model introduced a correction coefficient (Equation 8) in the calculation of mean bed shear stress (Equation 9):
The combined wave and current shear stress (Equation 10) in this model is expressed as follows:
where is the angle between the waves and currents.
4 Results
4.1 Tidal currents and velocity profiles
In our study site, the maximum and minimum water depths were 19.7 m and 15.4 m, respectively (Figure 3A). The tides showed strong rotating flow characteristic (Figure 3B). The bottom velocities at 15 cmab were obtained from the ADV with comparable velocities in the east direction (0.59 m/s maximum) and in the north direction (0.46 m/s maximum).
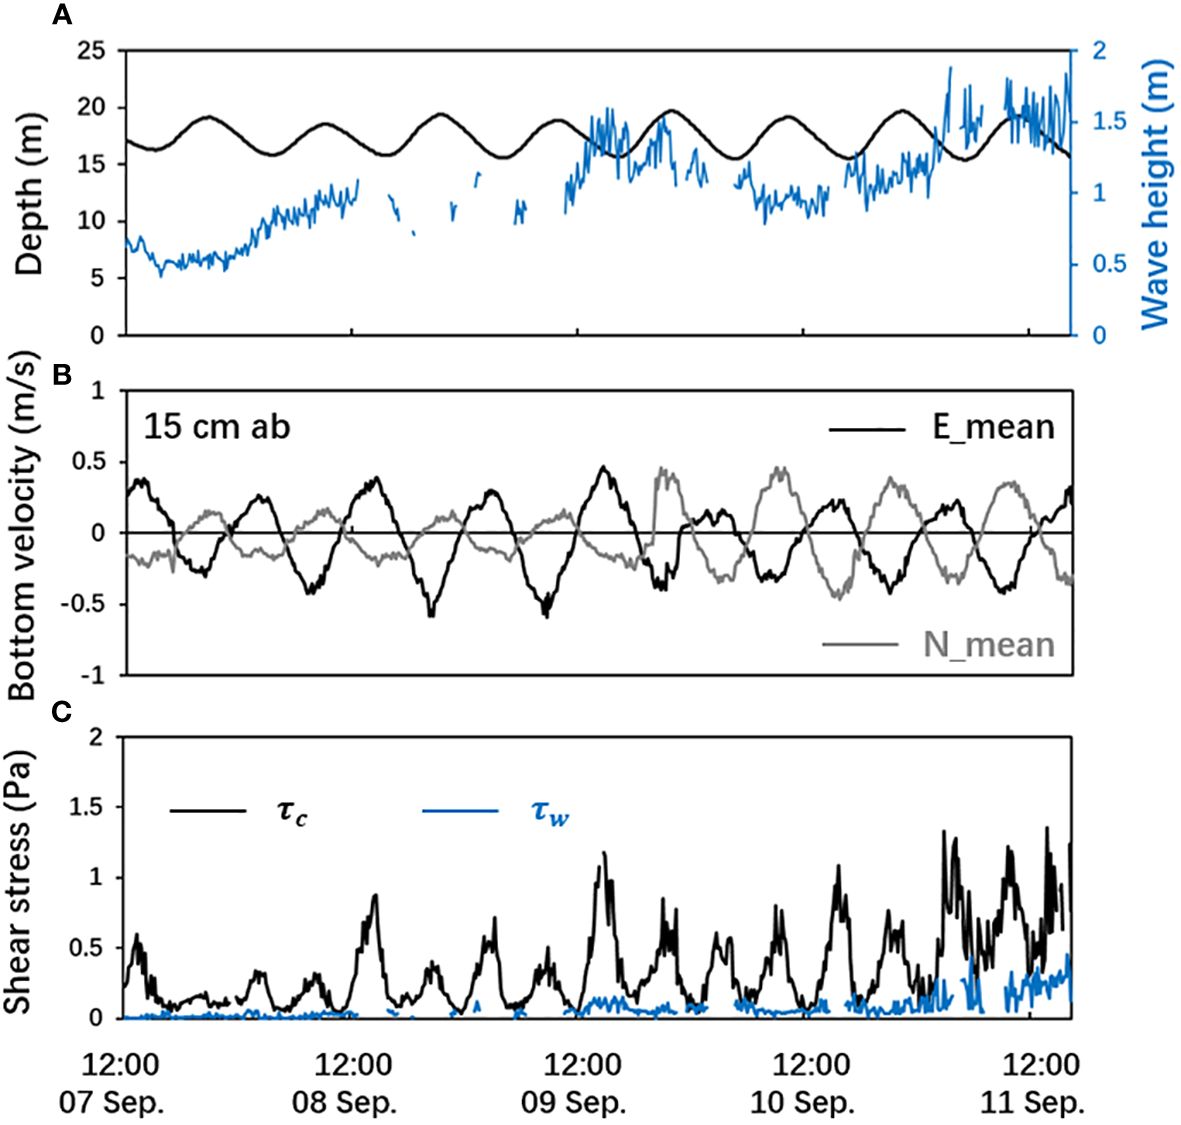
Figure 3 Time series of the datasets: (A) depth and significant wave height, (B) bottom velocity at east and north direction (0.15 mab), (C) bed shear stress (current-induced wave-induced .
The mean current data was obtained from the HR-profiler close to the bed, so we were able to obtain the vertical variation of flow (the 60-cm water column above the bed is shown here). The resulting vertical distribution of mean current velocity was shown in Figure 4. Considering the flow in our study showed a significant rotating current feature, even effecting to the bottom, we plotted measured velocities both in the east and north directions. The velocities varied from -0.6 m/s to 0.7 m/s, approximately. Moreover, we observed considerable upward velocities, with a regular peak about 0.05 m/s and even up to 0.15 m/s maximum (Figure 4C). Particularly, it showed almost persistent downward velocities in the latter half of the field work period. It played a vital role in vertical sediment transport, which will be further discussed in the following parts. We also checked turbulent velocity at 0.15 m above the bed (Figure 4D).
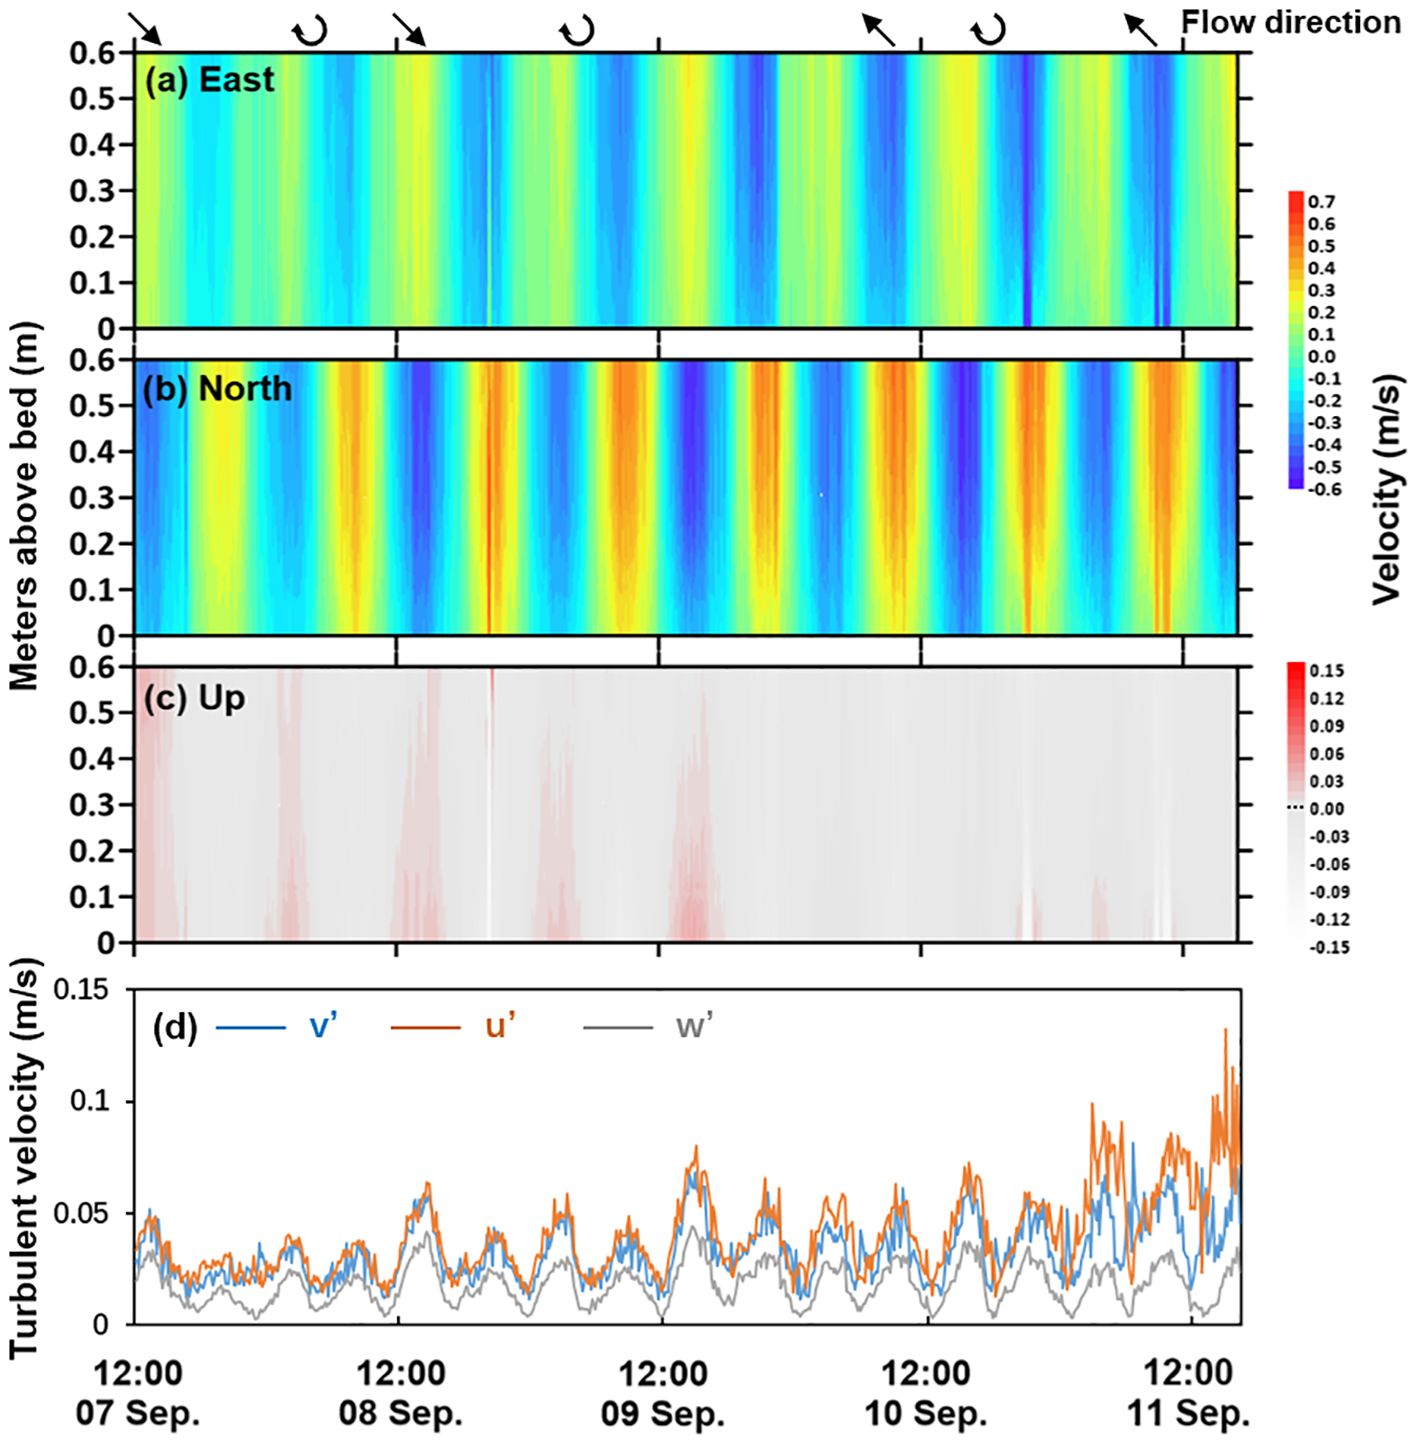
Figure 4 Time-series of vertical velocity profile 0.6 m above the bed (A-C) and turbulent velocity variations at 0.15 m above the bed (D). The positive value represents east (A), north (B), upward (C).
Wave-induced bed shear stress as relatively small compared to the current-induced bed shear stress (Figure 3C); both the deep water -depth and the small wave height took charge of these negligible wave influences.
4.2 Vertical suspended sediment flux
The deployment of a well-equipped tripod also allowed measuring a time-dependent variation of suspended sediment dynamics near the seabed. SSC at three heights above the bed was obtained (Figure 5A), which showed a periodic signal associated with tidal cycles. SSC at 30 cmab was larger than that at 15 and 70 cmab. Moreover, the SSC peaks increased up to 2.5 kg/m3 in the latter part of the timeseries.
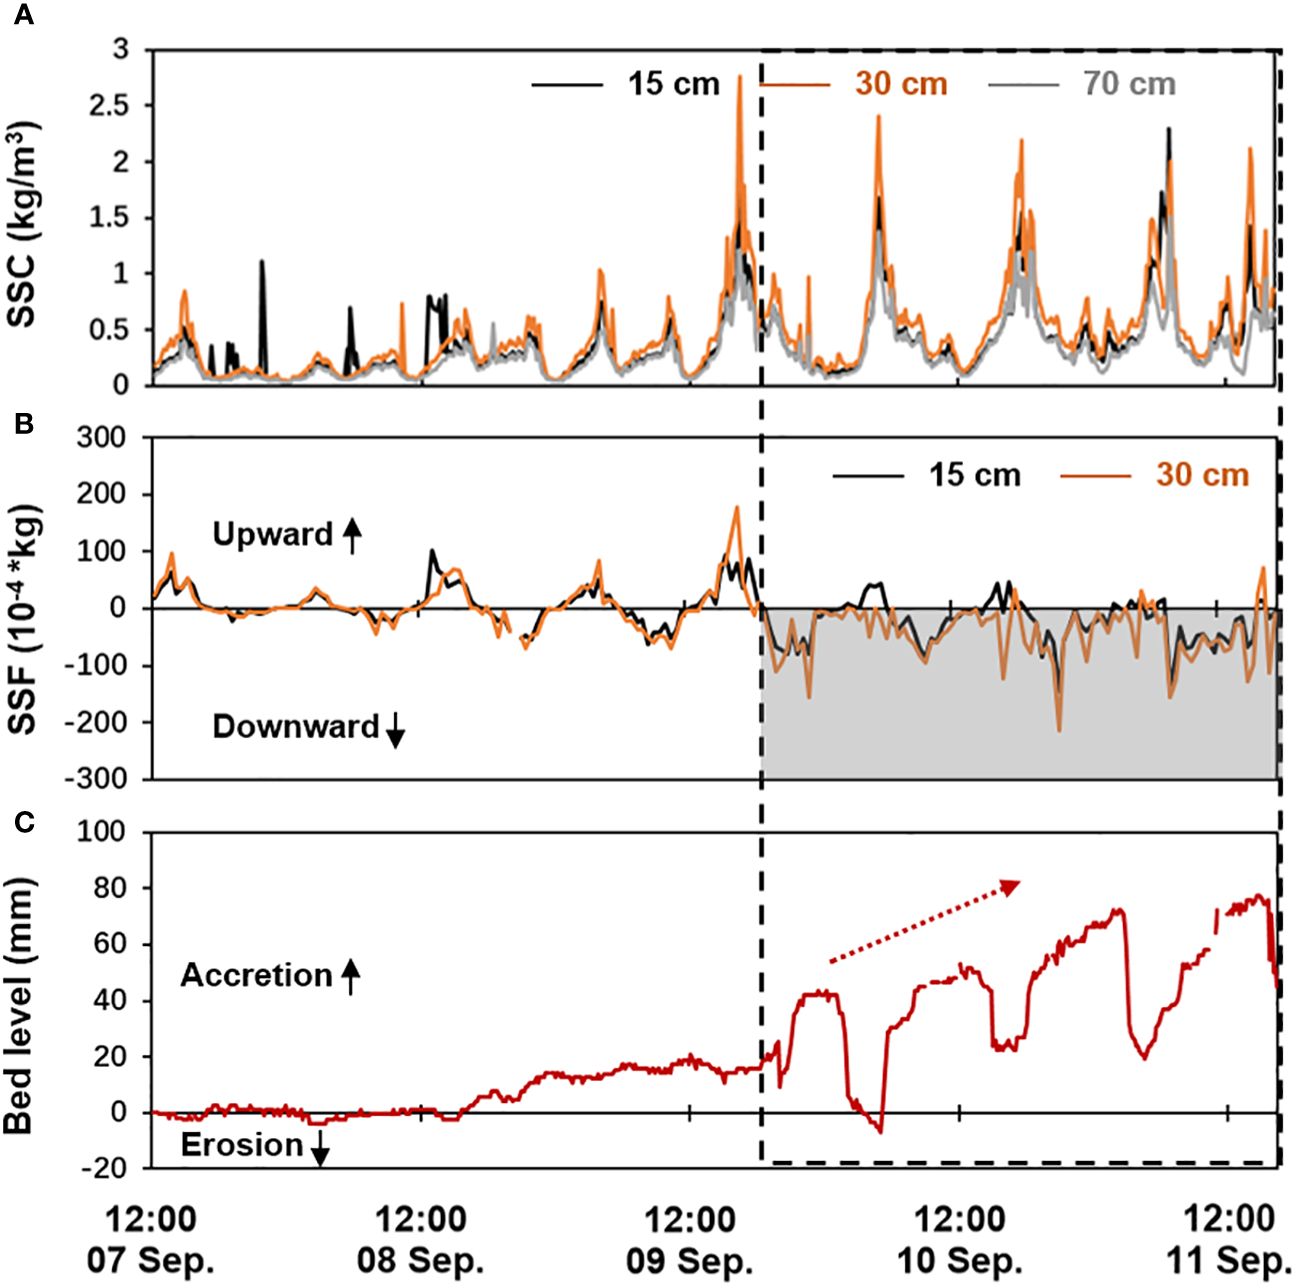
Figure 5 Vertical suspended sediment flux near the bottom. (A) suspended sediment concentration (SSC) at the heights of 0.15 m, 0.30 m and 0.70 m based on OBS, (B) SSF, the mass of suspended sediment flux (kg/s-1m-2) and (C) bed level changes.
Furthermore, to study the combined effects of hydrodynamics and sediment transport, the mass of suspended sediment flux (SSF, kg/s-1m-2) (Equation 11) is calculated:
where is different height above the bed (m), is upward velocities (m/s) and is suspended sediment concentration (kg/m3) observed at 15 cmab and 30 cmab in this study. The positive value represents upward SSF and the negative value represents downward SSF (Figure 5B).
During the first half of the observation period, considerable upward velocities were observed, which was recognized as an important factor driving the upward SSF. The upward flux occurred along with relatively low bed shear stress when vertical velocity was positive with large vertical shear (Figure 4). During the latter observation period (dotted line frame in Figure 5), associated with an intensified variation of SSC (Figure 5A), we observed persistent downward sediment fluxes (negative SSF values in the shading area, Figure 5B). Moreover, we noticed that there was an evident accretion tendency after September 9 along with frequent deposition-erosion transition (Figure 5C). So far, we inferred that this observed bed accretion tendency was dominated by downward sediment transport.
4.3 Bed level changes
During the latter observation period, we observed a rapid and intense bed level accretion at the tidal-cycle scale, which differed from the regular changes within several days reported before (Zhu et al., 2017; Xie et al., 2018). This rapid and intense bed accretion occurred simultaneously with the consistent negative SSF (Figure 5), suggesting the continuous downward sediment fluxes might be predominantly attributed to bed level changes. In addition, frequent deposition-erosion transitions occurred during the period of bed accretion. To study whether or not this frequent transition was predominantly controlled by the variations of sediment fluxes, we classified the whole period of bed accretion into four parts, marked as shading areas (Figure 6A). We separated each part by the dashed lines as the transition between the accretion-erosion period (Figure 6A).
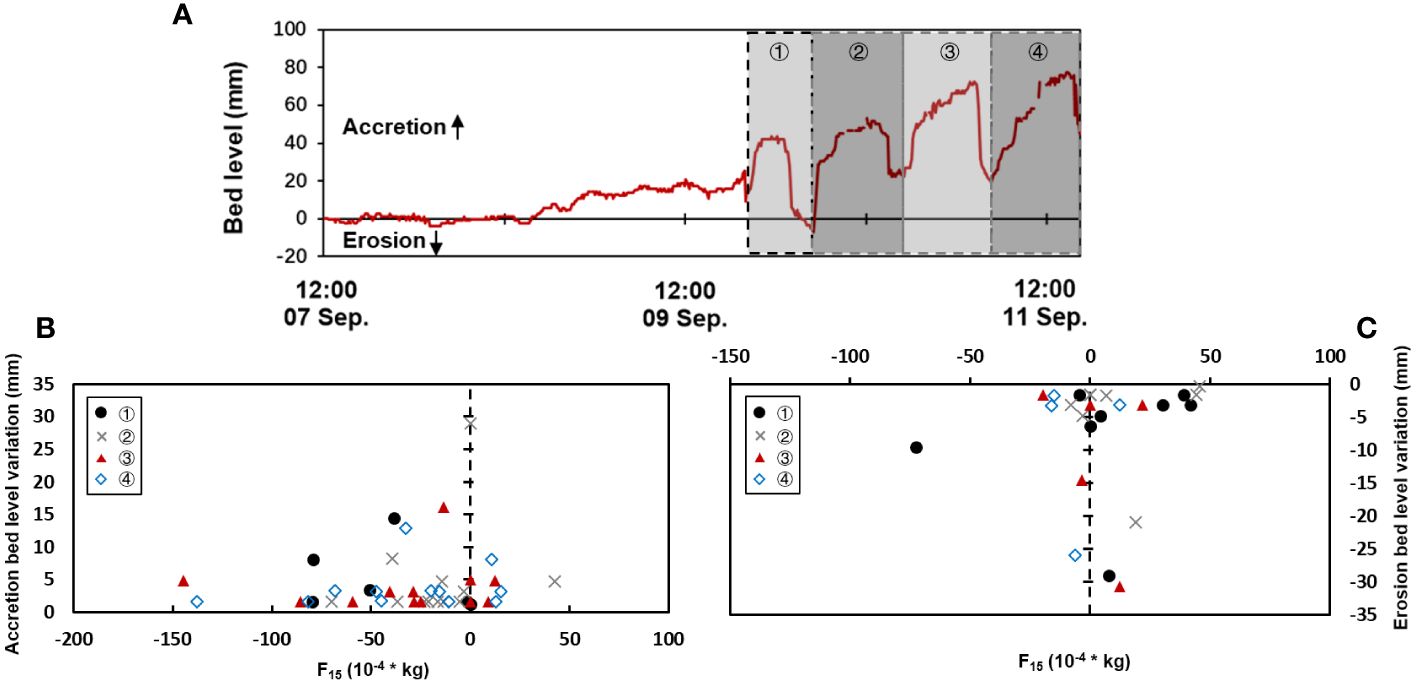
Figure 6 Scatter plots between bed level variation and vertical suspended sediment flux at 15 cm ab in the four cases. (A) bed level changes, (B) accretion bed level (d) variation and (C) erosion bed level variation . F15: the mass of suspended sediment flux at 15 cm ab (kg/s-1m-2).
Figure 6B showed the scatter diagram of the SSF at 15 cmab (F15) to the accretion bed level variation; Figure 6C showed the scatter diagram of the SSF at 15 cmab (F15) to the erosion bed level variation. Different symbolic points in the diagrams represent the four different parts. The negative values of the x-axis mean downward SSF, and the positive values mean upward SSF. Firstly, there was no consistency in the distribution of different symbol points. In other words, the single physical mechanism controlling the bed level changes did not exist. Secondly, we observed the distribution pattern of these points, most of that occurred in the negative x-axis part with accretion bed level variation (Figure 6B). This clearly corroborated the hypothesis above: the accretion bed level variation was almost caused by downward sediment transport. It is also worth noting that there was no evident distribution rule in the erosion bed level variation (Figure 6C). So far, we are convinced there are other fundamental mechanisms in the bed-level changes that differ from vertical exchange processes. We will check the impact of horizontal advective transport on the rapid and intense accretion-erosion transitions and give interpretation in Section 5.3.
5 Discussion
The physical process of estuarine area is very complicated due to the coupling effects of water mixing, estuary circulation and tidal currents. In the region within active land-sea interaction, sediment is resuspended, transported, and settled repeatedly, resulting in continuous erosion and accretion of the seabed. In this regard, many researchers have focused on morphological changes, process regimes, and stability states within estuaries. These works include the long-term evolution in the upstream section (Hu et al., 2008), in the North Channel (Wu et al., 2004), and in an individual flood channel within the estuary (Wang et al., 2008). But few researchers focused on the frequent, short-term and intense morphological changes. It is therefore essential to elucidate the controlling mechanisms for the rapid and intense bed level changes. Here, we focused on the dataset during the bed accretion period with frequent deposition-erosion transitions to explore the potential mechanisms (Figure 7).
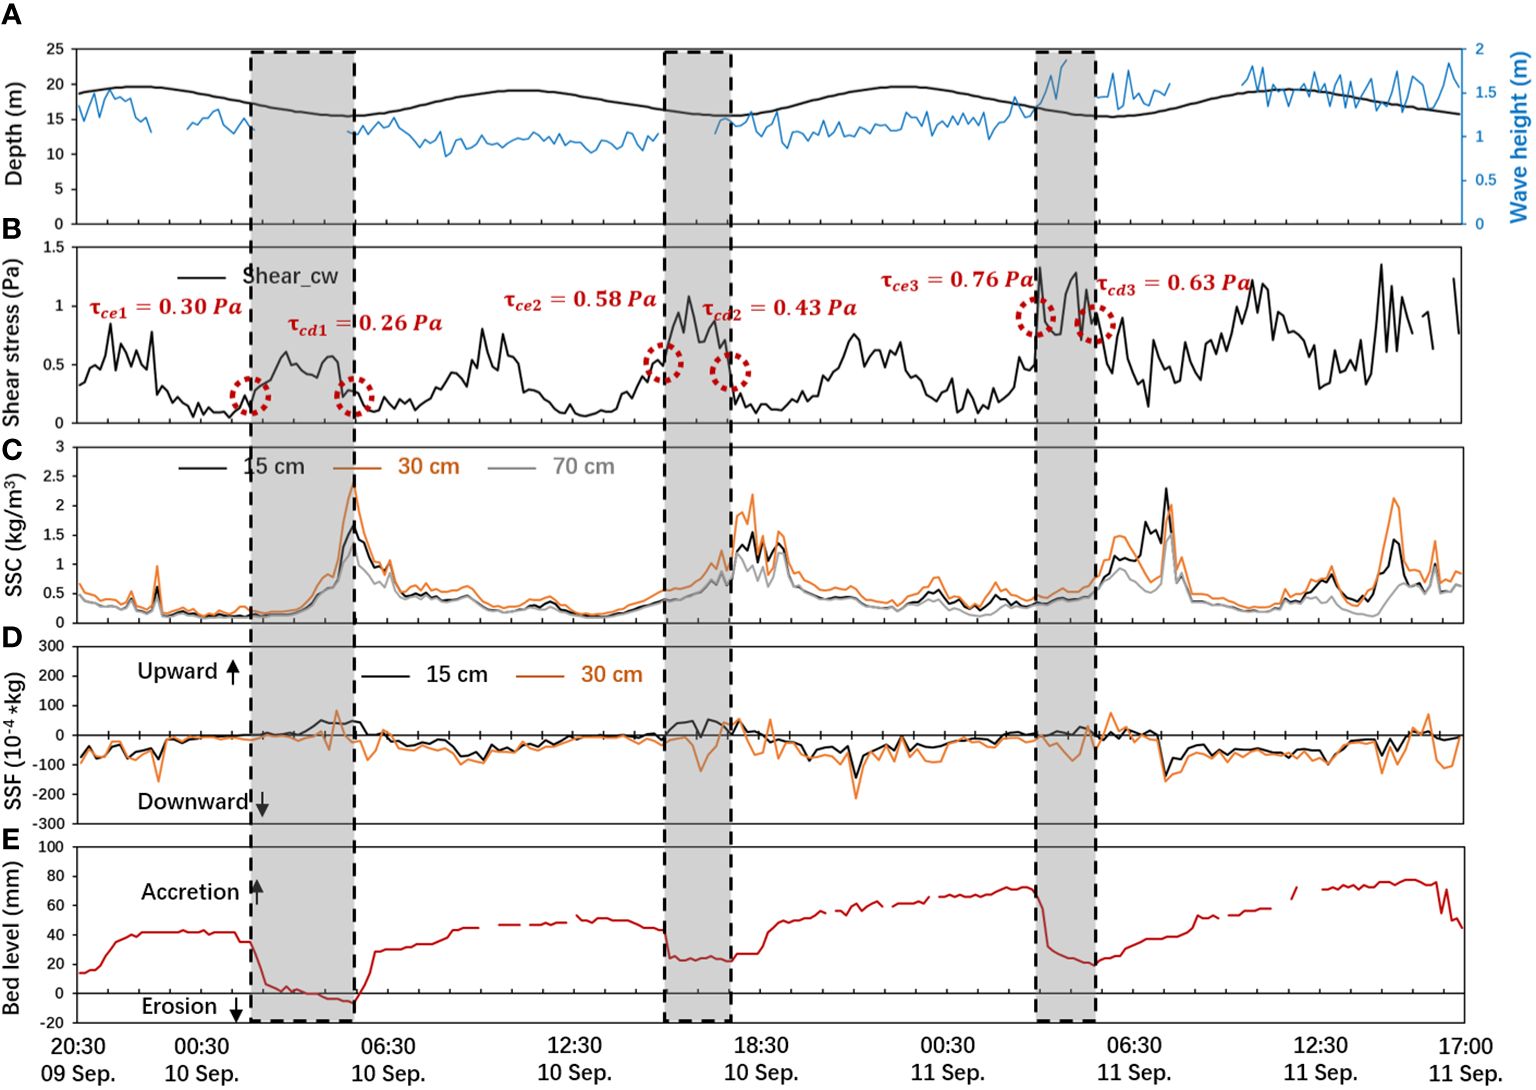
Figure 7 Time series of the frequent accretion-erosion transition period. (A) depth and significant wave height, (B) combined current and wave bed shear stress , (C) suspended sediment concentration (SSC) at the heights of 0.15 m, 0.30 m and 0.70 m based on OBS, (D) SSF, the mass of suspended sediment flux (kg/s-1m-2) and (E) bed level changes.
5.1 Lagging SSC peak
Comparisons between SSC at 15 cm and 30 cm above the bed showed a ‘reverse pattern’ (Figure 7C): the SSC at the 30 cmab was larger than that at the 15 cmab. This is in contrast to our common view, where the SSC becomes larger while approaching the seabed.
We also observed severe SSC peaks during the period (Figure 7C). The SSC peaks at three heights occurred nearly at the same time. But each of these peaks occurred right after bed shear stress increment and bed erosion (shading area in Figures 7C, E). Such a mismatch between SSC peak and erosion suggested a ‘lag effect’. The duration of each erosion event was 3, 2, and 2 hours, respectively, while the corresponding lag time was 0 hour, 0.67 hour, and 2.17 hours, suggesting that the ‘lag effect’ was amplified as bed accretion continued. As the ‘lag effect’ disappeared between peaks at different three heights but significantly performed between SSC peak and erosion period, it was not reasonable to explain that high SSC based on vertical resuspension processes only. Additionally, we found that low SSC occurred between SSC peaks along with high shear stress. It implied that the erodibility could be weak in the accretion period right after fully erosion of the upper fine sediment deposition layer on bed during the rapid and intense erosion period. Further mechanisms controlling these processes will be discussed in Section 5.3.
5.2 Dynamic critical bed shear stress
Critical bed shear stress is a vital physical quantity to calculate sediment mass fluxes, predict the cycles of sediment erosion and deposition, and access coastal morphodynamics (Shi et al., 2015, 2016, 2018). The single constant value of bed shear stress has been widely applied in prior studies, while the potential spatial and temporal variations have been ignored.
In this study, we investigated those changes in critical shear stresses for erosion and deposition. We defined that if the sudden decline point of the observed bed level exceeded 10%, the local bed shear stress is referred as the critical bed shear stress for erosion ; similarly, if the sudden rise point of the observed bed level exceeded 10%, the local bed shear stress is considered as the critical bed shear stress for deposition . Therefore, we obtained the critical bed shear stress for the three accretion and erosion cycles occurred during the observation period (Figures 7B, E): , ; , ; , . The range of critical bed shear stress agreed with prior field work and laboratory tests by Qiao et al. (2021), where the average bed shear stress for erosion was 0.45 Pa outside the North Channel, though no spatiotemporal variance was investigated. Our data further revealed the critical bed shear stresses for erosion and deposition varied significantly and increased by more than 2 times during such a short period of time (~2 days). Such a considerable variation could cause intense sediment fluxes and we hence suggest a need to consider the dynamic nature of critical bed shear stress before sediment transport and associated morphodynamic changes can be appropriately predicted and modelled.
5.3 Sediment budget and implications
Quadrant analysis has been applied to study turbulent flow and the effects of coherent structures on the mobilization of sediment particles (Sutherland, 1967; Li et al., 2022). Four quadrants: ejection (E), sweep (S), outward (O) and inward (I) interactions, are commonly identified using the instantaneous flow conditions (Grass, 1971; Deigaard and Sumer, 1981; Salim et al., 2017). Following this method, we applied quadrant analysis to clarify the physical mechanisms controlling the rapid and frequent accretion-erosion processes of sediment transport during the observed period.
The arrows represent sediment goes into and out of this control body in vertical and horizontal directions.
Based on the assumption above, we proposed such a vertical idealized control of water column (from 15 cmab to 30 cmab) (Figure 8). We introduced the , here is vertical suspended sediment flux. By defining the upward direction as positive, positive values represent that the sediment goes out of this control body in vertical direction; on the contrary, negative values represent that the sediment goes into this control body in vertical direction. From the matter conservation equations (Equation 12),
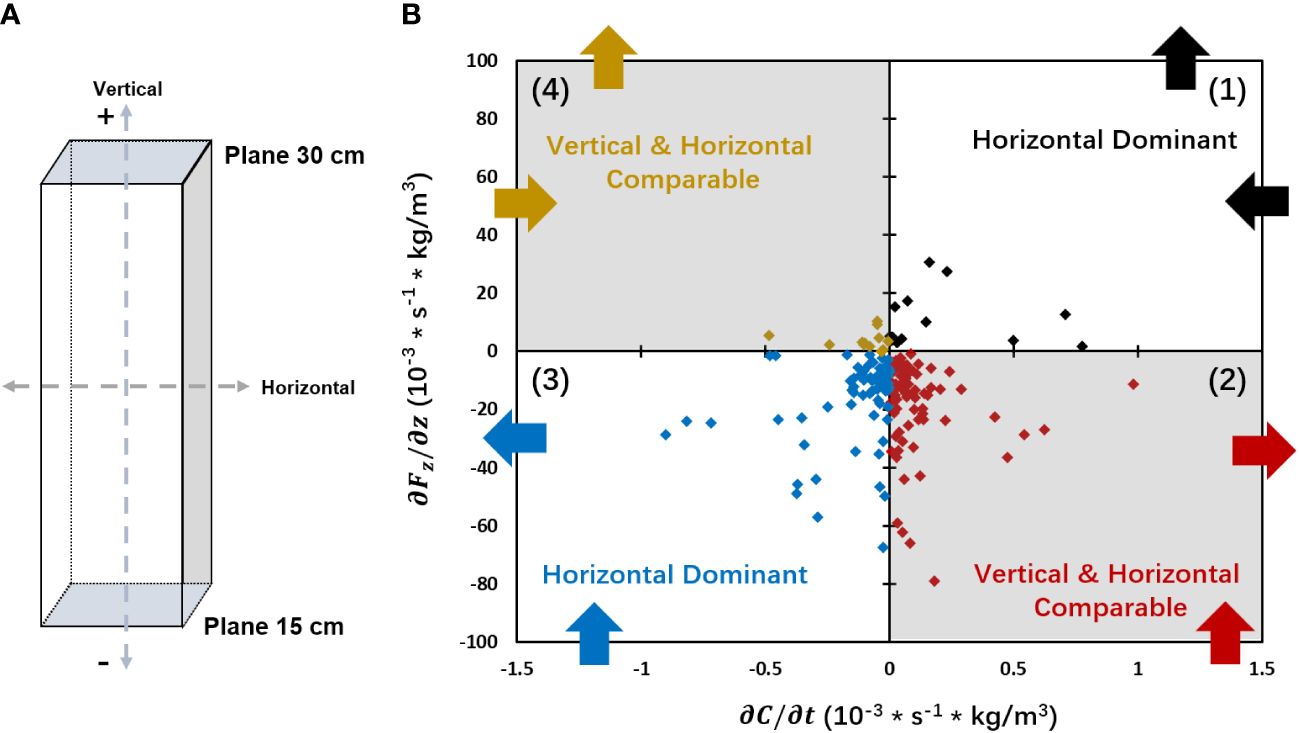
Figure 8 (A) Vertical idealized control of water column (from 15 cmab to 30 cmab). (B) Four quadrants with several dominant physical mechanisms for sediment transport.
c: suspended sediment concentration; : vertical suspended sediment flux; and : horizontal suspended sediment flux;t: time. We take the second term as vertical transport, the third and fourth term as horizontal transport. Based on the data, we can make calculation according to the equations below,
The frequent accretion-erosion transition period can be investigated by the four quadrants theoretically (Figure 8) (Equations 13-16). In the first quadrant, the sediment goes out of this control body () in vertical direction with increasing SSC (). It reveals horizontal transport dominates the pattern of sediment dynamics. In the second quadrant, the sediment goes into this control body () in vertical direction with increasing SSC (). In this case, the comparable values of and () can be derived from Eq. (12) which means that both vertical and horizontal transport take charge. The third quadrant performs a similar mechanism to the first and the fourth quadrant performs a similar mechanism to the second, except for the direction of horizontal and vertical transport.
This quadrant analysis allowed a clear understanding of the dominant processes in the control of the frequent accretion-erosion transition (Figure 9). In particular, continuous local erosion processes caused sediment resuspension, and played a vital role in sediment transport during the period right before SSC peaks occurred (red shading area in Figure 9). Moreover, the comparable values of and () indicated that the sediment took away by horizontal processes is balanced the sediment brought in by vertical processes (the second quadrant, Figure 8). In contrast, horizontal advective sediment transport exerted a predominant control during the period of continuous bed accretion (blue shading area in Figures 9B, C), while local sediment deposition appeared to play a less important role (blue shading area in Figures 9A, C). That was the mechanism driving SSC a ‘reverse pattern’ and a well-matched accretion period and SSC peaks.
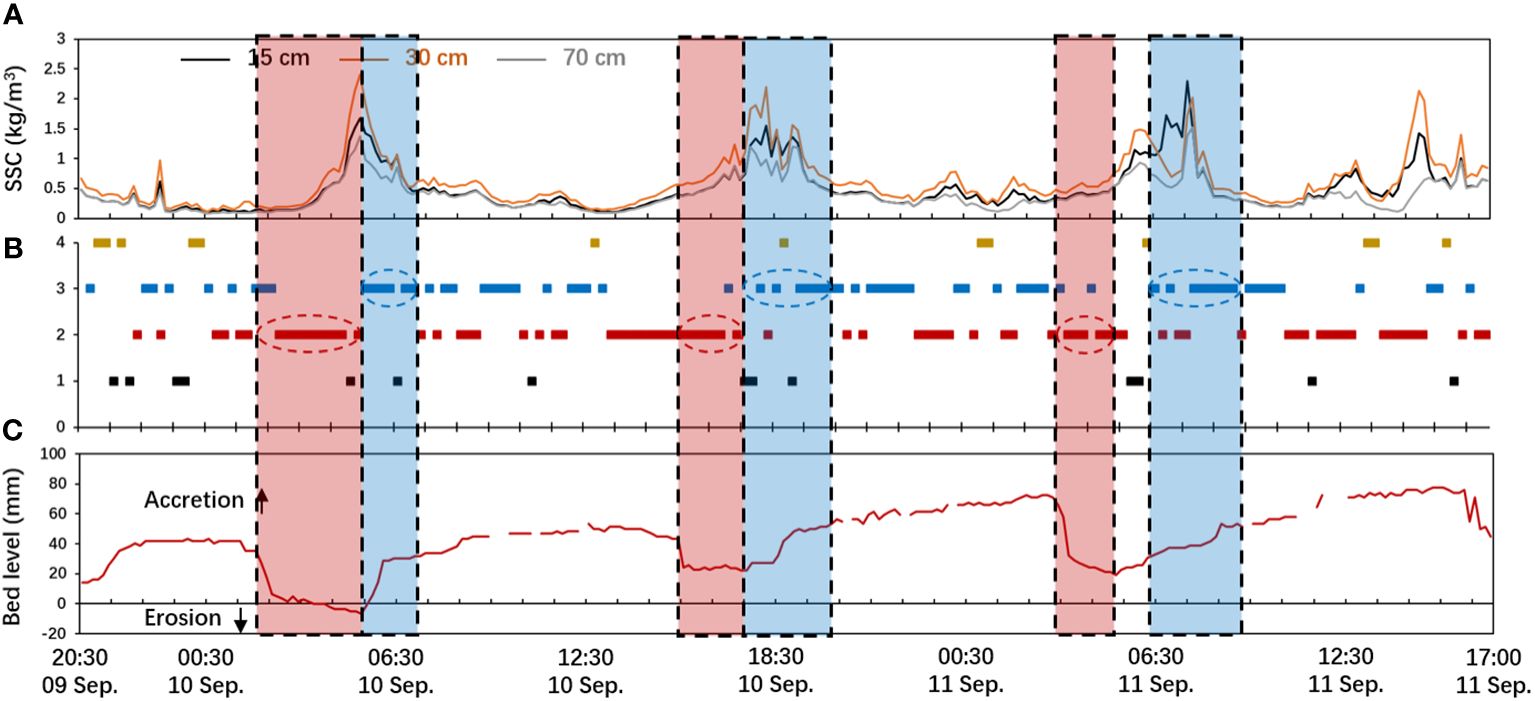
Figure 9 Mechanisms of rapid accretion-erosion transition. (A) suspended sediment concentration (SSC) at the heights of 0.15 m, 0.30 m and 0.70 m based on OBS, (B) four quadrants of different physical mechanisms and (C) bed level changes.
Hence during the intense and rapid bed accretion period, we found the frequent seabed deposition-erosion transitions were predominantly controlled by contrasting processes, including both local erosion and horizontal transport. These results imply that frequent and intense sediment exchange can occur between shoals and channels outside the North Channel mouth, which might have important implications for sediment transport and the evolution of coastal morphology.
6 Conclusions
In this study, rapid accretion-erosion transitions in tidal cycles within the complex hydrodynamic environment off the Changjiang Estuary were studied based on refined in-situ data using a bottom tripod observation system. The predominant controlling processes were discussed. The following conclusions can be drawn from our study:
(1) We find rapid and intense bed-level changes at the tidal-cycle scale outside the mouth of the North Channel, which differ from the regular changes within several days reported before. The downward sediment transport dominates the accretion tendency during the entire study period in this complex hydrodynamic environment.
(2) The critical bed shear stress in tidal cycles is dynamic. Moreover, it should be noted that the value is increasing overtime. In this study, the critical erosion bed shear stress varies from 0.30 to 0.76 Pa and the critical deposition bed shear stress varies from 0.26 to 0.63 Pa.
(3) A new quadrant analysis method clarifies the predominant processes that control the rapid accretion-erosion transitions. Our study reveals that rapid and frequent accretion and erosion are controlled by contrasting processes: local sediment resuspension dominates bed erosion. It causes SSC increment, while horizontal advective sediment transport is primarily attributed to bed accretion. These results imply that the seaward region of the North Channel may have frequent sediment exchange between adjacent shoals and channels.
Data availability statement
The raw data supporting the conclusions of this article will be made available by the authors, without undue reservation.
Author contributions
JJ: Data curation, Writing – original draft, Writing – review & editing. WX: Conceptualization, Writing – review & editing. NZ: Validation, Writing – review & editing. YX: Writing – review & editing. CZ: Writing – review & editing. JL: Data curation, Methodology, Writing – review & editing. LG: Visualization, Writing – review & editing. JS: Supervision, Writing – review & editing. QH: Supervision, Writing – review & editing.
Funding
The author(s) declare financial support was received for the research, authorship, and/or publication of this article. This work is financially supported by the National Natural Science Foundation of China (Nos. U2040216, 42206169). Financial support from the Shanghai Science and Technology Committee (20DZ1204701), Natural Science Foundation of Shanghai (23ZR1420100), and Shanghai Pujiang Program (22PJD020) is also acknowledged. This project is also funded by the Yangtze Delta Estuarine Wetland Ecosystem Observation and Research Station, Ministry of Education & Shanghai Science and Technology Committee (K202201) and Key Laboratory of Ocean Space Resource Management Technology, Ministry of Natural Resources (KF-2023-110).
Acknowledgments
We would like to thank Zhirui Deng and Shang Yu for their assistance in the field work.
Conflict of interest
The authors declare that the research was conducted in the absence of any commercial or financial relationships that could be construed as a potential conflict of interest.
Publisher’s note
All claims expressed in this article are solely those of the authors and do not necessarily represent those of their affiliated organizations, or those of the publisher, the editors and the reviewers. Any product that may be evaluated in this article, or claim that may be made by its manufacturer, is not guaranteed or endorsed by the publisher.
References
Andersen T. J., Fredsoe J., Pejrup M. (2007). In situ estimation of erosion and deposition thresholds by acoustic doppler velocimeter (adv). Estuarine Coast. Shelf Sci. 75, 327–336. doi: 10.1016/j.ecss.2007.04.039
Bao D. Y., Zhu J. R. (2017). The effect of river regime changes in the Changjiang estuary on hydrodynamics and salinity intrusion in the past 60 years (iii. Saltwater intrusion). Haiyang Xuebao 39, 1–15.
Blott S. J., Pye K., van der Wal D., Neal A. (2006). Long-term morphological change and its causes in the Mersey estuary, New England. Geomorphol. (Amst) 81, 185–206. doi: 10.1016/j.geomorph.2006.04.008
Cowell P. J., Thom B. G. (1995). Morphodynamics of coastal evolution. Eds. Carter R. W. G., Woodroffe C. D. (Cambridge: Cambridge University Press), 33–86.
Deigaard R., Sumer B. M. (1981). Particle motions near the bottom in turbulent flow in an open channel. Part 2. J. Fluid Mech. 109, 311–337. doi: 10.1017/S0022112081001092
Grant W. D., Madsen O. S. (1979). Combined wave and current interaction with a rough bottom. J. Geophysical Res.: Oceans 84, 1797–1808. doi: 10.1029/JC084iC04p01797
Grass A. J. (1971). Structural features of turbulent flow over smooth and rough boundaries. J. Fluid Mech. 50, 233–255. doi: 10.1017/S0022112071002556
Hibma A., de Vriend H. J., Stive M. J. F. (2003). Numerical modelling of shoal pattern formation in well-mixed elongated estuaries. Estuarine Coast. Shelf Sci. 57, 981–991. doi: 10.1016/S0272-7714(03)00004-0
Hu H., Hu G., Hu G. (2008). Gis-supported analysis of the river channel evolution of south branch in the Yangtze estuary for the recent 100 years. Mar. Geol. Quaternary Geol. 02, 23–29. doi: 10.16562/j.cnki.0256-1492.2008.02.002
Huntley D. A. (1988). A modified inertial dissipation method for estimating seabed stresses at low reynolds numbers, with application to wave/current boundary layer measurements. J. Phys. Oceanogr. 18, 339–346. doi: 10.1175/1520-0485(1988)018<0339:AMIDMF>2.0.CO;2
Kim S. C., Friedrichs C. T., Maa J. P. Y., Wright L. D. (2000). Estimating bottom stress in tidal boundary layer from acoustic doppler velocimeter data. J. Hydraul Eng-Asce 126, 399–406. doi: 10.1061/(ASCE)0733-9429(2000)126:6(399)
Lane A. (2004). Bathymetric evolution of the Mersey estuary, UK 1906–1997: causes and effects. Estuarine Coast. Shelf Sci. 59, 249–263. doi: 10.1016/j.ecss.2003.09.003
Li Y. M. (2018). Studies on sediment characteristics and the influencing factors in the yangtze estuary riverbed during the recent 30 years. Master Dissertation of East China Normal University, Shanghai.
Li R., Voulgaris G., Wang Y. P. (2022). Turbulence structure and burst events observed in a tidally induced bottom boundary layer. J. Geophysical Res.: Oceans 127, e2021JC018036. doi: 10.1029/2021JC018036
Lin J., He Q., Guo L., van Prooijen B. C., Wang Z. B. (2020). An integrated optic and acoustic (ioa) approach for measuring suspended sediment concentration in highly turbid environments. Mar. Geol. 421, 106062. doi: 10.1016/j.margeo.2019.106062
Luan H. L., Ding P. X., Wang Z. B., Ge J. Z., Yang S. L. (2016). Decadal morphological evolution of the Yangtze estuary in response to river input changes and estuarine engineering projects. Geomorphol. (Amst) 265, 12–23. doi: 10.1016/j.geomorph.2016.04.022
Qiao Y., He Q., Wang X. (2021). Experimental study on critical shear stress of surface sediments in the Yangtze Estuary. Int. J. Sediment Res. 1, 34–41.
Reeve D. E., Karunarathna H. (2009). On the prediction of long-term morphodynamic response of estuarine systems to sea level rise and human interference. Cont. Shelf Res. 29, 938–950. doi: 10.1016/j.csr.2009.01.010
Ren J., Xu F., He Q., Shen J., Guo L., Xie W., et al. (2021). The role of a remote tropical cyclone in sediment resuspension over the subaqueous delta front in the Changjiang estuary, China. Geomorphol. (Amst) 377, 107564. doi: 10.1016/j.geomorph.2020.107564
Salehi M., Strom K. (2012). Measurement of critical shear stress for mud mixtures in the San Jacinto estuary under different wave and current combinations. Cont. Shelf Res. 47, 78–92. doi: 10.1016/j.csr.2012.07.004
Salim S., Pattiaratchi C., Tinoco R., Coco G., Hetzel Y., Wijeratne S., et al. (2017). The influence of turbulent bursting on sediment resuspension under unidirectional currents. Earth Surf Dyn 5, 399–415. doi: 10.5194/esurf-5-399-2017
Shen H. T., Mao Z. C., Zhu J. R. (2003). Saltwater Intrusion in the Changjiang Estuary (Beijing: China Ocean Press).
Shi B., Wang Y. P., Du X., Cooper J. R., Li P., Li M. L., et al. (2016). Field and theoretical investigation of sediment mass fluxes on an accretional coastal mudflat. J. Hydro-Environ Res. 11, 75–90. doi: 10.1016/j.jher.2016.01.002
Shi B., Wang Y. P., Wang L. H., Li P., Gao J., Xing F., et al. (2018). Great differences in the critical erosion threshold between surface and subsurface sediments: a field investigation of an intertidal mudflat, Jiangsu, China. Estuarine Coast. Shelf Sci. 206, 76–86. doi: 10.1016/j.ecss.2016.11.008
Shi B., Wang Y. P., Yang Y., Li M., Li P., Ni W., et al. (2015). Determination of critical shear stresses for erosion and deposition based on in situ measurements of currents and waves over an intertidal mudflat. J. Coast. Res. 31, 1344–1356. doi: 10.2112/JCOASTRES-D-14-00239.1
Soulsby R. L. (1983). ““Chapter 5 the bottom boundary layer of shelf seas,”,”. Ed. Johns B., Physical Oceanography of Coastal and Shelf Seas (The Netherlands: Elsevier) 189–266. doi: 10.1016/S0422-9894(08)70503-8
Soulsby R. L. (1997). Dynamics of marine sands: a manual for practical applications. Oceanographic Literature Rev. 9, 947.
Soulsby R. (2005). Bed shear-stresses under combined waves and currents on smooth and rough beds: produced within defra project fd1905 (estproc). Wallingford: HR Wallingford.
Soulsby R. L., Clarke S. (2005). Bed shear-stress under combined waves and currents on smooth and rough beds (tr 137). (Wallingford: HR Wallingford).
Soulsby R. L., Dyer K. R. (1981). The form of the near-bed velocity profile in a tidally accelerating flow. J. Geophysical Res.: Oceans 86, 8067–8074. doi: 10.1029/JC086iC09p08067
Soulsby R. L., Humphery J. D. (1990). Field observations of wave-current interaction at the sea bed (The Netherlands: Springer), 413–428.
Sun J., van Prooijen B., Wang X., Zhao Z., He Q., Wang Z. (2024). Sediment fluxes within salt marsh tidal creek systems in the Yangtze estuary. Geomorphol. (Amst) 449, 109031. doi: 10.1016/j.geomorph.2023.109031
Sutherland A. J. (1967). Proposed mechanism for sediment entrainment by turbulent flows. J. Geophysical Res. 1896-1977) 72, 6183–6194. doi: 10.1029/JZ072i024p06183
Talke S. A., Stacey M. T. (2003). The influence of oceanic swell on flows over an estuarine intertidal mudflat in San Francisco bay. Estuarine Coast. Shelf Sci. 58, 541–554. doi: 10.1016/S0272-7714(03)00132-X
Trembanis A. C., Wright L. D., Friedrichs C. T., Green M. O., Hume T. (2004). The effects of spatially complex inner shelf roughness on boundary layer turbulence and current and wave friction: Tairua embayment, New Zealand. Cont. Shelf Res. 24, 1549–1571. doi: 10.1016/j.csr.2004.04.006
van der Wal D., Pye K., Neal A. (2002). Long-term morphological change in the Ribble estuary, Northwest England. Mar. Geol. 189, 249–266. doi: 10.1016/S0025-3227(02)00476-0
van Rijn L. C. (1993). “Principles of sediment transport in rivers,” in Estuaries and Coastal Seas (The Netherlands: Aqua Publications).
Wang Y., Dong P., Oguchi T., Chen S., Shen H. (2013). Long-term, (1842–2006) morphological change and equilibrium state of the Changjiang (Yangtze) Estuary, China. Cont. Shelf Res. 56, 71–81. doi: 10.1016/j.csr.2013.02.006
Wang Y., Ridd P. V., Wu H., Wu J., Shen H. (2008). Long-term morphodynamic evolution and the equilibrium mechanism of a flood channel in the Yangtze estuary (China). . Geomorphol. (Amst) 99, 130–138. doi: 10.1016/j.geomorph.2007.10.003
Wheeler P., Peterson J., Gordon-Brown L. (2010). Long-term bathymetric effects of groyne array emplacement at lakes entrance, Victoria, Australia. Appl. Geogr. 30, 126–140. doi: 10.1016/j.apgeog.2009.07.001
Williams J. J., Rose C. P., Thorne P. D., O’Connor B. A., Humphery J. D., Hardcastle P. J., et al. (1999). Field observations and predictions of bed shear stresses and vertical suspended sediment concentration profiles in wave-current conditions. Cont. Shelf Res. 19, 507–536. doi: 10.1016/S0278-4343(98)00098-3
Wren D. G., Barkdoll B. D., Kuhnle R. A., Derrow R. W. (2000). Field techniques for suspended-sediment measurement. J. Hydraul Eng-Asce 126, 97–104. doi: 10.1061/(ASCE)0733-9429(2000)126:2(97)
Wu X., He Q., Shen J., Peng Z., Guo L., Xie W., et al. (2023). Different effects between cold front and tropical cyclone on short-term morphodynamics in the Changjiang delta. J. Mar. Syst. 243, 103961.
Wu H. L., Shen H. T., Mao Z. C. (2004). Calculation of the amount of siltation and erosion in the South and North channels in the Changjiang Estuary and its evolution. Int. J. Sediment Res. 3, 75–80.
Xie W., He Q., Zhang K., Guo L., Wang X., Shen J. (2018). Impacts of human modifications and natural variations on short-term morphological changes in estuarine tidal flats. Estuaries Coast. 41, 1253–1267. doi: 10.1007/s12237-017-0352-9
Yang Z., Zhu J., Wang B. (2012). Analysis of tidal characteristics of the tide gauges in the Changjiang Estuary. J. East China Normal Univ. (Natural Science) 3, 111–119.
Zhao J., Guo L., He Q., Wang Z. B., van Maren D. S., Wang X. (2018). An analysis on half century morphological changes in the Changjiang estuary: spatial variability under natural processes and human intervention. J. Mar. Syst. 181, 25–36. doi: 10.1016/j.jmarsys.2018.01.007
Zhou Z., Coco G., Mirian J., Olabarrieta M., Townend I. (2014). Morphodynamics of river-influenced back-barrier tidal basins: the role of landscape and hydrodynamic settings. Water Resour Res. 50, 9514–9535. doi: 10.1002/2014WR015891
Zhou Z., Mick V. D. W., Jagers B., Coco G. (2016). Modelling the role of self-weight consolidation on the morphodynamics of accretional mudflats. Environ. Model. Softw 76, 167–181. doi: 10.1016/j.envsoft.2015.11.002
Zhu C., Guo L., van Maren D. S., Tian B., Wang X., He Q., et al. (2019). Decadal morphological evolution of the mouth zone of the Yangtze estuary in response to human interventions. Earth Surf Process Landf 44, 2319–2332. doi: 10.1002/esp.4647
Zhu C., Guo L., van Maren D. S., Wang Z. B., He Q. (2021). Exploration of decadal tidal evolution in response to morphological and sedimentary changes in the Yangtze estuary. J. Geophysical Res.: Oceans 126, e2020JC017019. doi: 10.1029/2020JC017019
Zhu L., He Q., Shen J., Wang Y. (2016). The influence of human activities on morphodynamics and alteration of sediment source and sink in the Changjiang estuary. Geomorphol. (Amst) 273, 52–62. doi: 10.1016/j.geomorph.2016.07.025
Keywords: sediment transport, accretion-erosion transition, critical shear stress, tidal cycle, Changjiang Estuary
Citation: Jiang J, Xie W, Zhang N, Xu Y, Zhu C, Lin J, Guo L, Shen J and He Q (2024) Mechanism of rapid accretion-erosion transition in a complex hydrodynamic environment based on refined in-situ data. Front. Mar. Sci. 11:1375085. doi: 10.3389/fmars.2024.1375085
Received: 23 January 2024; Accepted: 22 March 2024;
Published: 08 April 2024.
Edited by:
Yifei Zhao, Nanjing Normal University, ChinaReviewed by:
Bin Deng, Changsha University of Science and Technology, ChinaJunbiao Tu, Tongji University, China
Copyright © 2024 Jiang, Xie, Zhang, Xu, Zhu, Lin, Guo, Shen and He. This is an open-access article distributed under the terms of the Creative Commons Attribution License (CC BY). The use, distribution or reproduction in other forums is permitted, provided the original author(s) and the copyright owner(s) are credited and that the original publication in this journal is cited, in accordance with accepted academic practice. No use, distribution or reproduction is permitted which does not comply with these terms.
*Correspondence: Weiming Xie, wmxie@sklec.ecnu.edu.cn