A low-carbon evaluation framework for regional power systems
 Jichao Ye1
  Huanxin Liao
 Yifan Zhu
- 1State Grid Zhejiang Lishui Electric Power Company, Ltd, Lishui, China
- 2Hangzhou Guodian Power Technology Development Company, Ltd, Hangzhou, China
With the escalating challenges of climate change and the imperative for carbon neutrality, evaluating the carbon footprint of regional power systems becomes crucial. To address this issue, a low-carbon evaluation framework for regional power systems is developed. First, this study identifies the fundamental requirements that the index system for the low-carbon power system should follow and specifies the general direction for the index system’s creation. Second, an evaluation model for carbon reduction ability is proposed by considering generation side, grid side and load side of the power system. Then, a comparative evaluation model for the carbon reduction capability of multi-regional power systems is proposed to spatiotemporally compare the carbon reduction capability of different power systems. Next, a quantification method for the weights of low-carbon evaluation indicators is established based on the power system simulation of multi-scenario scheduling and index sensitivity analysis method. Finally, a low-carbon comprehensive score for regional power systems is created by combining the evaluation results of the system’s carbon reduction capacity with index weights. The practical research results in a region of Zhejiang province in China demonstrate that the proposed model can provide a reasonable and feasible evaluation plan for the low-carbon construction of regional power systems.
1 Introduction
In recent years, the continuously increasing emissions of greenhouse gases have intensified global climate change, attracting widespread attention from countries around the world (Kweku et al., 2018). As a major carbon emitter, China officially proposed in 2020 the strategic goals of “striving to achieve carbon peak by 2030 and carbon neutrality by 2060”, known as the “double carbon” targets. Looking at the composition of China’s carbon emissions, about 50% comes from the electric industry (Liu, 2016). Therefore, control-ling carbon emissions in the electric industry and promoting the low-carbon transformation of energy and electricity are of significant importance and impact for China to achieve the ’dual carbon’ targets at an early date. Against this backdrop, the construction of new power systems is progressing vigorously (Han et al., 2020). However, how to quantitatively evaluate the low-carbon level of power systems, to guide government poli-cy-making and corporate investment decisions, remains to be thoroughly studied.
Clarifying the key low-carbon technologies in the power system is the foundation for evaluating the low-carbon level of the power system. Currently, the power system mainly implements carbon reduction and emission reduction measures in three aspects: generation, grid, and load (Liu, 2016). The generation side is a critical aspect for implementing carbon reduction. The main carbon reduction technologies on the generation side include: 1) Enhancing the grid-connected power generation capabilities of clean and renewable energy sources, such as wind energy, hydrogen energy, solar energy, etc (Shen et al., 2020; Hoang et al., 2021; He et al., 2022). 2) Improving the energy efficiency of thermal power generation (Chen et al., 2020). 3) Devel-oping end-of-pipe “decarbonization technologies”, such as carbon dioxide capture (Gao et al., 2020). 4) Optimizing electricity generation in smart microgrids with renewable sources and emission reduction (Ghiasi et al., 2021). The grid side, referring to the transmission and distribution network, mainly reduces emissions through: 1) Reducing transmission and distribution line losses (Impram et al., 2020). 2) Enhancing the grid’s capacity to accommodate renewable energy sources by increasing energy storage facilities and optimizing grid dispatch (Zhang et al., 2021a; Zhang et al., 2021b). 3) Exploring the evolution of smart grids towards the Internet of Energy (IoE) (Ghiasi et al., 2023). The load side features a variety of emission reduction methods. From the perspective of load side, the main approaches include: 1) Guiding electricity consumers to actively participate in load side response, optimizing consumer electricity usage behaviors (Yang et al., 2022; Ruan et al., 2023). 2) Advancing and popularizing energy-saving technologies to enhance the energy efficiency of electrical appliances (Zhao et al., 2021).
Currently, there is extensive research on the assessment of low-carbon development levels for each aspect of generation, grid, and load. 1) For the generation side, Ref (Wen et al., 2018) proposes a quantitative analysis approach for assessing China’s power sector transition strategy based on a dynamic simulation model, which translates the transition target of non-fossil energy generation in 2030 into a series of plausible pathways. Ref (Pehl et al., 2017) integrates prospective life-cycle assessment with global integrated energy–economy–land-use–climate modelling to explore life-cycle emissions of future low-carbon power supply systems and implications for technology choice. Ref (Oğuz and Şentürk, 2019), based on the concept of life cycle assessment and life cycle cost, studies the carbon emission payback for photovoltaic and wind power generation on Bozcaada Island, All scenarios are compared by considering different impact categories such as global warming potential (GWP), acidification potential (AP), and eutrophication potential (EP), which revealed that Life Cycle Assessment (LCA) and Life Cycle Cost Analysis (LCCA) are useful and practical tools that help to determine drawbacks and benefits of different renewable energy systems considering their long-term environmental and economic impacts. 2) For the grid side, Ref (Clegg and Mancarella, 2019) presents a novel integrated electricity-heat-gas transmission network model, and analyzes the low carbon technology. DC power flow modelling is coupled with steady-state gas network energy and transportation cost optimization to assess gas-electricity price interactions. Ref (Liu et al., 2021) proposes a feasible and comprehensive evaluation index system of operation benefits. an index-based evaluation criterion is established to evaluate the operation benefits on reliability level, intelligence level, power marketization level, economic benefits, environmental benefits, and social benefits. Ref (Wen et al., 2019) mainly discusses the method of calculating the comprehensive benefit considering the load characteristics. Based on the method of involving Analytic Hierarchy Process and Entropy Weight, a new concept called investment entropy is pointed out to measure the relationship between benefit and investment structure. 3) The methods for assessing the low-carbon benefits on the load side mainly revolve around energy efficiency. Typical examples include using energy efficiency indicators, such as Power Usage Effectiveness for data centers (PUE), Cooling Load Factor for air conditioning (CLF), and Renewable Energy Ratio (RER) (Long et al., 2022).
All these methods assess the low-carbon level of individual elements within the ‘generation, grid, and load’ system of the power system, lacking a certain comprehensiveness and making it difficult to jointly use them for a comprehensive evaluation of the low-carbon level of the power system. To conduct a comprehensive assessment of the low-carbon level of the power system, Ref (Chen et al., 2016) introduces a three-stage Data Envelopment Analysis (DEA) model on the basis of eliminating the environmental factors and builds an evaluation system for low-carbon benefits in line with the characteristics of the national smart grids. Ref (Zhou et al., 2012) reveal the possible low-carbon benefits from different sectors. The tested factors include demand-side management, smart grid technologies, low-carbon generation technologies, utilization of low-carbon energy and low-carbon power dispatch. Corresponding evaluation methods are then proposed to analyze the low-carbon benefits from different sources quantitatively. Ref (Li et al., 2023) proposes that the operating costs of the distribution network can be reduced through complementary optimization of source-grid-load-storage (SGLS), which can promote full consumption of the distributed energy resources with high penetration and contribute to the development of low carbon economy. With that, the low carbon efficiency evaluation index system for SGLS is proposed, which con-siders four dimensions including source side, gird side, load side as well as storage side. However, these studies did not fully consider the potential emission reduction benefits of new features of the power system, such as grid energy storage and adjustable load, making it difficult to accurately assess their low-carbon levels. Also, these assessment indicators cannot perform bi-directional temporal and spatial comparative analysis for power grids with different topological structures, lacking flexibility and robustness.
To address these issues, this paper proposes a low-carbon evaluation system suit-able for regional power grids. By comprehensively considering the generation side, grid side, and load side, a dynamic low-carbon evaluation system for quantifying the improvement effects of regional power systems and comparing the construction of multiple regional power systems over time and space, along with its calculation methods, has been established. Additionally, the paper, combining multi-scenario analysis, economy dispatch simulation, and sensitivity analysis, obtains more accurate and comprehensive changes in the carbon emissions of the power system. Using the entropy weight method, the coupling impacts of each segment of the power system are incorporated into the indicator system through the weights of various indicators. An example analysis of a regional power system in Zhejiang, China, verifies the comprehensiveness and feasibility of the proposed indicators.
2 Framework for the low-carbon assessment system of regional power systems
When assessing the low-carbon level of power systems, it is necessary to ensure that the indicator system is comprehensive, accurate, improvable, and comparable.
• Comprehensiveness. The comprehensiveness of the indicator system means that the proposed low-carbon indicator system for power systems should cover the carbon reduction performance assessment of key technologies in all aspects of the power system as much as possible, without omitting important technical details.
• Accuracy. The accuracy of the indicator system refers to the calculation results of the proposed low-carbon indicator system for power systems accurately reflecting the significant role of each key link in the power system in reducing carbon emissions.
• Improvability and Comparability. The improvability and comparability of the indicator system emphasize the role of the proposed low-carbon indicator system in the vertical self-comparison of regional power systems and the horizontal comparison among multiple regional power systems."
Based on the four essential characteristics that the indicator system should possess, the paper proposes a research framework for the low-carbon evaluation system of regional power systems (Figure 1). From the perspective of comprehensiveness, the paper assesses the power system from its basic components, namely, generation, grid, and load - the three key links, and reflects the coupling relationships between these basic components of the power system through multi-scenario analysis, achieving a comprehensive evaluation of the low-carbon effectiveness of both the local and overall power system. From the perspective of accuracy, on one hand, the paper deeply studies the carbon reduction logic of key technologies in each segment, providing calculation methods for each indicator. On the other hand, the evaluation system uses an economy dispatch model to reflect the quantitative impact of indicators, incorporating the weights of each indicator into the calculation, thereby achieving an accurate assessment of the low-carbon effectiveness of each segment of the power system. At the same time, the calculation results of various indicators at different times can serve as a basis for the vertical self-comparison of regional power systems, reflecting the improvability of the indicator system. Lastly, based on the distribution of multi-regional indicators, the evaluation scores for comparing various indicators of the region being assessed are measured, providing a basis for the horizontal comparison of regional power systems, reflecting the comparability of the indicator system.
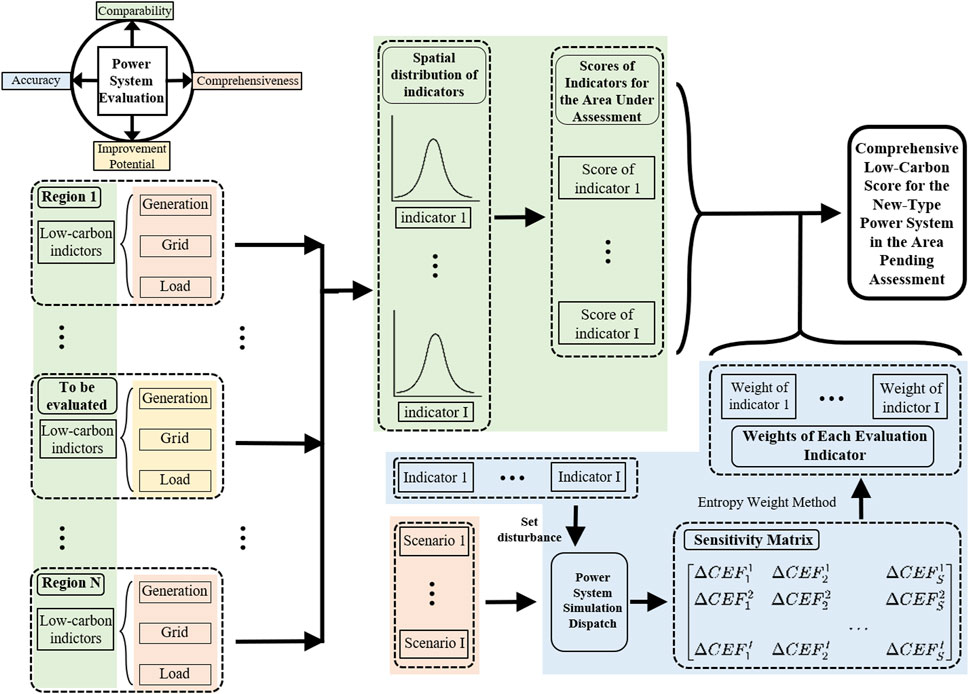
Figure 1. Research framework of the regional new-type power system evaluation index system.
In order to achieve the requirements above, it necessitates the assessment of various resources of the electric power system (including generation side, grid side, and load side). What’s more, it requires considering the electric power system as an integrated whole, taking into account the role of different resources in the operation of the electric power system and evaluating the overall operational outcomes. The research framework is shown in Figure 1, the paper will specifically elaborate on the proposed indicator system and its calculation methods, and how it works in the power system. By combining the individual and the holistic perspectives can an accurate assessment of the various resources of the electric power system be formed.
3 Low-carbon assessment indicator system for regional power systems
3.1 Assessment model for carbon reduction capability on the generation side
This section may be divided by subheadings. It should provide a concise and precise description of the experimental results, their interpretation, as well as the experimental conclusions that can be drawn.
Excluding minor greenhouse gas emissions from electrical equipment such as circuit breakers, the direct carbon emissions of the power system primarily originate from the fuel combustion process on the generation side. Therefore, the low-carbon level of the power system on the generation side is directly linked to the proportion of clean energy generation within that power system. Consequently, we define the ’clean generation contribution degree',
where,
In equations (2) and (3),
3.2 Assessment model for carbon reduction capability on the grid side
On the grid side, reducing carbon emissions involves actively adapting to the generation characteristics of clean energy sources, timely storing clean electricity, shifting electricity demand, and utilizing the flexibility resources of electricity to adjust the power supply-demand curve, thereby maximizing the output of clean energy. Therefore, the carbon reduction capability of the grid side in advanced power systems mainly depends on two aspects. Firstly, it is necessary to measure whether the power system has the appropriate electrical infrastructure for carbon reduction and emission reduction, specifically, whether the power system has sufficient flexibility resources to meet the needs of low-carbon dispatching of the grid. Secondly, the effectiveness of the low-carbon regulation of the power system must be assessed, that is, whether the existing resources of the power system can be reasonably used to adjust the supply-demand relationship, maximizing the grid-connected clean energy. Accordingly, two indicators need to be defined on the grid side to assess the carbon reduction capability from the perspectives of electrical infrastructure configuration and grid regulation effectiveness.
In the dispatching process, the scheduling of flexibility resources is primarily influenced by the power consumption of rigid loads with poor flexibility and high uncertainty, as well as the power output from wind and photovoltaic generation in the power system. Therefore, to measure the sufficiency of flexibility resource allocation in meeting the demands of low-carbon dispatching in the grid, a ‘flexibility resource allocation rate’ is defined. This involves comparing the maximum adjustable capacity of flexibility resources over a period of time with the maximum value of the absolute sum of the power consumption of rigid loads and the power output from wind and photovoltaic generation over the same period. The specific calculation formula is as shown in Equation 4.
where
One of the challenges in achieving low-carbon power systems is the real-time supply-demand balance characteristic of the power system, that is, not only ensuring that the generation side is sufficiently clean but also ensuring that the load side can instantaneously consume the produced clean energy. In the power system, the dispatch center located on the grid side can use flexibility resources to adjust the supply-demand relationship through real-time dispatching, actively adapting to the changes in the clean energy generation curve on the generation side, thereby maximizing the grid-connected clean energy. Accordingly, the clean power supply-demand matching degree
Where
The setting of the reward-penalty function is based on the following principles: When the ratio of clean electricity to regional load demand is less than 1, meaning the supply of clean electricity is insufficient to meet regional load demand, it encourages the generation of more clean power or the reduction of regional load demand. In this case, the closer the ratio is to 1, the higher the score obtained. When the ratio equals 1, meaning the supply of clean electricity perfectly matches the regional load demand, the power system achieves the optimal low-carbon operational effect, and the score obtained is the highest, being 1. When the ratio further increases, meaning the supply of clean electricity exceeds the regional load demand, necessitating the export of clean electricity to other regions, it is beneficial for the clean production of electricity in other regions within a certain range. However, when the ratio reaches a certain multiple (denoted by
3.3 Assessment model for carbon reduction capability on the load side
On the load side, the method to reduce carbon emissions in the power system is similar to that on the grid side, which involves changing the demand curve through the adjustment of elastic loads (such as electric vehicles), actively adapting to the changes in the clean energy generation curve, thus maximizing the grid-connected clean energy volume and achieving the goal of reducing carbon emissions in the power system. Additionally, on the load side, the purchase of green electricity can provide economic incentives for the low-carbon transformation of the power system. Therefore, it is necessary to examine the proportion of green electricity consumption in power consumption to assess the low-carbon level of the load side of the power system. In summary, to measure the carbon reduction capability on the load side, two indicators are proposed: the elastic load allocation rate
In Equation 8,
3.4 Summary for requirements of the low-carbon assessment indicator system
To elucidate the criteria for assessment with precision, we enumerate all the parameters requisite for the model evaluation as depicted in Table 1.

Table 1. Data required for the assessment.
It can be observed that the parameters required for the model include various operational state parameters of the electric power system, primarily operational power generation and energy consumption. These parameters have been extensively documented in the operation of electric power systems and can be adeptly adapted to meet the computational demands of the evaluation model. However, there are still a key point that need to be emphasized.
The point is the normalization of the time interval. It is imperative to underscore that when conducting horizontal comparisons across regions, the uniformity of the time interval length selected for the computation of indicators is essential to ensure the comparability of the evaluation outcomes. This stipulation stems from the fact that the sampling time intervals for different parameters vary. In practical applications, 1 min, 15 min, or 1 h are common sampling frequencies.
3.5 Comparative assessment model for carbon reduction capability in multi-regional advanced power systems
To enable the comparison of carbon reduction capabilities across multiple regional power systems, this paper employs the maximum likelihood estimation method to generate regional data sample distribution functions
Specifically, given the vector of evaluation values for the absolute indicator
After taking the logarithm, the derivative with respect to the parameters to be estimated should be zero (as shown in Equation 12), and solving this gives the relationship between the parameters to be estimated and the sample
Finally, the relative score of the regional indicator for the assessed region is obtained based on the position of the assessed regional indicator
3.6 Comprehensive assessment of regional advanced power systems
After obtaining the low-carbon scores for each indicator of the regional power system, the paper proposes obtaining a comprehensive low-carbon score
In Equation 15,
4 Quantification method for low-carbon assessment indicator weights based on multi-scenario analysis
4.1 Framework for the quantification method of low-carbon assessment indicator weights
Obviously, the low-carbon level of the power system is related to the current state of development in each aspect of generation, grid, and load within the power system, and there exists a certain coupling relationship between these aspects. Thus, it is not feasible to determine the overall low-carbon level of the power system by evaluating a single aspect in isolation. To better reflect the overall low-carbon level of the power system in the indicator system, it is necessary to determine the weights of each indicator, thereby obtaining a comprehensive low-carbon evaluation result for the regional power system. When selecting weights, they should objectively reflect the dynamic impact of variations in each indicator on the overall low-carbon level of the power system. Indicators with more dramatic impacts on the low-carbon level should be assigned greater weights, thereby highlighting the key technologies that the power system should focus on for achieving low-carbon goals and guiding the low-carbon development of the power system.
Considering the comprehensiveness and accuracy of the indicator system, the paper proposes a method for determining indicator weights based on economy dispatch, the entropy weight method, and multi-scenario sensitivity analysis. This method relies on the economy dispatch model to accurately reflect the coupled impact of key technologies in each segment on the carbon reduction effectiveness of the power system. The carbon emission level of the regional power system under simulation dispatch is obtained by calculating the electricity carbon emission factor (as shown in Eq. (16)), where
The weight calculation method is illustrated in Figure 2. Firstly, based on the typical daily data of the power system,
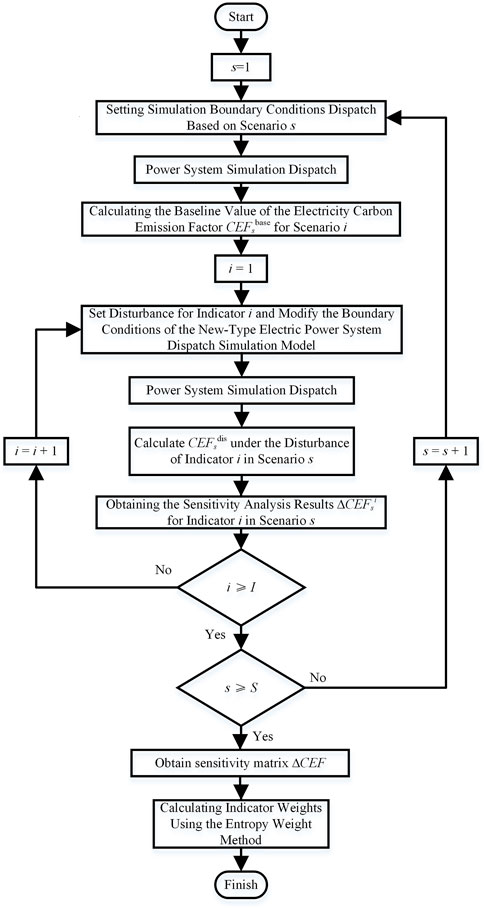
Figure 2. Calculation of weights of the low-carbon evaluation indices.
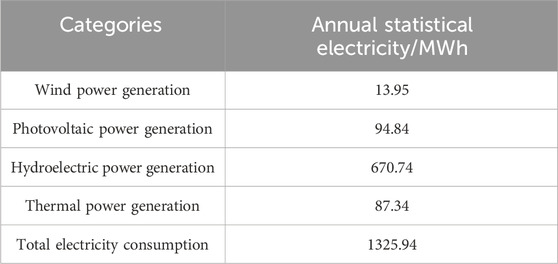
Table 2. Electricity production and consumption of year 2022 of the evaluating region.
4.2 Indicator weight calculation model based on the entropy weight method
The specific steps for using the entropy weight method to analyze the perturbation matrix to obtain the weights of each indicator are as follows:
(1) Normalize the sensitivity matrix
(2) Normalize the standardized sensitivity matrix
(3) Calculate the information entropy
(4) Determine the weights
4.3 Power system dispatch simulation model
To simulate the real operation of the power system, the paper establishes a security-constrained economic dispatch optimization model, which achieves economy dispatch by solving the optimal power flow distribution. The specific modeling is shown in Equations 21–32. The objective function of the optimization model is to minimize dispatch costs, including the generation cost of power units and the call cost of adjustable loads. During operation, it is necessary to ensure real-time balance between power supply and electricity demand (as shown in Equation 22), where the power supply includes the generation power
Specifically, the economy dispatch model also considers the physical constraints of new grid-connected entities such as adjustable loads and new types of energy storage. The adjustment power of the adjustable load must not exceed its maximum adjustable capacity in period
The economy dispatch model established above is actually a mixed-integer linear programming problem, hence it can be solved quickly and accurately using commercial solvers.
5 Case study analysis
5.1 Set up
The paper conducted an empirical study of the proposed assessment system on a regional power system in Zhejiang Province, China. Figure 3 shows the topology of the 220 kV and above power grid in this region. The production and consumption of electricity in the region for the year 2022 are shown in Table 2. It is evident that the proportion of clean energy generation is significant in this area, but the total generation is less than the regional electricity consumption, necessitating reliance on external power supply to achieve a balance of power supply and demand. The installed capacity of various types of power generation within the region is shown in Figure 4. From the perspective of installed capacity, clean energy accounts for 95% of the total installed capacity in the region, indicating a high level of clean power generation; among the clean energy sources, hydropower (including run-of-the-river and pumped-storage power stations) has the largest installed capacity, accounting for 64% of the total capacity in the region and is the main power generation resource in the area.
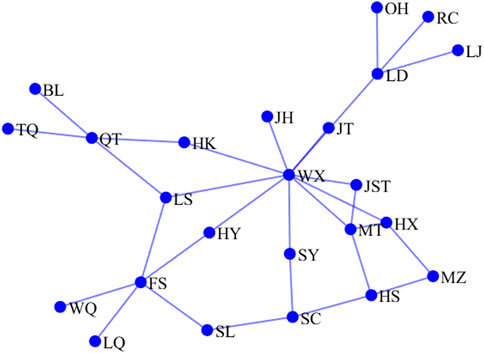
Figure 3. Topology of the evaluating regional power system over 220 kV.
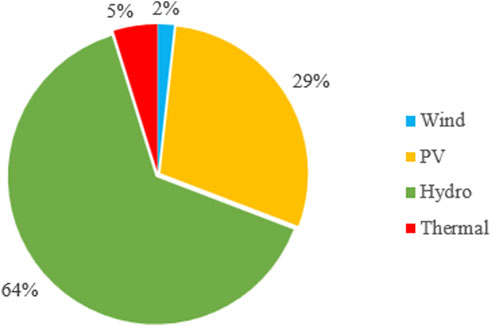
Figure 4. Proportion of all types of power generation in the evaluating region.
The paper selected 96 h (four typical days) of operation states of the power system in this region, divided into four scenarios to form a set of economy dispatch scenarios. The four scenarios are high-demand and low-demand scenarios for both summer and winter, which is commonly used in electrical power system engineering practice. These four scenarios reflect the typical characteristics of the power system operation in the region, fully demonstrating its changing patterns. The frequency of the economy dispatch is 5 minutes per instance, meaning each scenario includes 288 operating points. Figure 5 shows the rigid load curve for one of the scenarios (24 h) as well as the generation curves for wind, solar, and run-of-the-river hydropower resources. In actual operation, the output of wind and solar resources, as well as the run-of-the-river hydropower stations, are treated as negative rigid loads and do not participate in generation dispatch. To achieve regional power supply and demand balance, the regional external interconnection lines are treated as power generation units (hereinafter referred to as external power supply), with the generation capacity of the external power supply being the sum of the upper limits of the transmission line capacities. According to the actual situation of the region, the upper limit of adjustable loads is set at 3% of the real-time rigid load. In calculating dispatch costs, the local types of power units are priced according to grid electricity prices to determine dispatch costs, external power supply is priced according to the average price of medium- and long-term electricity trading in the region, and the dispatch cost for adjustable loads is based on the compensation unit price for adjustable loads in Zhejiang Province.
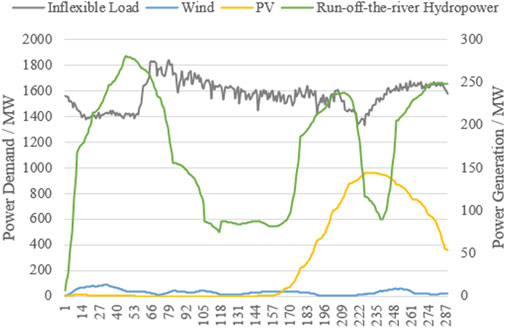
Figure 5. Curves of inelastic load, wind power generation, PV power generation and run-off-river generation of a typical scenario in the evaluating region.
5.2 Low-carbon assessment results of the regional power system
Based on publicly available data, the paper calculated the results of the indicator system for 31 regions in China and the region under assessment. Due to space limitations, the article only shows the fitted distribution parameters obtained from the calculations of various indicators for 32 regions and the scores of each assessment indicator for the region under assessment (Table 3). According to the results, this region scored relatively high in terms of clean generation contribution degree, clean power supply-demand matching degree, and the proportion of green electricity consumption, all exceeding 85. Even the relatively lower score in the proportion of adjustable load reached the national average. The assessment results of various indicators for this region are favorable. Moreover, the results of each indicator can serve as a basis for longitudinal comparison within the region, providing a clear illustration of the dynamic changes in local indicators over time and highlighting the construction status of the regional power system, thus facilitating improvements and enhancements in the low-carbon level of the power system. It should be noted that due to the statistical frequency of the existing data, the paper used annual statistical data for horizontal comparisons. However, provided that the frequency of data from different regions is consistent, readers can use higher-frequency data for more precise horizontal comparisons.
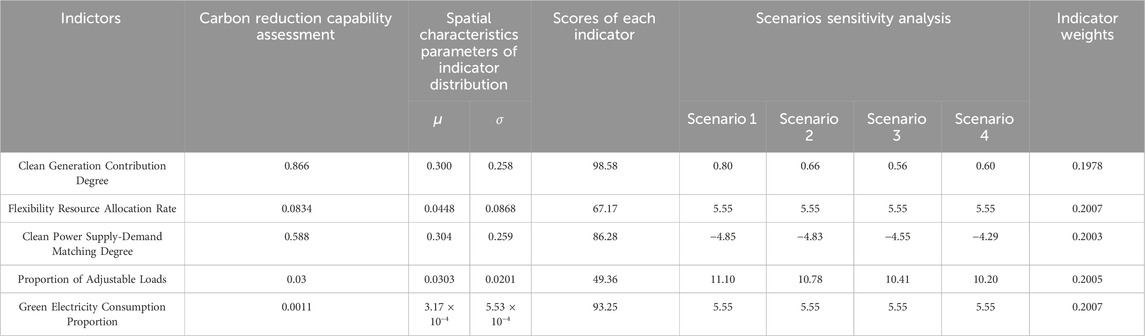
Table 3. Evaluation results of the low-carbon level of the regional power system.
After obtaining the low-carbon scores for each indicator, to perform a comprehensive low-carbon evaluation of the regional power system, it is necessary to calculate the weights of each indicator using the proposed weight calculation method. First, the power system simulation scenario set is run to obtain the baseline carbon emission data for each scenario. Then, the operating boundary conditions of the power system in each scenario are changed according to the perturbation settings for each indicator in Table 4, and the economy dispatch is conducted multiple times, resulting in the electricity carbon emission factor after the perturbation of each indicator in each scenario, thus forming a sensitivity matrix. The sensitivity is set to be 1%. Considering that the operational conditions of the power system are unlikely to undergo significant changes in a short period, it is reasonable to conduct this value. Finally, the entropy weight method is used to calculate the weights of each indicator, with the results shown in Table 3. It can be seen that due to the high degree of cleanliness in the region’s power generation, further increases in the clean generation contribution degree have a smaller impact on the low-carbon level of the power system. For this regional power system, variations in flexibility resources (including grid side and load side flexibility resources) have a greater impact on the low-carbon level of the power system, and the corresponding indicator weights are also larger. This indicates that the indicator weights calculated by the proposed method are consistent with the actual situation.
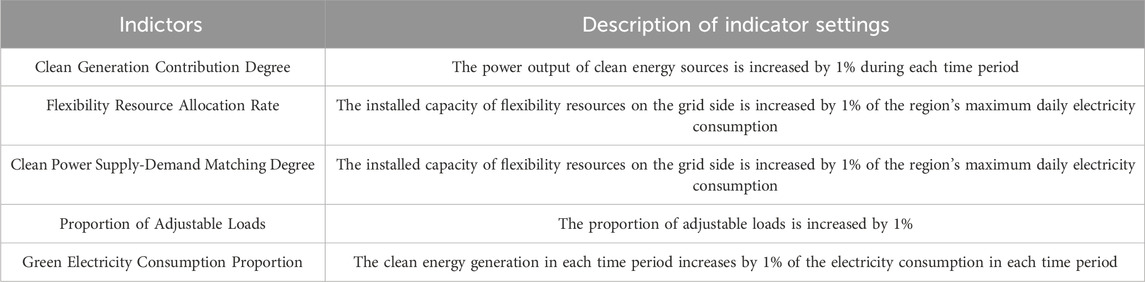
Table 4. Settings of sensitivity analysis of the low-carbon evaluation of the regional power system.
6 Conclusion
To assess the low-carbon effectiveness of complex engineering in regional power systems, this paper designs a comprehensive low-carbon evaluation system for regional power systems, considering comprehensiveness, accuracy, comparability, and improvability. From the perspective of comprehensiveness, the system first establishes assessment models for the carbon reduction capabilities of the generation side, grid side, and load side of regional power systems. By accurately reflecting the carbon reduction capabilities of each segment through the assessment models, it provides a basis for longitudinal self-improvement of the regional power systems, achieving accuracy and improvability of the indicators. Subsequently, considering the comparability between regions, a comparative assessment model for carbon reduction capabilities of multi-regional power systems is proposed, enabling a spatial dynamic comparison of carbon reduction capabilities of regional power systems. Finally, further considering the coupling relationships among various segments of the power system, a quantification method for the weights of low-carbon evaluation indicators is proposed based on economy dispatch under multiple scenarios and sensitivity analysis of indicators. Combining the comparative assessment results of regional power systems’ carbon reduction capabilities and the weights of indicators, a comprehensive low-carbon score for regional power systems is formed, accurately assessing the overall low-carbon level of the target regional power system. Furthermore, this evaluation system plays a crucial role in steering the strategic planning and sustainable development of regional power systems towards a low-carbon future. It not only assesses the current low-carbon level but also identifies areas for potential improvement, thereby guiding policy-making and investment decisions in energy infrastructure.
The empirical study results in a certain region of Zhejiang, China, demonstrate that the low-carbon assessment system proposed in the paper can comprehensively evaluate the carbon reduction capability construction of regional power systems, providing a reasonable and feasible assessment scheme for the low-carbon construction of regional power systems. Beyond the specific indicators designed in the article, more importantly, the paper also provides the design rationale and calculation methods for the regional power system assessment indicator system, offering a research framework for the refinement of low-carbon indicator systems in the future.
Data availability statement
The data analyzed in this study is subject to the following licenses/restrictions: The dataset is not public. Requests to access these datasets should be directed to huanxinliao@link.cuhk.edu.cn.
Author contributions
JY: Conceptualization, Writing–review and editing. HZ: Conceptualization, Writing–review and editing. HH: Conceptualization, Writing–review and editing. XH: Conceptualization, Writing–review and editing. XW: Conceptualization, Writing–review and editing. YQ: Conceptualization, Writing–review and editing. HL: Writing–original draft, Writing–review and editing. YZ: Writing–review and editing.
Funding
The author(s) declare financial support was received for the research, authorship, and/or publication of this article. This work was supported by the State Grid Zhejiang Electric Power Co., LTD. Science and Technology Project (5211LS230001). The authors declare that this study received funding from the State Grid Zhejiang Electric Power Co., LTD. The funder was not involved in the study design, collection, analysis, interpretation of data, the writing of this article, or the decision to submit it for publication.
Conflict of interest
Authors JY, HZ, HH, XH, XW, and YQ were employed by State Grid Zhejiang Lishui Electric Power Company, Ltd.
Authors HL and YZ were employed by Hangzhou Guodian Power Technology Development Company, Ltd.
Publisher’s note
All claims expressed in this article are solely those of the authors and do not necessarily represent those of their affiliated organizations, or those of the publisher, the editors and the reviewers. Any product that may be evaluated in this article, or claim that may be made by its manufacturer, is not guaranteed or endorsed by the publisher.
References
Chen, S., Liu, P., and Li, Z. (2020). Low carbon transition pathway of power sector with high penetration of renewable energy. Renew. Sustain. Energy Rev. 130, 109985. doi:10.1016/j.rser.2020.109985
Chen, Y., Li, S., Lu, S., Yang, L., and Fan, S. (2016). “Evaluation of low-carbon benefits of smart grids based on a three-stage DEA model,” in International Conference on Smart Grid and Clean Energy Technologies, Chengdu, China (ICSGCE), 145–149.
Clegg, S., and Mancarella, P. (2019). Integrated electricity-heat-gas modelling and assessment, with applications to the Great Britain system. Part II: transmission network analysis and low carbon technology and resilience case studies. Energy 184, 191–203. doi:10.1016/j.energy.2018.02.078
Gao, W., Liang, S., Wang, R., Jiang, Q., Zhang, Y., Zheng, Q., et al. (2020). Industrial carbon dioxide capture and utilization: state of the art and future challenges. Chem. Soc. Rev. 49 (23), 8584–8686. doi:10.1039/d0cs00025f
Ghiasi, M., Niknam, T., Dehghani, M., Siano, P., Haes Alhelou, H., and Al-Hinai, A. (2021). Optimal multi-operation energy management in smart microgrids in the presence of RESs based on multi-objective improved DE algorithm: cost-emission based optimization. Appl. Sci. 11 (8), 3661. doi:10.3390/app11083661
Ghiasi, M., Wang, Z., Mehrandezh, M., Jalilian, S., and Ghadimi, N. (2023). Evolution of smart grids towards the Internet of energy: concept and essential components for deep decarbonisation. IET Smart Grid 6 (1), 86–102. doi:10.1049/stg2.12095
Han, X., Qiu, J., Sun, L., Shen, W., Ma, Y., and Yuan, D. (2020). Low-carbon energy policy analysis based on power energy system modeling. Energy Convers. Econ. 1, 34–44. doi:10.1049/enc2.12005
He, B., Zhao, H., Liang, G., Zhao, J., Qiu, J., and Dong, Z. Y. (2022). Ensemble-based Deep Reinforcement Learning for robust cooperative wind farm control. Int. J. Electr. Power & Energy Syst. 143, 108406. doi:10.1016/j.ijepes.2022.108406
Hoang, A. T., Pham, V. V., and Nguyen, X. P. (2021). Integrating renewable sources into energy system for smart city as a sagacious strategy towards clean and sustainable process. J. Clean. Prod. 305, 127161. doi:10.1016/j.jclepro.2021.127161
Impram, S., Nese, S. V., and Oral, B. (2020). Challenges of renewable energy penetration on power system flexibility: a survey. Energy Strategy Rev. 31, 100539. doi:10.1016/j.esr.2020.100539
Kweku, D. W., Bismark, O., Maxwell, A., Desmond, K., Danso, K., Oti-Mensah, E., et al. (2018). Greenhouse effect: greenhouse gases and their impact on global warming. J. Sci. Res. Rep. 17 (6), 1–9. doi:10.9734/jsrr/2017/39630
Li, Y., Zhang, T., Xiang, T., and Wang, T. (2023). “Low carbon efficiency evaluation index system for source-grid-load-storage complementary optimization,” in 5th Asia Energy and Electrical Engineering Symposium (AEEES), Chengdu, China, 1689–1695.
Liu, T., Jin, W., Xiang, Z., and Chen, H. (2021). “Evaluation index system of power grid corporation’s operation benefits based on future low-carbon energy framework,” in 6th Asia Conference on Power and Electrical Engineering, Chongqing, China (ACPEE), 1672–1678.
Long, S., Li, Y., Huang, J., Li, Z., and Li, Y. (2022). A review of energy efficiency evaluation technologies in cloud data centers. Energy Build. 260, 111848. doi:10.1016/j.enbuild.2022.111848
Oğuz, E., and Şentürk, A. E. (2019). Selection of the most sustainable renewable energy system for Bozcaada Island: wind vs. Photovoltaic Sustainability 11 (15), 4098. doi:10.3390/su11154098
Pehl, M., Arvesen, A., Humpenöder, F., Popp, A., Hertwich, E. G., and Luderer, G. (2017). Understanding future emissions from low-carbon power systems by integration of life-cycle assessment and integrated energy modelling. Nat. Energy 2, 939–945. doi:10.1038/s41560-017-0032-9
Ruan, J., Liang, G., Zhao, J., Lei, S., He, B., Qiu, J., et al. (2023). Graph deep learning-based retail dynamic pricing for demand response. IEEE Trans. Smart Grid 14, 4385–4397. doi:10.1109/tsg.2023.3258605
Shen, L., Dou, X., Long, H., Li, C., Zhou, J., and Chen, K. (2020). A cloud-edge cooperative dispatching method for distribution networks considering photovoltaic generation uncertainty. J. Mod. Power Syst. Clean Energy 9 (5), 1111–1120. doi:10.35833/mpce.2019.000582
Wen, M., Tan, Y., Xie, X., Xie, C., Hou, Y., and Liu, J. (2019). “Grid benefit analysis considering the correlation between load characteristics and electricity price,” in IEEE 3rd Conference on Energy Internet and Energy System Integration (EI2), Changsha, China, 2807–2810.
Wen, Y., Cai, B., Xue, Y., Wang, S., Chen, Z., Zhu, J., et al. (2018). Assessment of power system low-carbon transition pathways based on China’s energy revolution strategy. Energy Procedia 152, 1039–1044. doi:10.1016/j.egypro.2018.09.117
Yang, C., He, B., Liao, H., Ruan, J., and Zhao, J. (2022). Price-based low-carbon demand response considering the conduction of carbon emission costs in smart grids. Front. Energy Res. 10, 959786. doi:10.3389/fenrg.2022.959786
Zhang, C., Qiu, J., Yang, Y., and Zhao, J. (2021a). Trading-oriented battery energy storage planning for distribution market. Int. J. Electr. Power & Energy Syst. 129, 106848. doi:10.1016/j.ijepes.2021.106848
Zhang, Z., Din, T., Zhou, Q., Sun, Y., Qu, M., Zeng, Z., et al. (2021b). A review of technologies and applications on versatile energy storage systems. Renew. Sustain. Energy Rev. 148, 111263. doi:10.1016/j.rser.2021.111263
Zhao, H., Zhao, J., Shu, T., and Pan, Z. (2021). Hybrid-model-based deep reinforcement learning for heating, ventilation, and air-conditioning control. Front. Energy Res. 8, 610518. doi:10.3389/fenrg.2020.610518
Keywords: regional power system, low-carbon evaluation, index system, economy dispatch, carbon accounting
Citation: Ye J, Zhang H, Huang H, Hu X, Wu X, Qiu Y, Liao H and Zhu Y (2024) A low-carbon evaluation framework for regional power systems. Front. Energy Res. 12:1366682. doi: 10.3389/fenrg.2024.1366682
Received: 07 January 2024; Accepted: 26 March 2024;
Published: 10 April 2024.
Edited by:
Qinran Hu, Southeast University, ChinaCopyright © 2024 Ye, Zhang, Huang, Hu, Wu, Qiu, Liao and Zhu. This is an open-access article distributed under the terms of the Creative Commons Attribution License (CC BY). The use, distribution or reproduction in other forums is permitted, provided the original author(s) and the copyright owner(s) are credited and that the original publication in this journal is cited, in accordance with accepted academic practice. No use, distribution or reproduction is permitted which does not comply with these terms.
*Correspondence: Huanxin Liao, huanxinliao@link.cuhk.edu.cn