Imbalance of sediment transport in a meso-tidal bay: effect of tidal pumping and residual circulation
 Su In Kim1
  Jun Young Seo1,2
  Jae-Hun Park1
  Pyeong Joong Kim3 In Gwon Kim3
  Kyung Man Kim4
  Ho Kyung Ha1*
- 1Department of Ocean Sciences, Inha University, Incheon, Republic of Korea
- 2Department of Oceanography, Chonnam National University, Gwangju, Republic of Korea
- 3Blue Headquarters, Underwater Survey Technology 21, Incheon, Republic of Korea
- 4Department of Environmental Survey, GeoSystem Research Corporation, Gunpo, Republic of Korea
In-situ mooring systems with acoustic Doppler current profilers were installed in the western (TM01) and eastern (TM02) parts of Yeosu Bay from September 3 to October 2, 2021, to understand the controlling mechanisms of suspended sediment transport. In the bay, freshwater from the Seomjin River freely exchanges with seawater from the open sea. Over the mooring period, current flows were mainly dominated by ebb tides. Power spectral density analysis of the suspended sediment concentration (SSC) exhibited a quarter-diurnal (6.21 h) frequency at TM01 and a semi-diurnal (12.42 h) frequency at TM02. The results suggested that SSC variations in the western part were driven primarily by local sediment resuspension, while they were influenced predominantly by horizontal advection in the eastern part. Differences in SSC variation at the two stations could be due to the physical properties of the bed sediments (TM01: sandy mud containing shell fragments, TM02: mud). Such current flows and SSC variations over the tidal cycles caused an imbalance of sediment transport. At TM01, the sediment fluxes were dominantly seaward due to tidal pumping (88% of the total) and the discharge of suspended sediments in the surface layer by residual circulation. At TM02, landward sediment fluxes were driven primarily by the residual current (73% of the total). Although the suspended sediment fluxes tended to be compensated and balanced mutually by circulation over the entire period, the suspended sediment fluxes at TM02 were approximately twice higher than those at TM01. This was caused by the difference in SSC asymmetry between flood and ebb at the two stations. The mechanisms controlling the transport of suspended sediment could vary spatially, and the relative contribution of tidal pumping and residual circulation could result in an imbalance of sediment transport.
1 Introduction
A bay is the primary connection between ocean and continent and a transition zone where various physical, chemical, and biological processes are complicatedly combined. In this dynamic environment, sediment transport processes play a crucial role in regulating the material fluxes and maintaining the environmental health of coastal regions (Elliott and Whitfield, 2011; Blair and Aller, 2012). Sediment trapping in coastal embayments can cause a significant sedimentation issue in the navigation channel, which requires regular dredging activities to maintain navigability (van Maren et al., 2009; Paranaíba et al., 2023). The cohesive suspended sediments can transport pollutants and nutrients to other locations in water bodies, potentially affecting the water quality and benthic–pelagic ecosystems (Bass et al., 2002; Burton and Johnston, 2010). Sediment transport has focused primarily on the formation and location of the estuarine turbidity maximum, which occurs in areas of relatively high suspended sediment concentrations (SSC) (Schubel, 1968; Geyer et al., 2001; Williams et al., 2015). This phenomenon was explained as the convergence of sediment fluxes derived from river discharge and residual baroclinic circulation (Dyer, 1997). In recent decades, these studies have attracted increasing attention, and several studies have examined the transport mechanisms, such as tidal asymmetry (Guo et al., 2019; McLachlan et al., 2020), estuarine circulation (Burchard et al., 2018; Seo et al., 2023), sediment erodibility (Xu et al., 2016; Huang et al., 2020), and geomorphic conditions (Donker and de Swart, 2013).
Net sediment transport represents the competition between landward transport during flood and seaward transport during ebb. Between flood and ebb, sediment resuspension may exhibit remarkable variations because of the spatial distribution of the bed composition (Li et al., 2022). An imbalance of sediment transport by flood and ebb asymmetries can cause severe sedimentation in a bay. Tidal pumping can be explained through various physical processes, such as the interaction between an oscillatory tide and a mean longitudinal sediment concentration gradient, settling lag, and tidal asymmetry (Scully and Friedrichs, 2007; Cheng and Wilson, 2008; Gong et al., 2023). Li et al. (2018a) investigated the sediment transport and stratification in the Yangtze and revealed one of the main components controlling the vertical-averaged net sediment transport was tidal pumping. Although the tidal pumping flux is attributed to these physical processes, quantifying the contributions of individual mechanisms remains unclear.
In estuarine sediment dynamics, the predominant mechanisms of sediment transport depend on different site-specific configurations (e.g., shape, slope, and bathymetry), making them a challenging research topic (Seo et al., 2022). In particular, understanding and managing environments with high levels of human activities, such as dredging and land reclamation, like Yeosu Bay, requires a comprehensive investigation of sediment transport processes. Previous studies found the relative importance of tidal and advective transport mechanisms, including differences between estuarine channels and shallow subtidal flanks (Scully and Friedrichs, 2007; Sommerfield and Wong, 2011; McSweeney et al., 2016). The effect of residual circulation, which is influenced by the freshwater discharge, on sediment transport of the eastern and western parts of the navigational channel could be different, considering the topographical curvature of Yeosu Bay. This study understands the spatial variability of sediment transport mechanisms in the eastern and western parts of the channel in a meso-tidal bay and explores the knowledge gap by paying particular attention to SSC variations caused by differences in bed sediment.
In this study, in-situ moorings were conducted to identify the controlling mechanisms of suspended sediment transport in the meso-tidal Yeosu Bay. The primary aims are (1) to reveal the main factors for determining SSC variations, and (2) to understand the imbalance of sediment transport caused by tidal pumping and residual circulation.
2 Study area
Yeosu Bay, the south coast of Korea, is a semi-enclosed embayment that includes a narrow waterway between the Yeosu Peninsula and Namhae Island (Figure 1). The Yeosu Channel is 22 km in length and 3.2–9.5 km in width, connecting with the Y-shaped Seomjin River estuary to the north and with Yeosu Bay to the south, allowing free exchange with the open ocean (Hyun et al., 2003; Kim et al., 2014). The mean depth in the Seomjin River mouth is less than 5 m, which increases gradually to approximately 20−40 m at the Noryang and Yeosu Channels (Choo, 2020a). The main channel with east-skewed depths (< 45 m) develops along the N–S direction. Yeosu Bay has a semi-diurnal tidal cycle with a tidal range of 2.9 and 1.1 m in spring and neap tides, respectively. The tidal currents at the bay mouth vary in ranges of 0.50−0.60 m s–1 and 0.50−0.65 m s–1 during flood and ebb, respectively (Kim et al., 1994; Kim et al., 2012). The northward current during the flood is divided into flows passing through the southern and northern channels of Myo Island in Gwangyang Bay and others outflowing into the Noryang Channel (Choo, 2020a). During the ebb, the current flow generally exhibits opposite patterns. The Seomjin River is an open estuary system with a mean discharge of 120 m3 s–1 (Kang et al., 2020). During the summer, the freshwater discharge of 300–400 m3 s–1 flows out of Yeosu Bay through the channel (Kim et al., 2014).
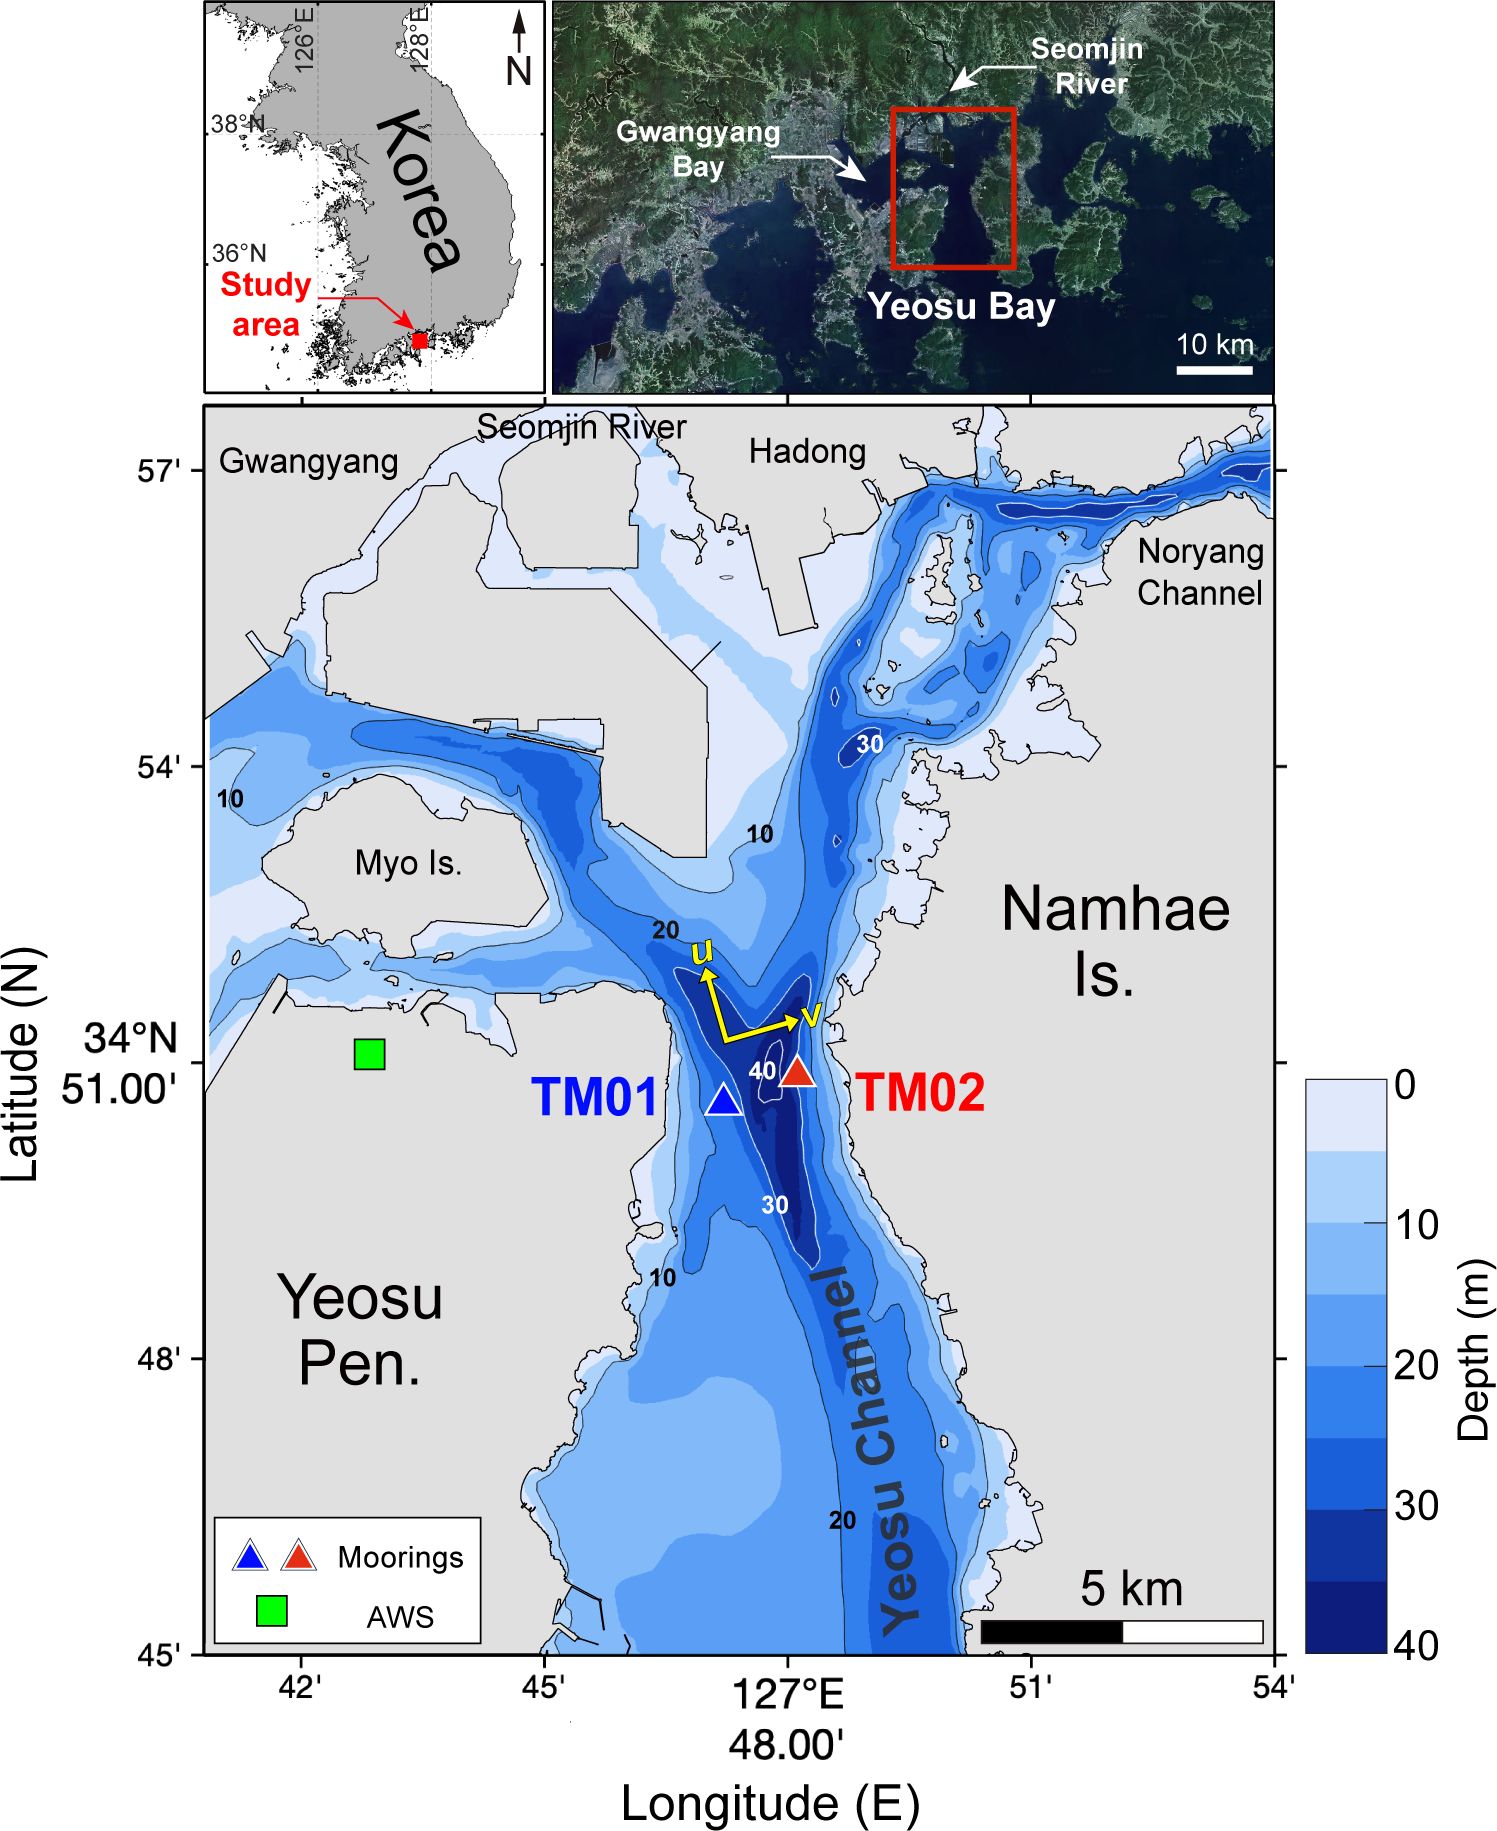
Figure 1 Map of the study area in Yeosu Bay. Two acoustic Doppler current profilers (ADCPs) were deployed at TM01 (blue triangle: 34°50’34.6”N, 127°47’12.6”E) and TM02 (red triangle: 34°50’52.1”N, 127°48’06.4”E). The green square indicates the automatic weather station (AWS) in Yeosu-sandan (34°50’50.1”N, 127°42’53.9”E). u and v are the transformed coordinates along- and across-channel velocity, respectively. TM01 and TM02 were rotated by –17° concerning the north. The depth data were downloaded from https://www.khoa.go.kr, and satellite images were downloaded from https://map.kakao.com.
Yeosu Channel is a main passage connecting Gwangyang Bay to the open sea, and significant changes in SSC would occur due to hydrodynamic forcings and human activities. This area has experienced rapid sedimentary changes due to activities such as sand mining, navigation channel dredging, and increased shipping traffic (Kim and Lee, 2004). Gwangyang Bay has undergone development and facility expansion, including the establishment of a chemical complex, steelworks, and dredged dumping sites (Choo, 2020b; Lee et al., 2021). Additionally, the sewage originating from various industrial facilities poses a threat to the marine ecosystem (Lee et al., 2021). Fine-grained sediments during flood are carried into Yeosu Channel and settle in the southwestern part of Gwangyang Bay, where the current speed is weak (Kim et al., 1994). The sedimentation rate of 0.8×10⁶ tons yr–1 in the channel raises concerns (Kim and Kang, 1991), carrying out dredging activities to address these issues. Recognizing the environmental challenges, the Ministry of Oceans and Fisheries designated this area as a special management sea area in 2000 (Lee et al., 2021).
3 Materials and methods
3.1 Mooring and data collection
Two mooring stations (TM01: 34°50’34.6”N, 127°47’12.6”E, TM02: 34°50’52.1”N, 127°48’06.4”E) were installed in the western and eastern parts of Yeosu Channel, respectively (Figure 1). Up-looking acoustic Doppler current profilers (ADCPs) (RDI Workhorse Sentinel 600 kHz) mounted in a trawl-resistant bottom mount were installed at depths of 24 m (TM01) and 27 m (TM02), respectively (Table 1). The ADCPs measured the profiles of three-dimensional current velocities, water level, and echo intensity from September 3 to October 2, 2021. The transducers were positioned at 0.5 m above the bed (mab), and the vertical bin sizes were set to 0.5 m. In post-processing, the current velocity coordinates were rotated –17° at TM01 and TM02 to obtain the along- and across-channel components (for the transformed coordinates, see u and v in Figure 1). The wind and precipitation data were obtained from an automatic weather station (AWS) in Yeosu-sandan (34°50’50.1”N, 127°42’53.9”E), maintained by the Korea Meteorological Administration.
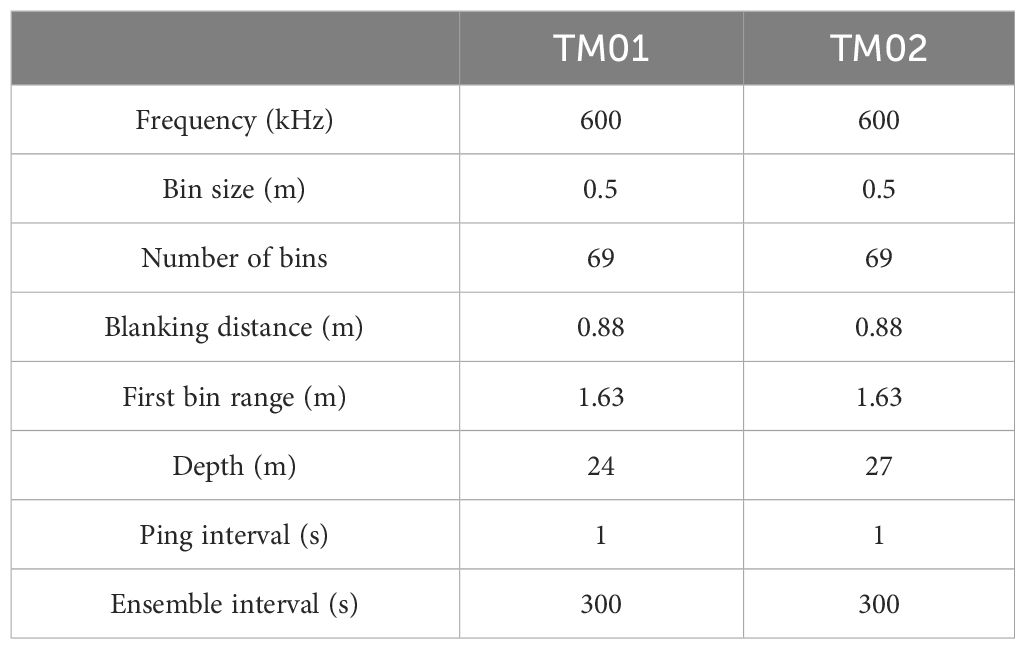
Table 1 ADCP settings for TM01 and TM02 stations, respectively.
On September 7, 2021, the casting of CTD (SBE-19plus V2, SeaBird) attached to an optical backscatter sensor (OBS, Campbell) was performed to measure the temperature, salinity, density, and turbidity profiles at TM01 and TM02. It was conducted seven times at each mooring station according to the tidal cycle. In-situ water samples obtained by a Niskin sampler were used to convert the SSC (mg l–1) from the echo intensities (E, counts) and turbidity (NTU) derived from the ADCPs and OBS, respectively. After recording the initial weight of a glass fiber filter (GF/F, Whatman) (pore size: 0.7 μm), the water samples were vacuum filtered. The remaining sediments on the filter were dried in an oven at 105°C for 24 h (Shahzad et al., 2018). The mass of sediments on the filter was determined by calculating the difference in weight before and after filtration and dividing it by the volume of filtered water. The OBS calibration showed a good linear correlation between the NTU and SSC (R2 = 0.92). The E recorded from the ADCPs was calibrated with the SSC using the sonar equation (Deines, 1999; Kim et al., 2004; Ha et al., 2011). The signal calibration coefficients Kc and C were determined from linear regression between the net volume scattering intensity (Sv, dB) and the echo intensity. The Kc of TM01 and TM02 were 0.32 and 0.36, respectively, and the corresponding C values were –31.90 and –32.83 (R2 = 0.96 for both stations) (Figures 2A, B).
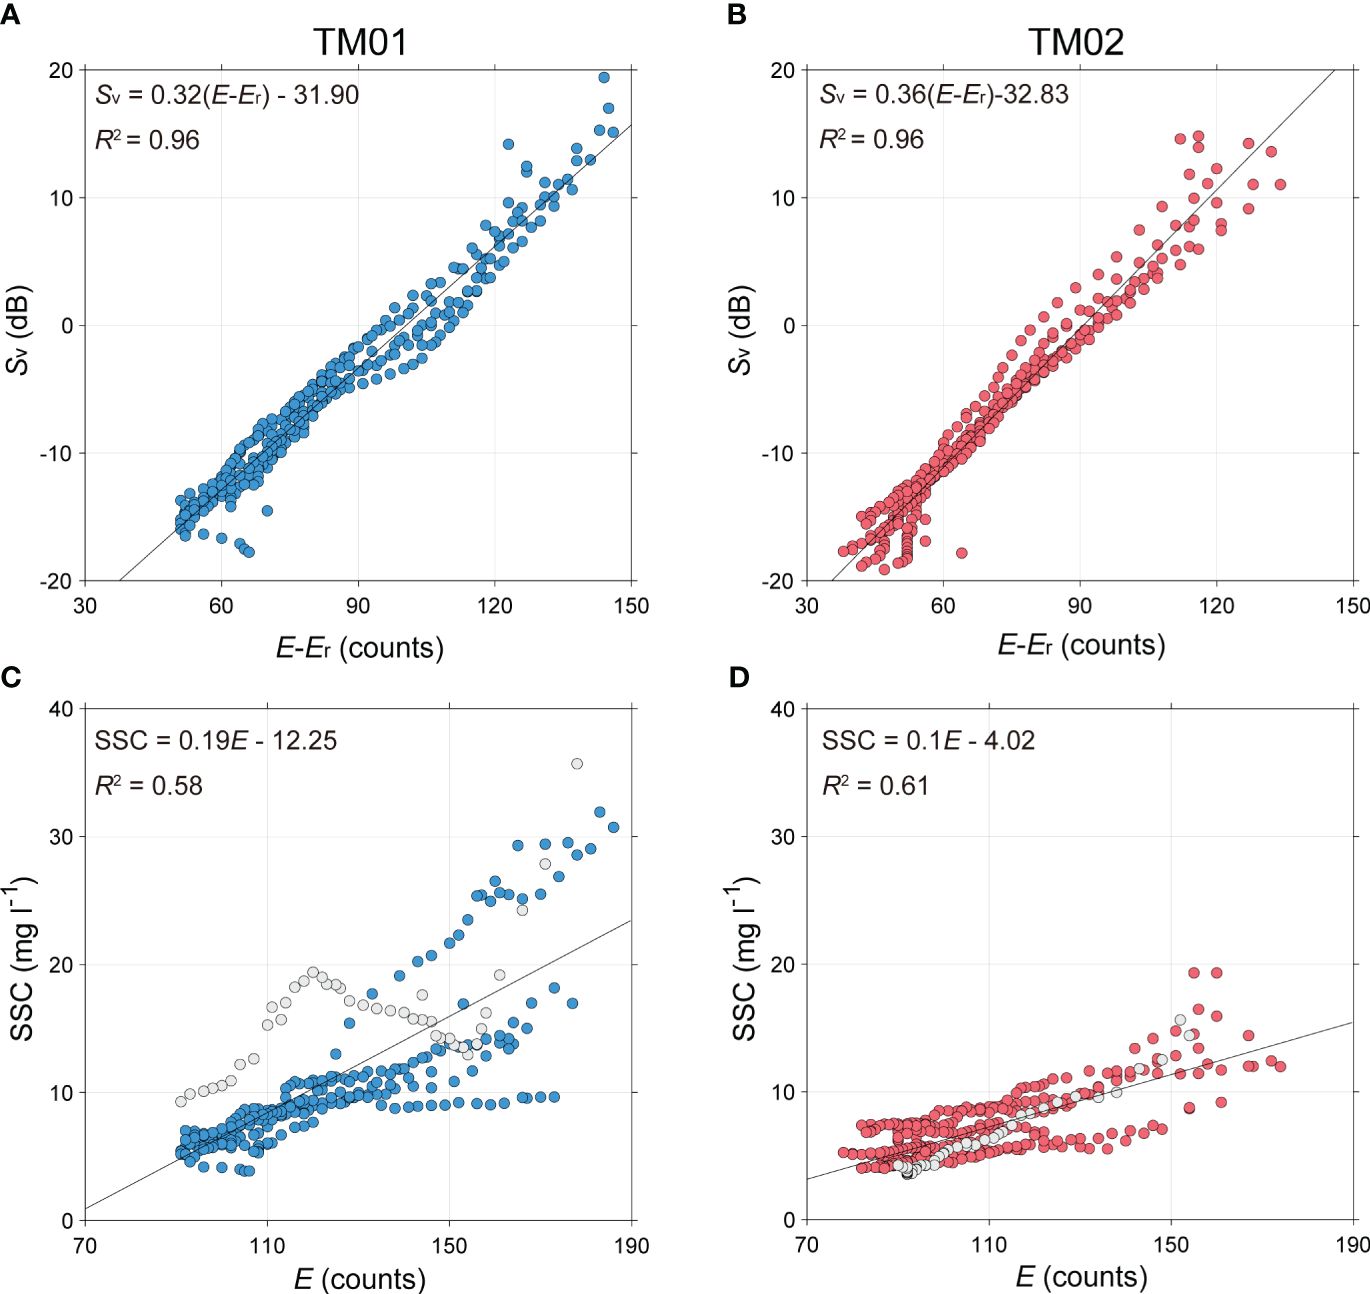
Figure 2 (A, B) Calibration curves for net volume scattering intensity (Sv) and the echo intensity (E–Er); (C, D) Calibration curves for SSC and echo intensity (E). Gray circles indicate the data measured during the accelerating ebb.
The bed sediments were collected using gravity cores to determine the size distributions of the sediments at TM01 and TM02. The grain size parameters of the bed sediments were measured using a laser diffraction particle size analyzer (Mastersizer 3000, Malvern Panalytical), measuring particles in the range of 10 nm to 3,500 μm. The fraction of sand, silt, and clay-sized particles were 14.2%, 71.6%, and 14.2% at TM01 (sandy mud), respectively, and 6.4%, 81.4%, and 12.2% at TM02 (mud), respectively (Figure 3). Two stations were composed of mainly silt-sized particles, and their median grain sizes (d50) were similar at 11.6 μm and 11.5 μm, respectively. On the other hand, TM01 and TM02 exhibited notable differences in d90. TM01 showed a bimodal distribution with d90 of 98.8 μm, whereas TM02 showed a unimodal distribution with d90 of 48.5 μm. The carbonate content at TM01 was 25.6% due to the abundance of rough-shell fragments in the sediment, whereas it was 3.4% at TM02.
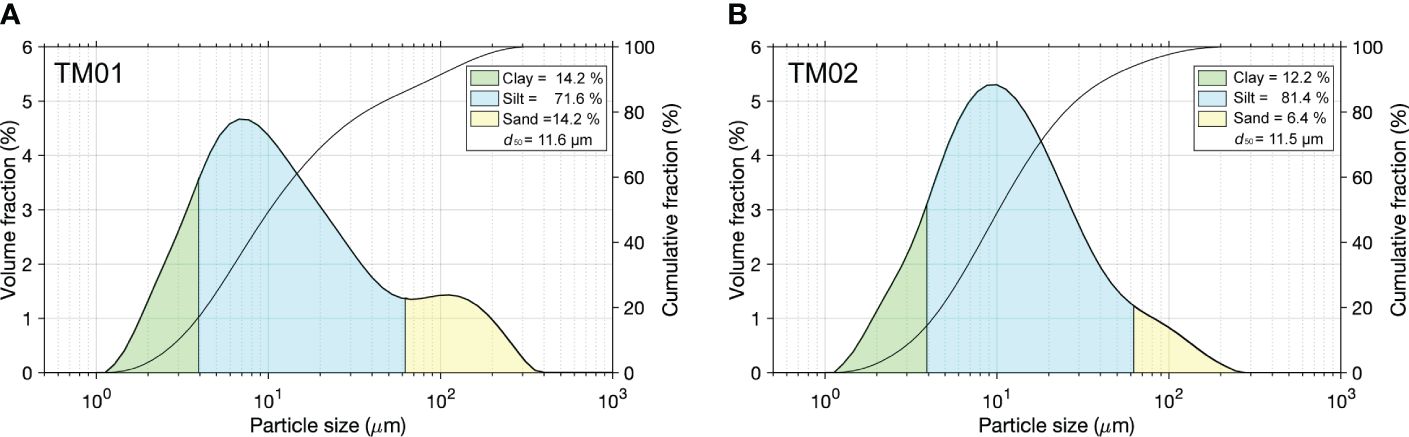
Figure 3 Particle size distribution of the bed sediment sampled near stations (A) TM01 and (B) TM02.
The change in the ratio of turbidity to SSC is caused by variabilities in inherent particle properties (e.g., shape, size, density, and adsorption) (Fettweis et al., 2019). During the accelerating ebb, TM01 showed a lower correlation between SSC and echo intensity than TM02 (Figures 2C, D). The SSC estimation from ADCPs could involve challenges such as sensor errors, environmental-related factors (e.g., biofouling, air/gas bubbles, density stratification), and sample-related uncertainties (for details, see Fettweis et al. (2019)). Consequently, these causes could potentially impact the converted SSC results.
3.2 Data analysis methods
3.2.1 Sediment flux decomposition and velocity skewness
Instantaneous sediment flux (F, kg m−2 s−1) at the mooring stations was calculated as follows (Equation 1):
where u is the along-channel velocity, and z is the vertical coordinate for each bin measured by ADCP. To understand the sediment flux mechanism, F was decomposed to u = ū +u' and , after applying 36-h low- and high-pass filters, respectively. The overbar and prime components occur on timescales longer and shorter than tidal cycles, respectively. The residual and tidal mechanisms of sediment flux were discriminated by decomposing the tidal-averaged F as follows (Equation 2):
where is the advective flux (also known as mean-flow flux) driven by the residual flow and tidal-averaged SSC (Scully and Friedrichs, 2007; Sommerfield and Wong, 2011; Schulz et al., 2018). is the tidal pumping flux (also known as the correlation flux) driven by a tidal pumping effect associated with tidal fluctuations and asymmetry (Sommerfield and Wong, 2011; Schulz et al., 2018). The advective flux consists of several processes, such as river runoff, gravitational circulation, tidal straining, Stokes drift, and wind, whereas the tidal pumping flux comprises tidal pumping and tidal deformation processes (Schulz et al., 2018; Figueroa et al., 2020; Seo et al., 2022). The along-channel sediment flux was calculated from the depth-integrated as follows (Equations 3, 4):
where qs_total is the depth-integrated sediment flux (kg m–1 s–1), indicating total sediment transport. Depth-integrated Fmean and Fcorr are referred to qs_mean and qs_corr, respectively. The cumulative sediment flux, denoted as Qs_total (kg m–1), provides the total sediment flux from the first observation until time t. Cumulative qs_mean and qs_corr are referred to as Qs_mean and Qs_corr, respectively.
The tidal asymmetry was calculated using the normalized sample skewness proposed by Nidzieko and Ralston (2012). The velocity skewness (), which describes the uneven distribution of current flow between the rising and falling periods, was computed as follows (Equation 5):
where μ3, σ, ub, and N are the third moment of the mean, standard deviation, near-bed velocity, and total number of near-bed velocity samples, respectively (Nidzieko, 2010; Nidzieko and Ralston, 2012). In this study, a running discrete lunar-day window of approximately 24.84 h, equivalent to approximately 300 samples, was used to perform low-pass filtering on the time series of the tidal asymmetry index (Seo et al., 2022; Yang et al., 2022). Water elevation variations during the rising and falling periods cause velocity distortions. The shorter rising periods require faster flood currents for > 0 (i.e., flood dominance), while the shorter falling periods generate faster ebb currents for < 0 (i.e., ebb dominance).
The current velocity can be decomposed into timescales longer (ū) and shorter (u') than the tidal cycle. The impact of tidal currents (u'b) on the near-bed velocity (ub) was estimated by substituting ub in Equation 5 with u'b applied with high-pass filters in the in Equation 6.
3.2.2 Estimation of current-induced bed shear stress
The shape of the velocity profile in the bottom boundary layer is often indicated by a logarithmic profile of the form (Gu et al., 2022). The logarithmic profile (LP) method was used to estimate the current-induced bed shear stress (τc, Pa) based on the logarithmic distribution concept of the burst-mean horizontal velocities () at a specified height z. The u and v components were defined to align with and be perpendicular to the mean flow direction of each burst (Bian et al., 2018). Uc(z) is defined as Equation 7:
where U*c, κ, and z0 are the friction velocity (m s–1), von Kármán dimensionless constant (ca. 0.41), and zero velocity roughness height, respectively (Kim et al., 2000; Zhu et al., 2016). U*c and z0 are calculated as gradient A and intercept B by regressing Uc(z) against ln(z) using the least-squares method as follows (Equations 8, 9):
Using the friction velocity U*c, the τc was determined as Equation 10:
where ρw, , and CD(z') are the water density (1,020 kg m−3), current speed within the bottom boundary layer (at 2.1 mab), and drag coefficient at a height of z', respectively.
4 Results
4.1 Meteorological and hydrodynamic forcings
The meteorological forcings, such as wind and precipitation, fluctuated frequently over the entire observation period (Figure 4). Northerly (down-estuary) winds with 0.7−9.2 m s−1 prevailed, except for intermittent southerly (up-estuary) winds with 0.8−7.2 m s−1 (Figure 4A). The occurrence of down-estuary winds was five times higher than the up-estuary winds. Precipitation occurred for 12 days in total (cumulative precipitation: 119 mm), most (77%) of which was concentrated in neap tides (Figure 4B). As shown in Figure 4C, on the other hand, the temperature profiles at TM01 and TM02 tended to decrease from the surface to the bottom in the range of 23.8–24.5°C. The salinity increased with depth in the range of 28.9–30.7 psu at both stations, and TM01 had approximately 0.3 psu lower salinity than TM02 (Figure 4D). The density at TM01 was 0.2 kg m−3 lower than that at TM02 (Figure 4E). In addition, the difference in density between the surface and the bottom at TM01 and TM02 reached up to 0.7 kg m−3 and 0.5 kg m−3, respectively. These vertical structures suggest that freshwater outflow and seawater inflow occurred predominantly in the surface and bottom layers, respectively.
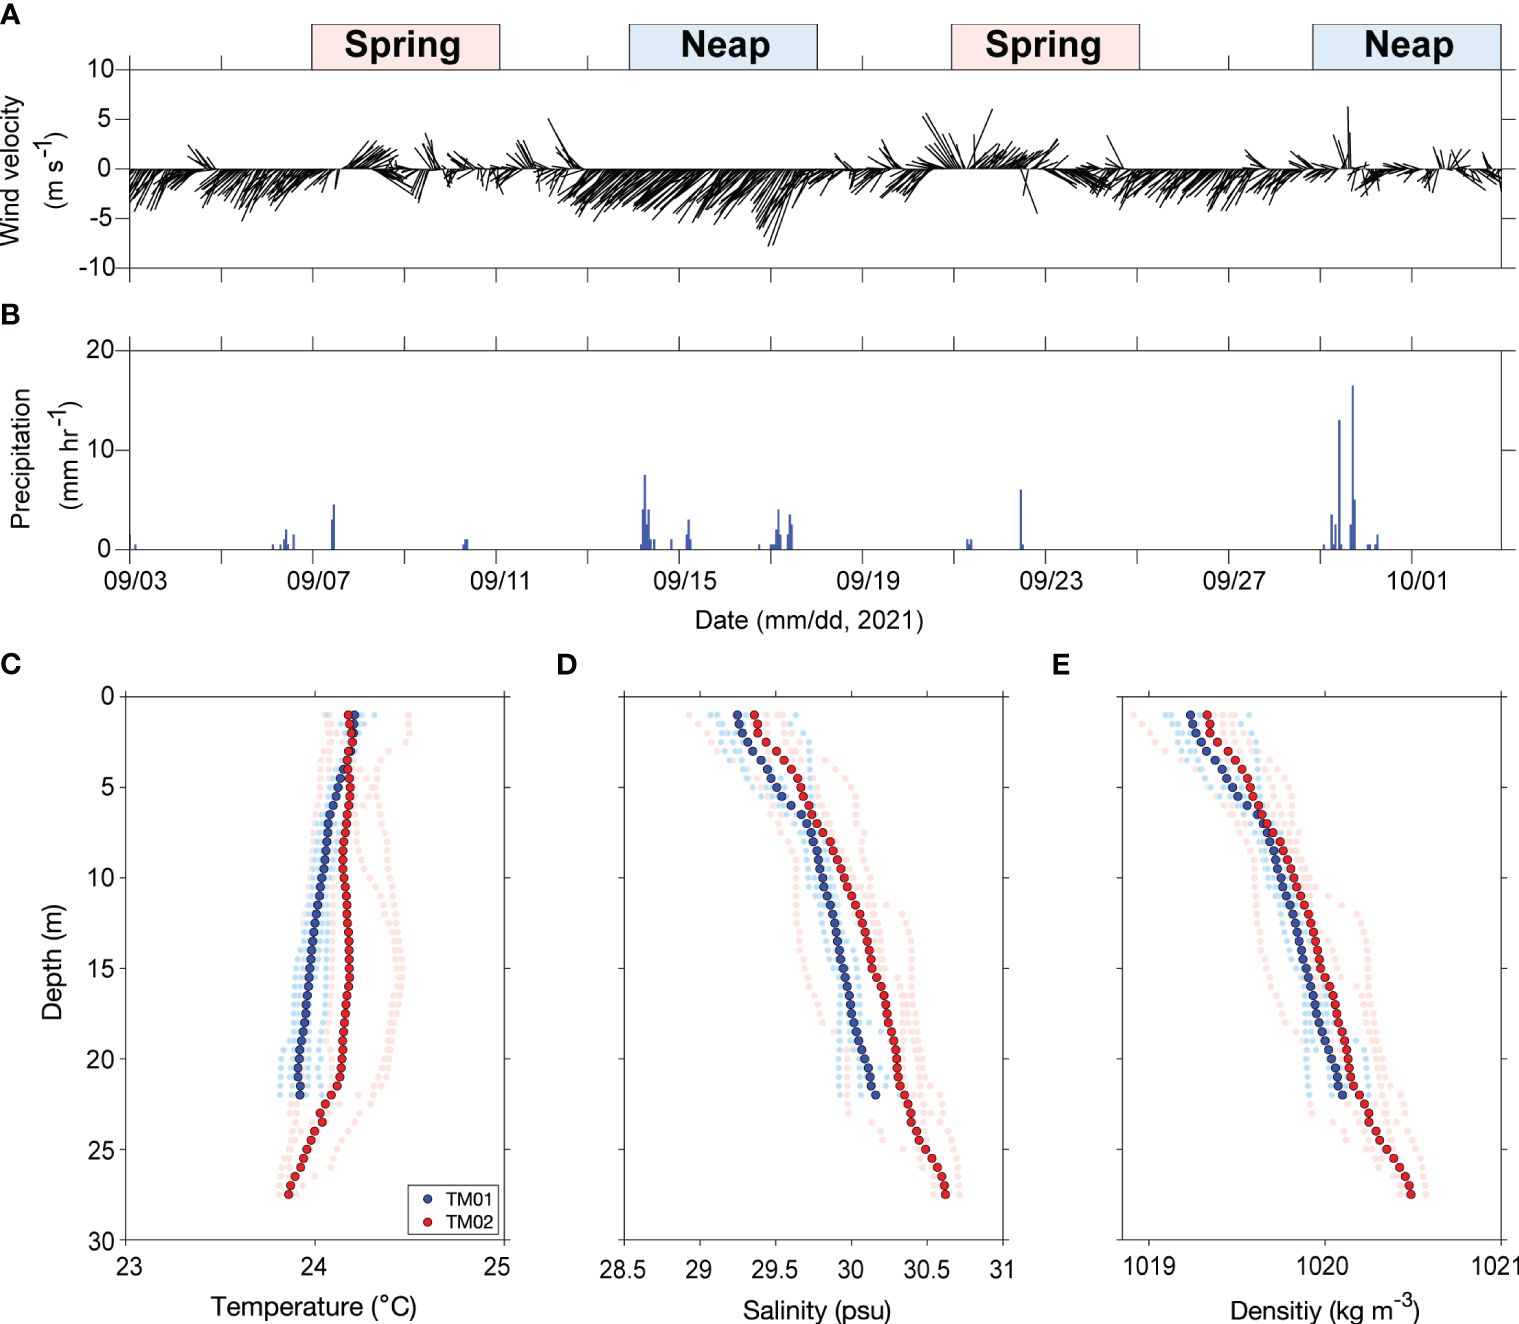
Figure 4 Time series from the AWS: (A) wind velocity and (B) precipitation. Vertical profiles provided from CTD: (C) temperature, (D) salinity, and (E) density. The average vertical profiles of all casting data at each mooring station are represented by the blue (TM01) and red (TM02) circles. The distribution of each vertical profile is indicated by the light blue and light red dots.
The variations in water level at TM01 and TM02 presented the mixed semi-diurnal tides (Figures 5A, E). In particular, the diurnal inequalities of the water levels were evident in spring (2.5–3.5 m) and neap (0.4–1.3 m) tides. The vertical structure of u exhibited a two-layer baroclinic flow, with slight inhibition during spring tides when the current was strong (Supplementary Figure S1). Under the variations in tidal range, the u at TM01 and TM02 were modulated in the range of –1.10–0.80 m s–1 and –0.85–0.85 m s–1, respectively. The v at both stations varied in the range of –0.38–0.54 m s–1 (Figures 5B, F), which were approximately half of u. The current velocities during spring tides were higher than those during neap tides. Moreover, u at two stations had two different patterns of current flows. During the observation periods, fluctuated from –0.59–0 at TM01 and from –0.50–0.15 at TM02 (Figure 6). Except for specific periods (e.g., September 4–6 and 28, 2021), both stations showed an ebb predominance ( < 0). exhibited similar skewness as for each station (TM01: –0.48–0.02, TM02: –0.42–0.14), meaning that the total current field was led mainly by the tidal current. The u' was predominant in the range of –0.83–0.86 m s–1 in spring tides, showing either up- or down-estuary flow depending on the tidal phase (Figures 5C, G). As the tidal currents weaken in neap tides, u' was only in the range of –0.38–0.29 m s–1. On the other hand, the ū at TM01 and TM02 for most periods showed that the current near the water surface flowed seaward and the current near the bed flowed landward (Figures 5D, H). The zero-crossing depths of ū varied frequently depending on the relative importance of tide, wind, and freshwater discharge. Those depths at TM01 were approximately 12 mab on average, generally lower than those at TM02 (> 18 mab). This suggests that TM01 could be more significantly influenced by freshwater outflow compared to TM02 (Figures 4, 5). When the down-estuary winds blew at wind speeds of > 5 m s–1, the ū of TM01 and TM02 were strengthened to a maximum of –2.36 m s–1 and –0.15 m s–1 in the surface layer, respectively. Despite the dominant effect of down-estuary winds, the zero-crossing depths of TM02 increased in spring tides and transited to a single-layer structure.
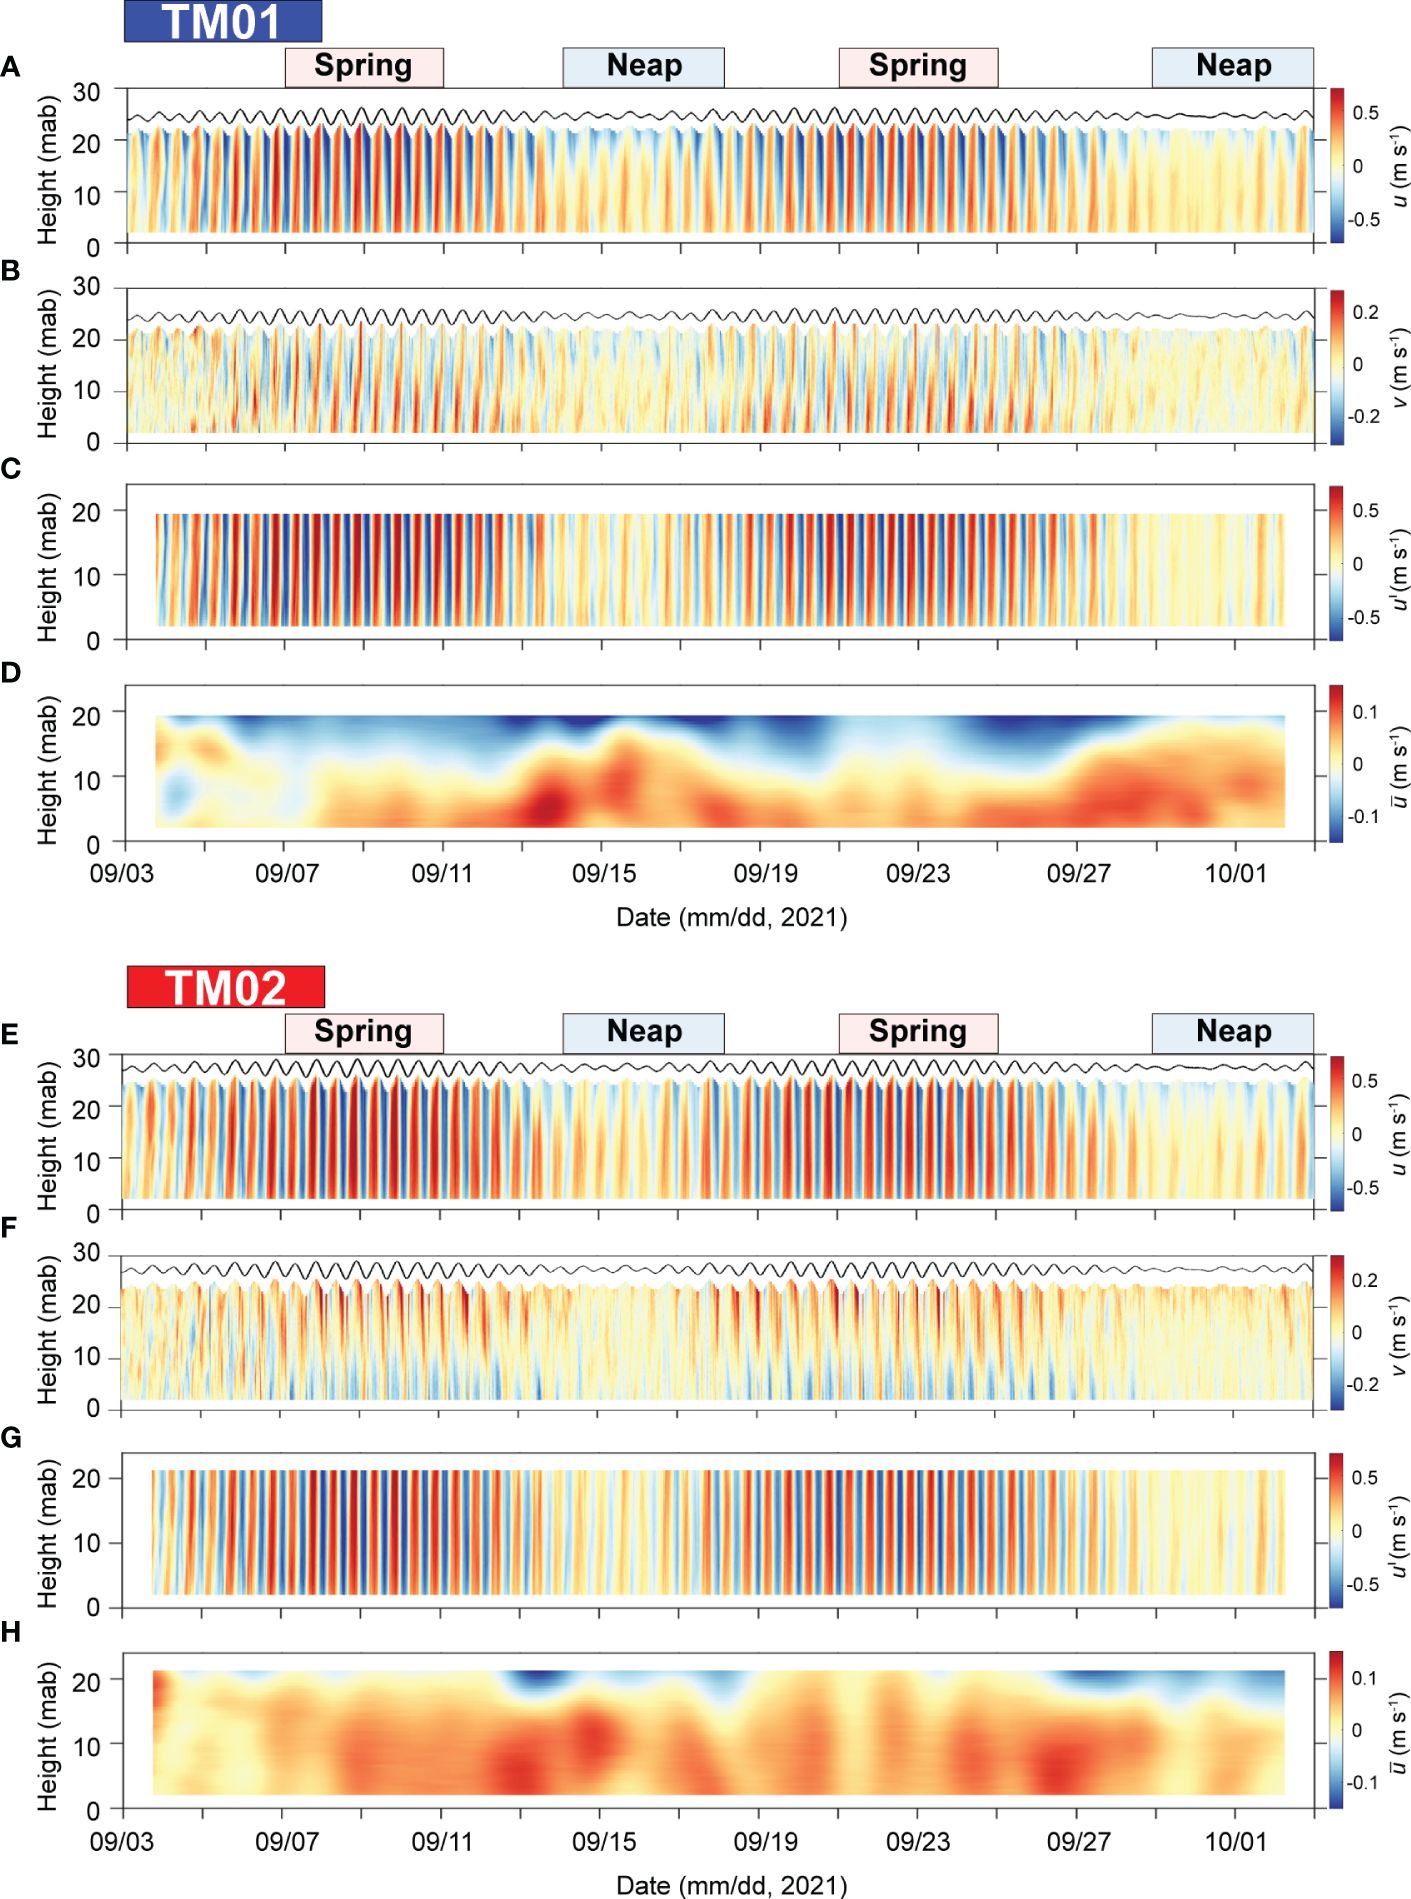
Figure 5 Time series of (A, E) along-channel current velocity (u), (B, F) across-channel velocity (v), (C, G) tidal current velocity (u′), and (D, H) residual current velocity () at TM01 and TM02 stations, respectively.
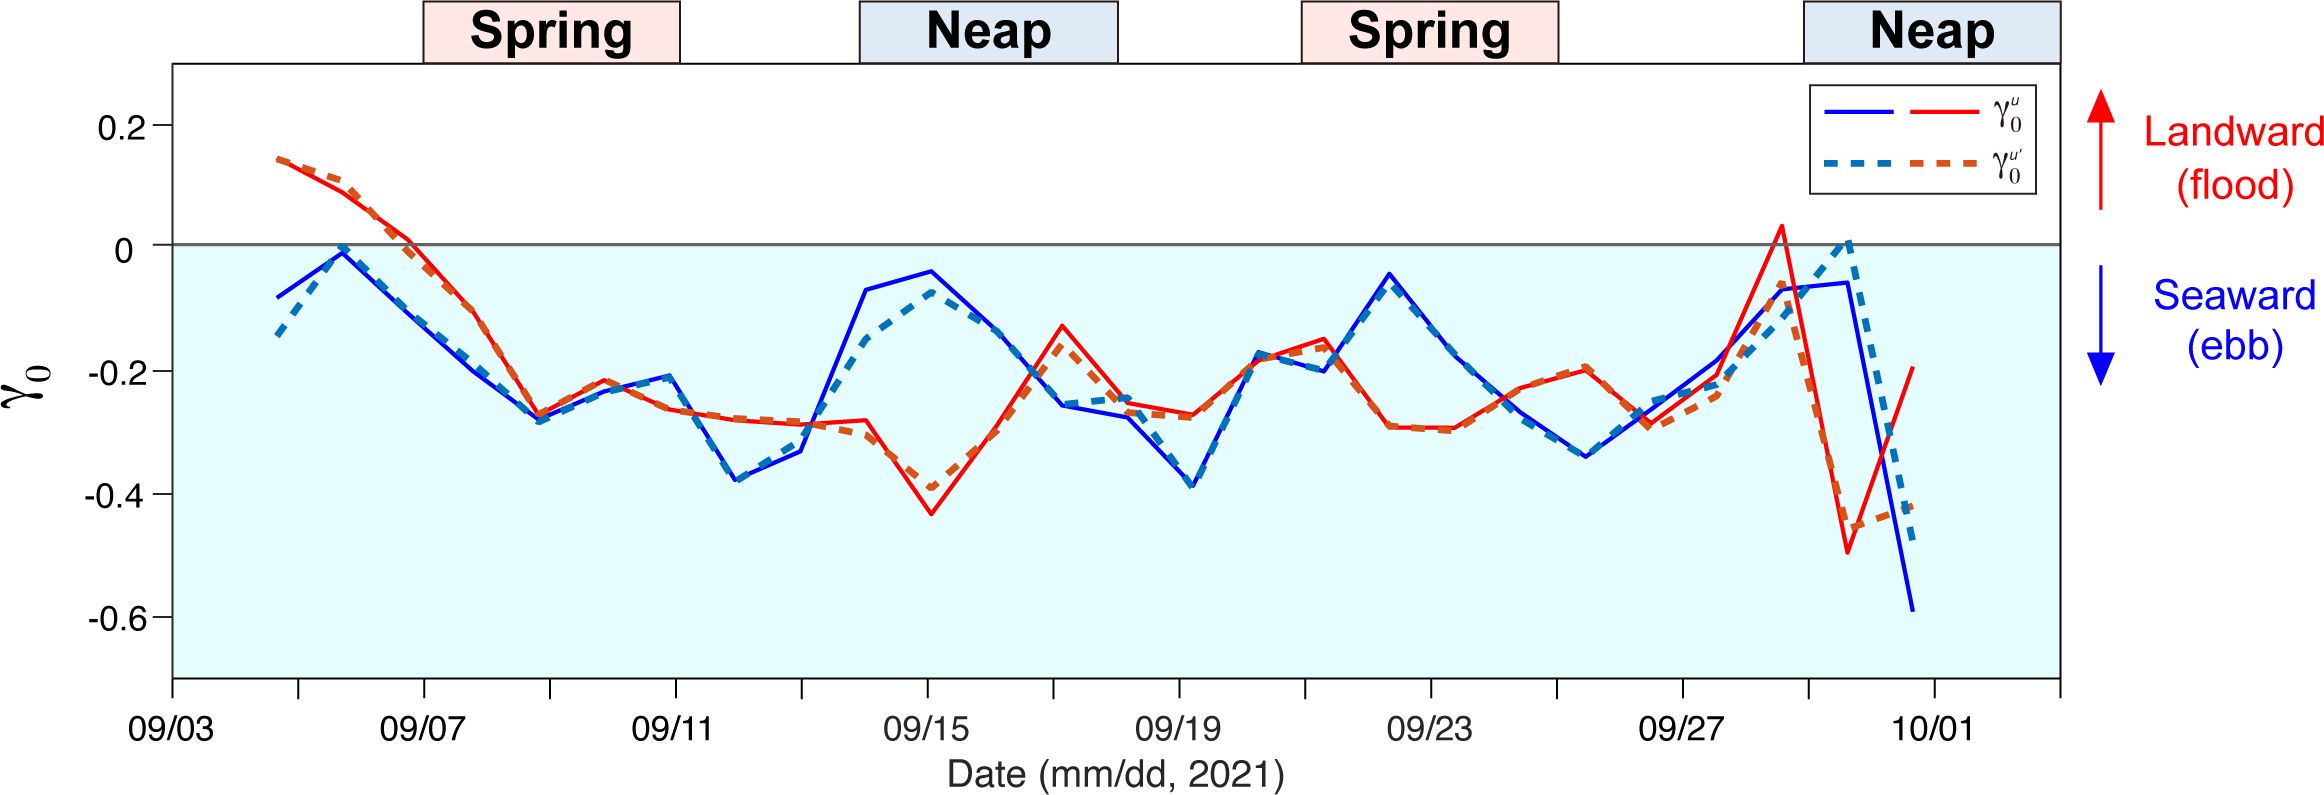
Figure 6 Variability in near-bed velocity skewness (γ0u, solid line) and tidal current velocity skewness (γ0u′, dashed line). The solid blue line and sky-blue dashed line represent TM01. The solid red solid line and orange dashed line represent TM02, respectively. Positive values indicate flood-dominant flows, and negative values indicate ebb-dominant flows.
4.2 SSC variations
The SSC tended to decrease from the bed to the water surface at both stations and fluctuated by the tidal cycle (Figures 7A, E). The resuspension events intensively occurred in spring tides, whereas they rarely occurred during neap tides. In general, the SSC at TM01 (< 204 mg l–1) was higher than that at TM02 (< 157 mg l–1). During ebb, in particular, the bed sediments at TM01 were resuspended to reach the near water surface.
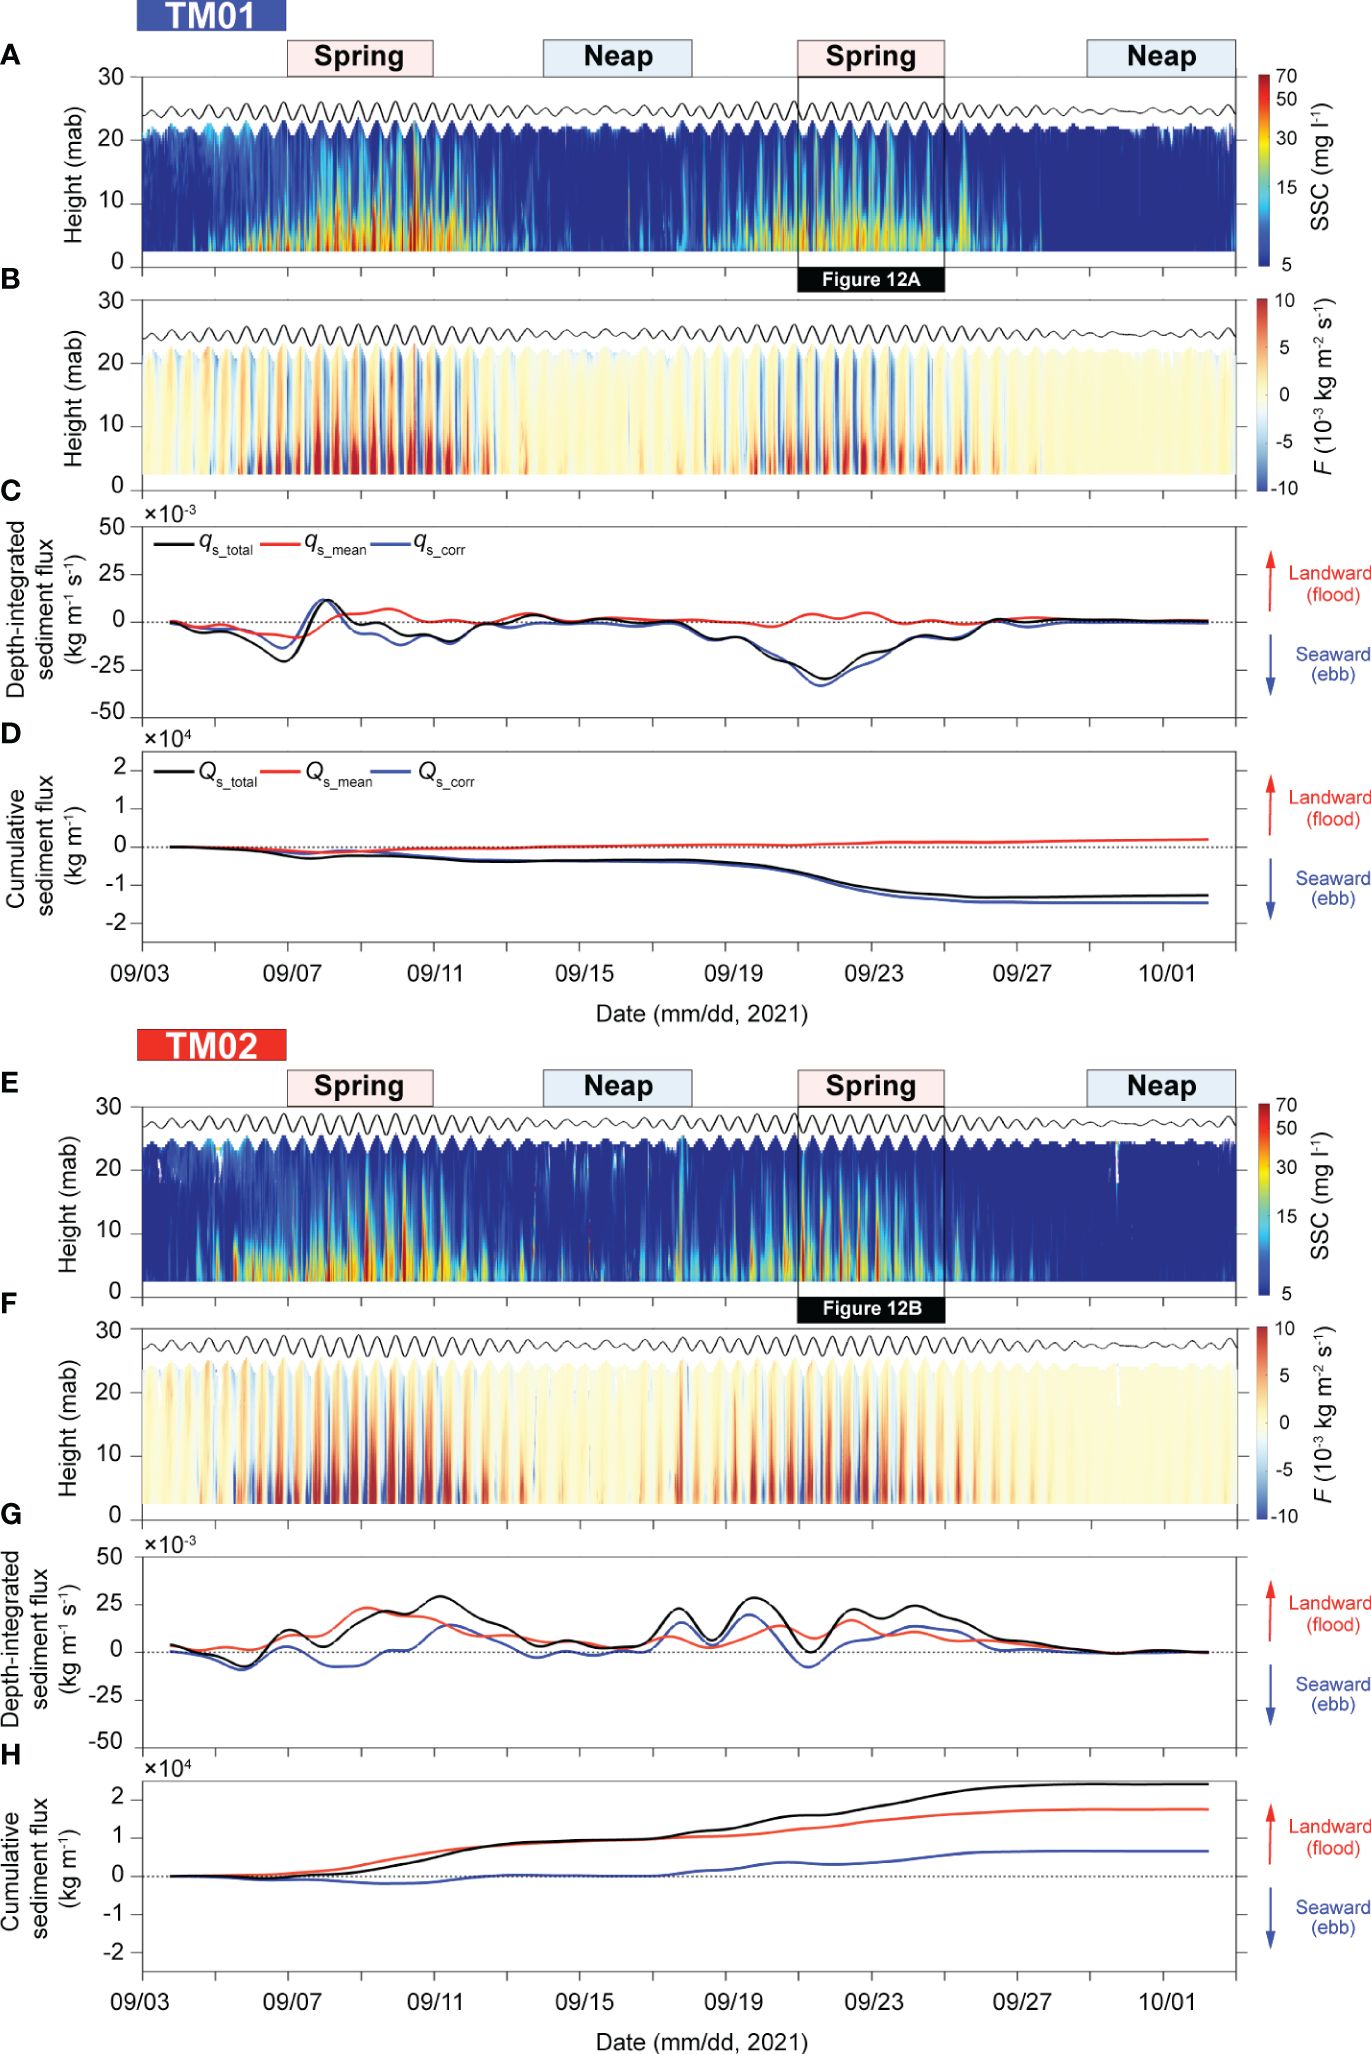
Figure 7 Time series of (A, E) the SSC profiles, (B, F) instantaneous sediment fluxes, (C, G) the depth-integrated along-channel sediment fluxes, and (D, H) cumulative along-channel sediment fluxes. Positive and negative symbols indicate the landward and seaward directions, respectively.
The sediment resuspension at both stations occurred frequently in response to τc (Figure 8). As the tidal forcing was applied equally to the water column at TM01 and TM02, the sediments resuspended from the bed were transported landward or seaward with the tidal cycles. On the other hand, the timing of the maximum τc and SSC at two stations varied with the tidal cycles, resulting in different resuspension patterns. When the same τc was applied to the bed, the sediment at TM01 was resuspended more easily than at TM02. At TM01, the high SSC (up to 170 mg l–1) occurred when τc was intensified above approximately 0.25 Pa, and low SSC occurred predominantly shortly after slack water (Figure 8A). The SSC increased readily at lower τc during ebb rather than flood. The high SSC that occurred during the decelerating flood could be due to the sediment settling. On the other hand, the SSC at TM02 was not easily resuspended, even at a stronger τc than that at TM01 (Figure 8B). The maximum SSC was observed during the low tides after the peak ebb velocities. The SSC increased to 145 mg l–1 despite the low τc during low tides and even when τc was close to 0 Pa, the SSC was > 80 mg l–1. During low tides, the SSC at TM02 was maintained mostly at > 80 mg l–1, probably advection or settling of sediments.
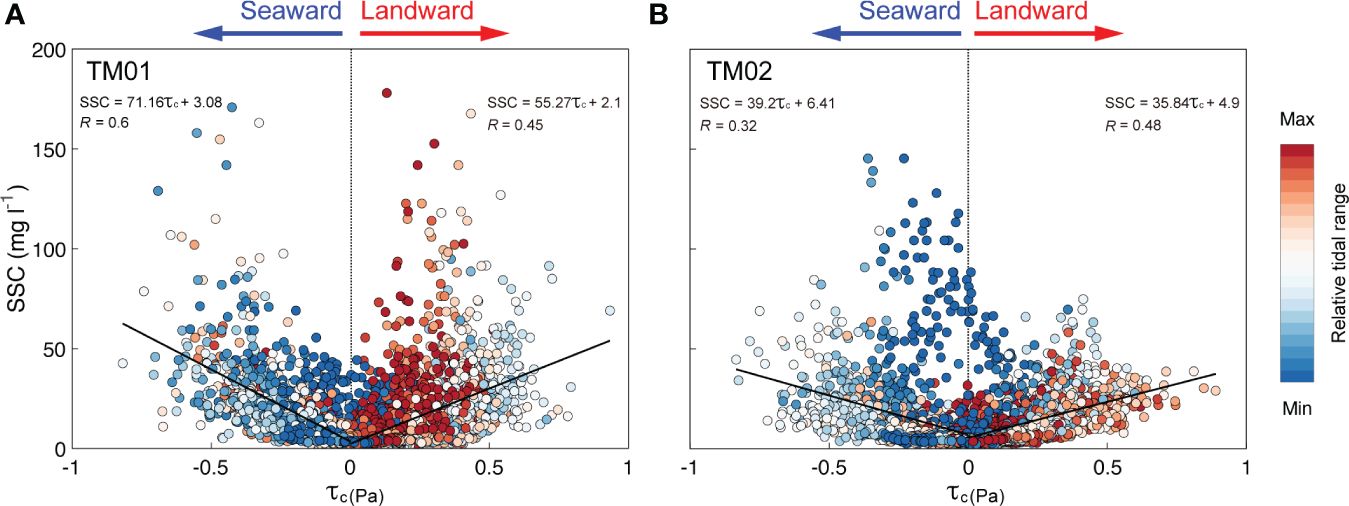
Figure 8 (A, B) Scatterplots of current-induced bed shear stress (τc) and SSC colored according to the relative tidal range. Relative tidal range is based on the instantaneous water level and the tidal range of that cycle. The SSC was measured at 2.1 mab (2nd bin).
4.3 Along- and across-channel sediment fluxes
Despite the tidal current-dominated environment, instantaneous along-channel sediment fluxes responded differently depending on the relative importance between tidal pumping and the residual components (Figures 7B, F). Relatively large depth-integrated sediment fluxes occurred during spring tides at TM01 and TM02 (Figures 7C, G). The depth-integrated sediment fluxes at TM01 showed that tidal pumping dominated the residual currents over the entire observation period (Figure 7C). Although the qs_mean had positive values (landward), the qs_total generally followed a pattern of qs_corr as the qs_corr had negative values (seaward). qs_corr exhibited the most distinct seaward fluxes during the second spring tide. In the total cumulative fluxes, the Qs_corr accounted for 88% of Qs_total and determined the fate of the suspended sediments (Figure 7D). The qs_total at TM02 directed landward, influenced by qs_mean and qs_corr, generally has a positive value (Figure 7G). Qs_total had the most similar pattern to Qs_mean (73% of the total), followed by Qs_corr, showing that the residual currents were driving the sediment transports (Figure 7H). Although they tended to be mutually compensated and balanced by the circulation over four-week mooring periods, the suspended sediment fluxes at TM02 (~0.81 ton m–1 day–1) were about twice higher than those at TM01 (~0.42 ton m–1 day–1).
The instantaneous across-channel sediment fluxes were generally lower than the along-channel fluxes, which are consistent with the weaker across- than the along-channel current velocities (Figures 9A, D). At TM01, the suspended sediment in the lower layer was transported eastward and westward during flood and ebb, respectively (Figure 9A). At TM02, the suspended sediment in the lower layer was transported westward during flood and the accelerating ebb. In contrast, suspended sediment was transported eastward during the decelerating ebb (Figure 9D). Depth-integrated across-channel sediment fluxes (qs_total) were dominant during spring tides, showing different patterns at TM01 and TM02 (Figures 9B, E). Similar to along-channel fluxes, the across-channel fluxes (Qs_total) during the entire observation periods at TM01 were dominated by Qs_corr (75% of the total) and were transported westward (negative) (Figure 9C). At TM02, it was dominated by Qs_mean (63% of the total) and was transported westward (negative) (Figure 9F). At two stations, Qs_total was transported westward at ~0.06 ton m–1 day–1 and ~0.09 ton m–1 day–1 at TM01 and TM02, respectively.
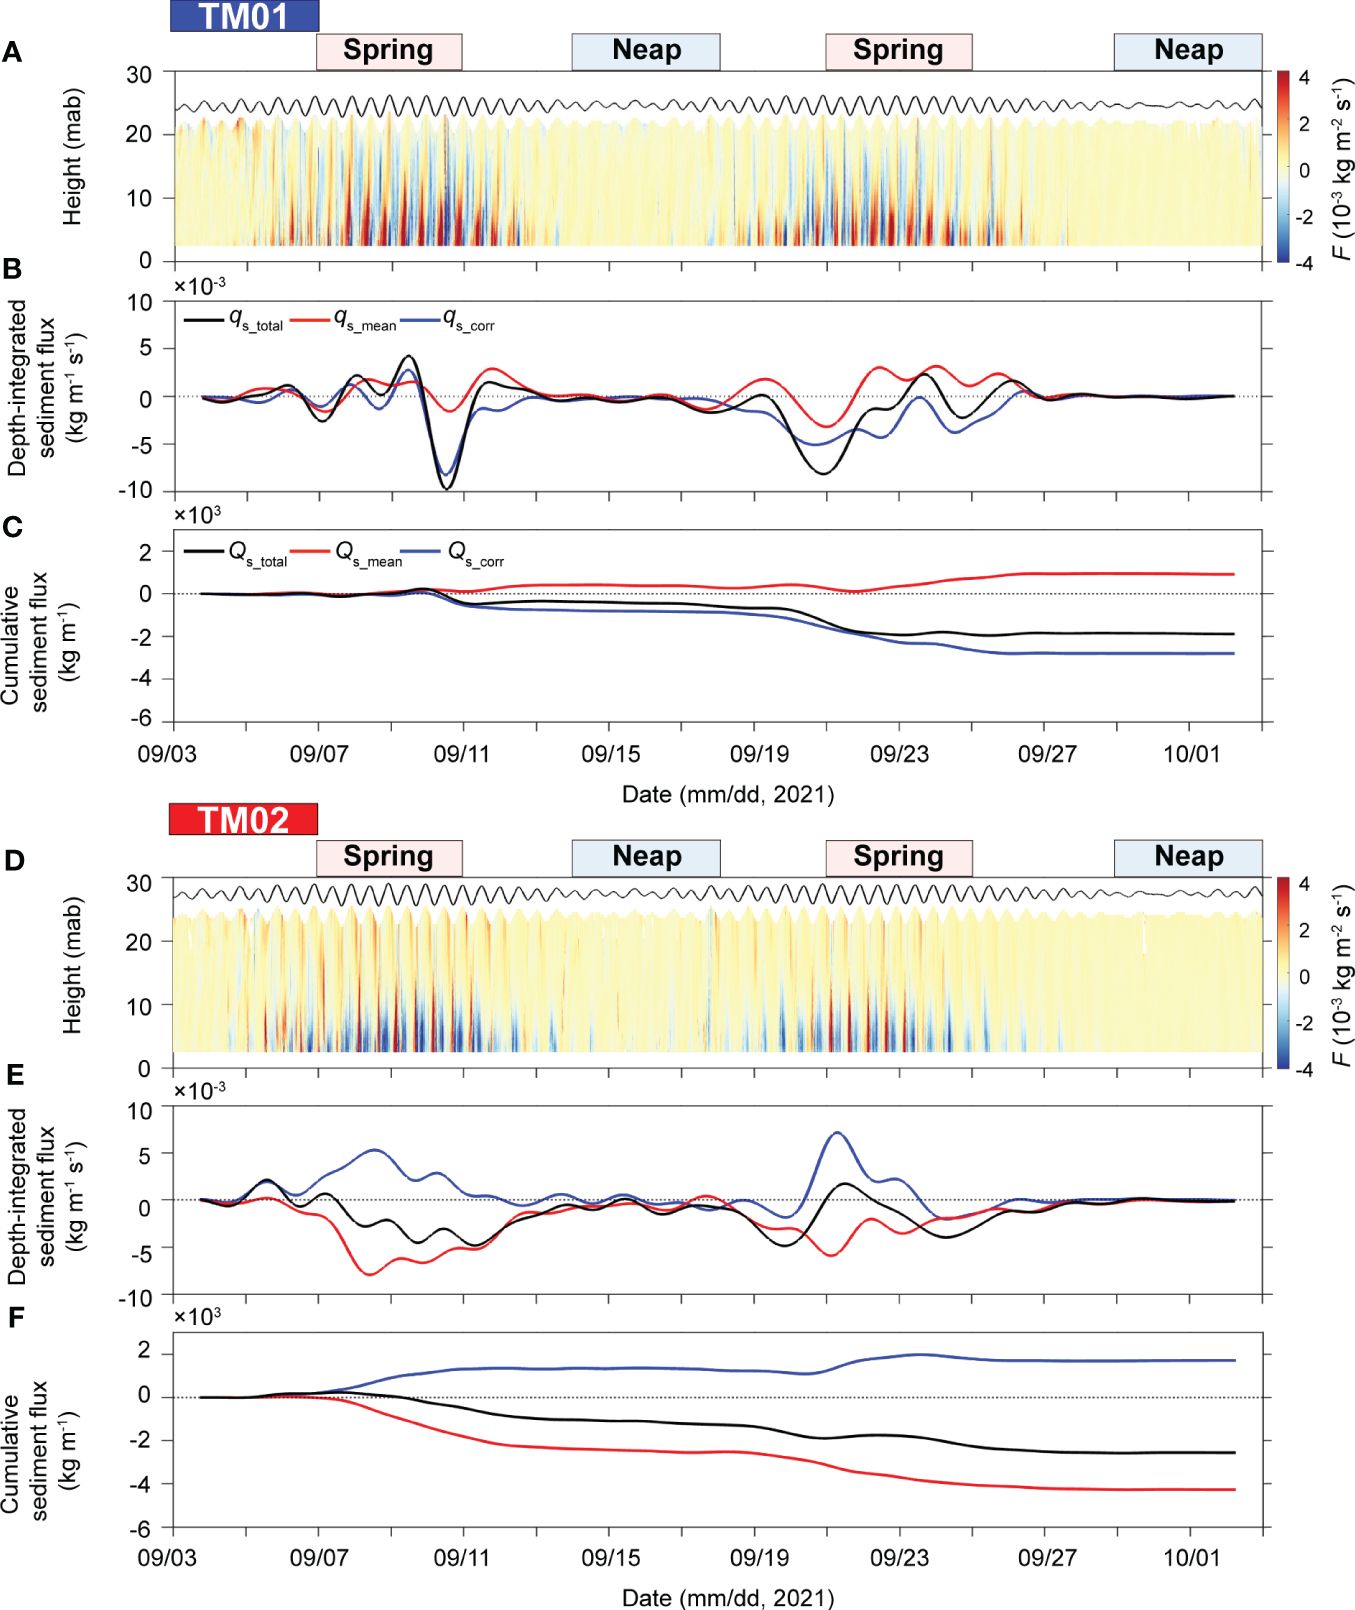
Figure 9 Time series of (A, D) instantaneous across-channel sediment fluxes, (B, E) the depth-integrated across-channel sediment fluxes, and (C, F) cumulative across-channel sediment fluxes. Positive and negative symbols indicate the eastward and westward directions, respectively.
5 Discussion
5.1 Relative importance of local resuspension and advection
The SSC plays a crucial role as an indicator of sediment dynamics, providing insights into the physical mechanisms that influence the transport of suspended sediments. Theoretically, SSC variations at fixed stations could be attributed to two potential sources: local resuspension and horizontal advection (Weeks et al., 1993; Yu et al., 2012). Sediment advection is crucial for determining the total sediment concentration in the water column. The sediment settling becomes significant when advection is prominent (Li et al., 2021). In marine environments dominated by M2 tidal currents, the SSC variations associated with the M4 tide were caused primarily by local sediment resuspension, whereas those linked to the M2 tide were mainly driven by horizontal advection (Yang et al., 2014; Li et al., 2018b; Gong et al., 2023). The power spectral density (PSD) and harmonic analysis for water level, u, and v, exhibited significant powers of the semi-diurnal frequencies (Figure 10; Table 2). The powers of diurnal and quarter-diurnal frequencies were also detected at both stations, but they were notably weaker than those of the semi-diurnal frequency. Therefore, the M2 tidal flow dominated the local dynamics in Yeosu Bay. At TM01, the SSC exhibited a dominant quarter-diurnal frequency (6.21 h), while the semi-diurnal frequency (12.42 h) was dominant at TM02 (Figure 10D). Hence, local resuspension and horizontal advection could be the main processes for controlling the SSC variations at TM01 and TM02, respectively.
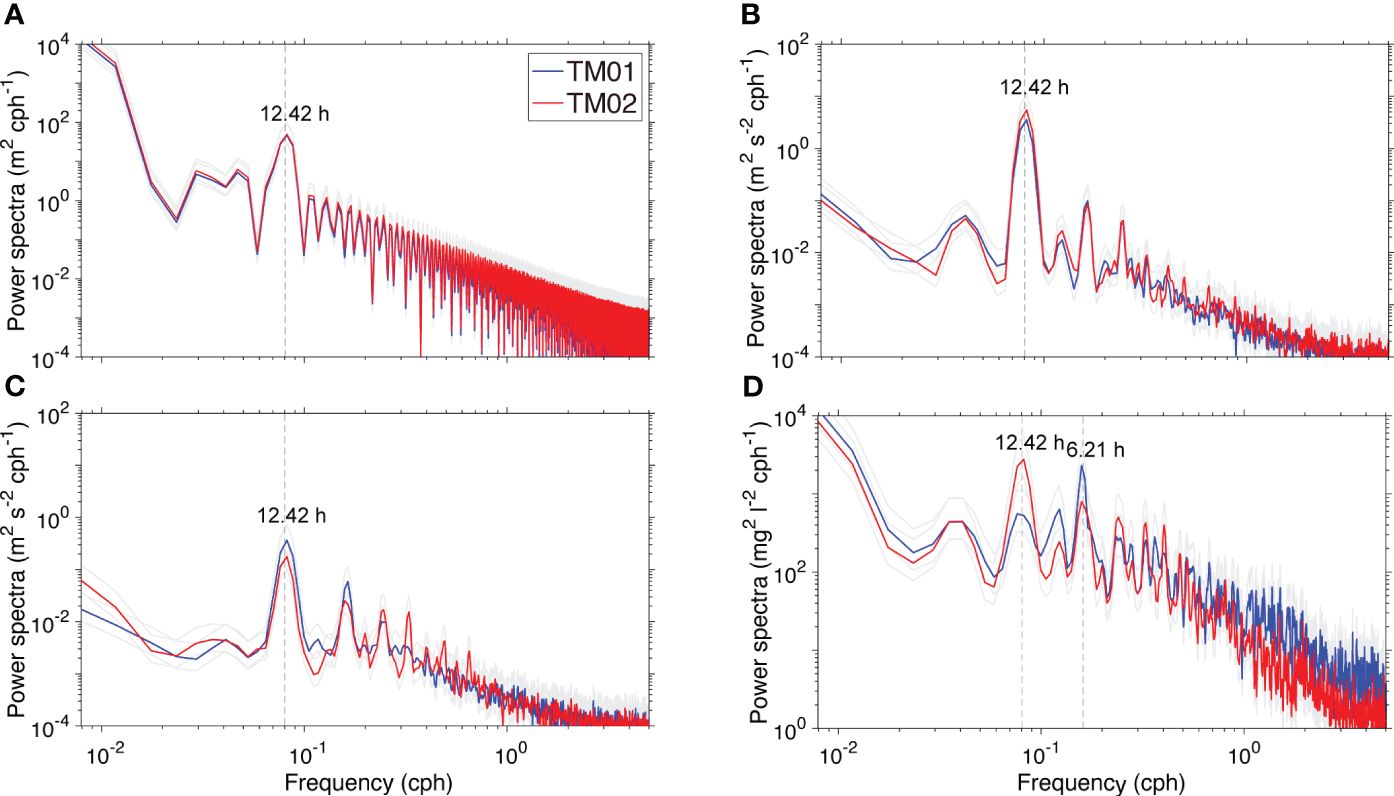
Figure 10 Power spectra of (A) water level, (B) along-channel velocity (u), (C) across-channel velocity (v), and (D) SSC. The gray lines indicate a confidence interval of 95%. The vertical dashed lines indicate frequencies of semi-diurnal (12.42 h) and quarter-diurnal (6.21 h).
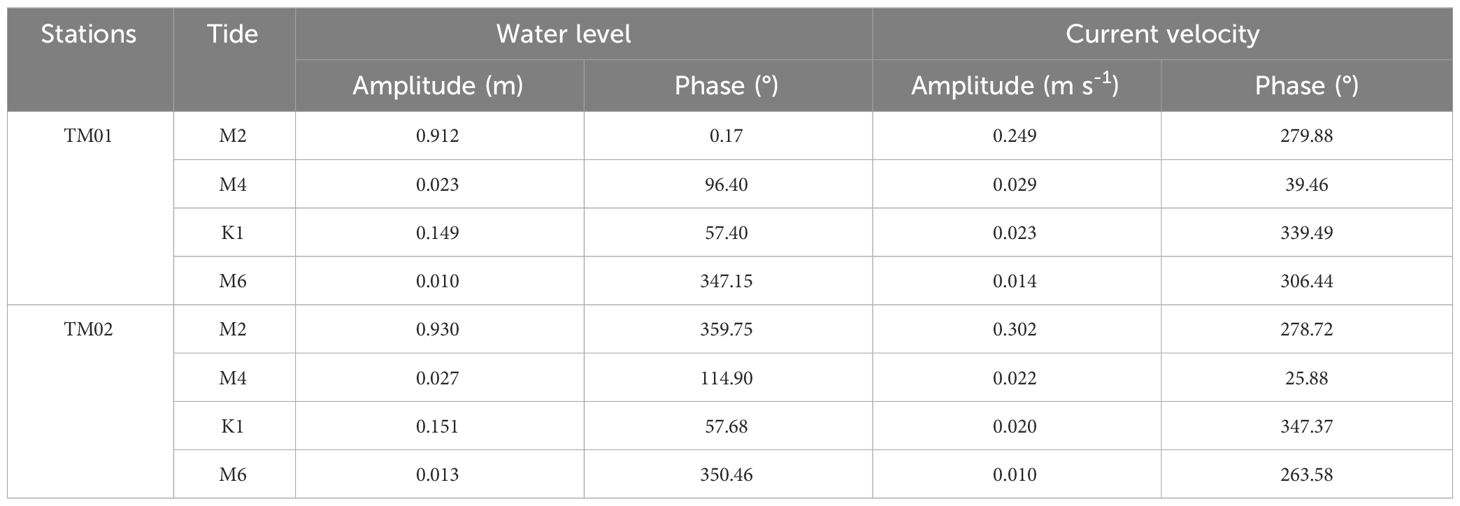
Table 2 Harmonic analysis of water level and current velocity at TM01 and TM02.
Sediment resuspension from the bed occurs when the bed shear stress exceeds a critical shear stress for erosion (Debnath et al., 2007). This resuspension was investigated by correlating SSC and the current-induced bed shear stress (τc). At TM01, a significant correlation (R = 0.6) between SSC and τc was observed during ebb, suggesting that the tidal currents were sufficient to resuspend the sediments from the bed (Figure 8A). A relatively low correlation (R = 0.45) was observed during flood. The high SSC was detected at maximum current velocity during flood, attributed to the local resuspension (Figures 11A, B). The high SSC persisted even with a decelerated current velocity. The PSD for the SSC at TM01 exhibited the influence of the dominant frequency of 12.42 h and 6.21 h (Figure 10D). Hence, the high SSC detected during the decelerating flood could be attributed to the advection and settling out of suspended sediments in the water column above (Figure 11B). On the other hand, at TM02, the linear correlation between SSC and τc was relatively lower during the flood (R = 0.48) and ebb (R = 0.32) compared to TM01 (Figure 8B). The maximum SSC that occurred periodically at low tides could be expected to be advected from the western part of TM02 and settled down. The v, which was directed westward (negative) at the beginning of the ebb, changed to the eastward (positive) direction during the decelerating flow after the maximum ebb current (Figures 11C, D). During spring tides, the low SSC was occasionally observed at low tide (Figure 8B). This might be due to either an absence of eastward current flow or insufficient duration for sediment supply and transport. Therefore, the advection was a more significant factor than local resuspension at TM02.
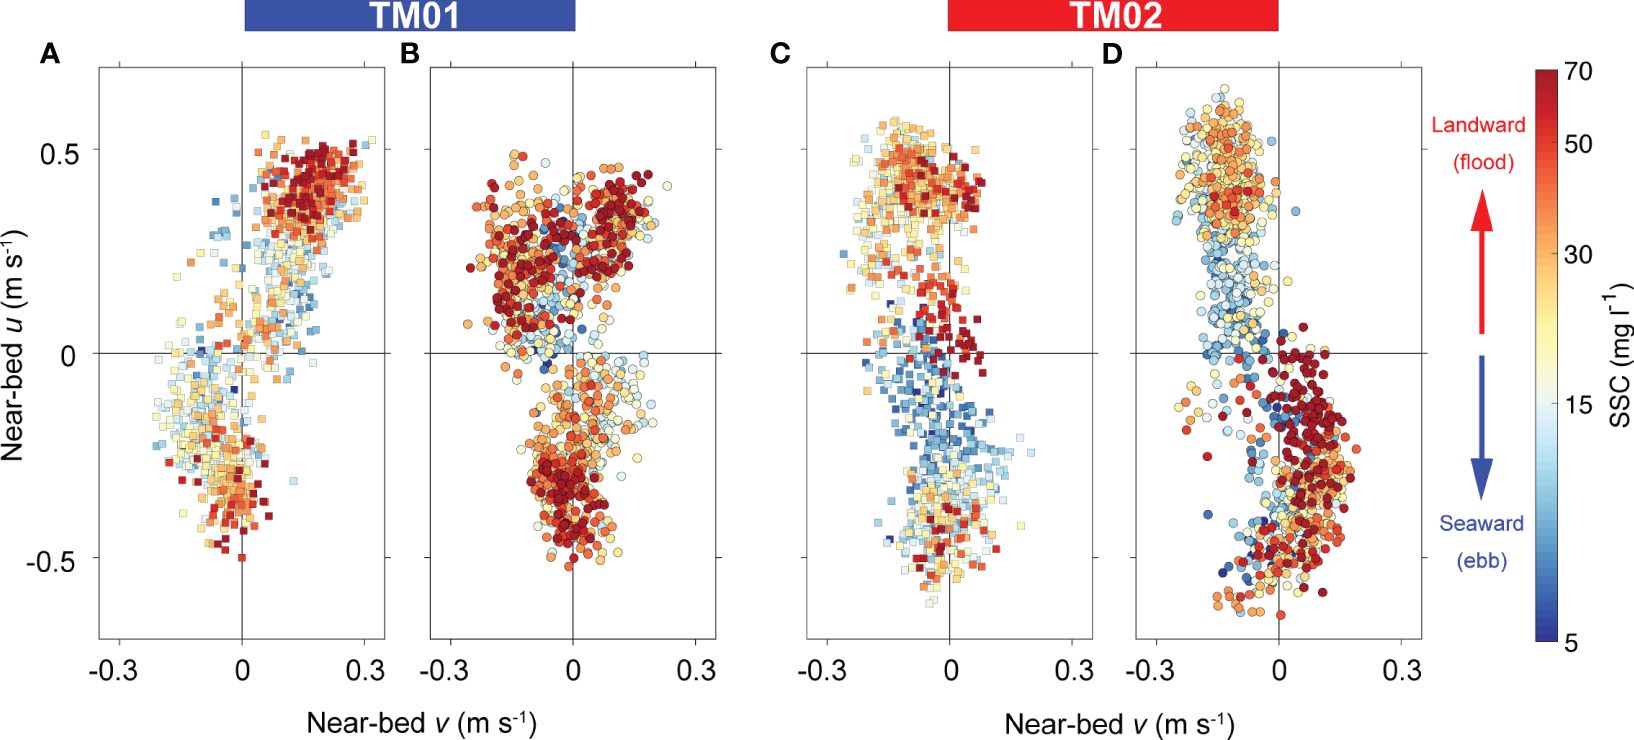
Figure 11 Scatterplots of u and v colored according to the SSC during spring tides. The (A, C) squares and (B, D) circles represent the accelerated and decelerated flows, respectively.
The main factors for determining SSC variations between TM01 and TM02 were attributed to differences in the physical properties of the bed sediment (Figure 3). Unlike TM02, the bed sediment at TM01 had relatively low cohesive sediment content and irregular shell fragments. The SSC at TM01 was more sensitive to changes in response to τc than that of TM02 (Figure 8). The shell fragments were plate-like, irregular, and angular in shape. Their presence also could change the overall composition compared to the surrounding sediment particles (Al-Dabbas and McManus, 1987). Owing to their lower bulk density, the presence of these fragments reduces the bulk density of sediment by diluting the quartz fraction, consequently influencing the erodibility (Soulsby, 1997; Cheng et al., 2021). The sediments containing shell fragments at TM01 were more prone to local resuspension by currents than TM02. Therefore, differences in bed sediment could play a crucial role in determining the main factors of the SSC variations observed in the western (local resuspension) and eastern parts (advection).
5.2 Controlling mechanisms of suspended sediment flux
Lateral flow could become asymmetric due to the interplay of differential advection and Coriolis forcing (Lerczak and Geyer, 2004; Huijts et al., 2009; Cheng et al., 2020). Flood currents shifted to the right side of a straight tidal channel, and ebb currents shifted to the left side (looking toward the northern hemisphere), resulting in residual flows being influenced similarly. Such flows in asymmetric tidal environments significantly influence net sediment transport (Fugate et al., 2007). The long-term transport of suspended sediments is influenced primarily by the sustained advection of residual currents (Liu et al., 2011; Zhong et al., 2020). Residual circulation shows large variations over the spring-neap cycle, with stronger tidally averaged residual currents during the neap tides in low turbulence intensity than during the spring tides (Li and Zhong, 2009). However, sediment transport was controlled not only by the residual currents but also by tidal pumping (Jay and Smith, 1990; Geyer et al., 2001; Yu et al., 2014). Over the entire measurement period, the residual circulation showed different patterns at two stations. The relative contribution of tidal pumping and residual circulation controlled the sediment transport at two stations.
At TM01, seaward tidal pumping flux could be explained by the flood and ebb asymmetries of local resuspension. During spring tides, the low SSC appeared continuously in the upper half of the water column (> 8 mab) for approximately 4–6 hours at flood (Figure 12A). The SSC was maintained in the range of 1–5 mg l–1 during flood, with an average of only 3 mg l–1. This was much lower than the SSC of 9 mg l–1 during ebb. The sediment resuspension was limited to lower in the water column (approximately 5–15 mab) and settling was quicker at the end of the flood. Although the advection flux was slightly landward, it was offset primarily by ebb-dominant tidal pumping, causing seaward sediment transport (Figure 7D). The ebb-dominance of velocity caused high resuspension, resulting in a seaward tidal pumping flux (Figures 6, 7C). The sediment fluxes increased during the ebb due to the stronger surface currents than the bottom (Figure 12A). At TM02, the suspended sediment transport was controlled mainly by the residual currents. Relatively strong local resuspension was observed during the flood, which would cause the SSC asymmetry and lead to landward pumping flux. During the flood, the SSC sustained an average of 17 mg l–1 in the lower layer (< 10 mab) (Figure 12B). The averaged SSC over the entire water column before the maximum ebb current remained low at 6 mg l–1. During the decelerating ebb, high concentrations (< 100 mg l–1) of suspended sediment advected from the western part by the horizontal SSC gradient were supplied to the water column and then settled down (Figures 11D, 12B). This caused mutual compensation and balance between flood and ebb, but the duration was short (approximately 1–2 h) and insufficient to compensate fully for the high SSC maintained during flood. The lack of tidal asymmetry resulted in weaker tidal pumping than sediment transport driven by the residual current, and mean flow caused the sediment inflow. Therefore, at TM02, suspended sediment flowed into the bay because of landward tidal pumping flux and advective flux.
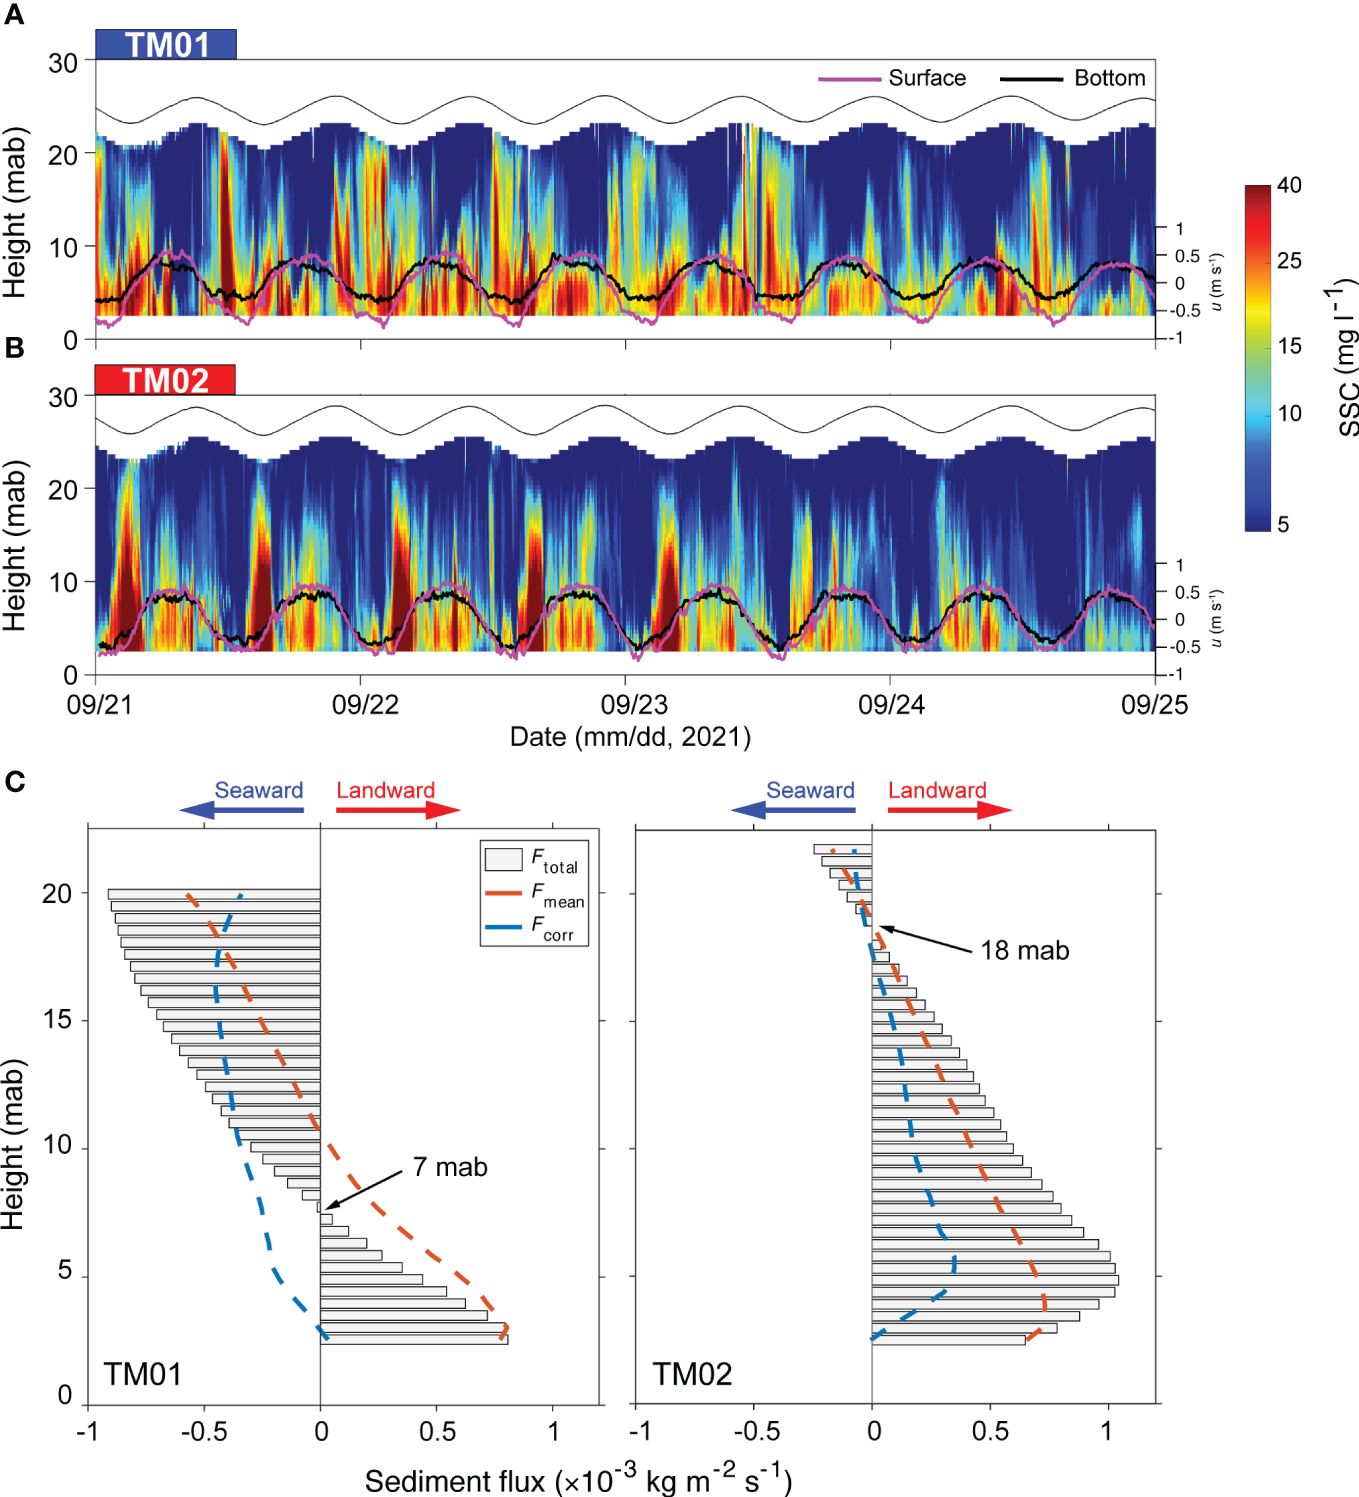
Figure 12 SSC and u (magenta: surface current velocity, black: bottom current velocity) during the second spring tide at (A) TM01 and (B) TM02, respectively. (C) Tide-averaged suspended sediment flux (Ftotal). The red and blue dashed lines indicate the advective flux (Fmean) and tidal pumping flux (Fcorr), respectively.
Although sediment at TM01 was resuspended more easily than at TM02, the influxes of suspended sediment toward the eastern part were twice as large as the amount flowing outfluxes the western part. At TM02, the sediment transports due to tidal pumping and residual circulation were directed landward in below 18 mab (Figure 12C). The sediment fluxes caused by tidal pumping at TM01 were directed seaward in ebb-dominant conditions. On the other hand, the sediment fluxes caused by residual circulation were directed landward at the bottom and seaward at the surface. The total sediment fluxes, combining the tidal pumping flux and advective flux, were offset at 7 mab. As a result, TM01 had relatively more balanced upper and lower layers with flood and ebb than TM02. The across-channel sediment fluxes could affect the along-channel sediment fluxes more directly (Figure 9). The across-channel sediment fluxes at two stations were affected by different driving processes, but they generally transported suspended sediment to the channel where the seaward fluxes were more dominant.
The net sediment fluxes over the entire observation period indicated inflow towards the eastern part of the bay. Despite this, explaining the sediment accumulation within the bay is challenging because of a lack of information on the sediment fluxes across the Noryang Channel. The main drivers of sediment transport varied spatially and possibly temporally. Forcings, such as freshwater discharge, wind, and precipitation, which can influence the changes in sediment transport, vary across different time scales. In addition, the phase relationship between the M2 and M4 tidal components dominated in Yeosu Bay exhibited significant seasonality and can control the variability of tidal pumping (Gräwe et al., 2014). Nevertheless, understanding sediment transport mechanisms in a meso-tidal bay requires multifaceted approaches including a numerical modeling. A fixed-point mooring can present only quantitative variability for a specific site. To understand long-term variations in sediment flux across the bay, advanced monitoring technologies (e.g., coastal acoustic tomography) that can cover a variety of spatial and temporal scales are required. Such an approach can facilitate a deeper understanding of sediment transport processes in the semi-enclosed bay systems.
6 Conclusions
In-situ ADCP moorings were conducted to reveal the controlling mechanism for suspended sediment transport caused by the residual current and tidal pumping in a meso-tidal bay. The following conclusions were drawn from this study:
(1) Yeosu Bay was characterized by freshwater outflow from the Seomjin River and free exchange with the open sea. The ebb-dominated tidal pumping (88% of the total) mainly drove the seaward sediment fluxes at TM01, whereas the residual current (73% of the total) mainly influenced the landward fluxes at TM02. The direction of the tidal pumping flux at TM01 was seaward, and at TM02, it was landward.
(2) At TM01, SSC variations depended mainly on local resuspension controlled by tidal currents, whereas it depended on horizontal advection at TM02. This difference at the two stations could be due to the physical properties of the bed sediments (TM01: sandy mud containing shell fragments, TM02: mud).
(3) Owing to the SSC asymmetry of flood and ebb at two stations, the suspended sediments exhibited an influx pattern into the bay. The mechanisms controlling sediment transport could vary spatially, and the relative contribution of tidal pumping and residual circulation could lead to an imbalance of sediment transport.
(4) Our results revealed the influence of bed sediments on SSC variation to understand the relative importance of residual circulation and tidal pumping sediment transport in Yeosu Bay. These processes can help predict sediment transport patterns in an estuarine system where tidal current is dominant, and two-layer residual currents exist with asymmetric lateral flow. All outcomes could be beneficial for scientific communities to manage sediment issues, and be utilized as a base data on the environmental health of coastal regions.
Data availability statement
The raw data supporting the conclusions of this article will be made available by the authors, without undue reservation.
Author contributions
SK: Conceptualization, Investigation, Writing – original draft, Formal Analysis, Validation. JS: Investigation, Validation, Visualization, Writing – review & editing. J-HP: Writing – review & editing, Validation, Conceptualization. PK: Writing – review & editing, Investigation, Funding acquisition. IK: Investigation, Writing – review & editing, Data curation. KK: Investigation, Writing – review & editing, Data curation. HH: Conceptualization, Supervision, Validation, Writing – review & editing.
Funding
The author(s) declare financial support was received for the research, authorship, and/or publication of this article. This research was supported by Korea Institute of Marine Science and Technology Promotion (KIMST) funded by the Ministry of Oceans and Fisheries, under the projects “Development of 3-D Ocean Current Observation Technology for Efficient Response to Maritime Distress” (KIMST-20210642) and “Development of Living Shoreline Technology based on Blue Carbon Science Toward Climate Change Adaptation” (KIMST-20220526). It was also supported by the National Research Foundation of Korea (NRF-2022R1A2C1003886).
Conflict of interest
Authors PK and IK were employed by Underwater Survey Technology 21, and KK was employed by GeoSystem Research Corporation.
The remaining authors declare that the research was conducted in the absence of any commercial or financial relationships that could be construed as a potential conflict of interest.
Publisher’s note
All claims expressed in this article are solely those of the authors and do not necessarily represent those of their affiliated organizations, or those of the publisher, the editors and the reviewers. Any product that may be evaluated in this article, or claim that may be made by its manufacturer, is not guaranteed or endorsed by the publisher.
Supplementary material
The Supplementary Material for this article can be found online at: https://www.frontiersin.org/articles/10.3389/fmars.2024.1362583/full#supplementary-material
References
Al-Dabbas M. A. M., McManus J. (1987). Shell fragments as indicators of bed sediment transport in the Tay Estuary. Proc. R. Soc. Edinburgh Section B: Biol. Sci. 92, 335–344. doi: 10.1017/S0269727000004759
Bass S. J., Aldridge J. N., McCave I. N., Vincent C. E. (2002). Phase relationships between fine sediment suspensions and tidal currents in coastal seas. J. Geophysical Research: Oceans 107, 3146. doi: 10.1029/2001JC001269
Bian C., Liu Z., Huang Y., Zhao L., Jiang W. (2018). On estimating turbulent Reynolds stress in wavy aquatic environment. J. Geophysical Research: Oceans 123, 3060–3071. doi: 10.1002/2017JC013230
Blair N. E., Aller R. C. (2012). The fate of terrestrial organic carbon in the marine environment. Annu. Rev. Mar. Sci. 4, 401–423. doi: 10.1146/annurev-marine-120709-142717
Burchard H., Schuttelaars H. M., Ralston D. K. (2018). Sediment trapping in estuaries. nnual Rev. Mar. Sci. 10, 371–395. doi: 10.1146/annurev-marine-010816-060535
Burton G. A., Johnston E. L. (2010). Assessing contaminated sediments in the context of multiple stressors. Environ. Toxicol. Chem. 29, 2625–2643. doi: 10.1002/etc.332
Cheng C. H., de Smit J. C., Fivash G. S., Hulscher S. J. M. H., Borsje B. W., Soetaert K. (2021). Sediment shell-content diminishes current-driven sand ripple development and migration. Earth Surface Dynamics 9, 1335–1346. doi: 10.5194/esurf-9-1335-2021
Cheng G., Wang Y. P., Voulgaris G., Du J., Sheng J., Xiong J., et al. (2020). Sediment exchange between channel and sand ridges in the southern Yellow Sea: The importance of tidal asymmetries. Continental Shelf Res. 205, 104169. doi: 10.1016/j.csr.2020.104169
Cheng P., Wilson R. E. (2008). Modeling sediment suspensions in an idealized tidal embayment: importance of tidal asymmetry and settling lag. Estuaries Coasts 31, 828–842. doi: 10.1007/s12237-008-9081-4
Choo H. S. (2020a). Temporal and spatial fluctuation characteristics of sea surface temperature in Yeosu Bay, Korea. J. Korean Soc. Fisheries Ocean Technol. 56, 322–339. doi: 10.3796/KSFT.
Choo H. S. (2020b). Tide and tidal flows around the Myo Island in Gwangyang Bay. Bull. Institute Fishing Technol. 13, 1–11. doi: 10.15399/jfti.2020.02.13.1.1
Debnath K., Nikora V., Aberle J., Westrich B., Muste M. (2007). Erosion of cohesive sediments: Resuspension, bed load, and erosion patterns from field experiments. J. Hydraulic Eng. 133, 508–520. doi: 10.1061/(ASCE)0733-9429(2007)133:5(508)
Deines K. L. (1999). “Backscatter estimation using broadband acoustic Doppler current profilers,” in Proceedings of the IEEE Sixth Working Conference on Current Measurement (Cat. No.99CH36331). (San Diego, CA, USA: IEEE). 249–253. doi: 10.1109/CCM.1999.755249
Donker J. J. A., de Swart H. E. (2013). Effects of bottom slope, flocculation and hindered settling on the coupled dynamics of currents and suspended sediment in highly turbid estuaries, a simple model. Ocean Dynamics 63, 311–327. doi: 10.1007/s10236-013-0593-5
Elliott M., Whitfield A. K. (2011). Challenging paradigms in estuarine ecology and management. Estuarine Coast. Shelf Sci. 94, 306–314. doi: 10.1016/j.ecss.2011.06.016
Fettweis M., Riethmüller R., Verney R., Becker M., Backers J., Baeye M., et al. (2019). Uncertainties associated with in situ high-frequency long-term observations of suspended particulate matter concentration using optical and acoustic sensors. Prog. Oceanography 178, 102162. doi: 10.1016/j.pocean.2019.102162
Figueroa S. M., Lee G., Shin H. J. (2020). Effects of an estuarine dam on sediment flux mechanisms in a shallow, macrotidal estuary. Estuarine Coast. Shelf Sci. 238, 106718. doi: 10.1016/j.ecss.2020.106718
Fugate D. C., Friedrichs C. T., Sanford L. P. (2007). Lateral dynamics and associated transport of sediment in the upper reaches of a partially mixed estuary, Chesapeake Bay, USA. Continental Shelf Res. 27, 679–698. doi: 10.1016/j.csr.2006.11.012
Geyer W. R., Woodruff J. D., Traykovski P. (2001). Sediment transport and trapping in the Hudson River estuary. Estuaries 24, 670–679. doi: 10.2307/1352875
Gong W., Wang J., Zhao J., Chen L., Zhang H. (2023). Contrast of fine sediment dynamics between shoals and channels in a microtidal estuary with mixed semi-diurnal tides. Anthropocene Coasts 6, 4. doi: 10.1007/s44218-023-00018-6
Gräwe U., Burchard H., Müller M., Schuttelaars H. M. (2014). Seasonal variability in M2 and M4 tidal constituents and its implications for the coastal residual sediment transport. Geophysical Res. Lett. 41, 5563–5570. doi: 10.1002/2014GL060517
Gu F., Lu H., Wan Y., Shen Q., Wang Y. (2022). Study on the methods to estimate the bed shear stresses in Yangtze estuary. J. Physics: Conf. Ser. 2224, 12133. doi: 10.1088/1742-6596/2224/1/012133
Guo L., Wang Z. B., Townend I., He Q. (2019). Quantification of tidal asymmetry and its nonstationary variations. J. Geophysical Research: Oceans 124, 773–787. doi: 10.1029/2018JC014372
Ha H. K., Maa J. Y., Park K., Kim Y. H. (2011). Estimation of high-resolution sediment concentration profiles in bottom boundary layer using pulse-coherent acoustic Doppler current profilers. Mar. Geology 279, 199–209. doi: 10.1016/j.margeo.2010.11.002
Huang W., Zhang H., Zhu L., Chen L., Zhang G., Gong W., et al. (2020). In-situ study of the spatiotemporal variability of sediment erodibility in a microtidal estuary. Estuarine Coast. Shelf Sci. 232, 106530. doi: 10.1016/j.ecss.2019.106530
Huijts K. M. H., Schuttelaars H. M., de Swart H. E., Friedrichs C. T. (2009). Analytical study of the transverse distribution of along-channel and transverse residual flows in tidal estuaries. Continental Shelf Res. 29, 89–100. doi: 10.1016/j.csr.2007.09.007
Hyun S., Lee T., Choi J. S., Choi D. L., Woo H. J. (2003). Geochemical Characteristics and Heavy Metal Pollutions in the Surface Sediments of Gwangyang and Yeosu Bay, south coast of Korea. Sea: J. Korea Soc. Oceanography 8, 380–391.
Jay D. A., Smith J. D. (1990). Residual circulation in shallow estuaries: 1. Highly stratified, narrow estuaries. J. Geophysical Research: Oceans 95, 711–731. doi: 10.1029/JC095iC01p00711
Kang Y., Kang Y. H., Kim J. K., Kang H. Y., Kang C. K. (2020). Year-to-year variation in phytoplankton biomass in an anthropogenically polluted and complex estuary: A novel paradigm for river discharge influence. Mar. pollut. Bull. 161, 111756. doi: 10.1016/j.marpolbul.2020.111756
Kim B. J., Ro Y. J., Jung K. Y., Park K. S. (2014). Numerical modeling of circulation characteristics in the Kwangyang estuarine system. J. Korean Soc. Coast. Ocean Engineers 26, 253–266. doi: 10.9765/KSCOE.2014.26.4.253
Kim D. C., Kang H. J. (1991). Suspended sediment budget in gwangyang bay through the Yeosu sound. Bull. Korean Fisheries Soc. 24, 31–38.
Kim D. C., Lee G. S., Bae S. H., Kim G. Y., Seo Y. K., Choi D. L., et al. (2012). physical and acoustic property of gas-bearing sediments in Yeosu Bay. J. Geological Soc. Korea 48, 79–91.
Kim G. Y., Sung J. Y., Kim D. C., Kim J. C. (1994). Physical and acoustic properties of sediments around the Yeosu Sound. Bull. Korean Fisheries Soc. 27, 434–444.
Kim S., Lee B. (2004). A study on the sediment flux in Gwangyang bay during spring tide, March 2003. Korean J. Fisheries Aquat. Sci. 37, 511–516. doi: 10.5657/kfas.2004.37.6.511
Kim S. C., Friedrichs C. T., Maa J. Y., Wright L. D. (2000). Estimating bottom stress in tidal boundary layer from acoustic Doppler velocimeter data. J. Hydraulic Eng. 126, 399–406. doi: 10.1061/(ASCE)0733-9429(2000)126:6(399)
Kim Y. H., Gutierrez B., Nelson T., Dumars A., Maza M., Perales H., et al. (2004). Using the acoustic Doppler current profiler (ADCP) to estimate suspended sediment concentration. CPSD technical report #04-01. (South Carolina, Columbia: Coastal Processes and Sediment Dynamics Laboratory, Department of Geological Sciences, University of South Carolina). doi: 10.5281/zenodo.1419625
Lee M. O., Kim J. K., Kim B. K. (2021). Marine environmental studies in Gwangyang Bay, Korea: past, present, and future direction. J. Korean Soc. Mar. Environ. Energy 24, 161–178. doi: 10.7846/JKOSMEE.2021.24.4.161
Lerczak J. A., Geyer W. R. (2004). Modeling the lateral circulation in straight, stratified estuaries. J. Phys. Oceanography 34, 1410–1428. doi: 10.1175/1520-0485(2004)034<1410:MTLCIS>2.0.CO;2
Li L., He Z., Xia Y., Dou X. (2018a). Dynamics of sediment transport and stratification in Changjiang River Estuary, China. Estuarine Coast. Shelf Sci. 213, 1–17. doi: 10.1016/j.ecss.2018.08.002
Li Z., Jia J., Wang Y. P., Zhang G. (2022). Net suspended sediment transport modulated by multiple flood-ebb asymmetries in the progressive tidal wave dominated and partially stratified Changjiang Estuary. Mar. Geology 443, 106702. doi: 10.1016/j.margeo.2021.106702
Li Y., Jia J., Zhu Q., Cheng P., Gao S., Wang Y. P. (2018b). Differentiating the effects of advection and resuspension on suspended sediment concentrations in a turbid estuary. Mar. Geology 403, 179–190. doi: 10.1016/j.margeo.2018.06.001
Li Y., Wang Y. P., Zhu Q., Limaye A. B., Wu H. (2021). Roles of advection and sediment resuspension-settling in the turbidity maximum zone of the Changjiang Estuary, China. Continental Shelf Res. 229, 104559. doi: 10.1016/j.csr.2021.104559
Li M., Zhong L. (2009). Flood–ebb and spring–neap variations of mixing, stratification and circulation in Chesapeake Bay. Continental Shelf Res. 29, 4–14. doi: 10.1016/j.csr.2007.06.012
Liu G., Zhu J., Wang Y., Wu H., Wu J. (2011). Tripod measured residual currents and sediment flux: Impacts on the silting of the Deepwater Navigation Channel in the Changjiang Estuary. Estuarine Coast. Shelf Sci. 93, 192–201. doi: 10.1016/j.ecss.2010.08.008
McLachlan R. L., Ogston A. S., Asp N. E., Fricke A. T., Nittrouer C. A., Gomes V. J. C. (2020). Impacts of tidal-channel connectivity on transport asymmetry and sediment exchange with mangrove forests. Estuarine Coast. Shelf Sci. 233, 106524. doi: 10.1016/j.ecss.2019.106524
McSweeney J. M., Chant R. J., Sommerfield C. K. (2016). Lateral variability of sediment transport in the Delaware Estuary. J. Geophysical Research: Oceans 121, 725–744. doi: 10.1002/2015JC010974
Nidzieko N. J. (2010). Tidal asymmetry in estuaries with mixed semi-diurnal/diurnal tides, J. J. Geophysical Research: Oceans 115, C08006. doi: 10.1029/2009JC005864
Nidzieko N. J., Ralston D. K. (2012). Tidal asymmetry and velocity skew over tidal flats and shallow channels within a macrotidal river delta. J. Geophysical Research: Oceans 117, C03001. doi: 10.1029/2011JC007384
Paranaíba J. R., Struik Q., Erdociain M., van Dijk G., Smolders A. J. P., van der Knaap J., et al. (2023). CO2, CH4, and N2O emissions from dredged material exposed to drying and zeolite addition under field and laboratory conditions. Environ. pollut. 337, 122627. doi: 10.1016/j.envpol.2023.122627
Schubel J. R. (1968). Turbidity maximum of the northern chesapeake bay. Science 161, 1013–1015. doi: 10.1126/science.161.3845.1013
Schulz E., Grasso F., Le Hir P., Verney R., Thouvenin B. (2018). Suspended sediment dynamics in the macrotidal Seine Estuary (France): 2. Numerical modeling of sediment fluxes and budgets under typical hydrological and meteorological conditions. J. Geophysical Research: Oceans 123, 578–600. doi: 10.1002/2016JC012638
Scully M. E., Friedrichs C. T. (2007). Sediment pumping by tidal asymmetry in a partially mixed estuary. J. Geophysical Research: Oceans 112, C07028. doi: 10.1029/2006JC003784
Seo J. Y., Choi B. J., Ryu J., Ha H. K. (2022). Dynamic evolution of a secondary turbidity maximum under various forcing conditions in a microtidal estuary. Mar. Geology 446, 106760. doi: 10.1016/j.margeo.2022.106760
Seo J. Y., Kim Y. H., Ryu J., Ha H. K. (2023). Wind-induced switch of estuarine residual circulations and sediment transport in microtidal bay. Estuarine Coast. Shelf Sci. 288, 108371. doi: 10.1016/j.ecss.2023.108371
Shahzad M. I., Meraj M., Nazeer M., Zia I., Inam A., Mehmood K., et al. (2018). Empirical estimation of suspended solids concentration in the Indus Delta Region using Landsat-7 ETM+ imagery. J. Environ. Manage. 209, 254–261. doi: 10.1016/j.jenvman.2017.12.070
Sommerfield C. K., Wong K. C. (2011). Mechanisms of sediment flux and turbidity maintenance in the Delaware Estuary. J. Geophysical Research: Oceans 116, C01005. doi: 10.1029/2010JC006462
Soulsby R. (1997). Dynamics of marine sands: A Manual for Practical Applications (London: Thomas Telford).
van Maren D. S., Winterwerp J. C., Sas M., Vanlede J. (2009). The effect of dock length on harbor siltation. Continental Shelf Res. 29, 1410–1425. doi: 10.1016/j.csr.2009.03.003
Weeks A. R., Simpson J. H., Bowers D. (1993). The relationship between concentrations of suspended particulate material and tidal processes in the Irish Sea. Continental Shelf Res. 13, 1325–1334. doi: 10.1016/0278-4343(93)90086-D
Williams J., Lee G., Shin H. J., Dellapenna T. (2015). Mechanism for sediment convergence in the anthropogenically altered microtidal Nakdong Estuary, South Korea. Mar. Geology 369, 79–90. doi: 10.1016/j.margeo.2015.08.004
Xu K., Bentley S. J., Robichaux P., Sha X., Yang H. (2016). Implications of texture and erodibility for sediment retention in receiving basins of coastal Louisiana diversions. Water 8, 26. doi: 10.3390/w8010026
Yang Z., de Swart H. E., Cheng H., Jiang C., Valle-Levinson A. (2014). Modelling lateral entrapment of suspended sediment in estuaries: the role of spatial lags in settling and M4 tidal flow. Continental Shelf Res. 85, 126–142. doi: 10.1016/j.csr.2014.06.005
Yang Q., Hu S., Fu L., Zhang P., Chu N., Liu F., et al. (2022). Responses of tidal duration asymmetry to morphological changes in Lingding Bay of the Pearl River Estuary. Front. Mar. Sci. 9. doi: 10.3389/fmars.2022.983182
Yu Q., Wang Y. P., Flemming B., Gao S. (2012). Tide-induced suspended sediment transport: Depth-averaged concentrations and horizontal residual fluxes. Continental Shelf Res. 34, 53–63. doi: 10.1016/j.csr.2011.11.015
Yu Q., Wang Y., Gao J., Gao S., Flemming B. (2014). Turbidity maximum formation in a well-mixed macrotidal estuary: The role of tidal pumping. . J. Geophysical Research: Oceans 119, 7705–7724. doi: 10.1002/2014JC010228
Zhong W., Zhu L., Dong P., Hu R., Wu J., Zhu Y., et al. (2020). Mechanisms of sediment trapping in coastal embayments off the Shandong Peninsula in summer—A case study in Weihai Bay. Estuarine Coast. Shelf Sci. 236, 106623. doi: 10.1016/j.ecss.2020.106623
Keywords: sediment flux, tidal pumping, residual circulation, local resuspension, advection, Yeosu Bay
Citation: Kim SI, Seo JY, Park J-H, Kim PJ, Kim IG, Kim KM and Ha HK (2024) Imbalance of sediment transport in a meso-tidal bay: effect of tidal pumping and residual circulation. Front. Mar. Sci. 11:1362583. doi: 10.3389/fmars.2024.1362583
Received: 28 December 2023; Accepted: 27 March 2024;
Published: 11 April 2024.
Edited by:
Alejandro Jose Souza, Center for Research and Advanced Studies - Mérida Unit, MexicoReviewed by:
Byung Joon Lee, Kyungpook National University, Republic of KoreaBram Van Prooijen, Delft University of Technology, Netherlands
Copyright © 2024 Kim, Seo, Park, Kim, Kim, Kim and Ha. This is an open-access article distributed under the terms of the Creative Commons Attribution License (CC BY). The use, distribution or reproduction in other forums is permitted, provided the original author(s) and the copyright owner(s) are credited and that the original publication in this journal is cited, in accordance with accepted academic practice. No use, distribution or reproduction is permitted which does not comply with these terms.
*Correspondence: Ho Kyung Ha, hahk@inha.ac.kr