Real-time water quality forecasting in rivers using satellite data and dynamic models: an online system for operational management, control and citizen science
 Paul G. Whitehead1,2,3*
  Paul Edmunds3
  Gianbattista Bussi2
  Séamus O’Donnell3
  Martyn Futter4 Steve Groom3 Cordelia Rampley5 Chris Szweda3 David Johnson1 Andy Triggs Hodge3
  Tim Porter3 Geraldine Castro3
- 1School of Geography and the Environment, University of Oxford, Oxford, United Kingdom
- 2Water Resource Associates, Wallingford, United Kingdom
- 3Aquascope Solutions Ltd., Worcester, United Kingdom
- 4Department of Aquatic Science and Assessment, Swedish University of Agricultural Sciences, Uppsala, Sweden
- 5Oxford Molecular Biosensors, Centre for Innovation and Enterprise, Oxford, United Kingdom
Increasingly scarce water resources and growing global populations have exacerbated the problems of water quality in river systems and freshwaters in general. New monitoring methodologies and tools to democratize access to water quality information are needed if we are to reach ambitious societal objectives such as the UN Sustainable Development Goals and the European Green Deal. Here we present a cloud-based system for producing publicly accessible real time water quality forecasts coupled to novel biosensor technology. Short term forecasts of water quality impairments, e.g., as cyanobacteria blooms, sediment plumes and toxic pollution incidents are increasingly relevant both to citizens and stakeholders. Here, we present a new cloud based system that utilizes satellite data to produce real time forecasts of flow and water quality using a chain of dynamic catchment-scale models at multiple locations in a river network. We demonstrate this new system using two case studies: the River Thames and the Essex Colne River (United Kingdom). These rivers are key water supply sources for London and South-East England, respectively and are of high interest to recreational water users. We show how the new system can predict and forecast water quality, estimate toxicity and connect to citizen science observations using an App (www.aquascope.com) for information synthesis and delivery.
Introduction
In the management and operational control of water resource systems, a major requirement is for information on present river conditions and on likely future changes in water quality (Whitehead et al., 1984; Chapra, 2008; Kroeze et al., 2016). Operational managers need to be able to respond quickly to emergency situations in order to protect and conserve water quality and maintain adequate water quality for public and industrial supply. For example, rising nitrate levels in rivers and groundwaters have placed pressure on water supply managers to keep public water supply reservoirs below the WHO and EU limit of 11.3 mg/L for Nitrate-N (Sutton et al., 2011). Spikes of high nitrate being flushed from catchments in late summer, once catchment soils have rewetted, can drive river and reservoir waters to high Nitrate-N concentrations which then require blending to ensure safe water supplies.
At the same time, as populations increase, there are increasing demands for water and hence higher levels of sewage flows into rivers, estuaries and coastal zones from both rural and urban areas. Excess untreated water entering river systems transport high organic and pathogen loads (Tuholske et al., 2021). This is especially true during storm or high rainfall events where the combined sewer and rainfall drains overwhelm sewage treatment plants (STPs), bypass the plant and discharge directly into rivers. This is commonly known as combined sewer overflows (CSOs) which are used as emergency responses to reduce the risk of sewage backing up during heavy rainfall. There use generates high levels of pollution with significant organic loads, with very high Biochemical Oxygen Demand (BOD). The subsequent biochemical reactions, as defined by the Streeter Phelps equations (Streeter and Phelps, 1925; Beck and Young, 1976; Crossman et al., 2021), dictate that this will inevitably lower Dissolved Oxygen (DO) concentrations in rivers, thereby threatening fisheries and biodiversity (macroinvertebrates). At the same time, the high sewage discharges affect the suitability of the river for swimming and bathing due to the higher levels of pathogens in rivers (Fewtrell and Kay, 2015). With climate change increasing the frequency and intensity of rainfall events, this is becoming a really significant problem, threatening the water quality and ecology of all river systems.
There is an increasing demand from the regulators and water users such as environment agencies, water companies, river trusts and the public for water quality and flow information in order to understand and explain water quality. River users would like to be informed about the state of the water quality so they can safely enjoy recreational pursuits such as swimming, rowing, boating, canoeing, fishing, walking, conservation activities, etc. Also, crucially, the supply of clean, potable water is essential and a very high priority for governments and water companies. There are many other issues or operational concern to water companies, environment agencies and governments, and these are addressed in this paper.
In this paper, we propose and demonstrate a real-time system for delivering water quality and flow information based on satellite data coupled to dynamic process-based models of flow and water quality. This system will have potential great benefits to a wide range of stakeholders from government, to environmental agencies, to river users and river trusts, as well as support citizen science. Further aspects and applications of the proposed technology is given in the final sections of this paper.
A wide range of satellite data has become available recently and the data supply is increasing year by year as more advanced technology comes online with a range of new satellite services. Also, there has been an expansion of water quality models over many decades, with increasing complexity, greater spatial distribution and more detailed temporal resolution (e.g., monthly, weekly, daily and sub-daily, Tang et al., 2019). Many of these models are not suitable for a real-time forecasting role as they are too complex and require access to GIS systems (e.g., SWAT, SWAT+, Arnold et al., 2012; Bieger et al., 2017) which means they are very time consuming to solve computationally in real time. Any real time model must be able to simulate catchments in seconds or a few moments to be useful for users online or by river pollution control staff controlling water intakes, monitoring rivers or protecting public water supply systems.
In this paper we use the INCA (Integrated Catchments) suite of catchment-scale, process-based models (Whitehead et al., 1998a; Whitehead et al., 1998b). INCA is one of the most used catchment-scale water quality models in the scientific literature (Fu et al., 2019). It was developed in 1998 to simulate river system flow, Nitrate-N and ammonia (Whitehead et al., 1998a; Whitehead et al., 1998b; Wade A. J. et al., 2002). It was subsequently updated to add other water quality variables such as phosphorus, dissolved oxygen and algal production (Wade et al., 2002b; Wade et al., 2002c), carbon and mercury (Futter et al., 2011; Futter et al., 2012). It has been applied widely in the United Kingdom (Whitehead et al., 2002; Bussi et al., 2020) and globally (Khan et al., 2018; Jin et al., 2021; Bussi et al., 2023; Sharma et al., 2023). In this study, INCA-N (Wade A. J. et al., 2002) and INCA-P (Crossman et al., 2021) have been used INCA is computationally fast and capture the key hydro-chemical and biological and dynamic processes affecting water quality. INCA has been applied to approximately 150 catchments in every continent except Antarctica. It has been used in a wide range of climatic and terrestrial environments in catchments ranging in size from a few square kilometers (Whitehead et al., 2002) to thousands of square kilometers such as the Ganges or the Mekong (Whitehead et al., 2015; Khan et al., 2018; Bussi et al., 2020).
The model is driven by daily time series of rainfall and temperature data from, e.g., the United Kingdom Met Office, weather radar, or satellite products, as in this paper. Such real-time data has been used for many years for flood flow prediction (Cole and Moore, 2009) but to the best of our knowledge, application to water quality data forecasting has been limited to the Bedford Ouse application (Whitehead et al., 1984). Here we demonstrate applications of a real-time forecasting system to the River Thames in South-East England and the River Colne in Eastern England. These rivers supply water to London and Eastern England. Both rivers have a very strong recreational and citizen science following with many people enjoying the rivers for fishing, swimming, boating, rowing, canoeing, etc. And there are very active river trust and conservation groups monitoring and helping to manage the rivers and their tributaries (e.g., Thames 21, Action for the River Kennet and Oxford Waters Interest Group).
Thus the main objective of this study is to demonstrate an online real time river water quality forecasting system driven by process based catchment-scale models and satellite data. Which displays reach and river location simulating flow and water quality data in a web-based system and a mobile app.
The Thames and Essex Colne catchments
The Thames
The Thames River is a key river in Southeast England with a catchment area of 10,000 km2 (Figure 1) and a length of 218 km from the Cricklade source in the Cotswold Hills of Gloucestershire to Teddington in West London. The bedrock in the region is mainly permeable Chalk which gives a base flow index of approximately 0.72, although there are sub-catchments of low permeability clays. The water quality is characterized by high base cation concentrations due to the chalk aquifers and groundwater flows. The mean annual flow (1999-2022) ranges from 1.5 m3/s at Cricklade, to 33.5 m3/s at Days Weir, to 65.5 m3/s at Teddington (Figure 1). Seasonally, high flows normally occur in winter and early spring (January to April) and low flows occur in summer and late autumn (July-November). Average rainfall for the catchment is low at 711 mm/year. The catchment is predominantly rural in the upper reaches and becomes more urban further downstream. The low average annual rainfall increases the vulnerability of the Thames to drought. The Thames is a crucial water source for London with the population of Greater London of approximately 13 million. In addition, there have been large changes in land use in the Thames catchment since the 1930s (Whitehead et al., 2002) which have affected flows, water quality and ecology. The potential future impacts of climate change are serious as it is likely there will be a shortfall in water resources by the 2030s (Whitehead et al., 2009).
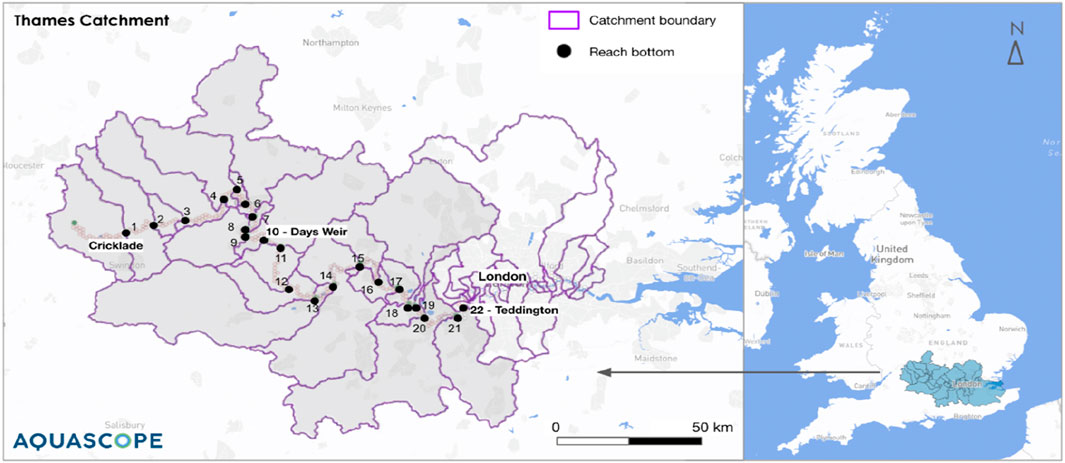
Figure 1. Map of the River Thames showing sub-catchments (left) and location the United Kingdom (right).
River Colne (Essex)
The River Colne (Figure 2) rises near Steeple Bumpstead in Essex and flows south east through Halstead and the Colne Valley to Colchester, where it becomes tidal before joining the Blackwater Estuary and ultimately the North Sea. The catchment headwaters are predominantly rural, giving way to a more urban environment downstream at Colchester. The catchment area is 298.9 km2 and the river has a length of 54.9 km. The underlying geology is mainly London Clay and some Upper Chalk, with superficial deposits of semi-pervious Boulder Clay and some sands and gravels. The catchment has a base flow index of 0.52 which reflects the semi permeable geology. The Essex Colne receives relatively low rainfall with an average of 572 mm per year, which generates a mean flow of 12.2 m3/s and a peak flow of 22.6 m3/s and, is thus, extremely vulnerable to drought. There are a number of abstractions along the river for irrigation and water is abstracted and pumped to Ardleigh Reservoir for public drinking water supply.
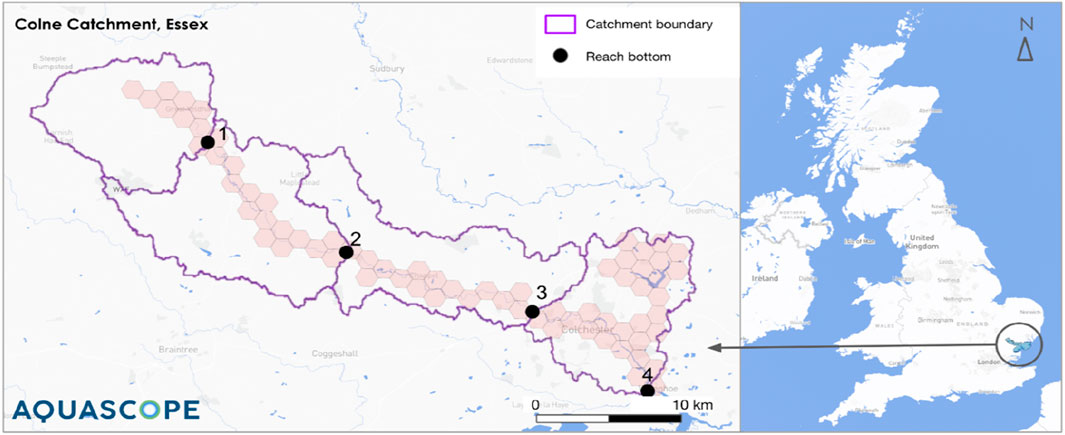
Figure 2. Map of the River Colne (Essex) showing sub-catchments (left) and location in the United Kingdom (right).
Satellite data forecasting scheme: Methodology
The overall strategy for the forecasting scheme synthesizes satellite data collected across a catchment or watershed which is then linked to a model chain to generate flow and water quality data at key locations down a river system (Figures 3, 4). The daily time series of flow and water quality data can then be displayed online or via a mobile app, to show recent and past changes in water quality. The system forecasts future flows and water quality, up to 3–5 days ahead. This then provides a warning system for operational managers who might want to switch supplies if a significant pollution pulse is moving down the river system, or for other river users who might also want to avoid a pollution pulse. The forecast system can take advantage of the natural inbuilt dynamics of rivers, as all rivers have a delay transporting water down the system and this residence time can be significant (e.g., 2–5 days on the Thames). Also, rather like weather forecasts, a probability can be assigned to any forecast, so that users can evaluate predictions in terms of a familiar risk assessment.
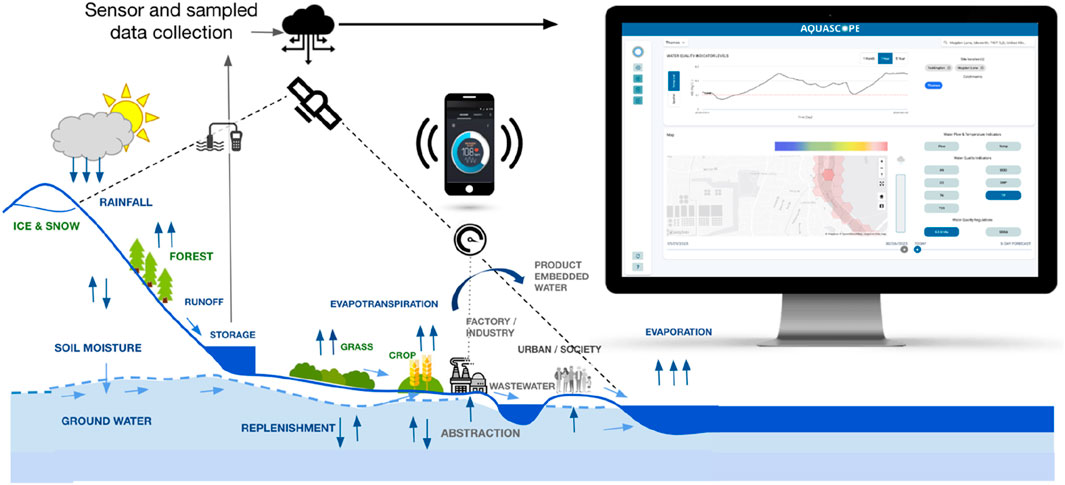
Figure 3. A typical catchment with water flows and sources of pollution from industry, farming and wastewater. Satellites monitor land use, daily rainfall and temperature with data being transferred via online cloud-based system. Rainfall, river flows and water quality are displayed on the system website and mobile app.
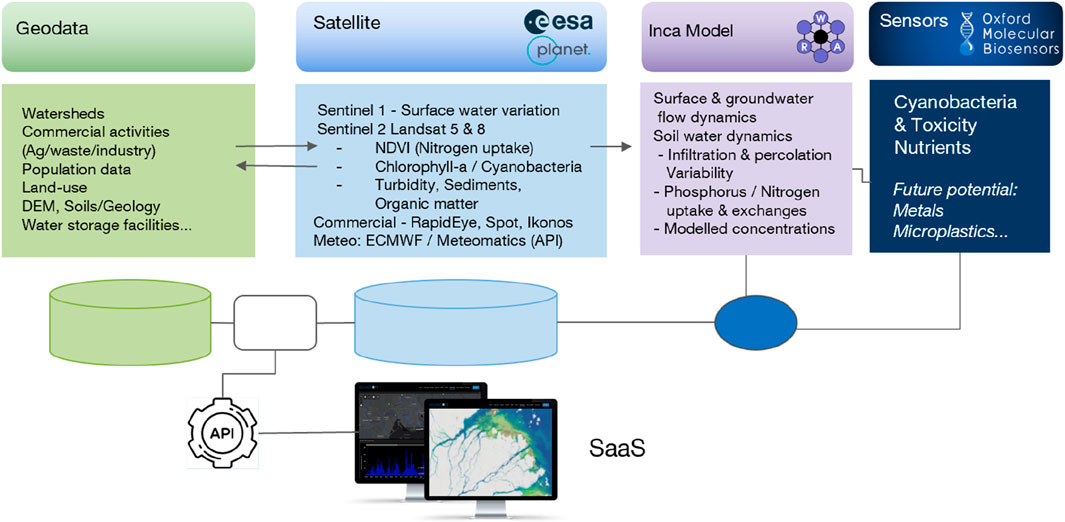
Figure 4. Data flows in the real time forecasting system.
The data transfer system for the real time forecasting system uses satellite-derived estimates of rainfall and temperature that are run through a model chain to generate hydrological time series which are in turn used to force the INCA water quality model (Figure 4). INCA then simulates flow and water quality for all reaches down the river. Water quality is influenced by catchment land use, effluent discharges and, hence population numbers, to generate flows and water quality down the river system The model generates a range of water quality including nutrients (N, P), sediments, DO and BOD (Figures 5, 6). These outputs and short term water quality forecasts are then displayed online in real time or in a mobile app.
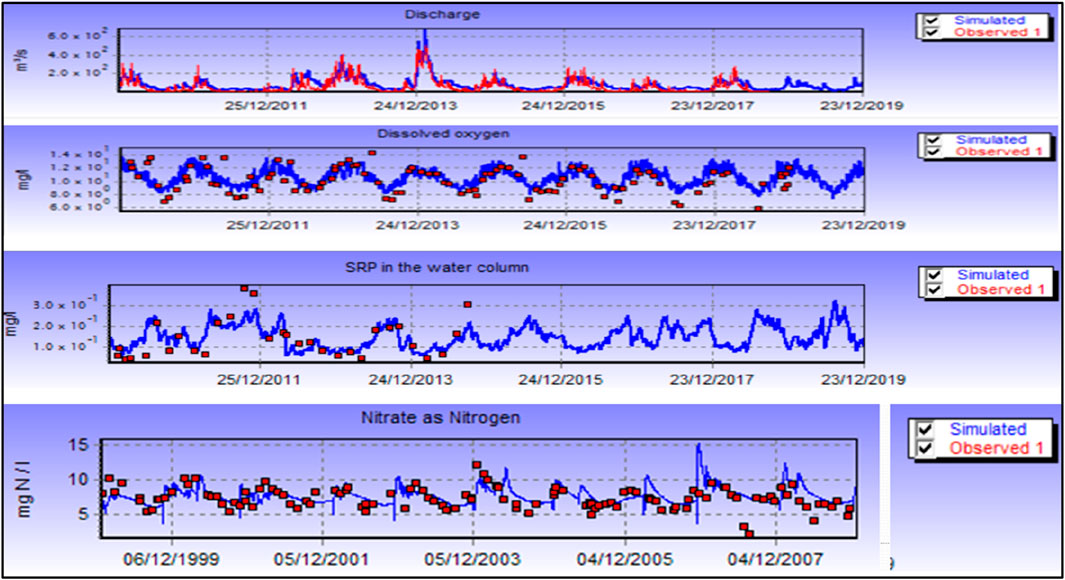
Figure 5. Simulated (blue) and observed (red) discharge, dissolved oxygen, soluble reactive phosphorus (SRP) and nitrate in the River Thames at Teddington.
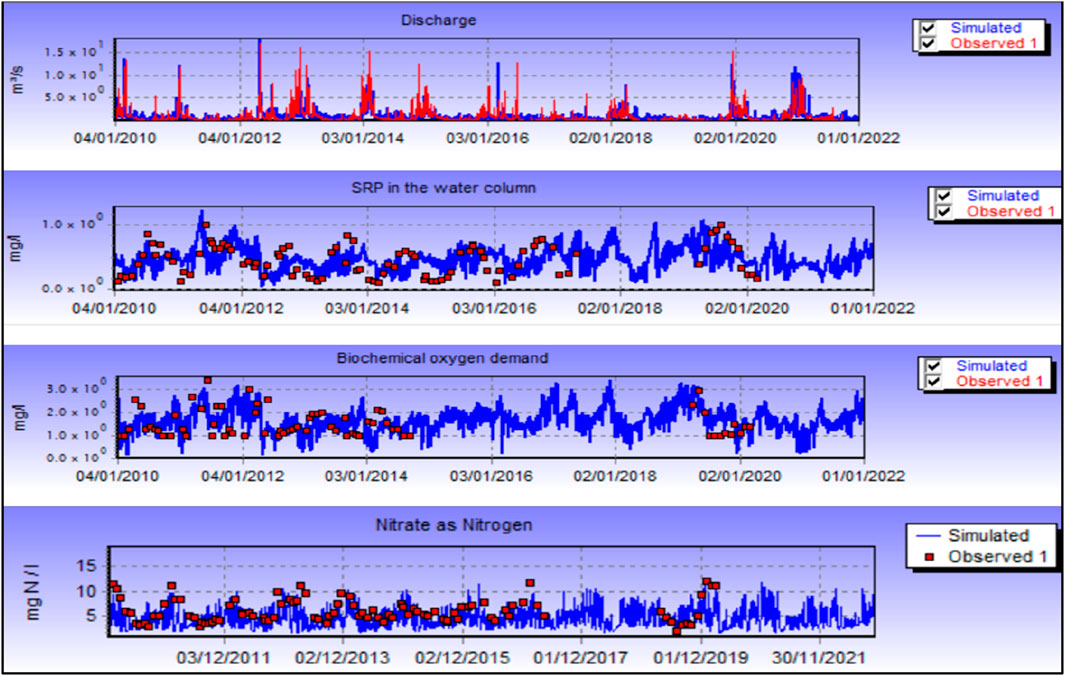
Figure 6. Simulated (blue) and observed (red) discharge, soluble reactive phosphorus (SRP), biochemical oxygen demand and nitrate in the River Colne (Essex) at Colchester.
The process for obtaining and evaluating satellite data and transforming it into forecasts of water quality is as follows:
1. Precipitation is generated from the NASA GPM IMERG v06 satellite constellation dataset (Huffman et al., 2019), whilst temperature is derived from the multiple data-sourced ERA-5 LAND dataset produced by the ECMWF (Muñoz Sabater, 2019). Both are accessed and processed in JavaScript using Google Earth Engine (Gorelick et al., 2017). Data sets (Table 1) are collated across a catchment and time-averaged to produce a daily result that is then exported to local databases;
2. At this point, some ground truthing is required to ensure the satellite data reflects the actual measured rainfall and temperature. For example, the United Kingdom Met Office provides daily estimate of precipitation and temperature data. The satellite-derived estimates can be compared with these instrumental data and evaluated statistically to estimate bias and statistical distribution. If needed, the satellite-derived estimates can then be transformed using a simple statistical procedure to give a similar statistical distribution as the instrumental observations and to eliminate any inherent bias;
3. The procedure utilised to map the statistical distribution of the satellite-derived estimates to the observed data is based on an empirical quantile mapping bias correction methodology (Lafon et al., 2013). First, a quantile look-up table is built by estimating a large number of quantiles from the historical distributions of observed and satellite data (the same historical period is used for both datasets), and then a correction coefficient is computed as the ratio (for precipitation) or the difference (for temperature) between the same quantile of satellite data and observed data. Finally, a new time series of bias-corrected data is generated by applying to each daily value of the historical satellite time series its corresponding correction coefficient from the quantile look-up table based on its quantile;
4. The corrected data are then used in a water balance model (PERSiST, Futter et al., 2014). PERSiST (the Precipitation, Evapotranspiration and Runoff Simulator for Solute Transport) is designed to work on a semi-distributed scale for catchments. It can simulate terrestrial runoff and streamflow across a range of spatial scales from headwaters to large river basins. The model generates time series inputs for the INCA model consisting of daily hydrologically effective rainfall (HER), temperature, and soil moisture deficits;
5. The INCA model needs to be set up for the catchment, which involves collating topographic and land use data and evaluating observed flow and quality time series. Model calibration is necessary to adequately represent catchment dynamics and water quality responses;
6. Once the INCA models are set up, the hydrological time series inputs from PERSiST can be input to the INCA water quality model to simulate flow, nitrate-N, ammonium-N, phosphorus (total and soluble), suspended sediments, DO, BOD and phytoplankton biomass. INCA is run automatically in the cloud and generates flow and water quality data at every reach location down the river system;
7. Output displays of the data can be provided online in real time as time series, profiles down the river, or statistical summaries available online or in the mobile app;
8. Alerts can be sent out to interested parties providing notice of an extreme event, e.g., pollution discharge, CSO discharges, high pathogen events or a pulse of high nitrate water moving down the river system;
9. The data transfer system for the real time forecasting system is shown in Figure 4. The data transfer shows the satellite system providing estimates of rainfall and temperatures and these are fed through a model to estimate hydrologically effective rainfall (i.e., rainfall less evapotranspiration effects). These data are then fed into INCA to simulate the river system at all reaches down the river. INCA takes account of land use down the catchment, effluent discharges and, hence population numbers, to generate flows and water quality down the river system. These river data are then displayed in real time on an online web system or on a mobile phone app. The model generates a range of water quality including nutrients (N, P), sediments, DO and BOD. Figures 5, 6 show typical outputs for the Thames and the Colne Rivers.
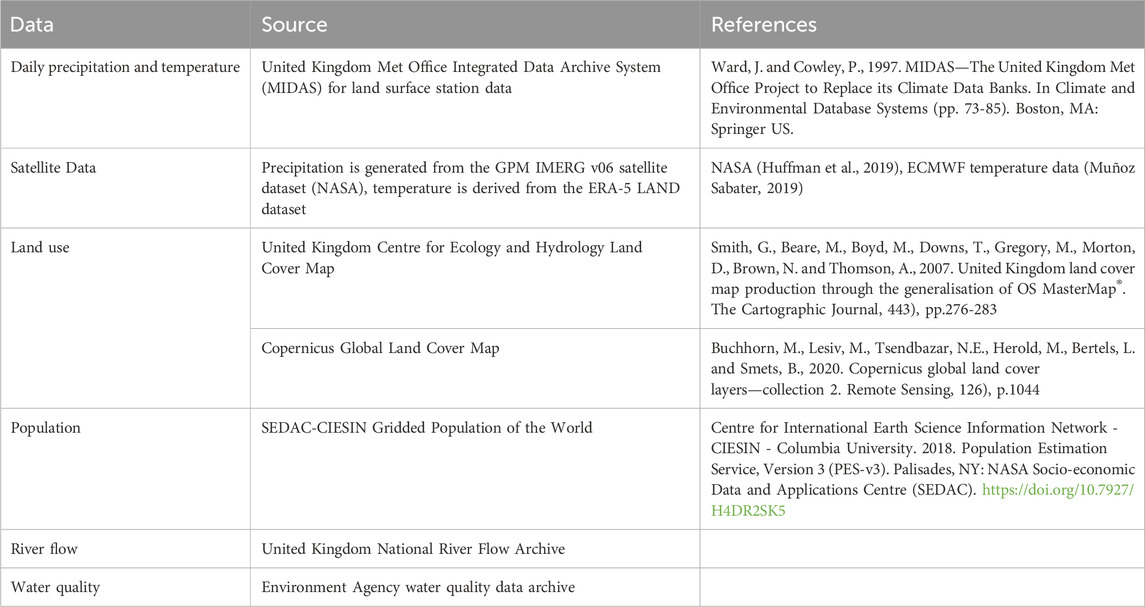
Table 1. Data Sources used in the study.
INCA model: Application to rivers Thames and Essex Colne
INCA is a dynamic, semi-distributed, process-based model for water quantity and quality. It has a hydrological sub-model to simulate the transformation of rainfall into runoff and the propagation of water through a river network. INCA requires daily time series of precipitation, temperature, hydrologically effective rainfall and soil moisture deficit as inputs which can be estimated using the hydrological model, PERSiST (Futter et al., 2014). PERSiST is based on a user-specified number of linear reservoirs and reproduces relevant hydrological processes, such as snow melt, direct runoff generation, soil storage, aquifer storage, and flows through the stream network.
Two members of the INCA family of water quality models are used in the applications presented here. INCA-N simulates the catchment N cycle, from the main inputs (atmospheric deposition, fertilisers, wastewater), soil stores and processes, aquatic transformations and eventual flux through the outlet of a river network or catchment. Both nitrate and ammonium are simulated. Modelled terrestrial processes include denitrification, nitrification, immobilisation, mineralisation and leaching towards the river system and aquifers. Instream processes such as nitrification and denitrification are also incorporated into the model (Whitehead et al., 1998a; Whitehead et al., 1998b; Wade A. J. et al., 2002). INCA-P simulates daily river flow, total and soluble P, suspended sediments (potentially separated by size), DO and BOD, and phytoplankton growth. INCA-P simulates the P cycle from the main P sources, both diffuse (fertilisers) and point (wastewater) and the main processes involving phosphorus, such as sediment sorption/desorption, sedimentation and resuspension, bedload buildup, the DO/BOD dynamic interactions, and phytoplankton growth and death equations (Crossman et al., 2021).
Application to the Thames and the Essex Colne
The INCA N and P versions of the models have been applied to the Rivers Thames and Essex Colne. In order to model the Thames, Jin et al. (2012) and Crossman et al. (2021) divided the river system into 22 reaches and sub-catchments from the source at Cricklade to the lowest weir on the freshwater downstream boundary at Teddington (Figure 1). Reach boundaries were selected at confluences, flow gauging stations and water quality monitoring stations. The sub-catchment boundaries were derived using a Digital Terrain Model (DTM). Daily time series of hydrologically effective rainfall (HER) and soil moisture deficit (SMD) were derived using the Meteorological Office Rainfall and Temperature data (Table 1) and the use of the PERSiST model to estimate hydrologically effective rainfall and soil moisture deficit (Futter et al., 2014). The effects of land surface and topography on flow are simulated through a semi-distributed approach incorporating the dynamics and characteristics of each sub-catchment. The residence times and flow rates in the soil and groundwater zones in the model are also essential to simulate flows.
For model calibration and validation, a prior general sensitivity analysis of the INCA model of the River Thames (Spear and Hornberger, 1980; Whitehead et al., 2015) was utilised initially to identify the key model parameters. The following parameters were identified as the most influential. In the hydrological sub model, rainfall excess proportion (the proportion of excess rain that is converted into direct runoff), soil water and ground water residence times (i.e., flow velocity for sub-superficial flow and base flow), maximum infiltration rate, flow-velocity coefficient (the coefficient of a power law used to calculate channel flow velocity from discharge), flow threshold for saturation excess direct runoff. Sensitive parameters for P simulations include the soil matrix sorption coefficient (which adjusts the sorption capacity of the soils), water column sorption coefficient (which adjusts the sorption capacity of the water column), and the streambed sorption coefficient (which adjusts the sorption capacity of the be sediment).
The feasible ranges of variation of these influential model parameters, informed by previous studies, were sampled randomly, and 10,000 different parameter sets were generated using a Monte Carlo sampling strategy based on the Metropolis Hastings algorithm. In general, the models fit well to the observed flow, N and P at both rivers (Figures 5, 6). The model statistical performance can be assessed using the observed values of flow and water quality at seven flow gauging stations along the Thames, using daily data for flow but fortnightly data for water quality. Kling Gupta Efficiency scores were used to assess the model performance, showing very good scores for flow and water quality, indicating the model is achieving a very good fit (Table 2; Figures 5, 6).
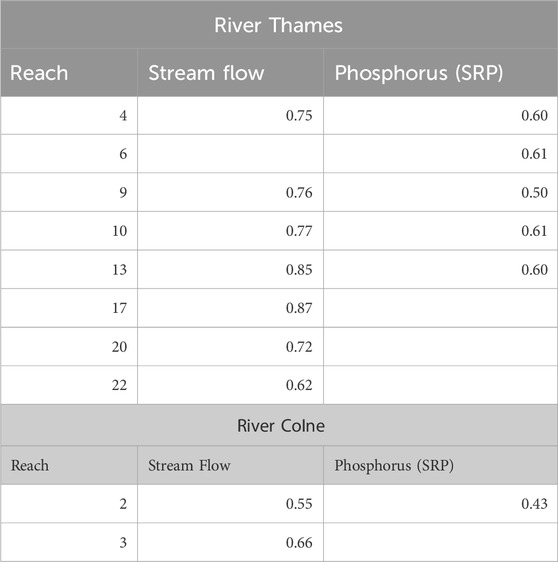
Table 2. Kling gupta efficiency (KGE) statistics for the rivers Thames and Colne.
Real-Time forecasting Capability
Real time forecasting of water quality has a long history (e.g., Whitehead et al., 1984) but until now it has been based on supplying upstream data from automatic monitors on upstream river reaches. This is open to further data and reliability issues as the early automatic water quality monitors were liable to routine breakdown and maintenance issues. Recent improvements in technology have significantly improved this situation (Bowes et al., 2016). However, this approach cannot predict future water quality based on from forecasts of catchment rainfall and temperature. Thus, it cannot take account of storm events. In this study we are using the satellite data in real-time to give an early indication of rainfall events and then feeding this data through the models to give up-to-date forecasts along the rivers with forecasts up to 3–5 days ahead. This then gives river control officers and water supply managers a means of anticipating future changes to facilitate timely management decision making.
A key question is how similar the satellite-derived estimates are to instrumental observations. In order to assess this, a set of simulations were made using satellite-derived rainfall and temperature and United Kingdom Met Office instrumental data. By comparing the flow and water quality using the two data sets, an idea of their relative accuracy can be obtained (Figure 7). The NSE statistics comparing water quality predictions derived from satellite versus instrumental (United Kingdom Met Office) data prediction are very strong with Nash Sutcliffe values for the Thames as 0.98, 0.99 and 0.87 for DO, P and flow respectively. This suggests that satellite-derived data are an excellent source of information for predicting flow and water quality in river systems.
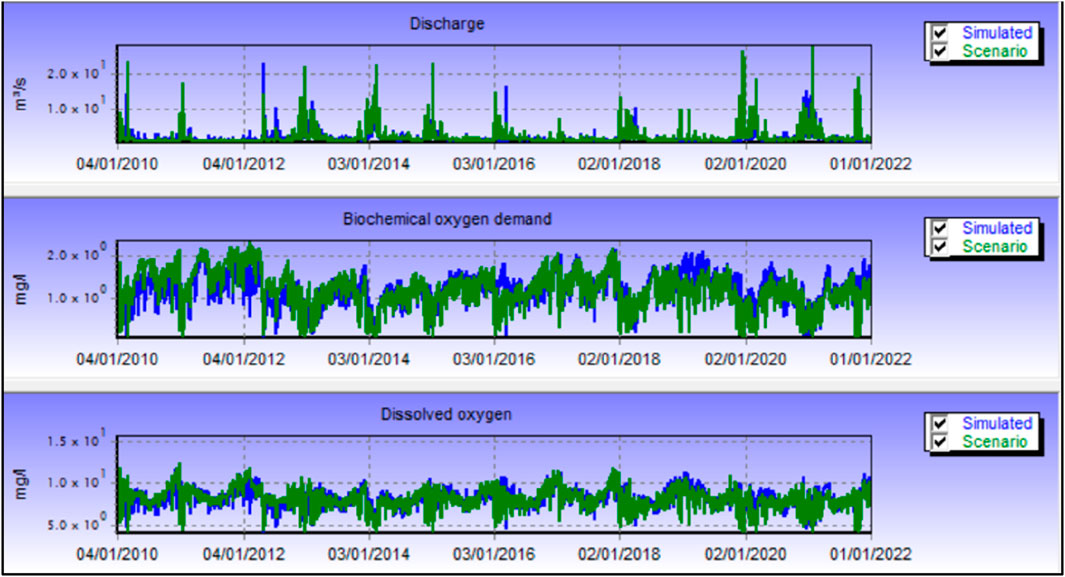
Figure 7. Simulations of discharge, biochemical oxygen demand and dissolved oxygen in the River Thames Teddington using Met Office (blue) and satellite derived (green) forcing data.
Biosensor technology to forecast river water toxicity
In terms of the early warning of pollution issues, one useful addition to the standard set of water quality attributes is that of toxicity. Poor water quality can have significant impacts on health, whether from organic chemical pollution, pathogens in the water, metals or cyanobacteria blooms. These toxic effects combine to attack biological systems such as stream animals and invertebrates, fish and people. There is no overall measure of this biological toxicity at present, but one new option is available utilising molecular biosensors (Rampley et al., 2017; Rampley et al., 2019).
Biosensors based on environmental bacteria can detect changes in water quality such as low oxygen concentration, toxicity from pollution, cyanobacteria and metals (see www.omb.co.uk). By genetically engineering the soil bacterium Acinetobacter baylyi, to constitutively express the gene cassette LUXCDABE, it releases measurable quantities of light, i.e., it luminesces (Figure 8). When the bacteria are exposed to clean water (i.e., it is unperturbed), the luminescence it releases is bright. However, if it is exposed to polluted water containing agents causing toxicity (e.g., metals, pesticides, herbicides, other pollutants, etc.) the luminescence decreases. Extremely toxic compounds can kill the cells, thereby reducing the luminescence to zero. This varying decrease in luminescence is a direct response to environmental stressors and can be used to indicate the presence and magnitude of contamination or pollution (Figure 8).
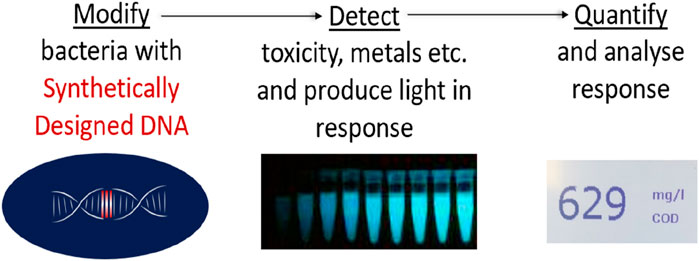
Figure 8. Luminescence response from the bacterial biosensors reflecting toxicity.
This biosensor technology gives a unique biological perspective on water quality; with enhanced speed, reduced cost and ethical benefits over traditional toxicity model organisms, e.g., macroinvertebrate and fish. By comparing the dose-dependent relationships between the biosensors and known pollutants, they can offer significant potential for monitoring water quality in freshwater rivers and lakes, with results achieved within 30 min.
Biosensors can detect environmental toxicity in real time, and therefore could be used as a valuable tool for understanding the effects of water quality changes on aquatic ecosystem health. We are currently examining the relationships between biosensor luminescence and published toxicity in macroinvertebrates and other aquatic organisms. For example, previous work demonstrated a significant correlation between Mugilogobius. Chulae (zebrafish) toxicity results and A. baylyi Tox2 response to heavy metals (Hg2+, Zn2+, Cu2+, and Cd2+) in seawater (Cui et al., 2018). This demonstrates the potential for bacterial-based biosensors to act as proxy measures for assessing ecosystem health.
From an analysis of water quality and toxicity data from the Thames and Colne, we have derived a relationship between toxicity and water quality, with a focus on N, P, temperature and cyanobacteria as follows:
This equation gives an R2 of 0.53 and can be used it to simulate toxicity in rivers (Figure 9). Toxicity is higher during winter as temperatures are lower, organic pollution levels are higher, DO is lower and there is increased flushing of pollutants into the river from agriculture and urban sources, due to wetter conditions and higher rainfall.
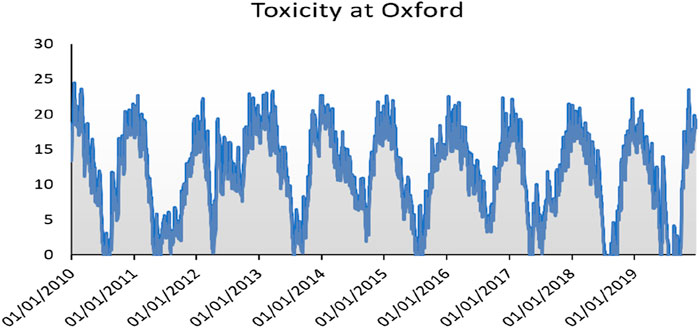
Figure 9. Modelled toxicity changes in the river Thames at Oxford (2010–2019).
Overall, integrating the biosensor data with real time water quality modelling and forecasting can play a critical role in monitoring and protecting the water quality of freshwater rivers and lakes by providing timely information on environmental stress and contamination.
Delivery of an online real time forecasting system
The main objective of this project has been to create a simulation and forecasting system driven by satellite data and the use of process-based knowledge of catchment dynamic behaviour for flow and water quality prediction. The aim has been to create historical simulations of flow and water quality, as well as a three to 5 day ahead forecast at any location down the river system, and to provide a tool that scientists, managers or the general public might use. An App has been created to deliver information to users and some illustrations of model simulations and forecasts are given in Figures 10–13 for the Thames and the Colne Rivers. Firstly, a dashboard shows the river set up map with options for plotting flow, nitrate, ammonia, phosphorus, DO and BOD (Figure 10). Then Figure 11 shows a time series plot of rainfall, flow and nitrate for the Colne over the past 10 days and a forecast ahead of 3 days. Note that the nitrate concentrations increase significantly as the flows increase due to the flushing out of nitrate from agricultural soils. These high nitrate levels are of concern to water authorities who need to supply reservoirs from the river water but are significantly constrained by the need to keep nitrate pollution to a minimum in the reservoirs. Figure 12 shows the River Thames flow and phosphorus data from January 2023 to September 2023, and illustrates variable flow conditions with a flooding event in early January providing dilution of incoming phosphorus from effluent discharges and agricultural runoff. After the storm event the phosphorus levels increase significantly over the summer as flows fall and there is less dilution of the polluting discharges from effluents and field runoff. Finally Figure 13 shows the profile of flow and nitrogen down the Colne, illustrating the increased runoff and hence flow down the system and the build-up of nitrate along the river system, illustrating the flushing out of nutrients from the source to the sea. Figure 14 is particularly interesting as it shows the CSO flows from a sewage treatment works discharge on two occasions. An App has been created (www.aquascope.com) to deliver information to users.
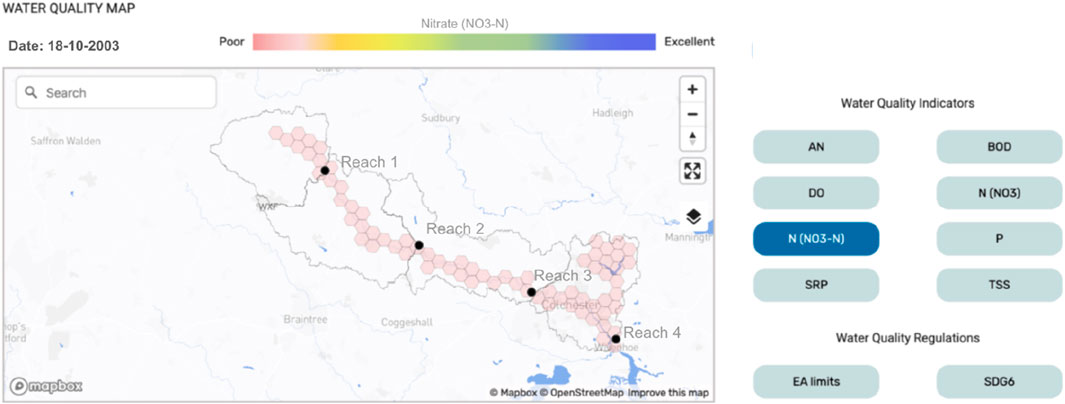
Figure 10. Dashboard for the River Colne (Essex) showing catchment, river system and flow and water quality elements to select for display.
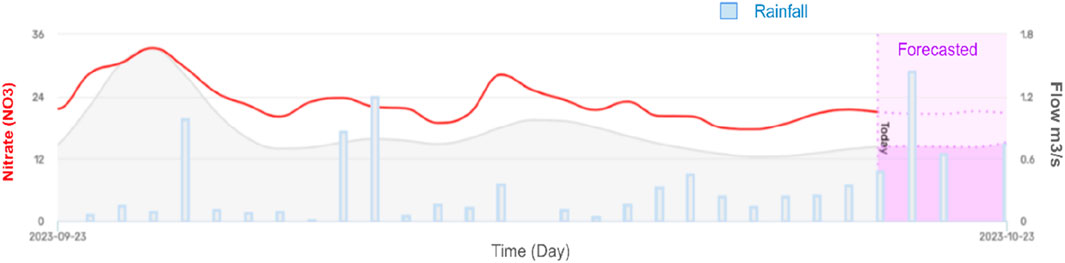
Figure 11. The App display showing input rainfall (bars), simulated discharge (grey) and nitrate concentrations (NO3−) and three day forecast conditions (pink) for the River Colne (Essex) at Colchester.
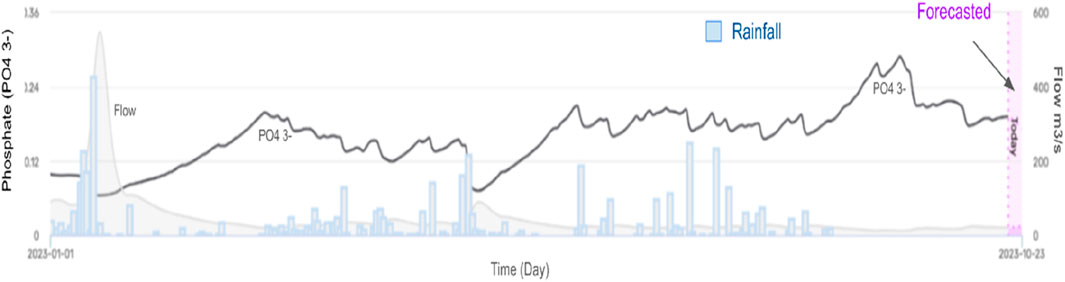
Figure 12. The App display showing input rainfall (bars), simulated discharge (grey) and phosphate concentrations (PO43−) and three day forecast conditions (pink) for the River Thames at Teddington. Notice the buildup of phosphate under low flow conditions.
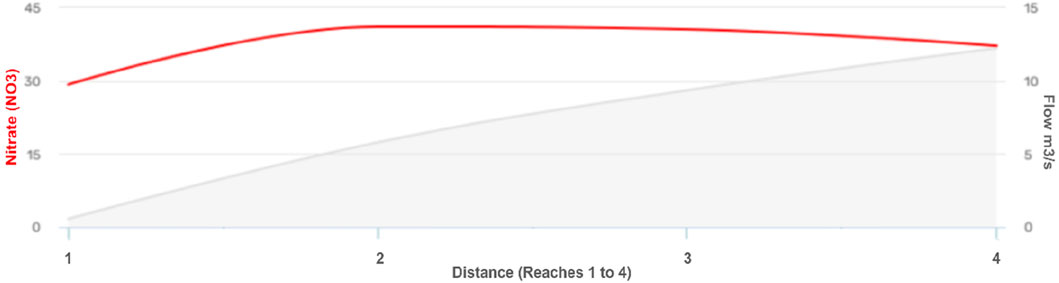
Figure 13. Spatial patterns of flow (grey) and nitrate (NO3−, red) down the River Colne (Essex) from source (reach 1) to sea (reach 4). Note the increasing trends in flow and nitrate concentrations when moving down the river.
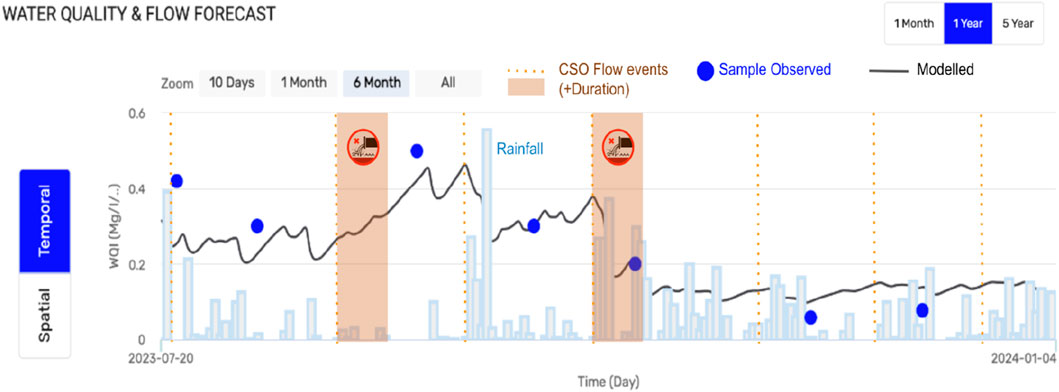
Figure 14. Time series of rainfall (bars), combined sewer overflow (CSO) events (brown bars) with observed (blue dots) and simulated phosphate concentrations (PO43−) for the River Thames at Oxford.
Discussion and conclusion
The system presented here integrates data from multiple sources. It enables satellite data, instrumental meteorological measurements, in-situ flow and water quality observations and multiple models to work together in real-time to generate historical patterns of behaviour and water quality forecasts for river systems. Model source code has been seamlessly incorporated into a cloud platform infrastructure. The models receive daily inputs of current and forecasted precipitation and temperature data that drive real-time, daily water quality forecasts. All data, including historical records and real-time observations, are stored in a time series database and automated workflows continually check observations against forecasts. The observed data acts as ground truth and helps fine-tune the model’s parameters and predictions. This dynamic calibration process ensures that the system adapts to changing environmental conditions and is continuously improving. The entire workflow operates within a Software as a Service (SaaS) platform, making it accessible to a wide range of users and organizations. Users can access the daily water quality forecasts through an intuitive and user-friendly interface, allowing them to set up early warning alerts and conduct scenario modelling.
Data management
The research presented here has utilised commercial cloud services, who provide the best infrastructure to operate state of the art solutions without the concern of investing in capital equipment nor large teams of domain specialists. By using infrastructure as a service (IaaS), the hardware running the system presented here is maintained by the cloud service provider, and any infrastructure failures are dealt with automatically. Traditional software solutions run on computers scaled to handle the biggest imagined workload and can often be very wasteful of resources. APIs from several data brokers are used to acquire inputs to the system presented here. These inputs include raw satellite imagery, processed data such as weather reports and forecasts on a planetary scale, as well as data collected on a hyper-local scale such as water quality monitors and citizen science observations. Ingested data is stored and fed into the different models (INCA P, INCA N, PERSiST, etc.) before the output is delivered to the mobile app. Once the data is acquired, the application processes the data through the several different models–INCA P, INCA N, PERSiST, etc.–and this rich set of data is then stored and made available to the application for reporting and visualisation.
Potential users and uses
There are many potential users for this real time forecasting system and service including:
1. Regulatory agencies (e.g., the United Kingdom Environment Agency) can make use of the system and App to help validate environment agency sampling at locations of interest that are not formal sample points for compliance, and for tracking pollution incidents that occur along river systems. For example, a release of a toxic load into the river could pose a real threat to fish and invertebrates or threaten public water supplies.
2. Water companies, who need to understand baseline river conditions near there CSO discharge points and potential impact of discharges due to spill events.
3. Water utilities needing insight to support work in their capital investment programmes, for upgrades of sewage works and for baseline river conditions pre and post project. Post project monitoring can help validate the benefit of investments.
4. Citizen scientists, river trusts and communities who want to understand water quality in the areas where they enjoy leisure activities.
5. Citizen scientists and academics who want to assess patterns of water quality.
6. Water utilities could use forecasts as the first element of the management of bankside reservoirs to provide early warning of changes in nitrogen and phosphorus levels that contribute to eutrophication with consequential problems for following treatment processes.
7. With climate change being of increasing concern, the models can be used to assess future climate change impacts on flow and water quality, (Whitehead et al., 2009). For example, with increasingly warmer conditions, nuisance algal blooms, e.g., cyanobacteria, will occur more frequently and hence a prediction or forecast of these on the river system would be very valuable. Similarly, an early warning of a parasite cryptosporidium washed into rivers from grazing cattle during high flow events.
The societal impact of providing forecast data that is easily and openly accessible will change how we see and value our rivers. Weather forecasts replaced the old ‘red sky at night’ tools, and we now frequently consult ever improving forecasts to plan our lives. The same should happen with water quality, to enable people to make better decisions based on better data for our own health and the health of rivers.
Data availability statement
The raw data supporting the conclusion of this article will be made available by the authors, without undue reservation.
Author contributions
PW: Conceptualization, Methodology, Software, Supervision, Visualization, Writing–original draft, Writing–review and editing. PE: Conceptualization, Data curation, Funding acquisition, Project administration, Supervision, Writing–original draft. GB: Data curation, Formal Analysis, Investigation, Writing–review and editing. SO’D: Data curation, Formal Analysis, Investigation, Software, Writing–review and editing. MF: Conceptualization, Methodology, Software, Writing–review and editing. SG: Data curation, Software, Supervision, Visualization, Writing–review and editing. CR: Formal Analysis, Investigation, Methodology, Supervision, Writing–original draft. CS: Project administration, Validation, Writing–review and editing. DJ: Visualization, Writing–review and editing. AH: Conceptualization, Visualization, Writing–review and editing. TP: Data curation, Writing–review and editing. GC: Project administration, Writing–review and editing.
Funding
The author(s) declare that no financial support was received for the research, authorship, and/or publication of this article.
Acknowledgments
We are extremely grateful to have received funding for this programme of work from the European Space Agency (ESA) under grant number 4000138823/22. Note the views expressed here represent the views of the authors and not necessarily those of the ESA.
Conflict of interest
Authors PW, PE, SO'D, SG, CS, AT, TP, and GC were employed by Aquascope Solutions Ltd.
The remaining authors declare that the research was conducted in the absence of any commercial or financial relationships that could be construed as a potential conflict of interest.
Publisher’s note
All claims expressed in this article are solely those of the authors and do not necessarily represent those of their affiliated organizations, or those of the publisher, the editors and the reviewers. Any product that may be evaluated in this article, or claim that may be made by its manufacturer, is not guaranteed or endorsed by the publisher.
References
Arnold, J. G., Moriasi, D. N., Gassman, P. W., Abbaspour, K. C., White, M. J., Srinivasan, R., et al. (2012). SWAT: model use, calibration, and validation. Trans. ASABE 55 (4), 1491–1508. doi:10.13031/2013.42256
Beck, M. B., and Young, P. C. (1976). Systematic identification of DO-BOD model structure. Proc. Am. Soc. Civ. Eng. J. Environ. Eng. Div. 102 (EES), 909–927. doi:10.1061/jeegav.0000554
Bieger, K., Arnold, J. G., Rathjens, H., White, M. J., Bosch, D. D., Allen, P. M., et al. (2017). Introduction to SWAT+, a completely restructured version of the soil and water assessment tool. JAWRA J. Am. Water Resour. Assoc. 53 (1), 115–130. doi:10.1111/1752-1688.12482
Bowes, M. G., Loewenthal, M., Read, D. S., Hutchins, M. G., Prudhomme, C., Armstrong, L. K., et al. (2016). Identifying multiple stressor controls on phytoplankton dynamics in the River Thames (UK) using high-frequency water quality data. Sci. Total Environ. 569–570, 1489–1499. doi:10.1016/j.scitotenv.2016.06.239
Bussi, G., Dadson, S. J., Prudhomme, C., and Whitehead, P. G. (2016). Modelling the future impacts of climate and land-use change on suspended sediment transport in the River Thames (UK). J. hydrology 542, 357–372. doi:10.1016/j.jhydrol.2016.09.010
Bussi, G., Darby, S. E., Whitehead, P. G., Jin, L., Dadson, S. J., Voepel, H. E., et al. (2020). Impact of dams and climate change on suspended sediment flux to the Mekong delta. Sci. Total Environ. 755 (1), 142468. doi:10.1016/j.scitotenv.2020.142468
Bussi, G., Janes, V., Whitehead, P. G., Dadson, S. J., and Holman, I. P. (2017). Dynamic response of land use and river nutrient concentration to long-term climatic changes. Sci. Total Environ. 590, 818–831. doi:10.1016/j.scitotenv.2017.03.069
Bussi, G., Shawal, S., Hossain, M. A., Whitehead, P. G., and Jin, L. (2023). Multibranch modelling of flow and water quality in the dhaka River System, Bangladesh: impacts of future development plans and climate change. Water 15, 3027. doi:10.3390/w15173027
Bussi, G., and Whitehead, P. G. (2020). Impacts of droughts on low flows and water quality near power stations. Hydrological Sci. J. 65, 898–913. doi:10.1080/02626667.2020.1724295
Cole, S. J., and Moore, R. J. (2009). Distributed hydrological modelling using weather radar in gauged and ungauged basins. Adv. Water Resour. 32 (7), 1107–1120. doi:10.1016/j.advwatres.2009.01.006
Crossman, J., Bussi, G., Whitehead, P. G., Butterfield, D., Lannergård, E., and Futter, M. N. (2021). A new, catchment-scale integrated water quality model of phosphorus, dissolved oxygen, biochemical oxygen demand and phytoplankton: INCA-Phosphorus Ecology (PEco). Water 13 (5), 723. doi:10.3390/w13050723
Cui, Z. L. X., Jiang, H., Li, Q., Xu, G., Sun, C., Zheng, L., et al. (2018). Application of a bacterial whole cell biosensor for the rapid detection of cytotoxicity in heavy metal contaminated seawater. Chemosphere 200, 322–329. doi:10.1016/j.chemosphere.2018.02.097
Fewtrell, L., and Kay, D. (2015). Recreational water and infection: a review of recent findings. Curr. Environ. health Rep. 2, 85–94. doi:10.1007/s40572-014-0036-6
Fu, B., Merritt, W. S., Croke, B. F. W., Weber, T. R., and Jakeman, A. J. (2019). A review of catchment-scale water quality and erosion models and a synthesis of future prospects. Environ. Model. Softw. 114, 75–97. doi:10.1016/j.envsoft.2018.12.008
Futter, M. N., Erlandsson, M. A., Butterfield, D., Whitehead, P. G., Oni, S. K., and Wade, A. J. (2014). PERSiST: a flexible rainfall-runoff modelling toolkit for use with the INCA family of models. Hydrol. Earth Syst. Sci. 18, 855–873. doi:10.5194/hess-18-855-2014
Futter, M. N., Löfgren, S., Köhler, S. J., Lundin, L., Moldan, F., and Bringmark, L. (2011). Simulating dissolved organic carbon dynamics at the Swedish integrated monitoring sites with the integrated catchments model for carbon, INCA-C. Ambio 40, 906–919. doi:10.1007/s13280-011-0203-z
Futter, M. N., Poste, A. E., Butterfield, D., Dillon, P. J., Whitehead, P. G., Dastoor, A. P., et al. (2012). Using the INCA-Hg model of mercury cycling to simulate total and methyl mercury concentrations in forest streams and catchments. Sci. total Environ. 424, 219–231. doi:10.1016/j.scitotenv.2012.02.048
Gorelick, N., Hancher, M., Dixon, M., Ilyushchenko, S., Thau, D., and Moore, R. (2017). Google Earth engine: planetary-scale geospatial analysis for everyone. Remote Sens. Environ. 202, 18–27. doi:10.1016/j.rse.2017.06.031
Huffman, G. J., Stocker, E. F., Bolvin, D. T., Nelkin, E. J., and Jackson, T. (2019). GPM IMERG final precipitation L3 half hourly 0.1 degree x 0.1 degree V06, greenbelt, MD, goddard Earth sciences data and information services center (GES DISC). Available at: https://disc.gsfc.nasa.gov/datasets/GPM_3IMERGHH_06/summary (Accessed October 13, 2023).
Jin, L., Whitehead, P. G., Bussi, G., Hirpa, F., Taye, M. T., Yosef, A., et al. (2021). Natural and anthropogenic sources of salinity in the Awash River and Lake Beseka (Ethiopia): modelling impacts of climate change and lake-river interactions. J. Hydrology Regional Stud. 36, 100865. doi:10.1016/j.ejrh.2021.100865
Jin, L., Whitehead, P. G., Futter, M. N., and Lu, Z. (2012). Modelling the impacts of climate change on flow and nitrate in the River Thames: assessing potential adaptation strategies. Hydrology Res. 43 (6), 902–916. doi:10.2166/nh.2011.080
Khan, S., Sinha, R. P. W., Sarkar, S., Jin, L., and Futter, M. N. (2018). Flows and sediment dynamics in the Ganga River under present and future climate scenarios. Hydrological Sci. J. 63 (5), 763–782. doi:10.1080/02626667.2018.1447113
Kroeze, C., Gabbert, S., Hofstra, N., Koelmans, A. A., Li, A., Löhr, A., et al. (2016). Global modelling of surface water quality: a multi-pollutant approach. Curr. Opin. Environ. Sustain. 23, 35–45. doi:10.1016/j.cosust.2016.11.014
Lafon, T., Dadson, S., Buys, G., and Prudhomme, C. (2013). Bias correction of daily precipitation simulated by a regional climate model: a comparison of methods. Int. J. Climatol. 33 (6), 1367–1381. doi:10.1002/joc.3518
Muñoz-Sabater, J. (2019). ERA5-Land monthly averaged data from 1950 to present, Copernicus climate change service (C3S) climate data store (CDS). Available at: https://cds.climate.copernicus.eu/cdsapp#!/dataset/10.24381/cds.68d2bb30?tab=overview (Accessed October 13, 2023).
Rampley, C. P. N., Davison, P. A., Qian, P., Preston, G. M., Hunter, C. N., Thompson, I. P., et al. (2017). Development of Sim-Cells as a novel chassis for functional biosensors. Nat. Sci. Rep. 7, 7261. doi:10.1038/s41598-017-07391-6
Rampley, C. P. N., Whitehead, P. G., Softley, L., Hossain, M. A., Jin, L., David, J., et al. (2019). River toxicity assessment using molecular biosensors: heavy metal contamination in the turag-balu-buriganga River systems, dhaka, Bangladesh. Sci. Total Environ. 703, 134760. doi:10.1016/j.scitotenv.2019.134760
Sharma, S., Futter, M. N., Spence, C., Venkiteswaran, J. J., and Whitfield, C. J. (2023). Modelling Subarctic watershed dissolved organic carbon response to hydroclimatic regime. Sci. Total Environ. 857, 159382. doi:10.1016/j.scitotenv.2022.159382
Spear, R. C., and Hornberger, G. M. (1980). Eutrophication in peel inlet—II. Identification of critical uncertainties via generalized sensitivity analysis. Water Res. 14, 43–49. doi:10.1016/0043-1354(80)90040-8
Streeter, H. W., and Phelps, E. B. (1925). A study of the pollution and natural purification of the Ohio River, Bull. 146. Washington, D.C.: U.S. Public Health Service.
M. A. Sutton, C. M. Howard, J. W. Erisman, G. Billen, A. Bleeker, P. Grennfeltet al. (2011). The European nitrogen assessment: sources, effects and policy perspectives (Cambridge: Cambridge University Press).
Tang, T., Strokal, M., van Vliet, M. T., Seuntjens, P., Burek, P., Kroeze, C., et al. (2019). Bridging global, basin and local-scale water quality modeling towards enhancing water quality management worldwide. Curr. Opin. Environ. Sustain. 36, 39–48. doi:10.1016/j.cosust.2018.10.004
Tuholske, C., Halpern, B. S., Blasco, G., Villasenor, J. C., Frazier, M., and Caylor, K. (2021). Mapping global inputs and impacts from of human sewage in coastal ecosystems. PloS one 16 (11), e0258898. doi:10.1371/journal.pone.0258898
Wade, A. J., Durand, P., Beaujouan, V., Wessel, W. W., Raat, K. J., Whitehead, P. G., et al. (2002a). A nitrogen model for European catchments: INCA, new model structure and equations. Hydrology Earth Syst. Sci. 6, 559–582. doi:10.5194/hess-6-559-2002
Wade, A. J., Whitehead, P. G., and Butterfield, D. (2002b). The Integrated Catchments model of Phosphorus dynamics (INCA-P), a new approach for multiple source assessment in heterogeneous river systems: model structure and equations. HESS 6 (3), 583–606. doi:10.5194/hess-6-583-2002
Wade, A. J., Whitehead, P. G., Hornberger, G. M., Snook, D., and Flynn, N. (2002c). On modelling the impacts of phosphorus stripping at sewage works on in-stream phosphorus and macrophyte/epiphyte dynamics: a case study for the River Kennet. Sci. Tot Environ. 282-283, 395–415. doi:10.1016/s0048-9697(01)00926-3
Whitehead, P. G., Barbour, E., Futter, M. N., Sarkar, S., Rodda, H., Caesar, J., et al. (2015). Impacts of climate change and socio-economic scenarios on flow and water quality of the Ganges, Brahmaputra and Meghna (GBM) river systems: low flow and flood statistics. Environ. Sci. Process. Impacts 17, 1057–1069. doi:10.1039/c4em00619d
Whitehead, P. G., Caddy, D. E., and Templeman, R. F. (1984). An on-line monitoring, data management and forecasting system for the Bedford Ouse river basin. Sci. Tech. 16, 295–314. doi:10.2166/wst.1984.0139
Whitehead, P. G., Johnes, P. J., and Butterfield, D. (2002). Steady state and dynamic modelling of nitrogen in the River Kennet: impacts of land use change since the 1930s. Sci. Totl. Env. 282-283, 417–434. doi:10.1016/s0048-9697(01)00927-5
Whitehead, P. G., Wilby, R., Battarbee, R. W., Kernan, M., and Wade, A. J. (2009). A review of the potential impacts of climate change on surface water quality. Qual. Hydrological Sci. J. 54 (1), 101–123. doi:10.1623/hysj.54.1.101
Whitehead, P. G., Wilson, E. J., and Butterfield, D. (1998a). A semi-distributed ntegrated itrogen model for multiple source assessment in tchments (INCA): Part I — model structure and process equations. Sci. Total Environ. 210-211, 547–558. doi:10.1016/s0048-9697(98)00037-0
Whitehead, P. G., Wilson, E. J., Butterfield, D., and Seed, K. (1998b). A semi-distributed integrated flow and nitrogen model for multiple source assessment in catchments (INCA): Part II — application to large river basins in south Wales and eastern England. Sci. Total Environ. 210-211, 559–583. doi:10.1016/s0048-9697(98)00038-2
Keywords: water quality, rivers, catchments, pollution control, real-time forecasting, modelling, community action, toxicity
Citation: Whitehead PG, Edmunds P, Bussi G, O’Donnell S, Futter M, Groom S, Rampley C, Szweda C, Johnson D, Triggs Hodge A, Porter T and Castro G (2024) Real-time water quality forecasting in rivers using satellite data and dynamic models: an online system for operational management, control and citizen science. Front. Environ. Sci. 12:1331783. doi: 10.3389/fenvs.2024.1331783
Received: 01 November 2023; Accepted: 19 March 2024;
Published: 12 April 2024.
Edited by:
Buddhi Wijesiri, Queensland University of Technology, AustraliaReviewed by:
Michael Rode, Helmholtz Centre for Environmental Research, GermanyKatri Rankinen, Finnish Environment Institute (SYKE), Finland
Copyright © 2024 Whitehead, Edmunds, Bussi, O’Donnell, Futter, Groom, Rampley, Szweda, Johnson, Triggs Hodge, Porter and Castro. This is an open-access article distributed under the terms of the Creative Commons Attribution License (CC BY). The use, distribution or reproduction in other forums is permitted, provided the original author(s) and the copyright owner(s) are credited and that the original publication in this journal is cited, in accordance with accepted academic practice. No use, distribution or reproduction is permitted which does not comply with these terms.
*Correspondence: Paul G. Whitehead, paul.whitehead@ouce.ox.ac.uk