


1. Introduction
The noise produced by fan systems is a general concern that spans across a wide range of industries, including aerospace (Peake & Parry Reference Peake and Parry2012), maritime (Xiong et al. Reference Xiong, Rui, Lu, Zhang and Huang2022) and household appliances (Newman Reference Newman2015). This issue is particularly problematic in the aerospace sector, where a significant amount of energy introduced by the incoming turbulent flow is transferred into rotating fans, generating what is known as turbulence-ingestion noise. There has been renewed interest in the ducted fan propulsion systems (or propulsors) in the aerospace sector, particularly due to the advancement in powerful electric motors. Notable examples of this trend include projects such as the Bell X-22A, Embraer X, Airbus E-fan, Green Jet and Hybrid Air Vehicle, which are pioneering the development of ducted fan systems for future aircraft concepts (Zhang & Barakos Reference Zhang and Barakos2020).
Next-generation aircraft commonly feature installed ducted fan propulsion systems, e.g. ONERA NOVA (Romani et al. Reference Romani, Ye, Avallone, Ragni and Casalino2020), NASA/MIT Aurora D8, Airbus Nautilus, MIT SAX-40 and Lilium Jet. These configurations are designed to operate with the propulsor adjacent to the fuselage or wing while partially ingesting turbulent boundary layer flow. The installed BLI ducted fans are becoming increasingly popular due to their potential fuel saving benefits (Hall et al. Reference Hall, Huang, Uranga, Greitzer, Drela and Sato2017). However, their impact on noise levels can vary depending on their specific designs and configurations. This impact is due to the fact that the incoming distorted flow field generated by the particular airframe design can highly influence the noise characteristics.
The noise signatures in BLI ducted propulsion systems are quite complex, arising due to various factors (see figure 1) (Peake & Parry Reference Peake and Parry2012). Significant attention has been directed towards the investigation of turbulence-ingestion noise generated from fans/propellers/rotors, encompassing both open (or non-ducted) (Sevik Reference Sevik1974; Majumdar & Peake Reference Majumdar and Peake1998; Murray et al. Reference Murray, Devenport, Alexander, Glegg and Wisda2018) and ducted (or shrouded) (Majumdar & Peake Reference Majumdar and Peake1998; Romani et al. Reference Romani, Ye, Avallone, Ragni and Casalino2020; Langford et al. Reference Langford, Fleming, Walton, Schwartz and Wisda2023) configurations. The noise characteristics of fans ingesting turbulent boundary layer flows are significantly influenced by the nature of incoming flows, whether they are planar, characterised by zero pressure gradients (Murray et al. Reference Murray, Devenport, Alexander, Glegg and Wisda2018), or non-planar, characterised by adverse streamwise pressure gradients (Romani et al. Reference Romani, Ye, Avallone, Ragni and Casalino2020). The planar boundary layers typically form over flat surfaces, while non-planar boundary layers develop over curved surfaces (see figure 1). The research on the BLI configuration is quite mature (Majumdar & Peake Reference Majumdar and Peake1998; Murray et al. Reference Murray, Devenport, Alexander, Glegg and Wisda2018). However, studies focused on the non-planar BLI configurations, particularly within the ducted fan systems, are notably limited (Romani et al. Reference Romani, Ye, Avallone, Ragni and Casalino2020). Given the complex interactions of a distorted flow field and various noise sources (see figure 1), there is a need to reexamine the physics of noise generated by non-planar BLI ducted fans. This research gap is the main focus of the current study.

Figure 1. (a) Novel boundary layer ingesting (BLI) propulsion system schematic – ONERA NOVA, a large-scale conventional transport aircraft, and the Lilium Jet, a small-scale electric vertical take-off/landing aircraft. (b) Complex noise source illustration in an adverse pressure gradient BLI ducted fan.
The purpose of this study is to comprehensively examine various contributions to the far-field noise radiation in a ducted fan ingesting a turbulent boundary layer, by employing noise source separation strategies as used by Ganz et al. (Reference Ganz, Joppa, Patten and Scharpf1998). This study considers an installed ducted fan configuration mounted adjacent to a curved S-plate, which generates an adverse streamwise pressure gradient boundary layer flow. This set-up mimics a configuration similar to those used in the ONERA NOVA, which has the partially buried ducted fan arrangement (see figure 1). By gaining an in-depth understanding of the noise radiation mechanisms in the BLI ducted fans, industrial guidelines can be developed for quieter airframe-integrated propulsion systems in future aircraft concepts.
The paper is structured as follows. Section 2 discusses the test set-up for a BLI ducted fan. Section 3 provides a comprehensive discussion of the results, covering the in-depth aeroacoustic assessments. Finally, § 4 summarises the major findings of this study.
2. Experimental set-up
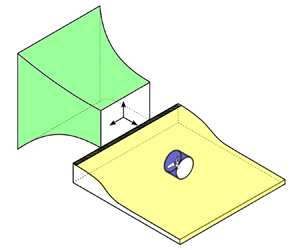
The BLI ducted fan system is chosen to represent the partially buried engines in the aerospace sector. The test rig comprises an electric ducted fan mounted next to a curved wall, assembled inside an aeroacoustics wind tunnel (see figure 2a), for a detailed aeroacoustics investigation.

Figure 2. (a) Boundary layer ingesting ducted fan test rig inside the aeroacoustics wind tunnel facility at the University of Bristol (see supplementary movie 1 available at https://doi.org/10.1017/jfm.2024.134 for the measurement set-up). (b) Ducted fan geometrical parameters.
2.1. Ducted fan
The ducted fan test rig is a scaled-down version of the 3-bladed Bell X-22A design (Gamse & Mort Reference Gamse and Mort1967), featuring certain modifications. Unlike typical industry set-ups, this rig features a straight duct with a constant cross-sectional area (see figure 2b). The internal unit of a ducted fan system includes a fan mounted on a hub, supported by strut structures. The fan is designed based on the NACA-23012 blade profile and has a diameter ( $D$) of
  $254\ \mathrm {mm}$. The duct is manufactured from CNC machined aluminium, while the fan is fabricated using rapid prototyping with the multi-jet fusion technology and nylon PA-12 material. The blade chord (
 $c$) and pitch angle (
 $\alpha$) distribution are defined based on the original Bell X-22A design at default pitch angle settings (Gamse & Mort Reference Gamse and Mort1967) (see figure 2b). The fan pitch,
  $P(=2 {\rm \pi}r \tan \alpha )$, is obtained as
  $0.22$ at
  $70\,\%$ of the radial position (
 $r$), resulting in a pitch-to-diameter ratio (
 $P/D$) of
  $0.85$. In this experiment, the tip-clearance-to-diameter ratio (
 $d/D$) is set to
  $0.2\,\%$.
2.2. Curved S-plate
An experimental S-plate set-up with streamlined wall curvature is designed to generate an adverse pressure gradient boundary layer (see figure 2a). This S-plate set-up represents a portion of the fuselage where the ducted fans are typically embedded. The profile of the S-plate features a convex wall in the upstream region, a concave wall in the intermediate region and a flat wall in the downstream region (see figures 2a and 3a). The profile of the curved section is mathematically defined using a cubic Bezier function, governed by a set of four control points. These control points are defined as follows:  $(0, 0.2), (0.75, 0.2),(0.25, 0)$ and
  $(1, 0)$, where the coordinates are given in normalised units relative to the streamwise length of the curved section. This Bezier curve formulation allows for a smooth transition from the convex to the concave regions, as well as smooth transitions to the flat regions of the S-plate, avoiding local gradient discontinuities. A strip of 80-grit sandpaper with a width of 25 mm and a thickness of 2 mm was positioned at the start of the S-plate to initialise the flow and trip the development of the boundary layer.

Figure 3. (a) Static pressure taps installation along S-plate midspan. (b) Mean wall-pressure variation along S-plate midspan without ducted fan (see supplementary movie 2 for tuft visualisation). Here, CP is the pressure coefficient. (c) Hot-wire mean velocity contour map of flow along S-plate (without ducted fan); with the inset showing the size of the boundary layer ( $\delta$) at axial inflow velocity
  $(U_\infty) = 32\ {\rm m}\ {\rm s}^{-1}$. (d) Comparison of fan thrust coefficient (
 $C_T$) between the ducted fan in isolated (without S-plate) and installed (with S-plate) configurations (see table 1). The
  $C_T$ results are obtained for an axial inflow velocity
  $(U_\infty)$ ranging from
  $8$ to
  $32\ {\rm m}\ {\rm s}^{-1}$.
Table 1. Test matrix.

2.3. Instrumentation
The BLI ducted fan test rig is assembled in the University of Bristol aeroacoustics facility (see figure 2 and supplementary movie 1). This facility features a closed-circuit, open-jet anechoic wind tunnel with an open test section. The nozzle exit dimension is  $0.5\ \mathrm {m} \times 0.775\ \mathrm {m}$, and the nozzle has a contraction ratio of 8.4 : 1. The wind tunnel can achieve flow velocities of up to
  $40\ {\rm m}\ {\rm s}^{-1}$ with turbulence levels as low as
  $0.1\,\%$. The anechoic chamber allows for measurements down to
  $160\ \mathrm {Hz}$, in accordance with the ISO 3745 standardised testing procedures (Mayer et al. Reference Mayer, Jawahar, Szöke, Ali and Azarpeyvand2019). The facility is equipped with a far-field microphone array to capture far-field noise radiation from the test rig (see figure 2a). The array consists of GRAS 40PL piezoelectric microphones, which are mounted at regular intervals of
  $5^{\circ }$ between microphone polar angles (
 $\theta$)
  $40^{\circ }$ and
  $140^{\circ }$. These microphones have a dynamic range of
  $32\ \mathrm {dBA}$ to
  $150\ \mathrm {dB}$, maintaining a flat frequency response between
  $10\ \mathrm {Hz}$ and
  $10\ \mathrm {kHz}$. To ensure accuracy, each microphone is calibrated using a GRAS 42AA piston phone calibrator before the tests.
The curved S-plate is instrumented with 23 pressure taps along its midspan (see figure 3a). Additionally, a probe is installed below the nozzle to record ambient static pressure. The hub of the ducted fan houses an electric motor (AT4125 T-MOTOR), which drives the fan, and a load cell (ATI F/T sensor mini 40), which measures the fan loading. The constant temperature anemometry (CTA) measurement is also carried out to assess the flow field along the S-plate. The CTA module is composed of a Dantec 55P16 single hot-wire probe.
The data acquisition is performed using PXIe-4499 modules mounted into a PXIe-1082 chassis from National Instruments. The load, noise and flow measurement data are sampled at  $2^{16}\ \mathrm {Hz}$ for
  $32$ seconds, and surface static pressure measurement data are sampled at
  $400\ \mathrm {Hz}$ for the same duration. The pressure measurements are recorded using a microDAQ pressure scanner (
 $\mu \mathrm {DAQ2}$-
 $\mathrm {32DTC}$) from Chell Instruments. It is important to note that both the load cell and pressure tap readings are zeroed before the initiation of flow and a Dantec 54H10 calibrator was used to calibrate the hot-wire probes.
2.4. Analysis test matrix
The placement of the ducted fan on the S-plate (see figure 2a) was determined based on the observed S-plate flow characteristics. During the wind tunnel tests, the static mean wall-pressure distribution was recorded using pressure taps, and the flow pattern was visualised with wool tufts and hot-wire data (see figure 3b and 3c, respectively). The static pressure tap measurements are plotted in terms of the pressure coefficient,  $C_p (= ({\bar {p}-p_\infty }) / {0.5 \rho _{\infty } U_{\infty }^2} )$ (see figure 3b), where
  $\bar {p}$ is the average measured static pressure (
 $\mathrm {Pa}$),
  $p_{\infty }$ the free stream static pressure (
 $\mathrm {Pa}$) and
  $\rho$ the density of air (
 ${\rm kg}\ {\rm m}^{-3}$). When the flow is traversed along the S-plate, an adverse streamwise pressure gradient is observed in the concave region, specifically at a position approximately
  $0.8\ \mathrm {m}$ downstream of the nozzle exit. This leads to boundary layer growth, which, in turn, results in the formation of large-scale, three-dimensional stretched vortices. The ducted fan is positioned adjacent to the S-plate at this specific location (see figure 2a). To illustrate the extent to which the ducted fan is immersed in the boundary layer flow at this location, a velocity contour map is generated based on the hot-wire measurement data. The velocity profile indicates that approximately one quarter of the ducted fan is immersed within the adverse pressure gradient flow, which measures approximately
  $70\ \mathrm {mm}$ in thickness (see figure 3c). It is important to note that the velocity contour based on the hot-wire test is only presented for the isolated S-plate without the ducted fan. The representation of the ducted fan in figure 3(c) is merely illustrative, intended to demonstrate the extent to which the fan is immersed in the boundary layer. It is worth mentioning that the operational presence of the ducted fan within installed configurations, operating across both low and high thrust regimes, alters the characteristics of the boundary layer flow. However, an in-depth analysis of these effects lies beyond the scope of the present paper and will be dealt with in future work.
The analysis in this study focused on a forward flight condition over a wide range of advance ratios,  $J(={U_\infty }/{n D})$, corresponding to axial inflow velocities (
 $U_\infty$) spanning from
  $8$ to
  $32\ {\rm m}\ {\rm s}^{-1}$. This velocity range covers both the low and high thrust regimes, as shown in the fan aerodynamic thrust profile (see figure 3d). The fan thrust data obtained from load cell measurements at various fan rotational speeds are expressed in terms of the thrust coefficient,
  $C_{T} ( = {T}/{\rho n^{2} D^{4}} )$, where
  $T$ is the fan aerodynamic thrust and
  $n (=N/60)$ the fan rotational speed (rotations per second). The most attention is paid to two distinct fan rotational speeds (
 $N$), i.e.
  $6000$ and
  $11\,000\ \mathrm {r.p.m.}$ Two configurations of ducted fan systems are considered in this study, namely, the isolated (without S-plate) and the installed (with S-plate) ducted fans (see table 1). To characterise duct acoustics, two additional configurations are further considered, namely, the isolated (without S-plate) and the installed (with S-plate) duct. It is important to note that both the fan and strut components are removed from the isolated and installed duct configurations.
2.5. Additional comments on the installed ducted fan configuration
The installation of the ducted fan adjacent to the airframe (S-plate) influences its operational performance by altering the inflow conditions. Unlike the uniform inflow experienced in the isolated configuration, the inflow becomes non-uniform in the installed configuration due to the presence of the adverse pressure gradient boundary layer developed over the S-plate. It is important to note that the pitch angle distribution in the installed configuration remains identical to that of the isolated configuration (as depicted in figure 2b) since the blade geometry is unchanged. However, the effective angle of attack distribution can experience alterations in the installed configurations, as these are dependent on the relative flow velocities encountered by each blade section. These adjustments, more pronounced near the blade tips immersed in the boundary layer, respond to the non-uniform inflow conditions. This leads to variations in the local angles of attack and velocity profiles as the fan blade sections pass through the boundary layer, impacting both aerodynamic loading and noise generation. A notable consequence of these non-uniform inflow conditions in the installed configuration is the cyclic changes in aerodynamic loading and a lowering in overall averaged inflow velocity, as well as a reduction in local velocities at certain disk sections (Aljabari Reference Aljabari1987). The reduction in averaged inflow velocity decreases the fan's effective advance ratio, which slightly increases the aerodynamic thrust, as depicted in figure 3(d). This observation is consistent with the findings of the existing research (Aljabari Reference Aljabari1987).
The effects of the installed ducted fan configuration, i.e. lowering in averaged and local flow velocities, have not been studied independently in the current study; however, the global noise radiations due to the installation effects were examined. Such studies might require a fan design with varying pitch settings, which we may consider in future studies. Furthermore, the fan used in this study was not designed specifically for operation within the boundary layer effects introduced by the S-plate wall. Instead, the design was chosen based on the fan geometry used in the Bell X-22A, a real-life example of a ducted fan aircraft. The selection was further justified by its pitch-to-diameter ratio ( $P/D$) of
  $0.85$, enabling the examination of the ducted fan across a broad and practical range of axial inflow velocities with an advance ratio range from
  $0.17$ to
  $1.26$, covering also the windmilling condition (
 $J \simeq P/D$). Optimising fan design for operation in boundary layer flows poses a unique challenge, and it is hoped that the current findings will contribute valuable insights into addressing this design challenge in future boundary layer ingestion research.
3. Results and discussions
The noise characterisation of the BLI ducted fan is evaluated using the acoustic pressure data captured using the far-field microphones. The acoustic pressure data are then described in sound pressure level (SPL), defined as  $\mathrm {SPL} = 10 \times \log _{10} ( {\phi _{PP} \times \Delta f}/{p_{ref}^2})$, where
  $\phi _{PP}$ is the power spectral density (PSD) based on the Welch's method, and
  $p_{ref}$ the reference sound pressure in air (
 $20 \times 10^{-6}\ \mathrm {Pa}$). The frequency resolution (
 $\Delta f$) was set to
  $8\ \mathrm {Hz}$.
3.1. Duct aeroacoustics
The first step is to analyse the duct noise radiation field in the absence of internal components, i.e. fan blades, hub and struts. The planar and non-planar waves are the two acoustic fields present within the ducts (Guerin Reference Guerin2017). The nature of the duct acoustic fields can be characterised by their spatial dimensions through the cutoff frequency  $f_{c} (= {0.59 \times a_0}/{D_i})$ (where
  $a_0 = 346\ {\rm m}\ {\rm s}^{-1}$ is the speed of sound in air, and
  $D_i$ the duct internal diameter). The duct noise radiates primarily as planar waves when the excitation frequencies are lower than the cutoff frequency of the duct, i.e.
  $f_s < f_c$. Conversely, the duct noise radiates as non-planar waves when the excitation force frequencies exceed the cutoff frequency of the duct, i.e.
  $f_s > f_c$. Notably, while some planar wave energy remains confined inside the duct, another portion transmits through open terminations, ultimately contributing to far-field noise radiation (Levine & Schwinger Reference Levine and Schwinger1948).
Figure 4 presents the contour spectra of duct noise radiation in both the isolated (without S-plate) and installed (with S-plate) configurations. The spectra contain both planar and non-planar duct noise sources, with planar noise (with ascending trend) being more pronounced, especially below the cutoff frequency ( $\,f_c=790\ \mathrm {Hz}$), as illustrated through the island contour in figure 4(a). To gain deeper insights into planar duct noise radiation, the noise in two isolated configurations is assessed, i.e. a shorter duct (
 $L_d = 0.17\ \mathrm {m}$) and a longer one (
 $L_d = 0.5\ \mathrm {m}$) (see figure 5). While both configurations show noise with an ascending trend, the longer duct had a pronounced peak at
  $20\ {\rm m}\ {\rm s}^{-1}$. The mechanism behind the generation of this distinctive peak for the planar duct noise is explained below.

Figure 4. Contour maps illustrating the noise variation with axial inflow velocity ( $U_\infty$) for a duct in two configurations: (a) isolated (without S-plate) and (b) installed (with S-plate) (see table 1). The results are from measurements at
  $\theta = 90^{\circ }$ microphone position.

Figure 5. (a) The SPL comparison of short ( $L_d=0.17\ \mathrm {m}$) and long (
 $L_d=0.50\ \mathrm {m}$) ducts. (b) Maximum SPL for short and long ducts at a wide range of axial inflow velocities (
 $U_\infty$). Inset shows the velocity power spectral density (
 $\phi _{UU}$) as a function of Strouhal number (St) for long duct at
  $U_\infty = 20\ {\rm m}\ {\rm s}^{-1}$. Data are obtained at
  $40\ \mathrm {mm}$ downstream of the duct exit using a hot-wire;
  $St=0.2$ corresponds to primary duct blunt-trailing-edge vortex shedding.
The duct considered in this study resembles an open–open organ pipe. For  $f_s < f_c$, this configuration can lead to standing wave formation, taking the form of half-wave tonal planar acoustic resonance (or duct organ pipe modes), defined as
  $f_{d} = m_d \times {a_0}/{2L_{eff}}$, where
  $f_d$ represents the eigenfrequencies,
  $m_d (= 1, 2, 3 \cdots )$ the eigenmode order,
  ${L_{eff}} (= L_d + \delta )$ the duct effective length,
  $L_d$ the duct actual length and
  $\delta$ the end correction coefficient. For an unflanged duct with two open ends in the presence of mean flow,
  $\delta$ is set at
  $0.095D_i$ (Peters et al. Reference Peters, Hirschberg, Reijnen and Wijnands1993). Notably, the long duct's first two eigenfrequencies, i.e.
  $330$ and
  $660\ \mathrm {Hz}$, are below the cutoff frequency (
 $\,f_c = 790\ \mathrm {Hz}$), while the short duct's eigenfrequencies, i.e.
  $891$ and
  $1782\ \mathrm {Hz}$, are above
  $f_c$.
In duct systems with open terminations, the duct acoustic fields can be excited through several mechanisms in the presence of mean flow. These mechanisms may include flow interactions with the leading and trailing edges of the duct, as well as potential excitation from internal components. Given the absence of internal components (fan, hub and struts) during testing, it is anticipated that the acoustic excitation within the duct arises solely from the duct blunt trailing edge, a known source of shedding vortices (Rienstra Reference Rienstra1981; Peters et al. Reference Peters, Hirschberg, Reijnen and Wijnands1993; English Reference English2010; Du & Kinnas Reference Du and Kinnas2019). At an incoming velocity of  $U_\infty = 20\ {\rm m}\ {\rm s}^{-1}$, the primary vortex shedding frequency, measured by hot-wire anemometry, is
  $f_s=333\ \mathrm {Hz}$. This frequency corresponds to a Strouhal number
  $St (= f_s T/U_\infty )$ of
  $0.2$ (velocity PSD
  ${\varphi UU}$ illustrated in the inset of figure 5b), considering the blunt-trailing-edge thickness of the duct
  $T (=12\ \mathrm {mm})$ (see figure 2b). The vortices shed at the duct blunt trailing edge can also transform part of their kinetic energy back into the duct's acoustic energy, causing the duct to resonate due to coupling between flow excitation and a duct acoustic standing wave (Peters et al. Reference Peters, Hirschberg, Reijnen and Wijnands1993; English Reference English2010). Since the vortex shedding frequency (
 $\,f_s$),
  $333\ \mathrm {Hz}$, is close to the first acoustic eigenfrequency,
  $330\ \mathrm {Hz}$, of a long duct, the peak at
  $20\ {\rm m}\ {\rm s}^{-1}$ in the long duct is likely due to the resonance within a duct, i.e. the coupling of the duct blunt-trailing-edge vortex shedding frequency and duct first eigenmode, which then radiates as an amplified planar sound wave. However, in a short duct with a length of
  $L_d = 0.17\ \mathrm {m}$, the eigenfrequencies (
 $\,f_d = 891$ and
  $1782\ \mathrm {Hz}$) are well above the shedding frequency (
 $\,f_s = 333\ \mathrm {Hz}$). Consequently, within the cutoff frequency (
 $\,f_c$) range, the planar duct noise radiation is simply due to the duct's acoustic response to the blunt-trailing-edge vortex shedding, without any resonance, resulting in unamplified sound radiation.
3.2. Ducted fan aeroacoustics
The far-field noise radiation from BLI ducted fans can be significantly more complex than that of a non-ducted configuration. This complexity is caused by noise originating from two distinct sources, i.e. the duct and the rotating fan. The noise radiation further becomes complicated due to the interaction of the boundary layer with the ducted fan.
The contour map of noise radiation for a ducted fan at various fan rotational speeds, in both isolated (without S-plate) and installed (with S-plate) configurations, is illustrated in figure 6. The results are presented for a fan rotational speed of  $6000$ and
  $11\,000\ \mathrm {r.p.m.}$ The noise spectrum at
  $6000\ \mathrm {r.p.m.}$ exhibited two distinct features (see figure 6a,b). Firstly, the harmonically structured fan noise is observed at the blade passing frequency (
 $\,f/f_{BPF}=1$) and its harmonics (
 $\,f/f_{BPF}=2, 3, 4,\ldots$). Secondly, the planar duct noise is specifically observed below the first blade harmonic (
 $\,f/f_{BPF}=2$), i.e.
  $f < 600\ \mathrm {Hz}$, as illustrated through island contour in figure 6(a). This duct noise maintained a similar characteristic as observed in both the isolated and installed duct configurations (see figure 4). The fan noise features remained consistent across the entire range of advance ratios in both the configurations, while the duct noise becomes more pronounced at higher axial inflow velocities (
 $U_\infty$), between
  $22$ and
  $32\ {\rm m}\ {\rm s}^{-1}$. However, in the installed ducted fan configuration, the noise spectra are relatively more broadened compared with the isolated ducted fan configuration. This spectral broadening is attributed to the interaction of turbulent boundary layer flow with the rotating fan and the duct. The noise spectrum at
  $11\,000\ \mathrm {r.p.m.}$ revealed some additional physical features (see figure 6c,d). Both in the isolated and installed configurations, there is a coupling of the boundary layer with the duct and fan at the blade passing frequency and its harmonics throughout the velocity range. The only difference being the spectral broadening effect in the installed configuration.

Figure 6. Comparison of noise contour maps of ducted fan at different fan rotational speeds for a wide range of fan thrusting regimes. The comparison includes both isolated ducted fan and installed ducted fan configurations (see table 1). The results are based on measurements taken at a microphone position of  $\theta = 90^{\circ }$. See supplementary movie 3 for the distribution of the SPL over a wide range of microphone polar angles (
 $\theta$) for isolated and installed ducted fan configurations at
  $6000\ \mathrm {r.p.m.}$
To gain further insights into the BLI ducted fan noise, the noise spectra at low and high fan thrust regimes are presented in figure 7. In the high thrust regime, i.e.  $J=0.315$ (see figure 7a) and
  $J=0.172$ (see figure 7b), the noise levels from the duct (without rotating fans) are significantly lower in both the isolated and installed configurations. The duct noise is dependent on the axial inflow velocity, which drives the duct blunt-trailing-edge vortex shedding (see figure 5b). Therefore, the lower duct noise levels are attributed to the weaker effect of duct blunt-trailing-edge vortex shedding at
  $8\ {\rm m}\ {\rm s}^{-1}$, corresponding to
  $J=0.315$ and
  $J=0.172$ for
  $6000$ and
  $11\,000\ \mathrm {r.p.m.}$ As a result, the noise spectra obtained in the installed ducted fan configuration are predominantly influenced by the interaction of rotating fan loading and the incoming boundary layer flow. This interaction reflects one of the key characteristics of turbulence ingestion in open (non-ducted) fans, i.e. chopping off of turbulent flow structures by the rotating blades, known as the haystacking phenomenon (Murray et al. Reference Murray, Devenport, Alexander, Glegg and Wisda2018). The spectral broadening and broadband humps are the two typical characteristics of the haystacking phenomenon in open fans ingesting turbulent boundary layer flows (Glegg & Devenport Reference Glegg and Devenport2017; Huang Reference Huang2023). The spectral broadening is the process where the tonal sound field is scattered by turbulence, resulting in a wider and more dispersed spectrum around the tones (McAlpine, Powles & Tester Reference McAlpine, Powles and Tester2013; Clair & Gabard Reference Clair and Gabard2018). The haystack humps are broadband hump features in the noise spectrum, occurring at fan tonal frequencies, with haystacking peaks slightly shifting to higher frequencies, known as blueshifting (Murray et al. Reference Murray, Devenport, Alexander, Glegg and Wisda2018; Huang Reference Huang2023).

Figure 7. Sound pressure level comparison of ducted fan configurations at different fan rotational speeds and axial inflow velocities ( $U_\infty$) (see table 1). The results are based on measurements taken at a microphone position of
  $\theta = 90^{\circ }$.
In the low and moderate thrust regimes, i.e.  $J=1.181$ and
  $J=0.644$, respectively, the duct noise levels are no longer negligible (see figure 7c,d). Consequently, the noise spectra obtained for the installed ducted fan configuration show the dominant interaction between duct, fan and boundary layer flow. These interactions modify the underlying mechanisms responsible for spectral broadening and broadband hump features in the noise spectrum. In the high thrust regime, these features are solely due to the haystacking phenomenon. In the low and moderate thrust regimes, these features are not attributed solely to the haystacking but are the result of the combined effects of both haystacking and duct noise. Hence, the interaction of the turbulent boundary layer with a ducted fan alters the typical haystacking phenomenon seen in open fan configurations.
4. Summary and conclusion
This study enabled the decomposition of the BLI ducted fan noise field into its constituent components, and their interaction with the incoming boundary layer. The scaled version of a Bell X-22A ducted fan is investigated, which is positioned adjacent to the curved S-plate region within an adverse pressure gradient flow structure. The interaction between fan noise, duct noise and the incoming flow ingestion is found to be driven by the fan thrust regime. In the high thrust regime, the noise radiation field displays harmonically arranged fan noise and haystack distributions. In contrast, in low thrust regime, the noise radiation field features harmonically arranged fan noise, the duct's blunt-trailing-edge vortex shedding induced duct noise and the haystack pattern. The effect of duct acoustics is seen as major contributor in altering the spectral broadening and humps in the haystack noise signatures in the low thrust regime.
Supplementary movies
Supplementary movies are available at https://doi.org/10.1017/jfm.2024.134.
Acknowledgements
The authors acknowledge the use of aeroacoustic facility at the University of Bristol and the associated support services. We also acknowledge P. Kamble for the ducted fan test rig design and M. Daroukh (ONERA) for his inputs during the planning of our test.
Funding
This work is supported by the European Union's Horizon 2020 research and innovation programme under the ENODISE (enabling optimized disruptive airframe-propulsion integration concepts) project grant agreement number 860103.
Declaration of interests
The authors report no conflict of interest.
Author contributions
F.A.: designed the fan, conducted wind tunnel testing, conceptualised the study, developed the methodology, carried out the investigation, conducted the formal analysis, produced visualisations and wrote the original draft of the manuscript. I.Z.: designed S-plate test rig, contributed critical review and editing of the manuscript. D.R.: provided supervision and contributed critical review and editing of the manuscript. M.A.: provided supervision, contributed critical review and editing of the manuscript, acquired funding, managed overall project administration.


 Open access