

Abstract
In this study, a combined subject-specific numerical and experimental investigation was conducted to explore the plantar pressure of an individual. The research utilized finite element (FE) and musculoskeletal modelling based on computed tomography (CT) images of an ankle-foot complex and three-dimensional gait measurements. Muscle forces were estimated using an individualized multi-body musculoskeletal model in five gait phases. The results of the FE model and gait measurements for the same subject revealed the highest stress concentration of 0.48 MPa in the forefoot, which aligns with previously-reported clinical observations. Additionally, the study found that the encapsulated soft tissue FE model with hyper-elastic properties exhibited higher stresses compared to the model with linear-elastic properties, with maximum ratios of 1.16 and 1.88 MPa in the contact pressure and von-Mises stress, respectively. Furthermore, the numerical simulation demonstrated that the use of an individualized insole caused a reduction of 8.3% in the maximum contact plantar pressure and 14.7% in the maximum von-Mises stress in the encapsulated soft tissue. Overall, the developed model in this investigation holds potential for facilitating further studies on foot pathologies and the improvement of rehabilitation techniques in clinical settings.
Export citation and abstract BibTeX RIS

Original content from this work may be used under the terms of the Creative Commons Attribution 4.0 licence. Any further distribution of this work must maintain attribution to the author(s) and the title of the work, journal citation and DOI.
1. Introduction
The foot's complex structural functions facilitate human locomotion and daily load transfer through the lower limb, making it susceptible to pathologies [1–3]. Changes in plantar pressure patterns have been associated with musculoskeletal disorders, such as scoliosis [4] and ulcer development in diabetic patients [5], emphasizing the importance of studying plantar pressure in patients. Understanding foot kinetics, kinematics, and stress distribution aids in comprehending the underlying failure mechanisms [6–9]. Numerous studies have investigated foot plantar pressure using combined subject-specific numerical and experimental analyses [10–15]. However, model simplifications in some studies have raised concerns about accurately simulating foot stresses during lower extremity movements. For instance, some studies applied two-dimensional loading or boundary conditions to a foot FE model to alleviate computational demands and complexity [10–17], while others attempted fusion between foot bones to restrict bone sliding [14]. Akrami et al conducted a comprehensive three-dimensional numerical and experimental investigation into foot stresses, emphasizing the substantial impact of loads and boundary measurements on plantar pressure [6]. Notably, variations in the representation of foot model geometries, properties, boundary and loading conditions in the literature can lead to different implications in simulation results [8].
There has been limited discussion regarding the analysis of high-pressure sites on a foot using a personalized approach that combines gait measurements and CT-image-based musculoskeletal modelling with the development of an ankle-foot complex FE model. Forecasting internal stress distribution through Finite Element (FE) analysis requires the precise integration of realistic geometries, boundary conditions, and material properties. Soft tissues inherently exhibit nonlinear behavior, yet practical computational constraints often necessitate the use of linear material models within FE simulations of the foot's structure. The potential effects of incorporating nonlinear material properties for foot soft tissues, in contrast to simulations employing linear properties, could significantly impact stress distribution within the foot model.
The primary goal of the current study is to experimentally and numerically develop a comprehensive understanding of foot stresses based on CT data of a patient, both barefoot and while wearing an insole during different gait events. The study addresses four crucial issues:
- (1)Measuring the kinematic and kinetic data of the lower limb, including three-dimensional ground reaction forces, range of motion of the subject's lower limb joints during walking, and biomechanical balance factors of the foot in the upright-standing posture.
- (2)Investigating plantar contact pressure and von-Mises stresses in a combined three-dimensional subject-specific FE and musculoskeletal model of the ankle-foot complex, constructed based on CT images of the same subject in five different gait phases.
- (3)Validating the FE model by comparing measured and calculated plantar pressure distributions.
- (4)Comparing foot stresses on the encapsulated soft tissue of FE models with different linear and nonlinear characteristics, with and without an insole.
2. Materials and methods
The study followed a three-step approach. Firstly, temporal and spatial kinetic and kinematic data of a subject were captured through gait measurements. Secondly, CT images of the ankle-foot complex from the same subject were employed to construct a precise three-dimensional finite element (FE) model. Thirdly, subject-specific muscle forces during walking were estimated using a generic OpenSim model customized to the subject's anatomical data. The FE model was then subjected to the subject-specific muscle forces and ground reaction loads, providing an alternative to in-vivo loads for analysis.
2.1. Ethics statement
Prior to conducting the study, the institutional ethics committee granted approval, and informed consent was obtained from the individual participating in the research. The CT images of the ankle-foot complex were evaluated by radiologists to ensure that the foot model represented a neutral posture and exhibited normal conditions.
2.2. Gait measurements
The kinetic and kinematic parameters were evaluated through gait measurements conducted on the subject of this study, who was 49 years old, with a height of 160 cm and a weight of 67 kg.
2.2.1. Kinematics
In this study, a 3D OptiTrack motion capture system (Model Duo, V120) with VGA resolution of 640*480 was employed to capture the subject's lower limb movements during treadmill walking at 120 Hz in three anatomical planes. Infrared reflective marker clusters mounted on rigid plates were used to track the three-dimensional motions of the pelvis, thighs, shanks, and feet. Each set of markers on the limbs was considered a rigid body in the dynamic model. The marker data was processed using Motive, an optical motion capture software, to determine the temporal and spatial local coordinate system on each limb and the rotation matrices of adjacent limbs. The calibrated model included 21 degrees of freedom, with the pelvis serving as the reference, and the rotation matrices of each lower limb relative to their proximal limbs were calculated. Five trials were recorded to capture representative kinematics of each joint during walking at a low speed of 0.6 m s−1. To filter the marker data, a low-pass zero-lag fourth-order Butterworth digital filter with a cut-off frequency of 6.0 Hz was applied. The subject's standing balance was assessed under bipedal conditions with closed eyes using confidence ellipse data. This data included parameters such as ellipse area, path length, and displacement of the Center of Pressure (CoP) in both the medio-lateral and anterior-posterior directions [18, 19]. High values of these data indicate poor balance [19]. The kinematic measurements obtained from the subject were then used in the finite element model of the ankle-foot complex to replicate the anatomical condition of the foot during walking.
2.2.2. Kinetics
A Piezoresistive PT-Scan (Model PT-Scan 4452F100) with a resolution of 1.4 sensors/cm2 and a sensing area dimension of 40*40 cm2, capable of sensing pressure from 0.5 to 100 PSI, was utilized to record ground reaction forces, plantar pressure distribution, and Center of Pressure at 100 Hz. Additionally, a balance analysis was conducted on the subject during one minute of upright-standing. The balance analysis involved measuring confidence ellipse data, which included CoP path length, lengths of the ellipse major and minor axes, and standard deviations of CoP displacements in the major and minor axes. Furthermore, an insole fitted to the size of the subject's left foot was designed using the associated PT-Scan software (figure 1).

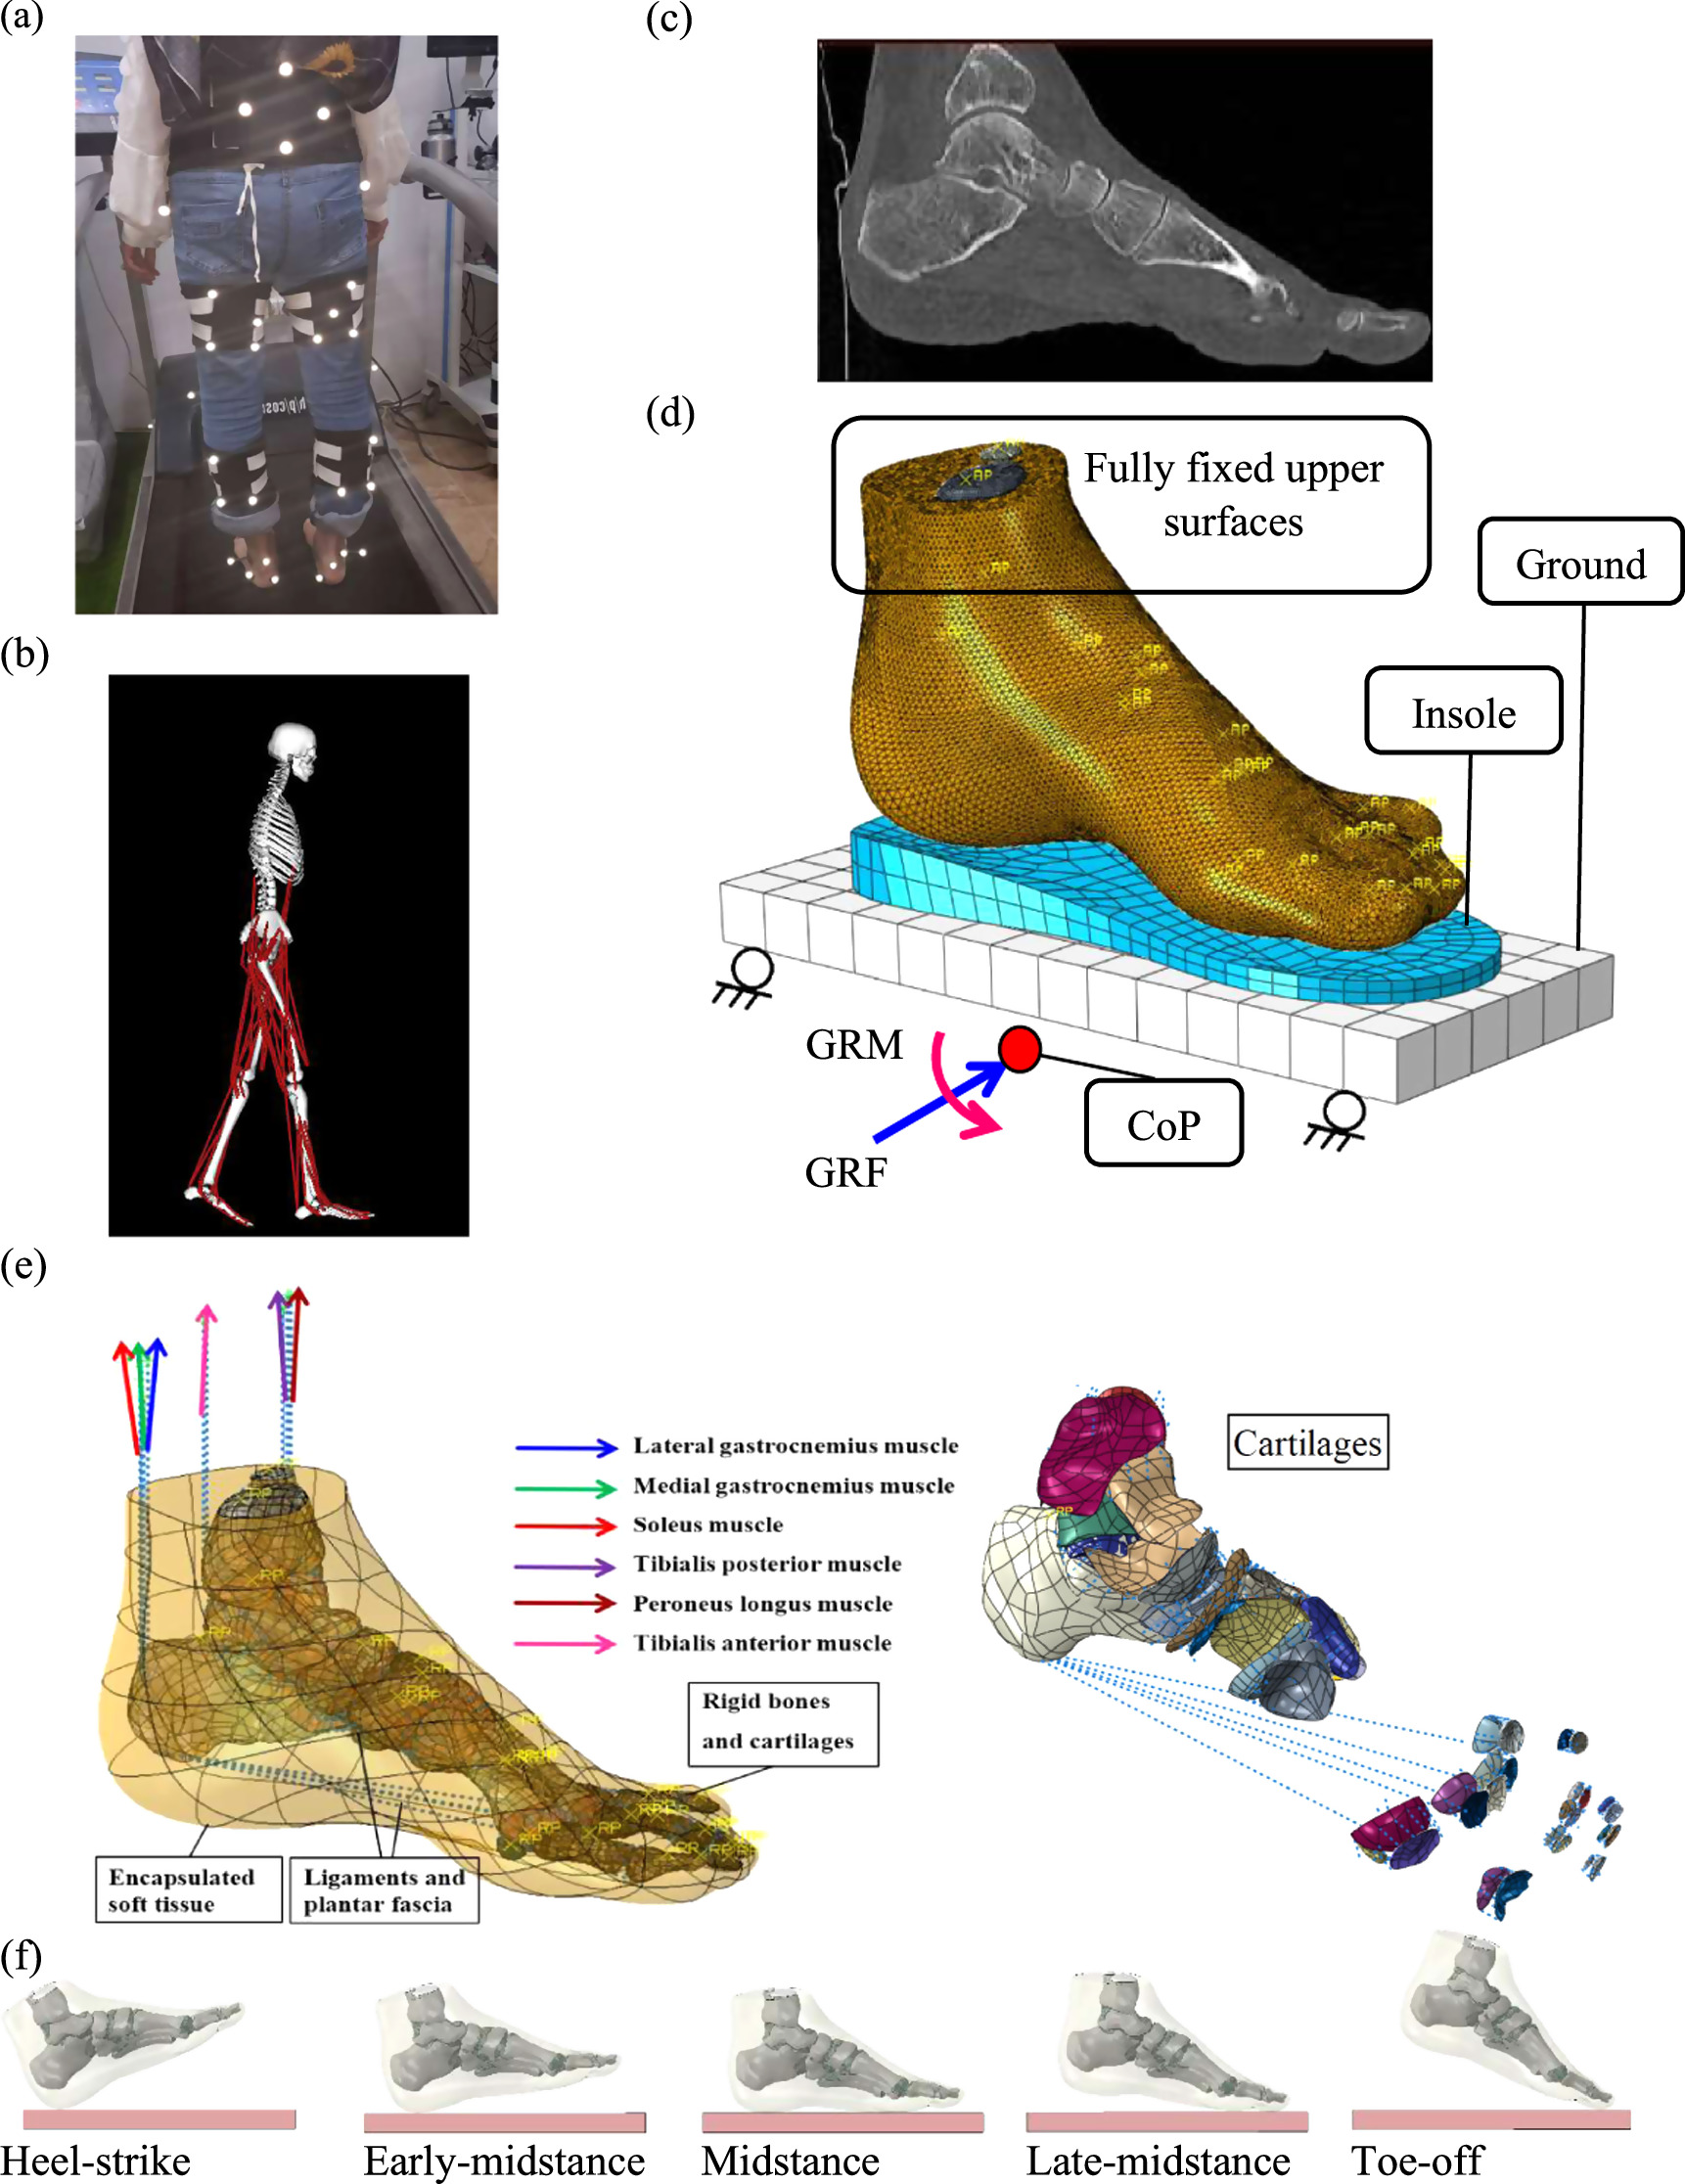
Figure 1. (a) Infrared marker clusters mounted on rigid plates were utilized to capture the 3-dimensional movements of lower limb segments, including pelvis, thighs, shanks, and feet. (b) The Motive software provided a view used to determine the temporal spatial local coordinate system on each limb. (c) The CT images of the left foot of the subject, whose gait measurements were taken, were depicted for reference. (d) The schematic representation shows the reaction forces (GRFs) and moments (GRMs) applied on the center of gravity of the ground (CoG) and the six major muscles (lateral gastrocnemius, medial gastrocnemius, soleus, tibialis posterior, peroneus longus, tibialis anterior), which were modelled as axial connector elements in the foot FE model. The FE model comprised cartilage layers at each joint, one encapsulated soft tissue, and 30 rigid bony structures interconnected through ligaments and plantar fascia. The bones included tibia, fibula, talus, calcaneus, navicular, cuboid, three cuneiforms, five metatarsals, five proximal phalanges, four intermediate phalanges, and five distal phalanges. The ground was constrained to move along the GRFs, and the upper surfaces of the encapsulated soft tissue, fibula, and tibia were fully fixed. (e) An illustration of foot positions relative to the ground at five gait events: heel-strike, early stance, mid-stance, late stance, and toe-off.
Download figure:
Standard image High-resolution image2.3. Numerical modelling
A three-dimensional subject-specific combined finite element and musculoskeletal model was developed based on CT images of the subject's ankle-foot complex to analyze foot stresses during walking.
2.3.1. Musculoskeletal model
The generic lower limb musculoskeletal model available in OpenSim software as 'gait2392' was used to estimate the muscle forces. Anatomical data of the generic model were scaled to be fitted into the data of the same subject whose CT images were used for FE modelling. Forces of six major muscles of all leg muscles including lateral gastrocnemius, medial gastrocnemius, soleus, tibialis posterior, peroneus longus and tibialis anterior during walking were estimated using the static optimization method in OpenSim software. The muscle forces were applied at their origin/insertion attachment sites on the FE model, as an alternative to the in-vivo loading condition of the foot.
2.3.2. Finite element model
The computer-aided drawing (CAD) parts of the foot bones and encapsulated soft tissue were created based on CT images (0.6 mm slice thickness) of the patient's left foot in the neutral posture using Mimics (Materialise, V10.01). Subsequently, cartilage layers were created parallel to the outer joint contact surfaces of the adjacent bones using Catia (Dassault Systèmes, Vélizy-Villacoublay, France, V5R20) (figure 1).
An individualized model of an insole optimized based on the kinetic data of the patient was also designed using the PT-Scan software, resulting in the creation of CAD parts for the subject-specific insole and a ground plate (figure 1).
All the CAD parts were then imported into computer-aided engineering software (ABAQUS 6.19, ABAQUS Inc., Providence, RI, USA) to construct the finite element model. The FE model included 30 separate bones, each of which was covered by cartilage layers at the joints, and encapsulated soft tissue. The cartilage layers, bones and the soft tissue were assigned the element types of S4R, R3D4, and C3D10M, respectively (figure 1). The cartilage layers make sliding contact, enabling the bones to slide over each other. Due to differences in material characteristics, the bones were treated as rigid bodies [20], while the encapsulated soft tissue was studied with both linear-elastic and hyper-elastic properties. The linear-elastic properties were assumed with a Young's modulus of 1.15 MPa and Poisson's ratio of 0.49 for the encapsulated soft tissue, and 1 MPa and 0.4 for the cartilage layers of the foot model [21].
For the hyper-elastic material, specific coefficients of 0.08556, −0.05841, 0.03900, −0.02319, 0.00851, 3.65273, and 0.0 for C10, C01, C20, C11, C02, D1, and D2, respectively, were used, which were derived from soft tissue experimental data from the literature [21]. Ligaments and plantar fascia were modelled as sets of wires using axial nonlinear tension-only connector elements with Young's moduli of 260 MPa and 350 MPa, respectively [21]. The insole was given a Young's modulus of 11 MPa and Poisson's ratio of 0.3 [22], while the ground was assigned a Young's modulus of 17 GPa and Poisson's ratio of 0.3 [11]. Frictionless contact was defined at the cartilage interfaces [21].
The 3D orientation angles of the ankle-foot complex were extracted from the gait measurements of the subject, whose CT images were used to create the subject-specific FE model of the foot. These kinematic data were then employed as boundary conditions for the foot model during walking. Five quasi-static analyses were conducted using ABAQUS software (Simulia, Providence, USA) to analyze foot stresses at five different gait events, namely, heel-strike, early stance, mid-stance, late stance, and toe-off.
During each simulation, the superior surfaces of the encapsulated soft tissue, tibia, and fibula were fully constrained to replicate the constraints from proximal tissues. The ground reaction loads and muscle forces were applied to the ground plate at the position of the foot Center of Pressure (CoP) (figure 1). Both the ground plate and individualized insole were restricted to move only in the direction of the Ground Reaction Force (GRF) vector (figure 1). To ensure accurate results, a sensitivity analysis was performed by increasing the number of elements, resulting in a total of 95,000 elements for the foot's encapsulated soft tissue.
The joint rotation of the subject's left ankle in the sagittal plane was compared with previously-reported average normal data [23].
3. Results
The results of the gait measurements demonstrated that the maximum rotation angles the subject's lower limb joints occurred in the sagittal plane (figure 2).

Figure 2. The rotation angles in the sagittal (left column), frontal (middle column), and transverse (right column) anatomical planes for the following joints: (a) pelvis, (b) hip, (c) knee, and (d) ankle were compared between the right (dashed red line) and left (blue line) sides of the subject and the kinematic data of healthy subjects reported in the literature [23].
Download figure:
Standard image High-resolution imageThe confidence ellipse, obtained using the foot pressure scanner (PT-Scan), was observed to be located in the middle of the base of support, indicating the lower limb balance of the subject (figure 3).
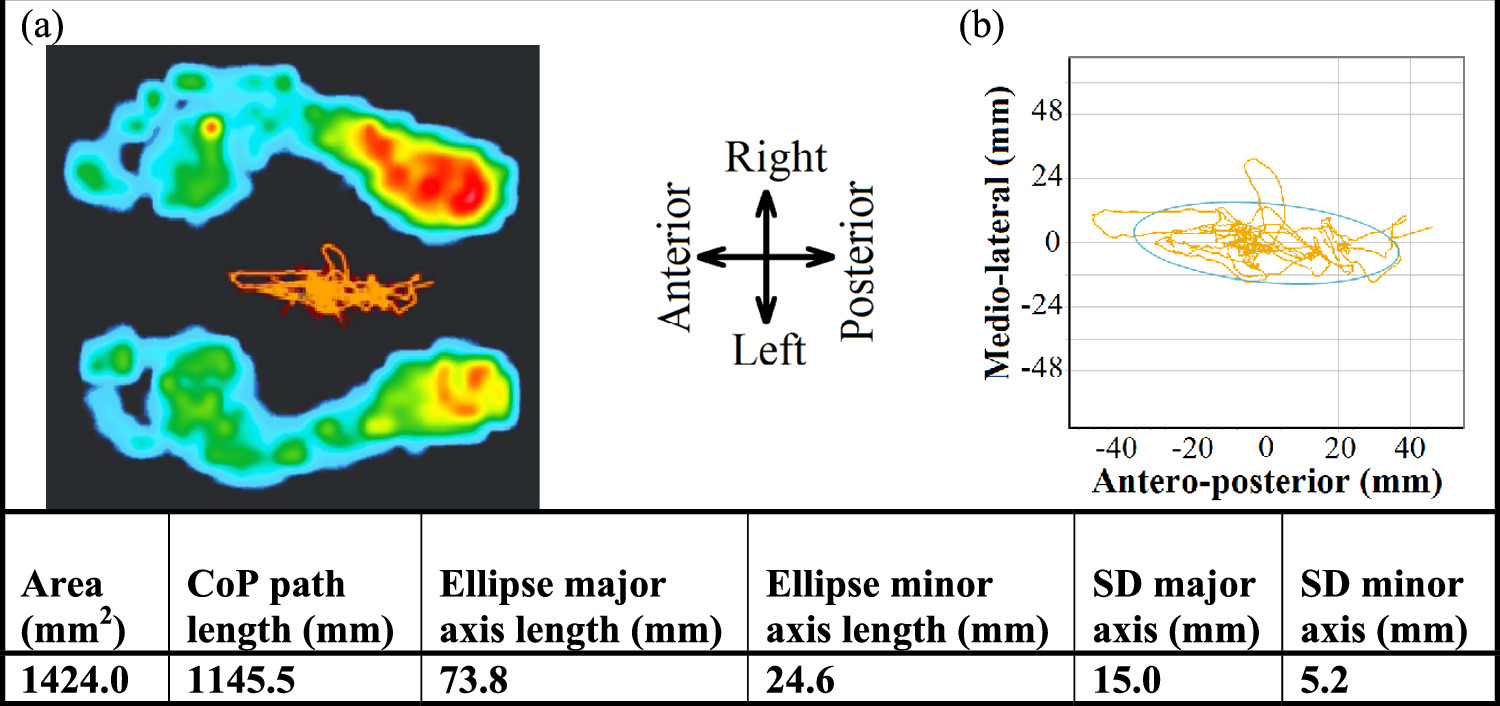
Figure 3. The position of the Center of Pressure (CoP) and the confidence ellipse data were measured using the foot pressure scanner (PT-Scan) in the upright-standing posture. The ellipse area represents the total area of the confidence ellipse, and the path length of CoP indicates the total displacement of the CoP during the measurement. The major and minor axes of the confidence ellipse correspond to the antero-posterior and medio-lateral directions, respectively. Standard deviations (SD) in the antero-posterior and medio-lateral directions represent the deviation of the Center of Pressure on the major axis in the anterior-posterior direction and the minor axis in the medio-lateral direction, respectively.
Download figure:
Standard image High-resolution imageThe vertical and forward reaction forces of the subject's left foot were within the normal range reported by Winter [23] (figure 4).

Figure 4. The vertical and forward ground reaction forces (GRFs) measured by the foot pressure scanner (PT-Scan) for the subject's left foot during the stance phase were compared to the data of GRFs and standard deviations in the literature [23].
Download figure:
Standard image High-resolution imageThe compressive and shear stresses on the ground were calculated by dividing the GRFs by the contact area of the ground at each time step (figure 5).

Figure 5. The ground reaction compressive and shear stresses, along with the foot contact area at the interface with the ground, were calculated at each time step during the stance phase of walking.
Download figure:
Standard image High-resolution imageGround reaction moments about the geometrical center of the ground (CoG) were calculated by multiplying the ground reaction forces by the distance between the Center of Pressure and ground CoG at five gait events in the stance phase during walking (table 1).
Table 1. Ground reaction moments (N.m) about the geometrical center of the ground at five gait events in the stance phase during walking.
| Heel-strike | Early stance | Midstance | Late stance | Toe-off | |
|---|---|---|---|---|---|
| GRMx | 39.6 | 56.2 | 0.5 | −31.2 | −36.1 |
| GRMy | 0.0 | 0.0 | 0.0 | 0.0 | 0.0 |
| GRMz | −0.1 | −0.2 | 0.0 | −0.9 | 0.4 |
The muscle forces during walking, estimated using OpenSim, were applied to the FE model as an alternative to the in vivo loading condition of the foot (table 2).
Table 2. Muscle forces (N) estimated for five gait events in the stance phase during walking.
| Heel-strike | Early stance | Midstance | Late stance | Toe-off | |
|---|---|---|---|---|---|
| Lateral gastrocnemius | 12.1 | 6.7 | 132.2 | 218.0 | 10.5 |
| Medial gastrocnemius | 72.5 | 14.1 | 537.1 | 1001.6 | 43.0 |
| Soleus | 19.6 | 175.5 | 733.6 | 1069.5 | 873.2 |
| Tibialis posterior | 16.6 | 579.3 | 519.1 | 347.6 | 268.0 |
| Tibialis anterior | 139.8 | 97.3 | 71.6 | 32.9 | 8.9 |
| Peroneus longus | 75.1 | 8.6 | 8.2 | 10.1 | 12.2 |
The results of the FE analysis of the foot model with different ankle orientations (figure 2), under the ground reaction forces (figures 4 and 5 and table 1) and muscle forces (table 2) in five gait events were compared with the measured plantar contact pressure distribution for the same subject (figure 6).

Figure 6. The pressure distribution for the left foot during normal walking at five different gait events (heel-strike, early-midstance, mid-stance, late-midstance, and toe-off) was compared between the FE simulation (a) and the measurements obtained by the foot pressure scanner (PT-Scan) (b). The CoP path, shown as the red line, was traced by the foot pressure scanner during walking.
Download figure:
Standard image High-resolution imageIn the midstance phase, the results of the FE analysis for the model with the foot-ground interface showed higher levels of contact plantar pressure and von-Mises stress in the encapsulated soft tissue with hyper-elastic (HEG) properties compared to linear-elastic (LEG) properties (figure 7). The ratios of 1.16 and 1.87 were found for the maximum contact pressure and maximum von-Mises stress in the hyper-elastic over the linear-elastic encapsulated soft tissue on the ground, respectively (figure 7). The optimal insole placed between the encapsulated soft tissue and the ground resulted in a reduction of 8.3% in the maximum contact plantar pressure and 14.7% in the maximum von-Mises stress in the FE model with hyper-elastic encapsulated soft tissue, as calculated using equation (2).

Where  and
and  represent the maximum stress in the FE model of the encapsulated soft tissue in contact with the ground (HEG) and in contact with the insole (HEI), respectively.

Figure 7. In the midstance phase, the distribution of (a) the contact plantar pressure (MPa) and (b) the von-Mises stress (MPa) on a cross-section of the encapsulated soft tissue at the hindfoot and forefoot sites was estimated by the foot FE simulation with the following configurations: linear-elastic soft tissue on the ground (LEG), hyper-elastic soft tissue on the ground (HEG), and hyper-elastic soft tissue on the insole (HEI).
Download figure:
Standard image High-resolution image
4. Discussion
The aim of the current work is to investigate the contact plantar pressure and von-Mises stress in a 3-dimensional subject-specific hybrid musculoskeletal and FE model created based on CT data of an ankle-foot complex integrated with the kinetic and kinematic measurements of the same foot. The paper also explores a sensitivity analysis of mechanical properties of the encapsulated soft tissue as well as the influence of an individualized insole on the foot plantar pressure. A comparison of the plantar pressure and von Mises stresses in a model incorporating different material properties for the foot encapsulated soft tissue (figure 7) illustrates the potential benefits of using a nonlinear representation of the soft tissue model. The findings of this study highlight the capability of the foot model to foresee the plantar peak pressure sites, where most likely are to develop pressure ulcers in diabetic patients [24], and underscore the insole effects on reducing the foot stresses.
The three-dimensional rotations of the joints in the lower extremities of the subject in this study, measured for one gait cycle, were consistent with the data of normal subjects reported in the literature [23] (figure 2). The subject's lower limb rotations in the sagittal plane during walking were found to be larger than in other anatomical planes, which aligns with the literature [23] (figure 2). The subject demonstrated good balance in the upright-standing posture, as the confidence ellipse data covered 95% of the displacement of the pressure center (figure 3) [18, 19]. The kinematic measurements of the subject, as shown in figure 2, were applied to the FE model of the ankle-foot complex to mimic the anatomical condition of the subject's foot during walking.
The results presented in figure 4 demonstrate a consistency between the experimentally found ground reaction forces through gait measurements for the individual in this study and the average data of healthy subjects in the literature [23]. Additionally, table 2 reveals a clear agreement between the results of muscle forces estimated using a personalized musculoskeletal model in OpenSim, which was fitted to the data of the patient in this study, and the results of another study [6]. Unlike most previous studies that relied on available data in the literature for [11, 14–16], in this study, the muscle forces and GRFs were directly applied to the finite element (FE) model of the same foot as an alternative to the in-vivo loading condition of the ankle-foot complex during the stance phase. The imposed GRFs on the foot FE model were calculated as the reaction compressive and shear stresses (figure 5) as well as the reaction moments about the foot Center of Pressure (table 1), aiming to reduce the computational costs of the FE analysis.
The results of the contact plantar pressure obtained through the FE analysis showed a strong correlation with the measurements taken for the same subject (figure 6). The highest level of von-Mises stress in the encapsulated soft tissue was observed in both the hindfoot and forefoot regions (figure 7). Both the gait measurements and FE results demonstrated a higher concentration of contact plantar pressure under the metatarsals compared to other sites of the foot (figures 6 and 7). This finding is consistent with clinical observations of ulcer development at the forefoot, which is more frequently observed due to the hardness of the skin in diabetic patients [25, 26]. Additionally, the highest von-Mises stress in the encapsulated soft tissue was found at its interface with the metatarsal bones, which is in agreement with another study [11]. This phenomenon can be attributed to the irregular geometry of the bones and their primary function in translating the body weight through the plantar foot, leading to stress concentration at the interface of the bones with the encapsulated soft tissue (figure 7(b)).
The finding of higher von-Mises stress at the interface of the 4th and 5th metatarsals with the encapsulated soft tissue is consistent with the higher contact plantar pressure observed at the forefoot compared to other parts of the foot model (figure 7). Moreover, the comparison of data between the hyper-elastic (HEG) and linear-elastic (LEG) materials for the encapsulated soft tissue revealed higher von-Mises stress and plantar pressure in the HEG model than in the LEG model (figure 7). This can be explained by the fact that the nonlinear hyper-elastic soft tissue tends to have higher stiffness as the strain increases, leading to increased stress levels. Additionally, the individualized insole model designed based on the subject's data resulted in a respective reduction of 1.09 and 1.17 in the ratio of the maximum contact plantar pressure and maximum von-Mises stress in the HEG model compared to the hyper-elastic insole model (HEI) (figure 7). Furthermore, the results demonstrated that the personalized insole caused stress distribution over a larger area of the encapsulated soft tissue compared to the HEG model (figure 7). This led to a significant reduction of 8.3% in the maximum contact plantar pressure and 14.7% in the maximum von-Mises stress in the encapsulated soft tissue (figure 7).
In this study, to manage computational demands and maintain consistency with previous works, the bones were simulated as rigid bodies, a common approach used in similar studies [20, 27–29]. Additionally, in line with most previous works [21], the encapsulated soft tissue, cartilage layers, ligaments, and plantar fascia were modelled as linear-elastic materials. However, it is worth noting that there was a lack of experimental data in the current literature for comparing the von-Mises stress distribution in the soft tissues, which could be a potential area of future research. The primary limitations of this study revolve around the sample size, generalizability, and equipment constraints. The use of a single subject restricts the ability to draw broad conclusions, emphasizing the need for further research with larger and more diverse participant groups. The controlled environment and specific demographics of the subject may not fully capture the complexities of gait and balance within the broader population. While the selected pressure measurement system was carefully chosen, its inherent limitations, such as sensing area and pressure range, should be considered when interpreting the results. Additionally, the study's exclusive focus on a single walking speed, specific balance conditions, and a cross-sectional design limits the broader applicability of the findings. To address these limitations and enhance the study's robustness, future research will explore larger and more varied participant samples, examine a range of walking conditions, and consider different pressure measurement systems with expanded capabilities.
5. Conclusion
This study aimed to develop a three-dimensional subject-specific combined finite element and musculoskeletal model of the ankle-foot complex in a neutral posture, using CT images of an individual with no lower extremity pathologies. The FE model was then analyzed under semi-in-vivo loading conditions during walking, obtained through 3D gait measurements on the same subject and muscle forces using a personalized multi-body musculoskeletal model in OpenSim. The results of the study demonstrated the feasibility of the FE model in predicting contact plantar pressure in five gait events. Notably, the sensitivity analysis presented in this study revealed a significant influence of encapsulated soft tissue material properties (linear versus nonlinear representation) on foot stresses. Additionally, the study emphasized the importance of an individualized insole in reducing stress concentration in the encapsulated soft tissue, thus potentially mitigating the risk of ulcer development in diabetic patients. Overall, the developed FE model can serve as a valuable tool for analyzing various aspects of foot-ankle pathologies and improving rehabilitation techniques in clinical settings.
Acknowledgments
This work was supported by grants from regional program EFRO (European Fund for Regional Developments, Grant number PROJ-00918) and from University of Twente (Enschede, The Netherlands).
Data availability statement
The data cannot be made publicly available upon publication because they are owned by a third party and the terms of use prevent public distribution. The data that support the findings of this study are available upon reasonable request from the authors.
Ethical approval
The collection of computed tomography images and pressure data on the individual were approved by the University of Twente and by the Ethics Committee of Shahid Sadooghi Hospital.
Conflict of interest
The authors have no conflicts of interest relevant to this article to report.