
Abstract
We have investigated noninvasive imaging of the adipose region in the living human body, utilizing an ultrasonic velocity change (UVC) method caused by body temperature change. Our primary goal is to determine the optimal measurement conditions for acquiring effective UVC images. To achieve this objective, we applied the UVC method to the forearm area, which is easily comprehensible in terms of the body's internal structure and less susceptible to motion artifacts from the heartbeat. By utilizing echo data approximately 30 s after initiating ultrasonic warming, adjusting the time difference between paired images for UVC image generation to multiples of the heartbeat period, and selectively extracting and analyzing image pairs with high correlation values, we successfully obtained effective UVC images targeting humans for the first time. This process enables noninvasive differentiation between subcutaneous fat and muscle regions in the human forearm.
Export citation and abstract BibTeX RIS
1. Introduction
Vascular diseases are responsible for approximately 20% of deaths in Japan and are frequently initiated by the detachment of blood clots. 1–5) These clots form plaques that cause ruptured blood vessels. The likelihood of rupture can be predicted by assessing the fat content in the plaque. Plaques with a higher fat content are more prone to rupture and are termed unstable plaques. 6–9) Although invasive techniques can ascertain the instability of a plaque, they impose a considerable burden on the patient. Alternatively, although magnetic resonance imaging can noninvasively identify unstable plaques, 10) it requires large and expensive equipment, and patients must endure lengthy periods of immobilization in a noisy and confined space during image acquisition. Hence, developing a noninvasive and cost-effective method that is suitable as a screening test to diagnose unstable plaques is needed. In this context, ultrasonic imaging emerges as the most fitting solution and intriguing methods have been proposed to identify unstable plaques based on the brightness information of B-mode images 11,12) and photoacoustic methods. 13,14) Regrettably, none of these methods has currently achieved practical application.
We have conducted extensive research on the ultrasonic velocity change (UVC) method as a noninvasive approach for identifying fatty regions in vivo, including unstable vascular plaques and fatty liver. 15–29) The UVC method operates by exploiting the temperature-dependent ultrasonic velocities in water and fat regions. Studies have been conducted by applying the same principle to investigate the precise assessment of drug effects following the treatment of liver tumors in rats. 30,31) We have previously developed a simulated vascular model that incorporated artificial unstable plaques within a tissue-mimicking material (TMM) phantom 32) influenced by a pseudoheartbeat. 25) Our demonstrations using this model confirmed its capability to generate valid UVC images. However, when the UVC method was applied to an actual living body, the likelihood of obtaining valid UVC images diminished, which was attributed to the variability in the period and magnitude of a human heartbeat.
Therefore, the objective of this study was to identify stable conditions to consistently obtain valid UVC images from a human body. 33) To achieve this goal, the UVC method with ultrasonic warming was applied to the human forearm—a region where the internal structure of the body is easily understood and is not easily affected by heartbeats.
2. Methods
2.1. The UVC method
Figure 1 shows the temperature dependence of ultrasonic velocity in water and fat near body temperature, as measured in our previous studies. 34) The temperature coefficient of the ultrasonic velocity in water is approximately +1.9 m s−1 °C−1, whereas that in fat is approximately −4.9 m s−1 °C−1. Generally, the volume modulus (stiffness) of a medium decreases with increasing temperature, resulting in the deceleration of propagating ultrasonic waves. In this context, fat behaves like a typical medium. In contrast, water possesses a unique property where the velocity of propagating ultrasonic waves increases as its temperature increases at approximately the body temperature. For pure water, this tendency is observed up to 74 °C. 34) Because >70% of human organs, muscles, and blood consist of water, we can assume that the propagating ultrasonic velocity follows the temperature dependence of water in most parts of the human body except for bones and fat, which have low water content. 35,36) Therefore, based on the distinct temperature dependence of UVC, we can noninvasively image fatty areas, including unstable plaques and fatty liver, in the human body. We called this method the UVC method. 15)
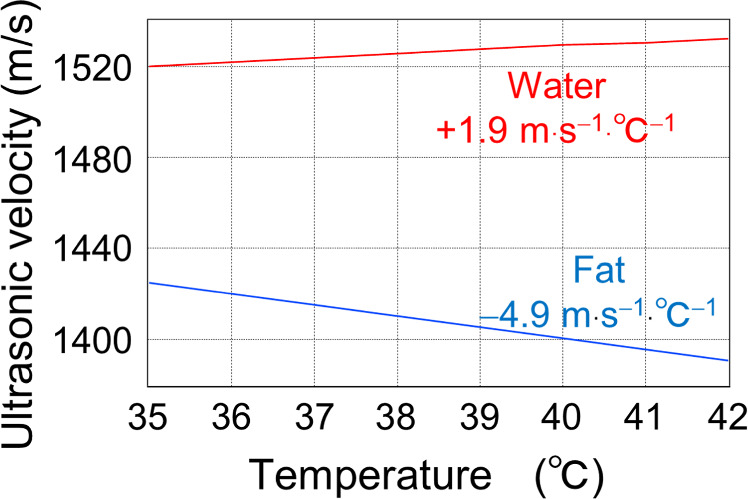
Fig. 1. Temperature dependence of ultrasonic velocity propagating through water and fat.
Download figure:
Standard image High-resolution imageIn the UVC method, the number of temporal data points in the RF waveforms obtained from an ultrasonic array transducer (345 elements) increases from 1024 to 30720 points through spline interpolation. This enhancement enables the detection of stable shifts in pulse echoes associated with temperature changes within a range of approximately 1 μm. The temporal positions of multiple pulse peaks above a set threshold are read from the RF data to estimate pulse interval τ of the proximity. Pulse-echo shift Δτ due to warming is also read for each τ. The amount of UVC, i.e., Δv, is estimated by substituting τ and Δτ into Eq. (1).

where v is the average velocity of the ultrasonic waves, which is set at 1480 m·s−1 at a constant temperature of 37 °C. If the UVC amount Δv calculated by Eq. (1) is positive (negative), the ultrasonic velocity becomes faster (slower) due to the change in temperature, and the corresponding region is shown in red (blue).
2.2. Experimental methods
Figure 2 shows the experimental setup for forearm UVC imaging. In Fig. 2(a), an ultrasonic array transducer (center frequency 7.5 MHz, ALOKA, SSD6500) was placed on the human forearm using a standoff and a 5 mm thick gel layer was applied as the coupling medium. The focus depth was set to 10 mm, and the observation mode utilized was the B-mode. The data analysis utilized RF data obtained from the ultrasonic array transducer. An ultrasonic warmer (frequency = 1 MHz, ITO, US-710) was installed adjacent to the ultrasonic array transducer, and the warming area was aligned with the observation site. The continuous wave ultrasonic warming system produced an output characterized by a Gaussian profile along the transverse direction of propagation, with a beam waist at the output end. The beam exhibited a diameter of 2 cm at the waist and a beam-spread angle of 0.017 rad. Figure 2(b) shows that the subjects in the experiment were instructed to grasp fixation rods, and their jaws were secured to minimize any potential movement. In addition, both the ultrasonic array transducer and ultrasonic warmer were firmly stabilized to prevent shaking. The forearm underwent warming using the ultrasonic warmer for 1 min at a frequency of 1 MHz and an intensity of 0.7 W cm−2 at the output end. During each measurement, 270 echo images were captured within a 9-s timeframe. Notably, because of the limitations of the employed device, the data storage time for a single measurement was restricted to 9 s. These measurements were systematically conducted before, during, and after warming. In this experiment, we enlisted the participation of two healthy and normal-weight men who were both 23 years old.
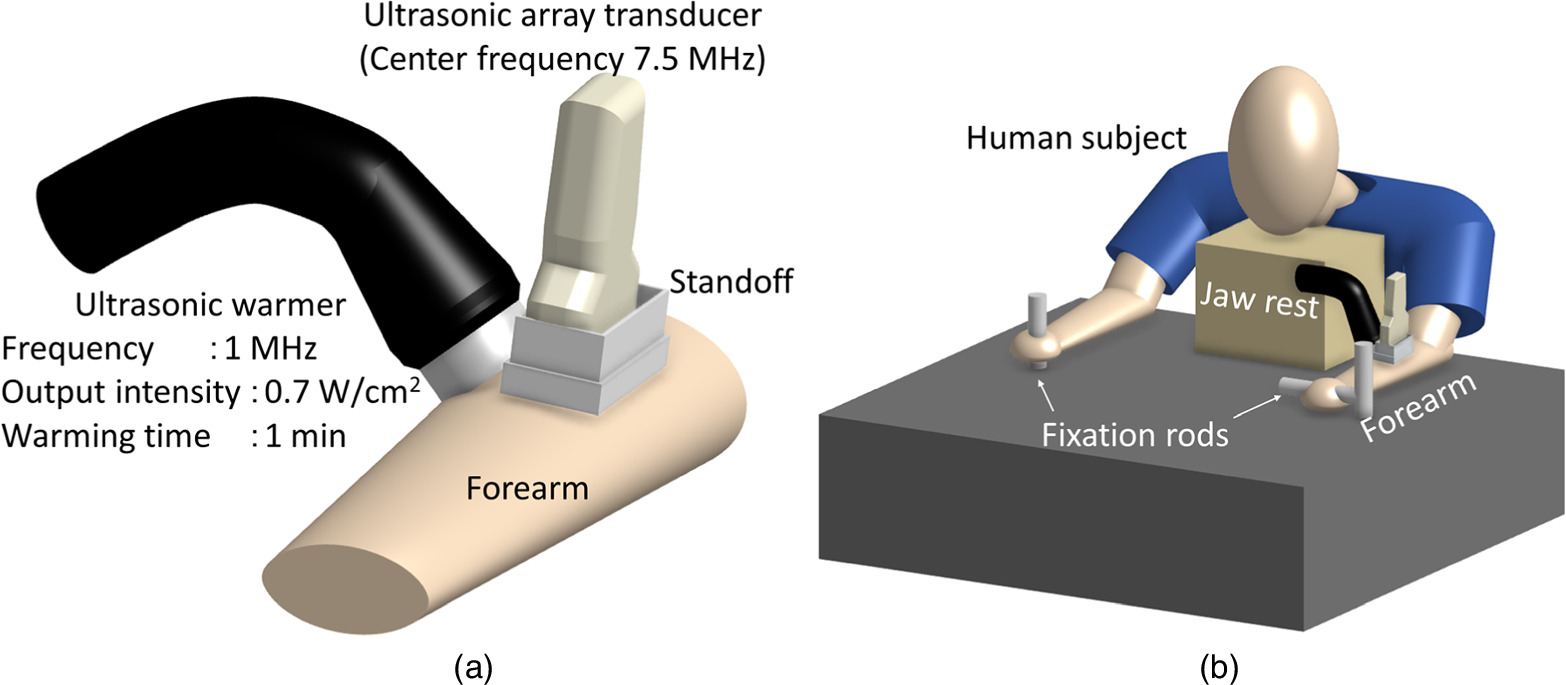
Fig. 2. (a) Experimental setup for UVC imaging of the human forearm. (b) Experimental conditions of the subject. UVC, ultrasonic velocity change.
Download figure:
Standard image High-resolution imageFigure 3 shows an example of average image correlation values calculated using zero-mean normalized cross correlation (ZNCC) 17,37) for 270 echo images of a human forearm acquired over 9 s, which is plotted against the difference in the image numbers between paired images (defined as m values). Specifically, the ZNCC values were computed for the pair of the kth image and the (k + m)th image (where k and m are integers). By maintaining a constant m value, the ZNCC value was computed for each k, systematically incremented by 1, starting from an initial value of 1, ensuring that the sum of k and m did not surpass 270. This process was executed to obtain the average ZNCC value. Figure 3 shows the results of repeating this process by varying the m value from 1 to 269. The average ZNCC value exhibited multiple maxima when the m value was a multiple of 27, which corresponded to an almost 0.9-s interval (∼27 × 33 ms), indicating the influence of heartbeat. To obtain a valid UVC image, it is crucial to suppress the influence of motion and generate a substantial time difference (equivalent to a large temperature difference) between paired images. Therefore, it is necessary to extract paired images at the time difference (corresponding to the m value) where the ZNCC value reaches one of the local maxima. Nevertheless, as the optimal time difference is contingent on individual variations and warming conditions, it is imperative to execute the process shown in Fig. 3 for each acquired set of image data to estimate the suitable time difference between paired images.
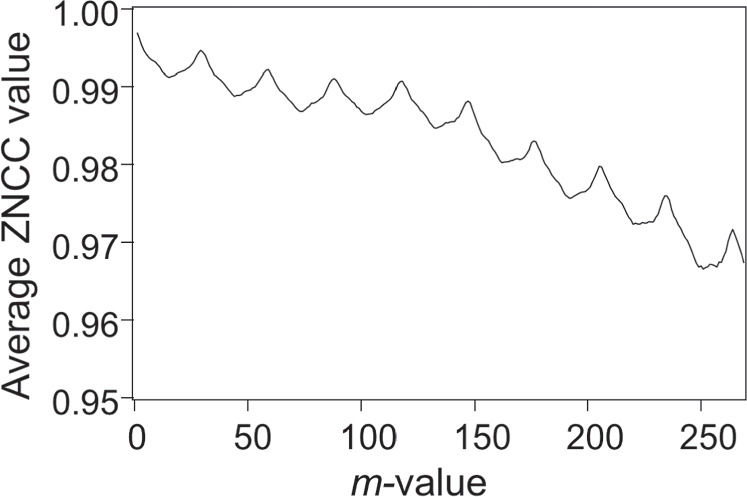
Fig. 3. Variation in the average ZNCC value as a function of the difference in the number of images between paired images. ZNCC, zero-mean normalized cross correlation.
Download figure:
Standard image High-resolution imageWhile generating UVC images, only image pairs with ZNCC values exceeding a specified threshold are used among all image pairs extracted with an appropriate m value. The ZNCC threshold varies depending on the targeted area, often set at ≥0.970 to effectively eliminate the impact of motion artifacts, with the maximum ZNCC value as 1. Let n represent the number of image pairs exceeding the specified ZNCC threshold.
2.3. Warming characteristics of an ultrasonic warmer
Figure 4 shows the experimental setup designed to examine the warming characteristics of the ultrasonic warmer. The target for warming was a TMM phantom (OST, 100 × 100 × 100 mm), which was installed in 20 °C water and subjected to warming using an ultrasonic warmer placed adjacent to it. To monitor the temperature variations, thermocouples were positioned along the central axis of the ultrasonic beam at depths of 5, 10, and 15 mm.

Fig. 4. Experimental setup for investigating the warming characteristics of an ultrasonic warmer.
Download figure:
Standard image High-resolution image3. Results
Figure 5 shows a B-mode image of a human forearm. The gel layer within the standoff extends to a depth of 5 mm, followed by a subcutaneous fat region approximately 3 mm below the gel layer. Additionally, a muscular layer region is discernible at a depth of ≤8 mm. To mitigate the impact of the heartbeat, measurements were conducted in areas lacking large blood vessels.

Fig. 5. B-mode image of the human forearm.
Download figure:
Standard image High-resolution imageFigure 6 shows an instance of a UVC image obtained when an m value, which is not aligned with the heartbeat period, was chosen. This image was obtained using the data between 25 and 34 s after the start of warming where the m and n values are set at 263 and 5, respectively, with a ZNCC threshold of 0.98.

Fig. 6. Example of a UVC image of the human forearm when the m value was set to 263. UVC, ultrasonic velocity change.
Download figure:
Standard image High-resolution imageFigure 7 shows the average UVC images derived from the data collected at three distinct time points: (a) before the start of warming, (b) 25–34 s after the start of warming, and (c) 60–69 s after the completion of warming. The corresponding m values were (a) 31, (b) 57, and (c) 92, resulting in time differences between paired images of approximately (a) 1.0, (b) 1.9, and (c) 3.1 s corresponding to (a) one, (b) two, and (c) three heartbeat periods, respectively. The ZNCC threshold was set to 0.995, and the n values used to average the UVC images were (a) 174, (b) 39, and (c) 39, respectively.
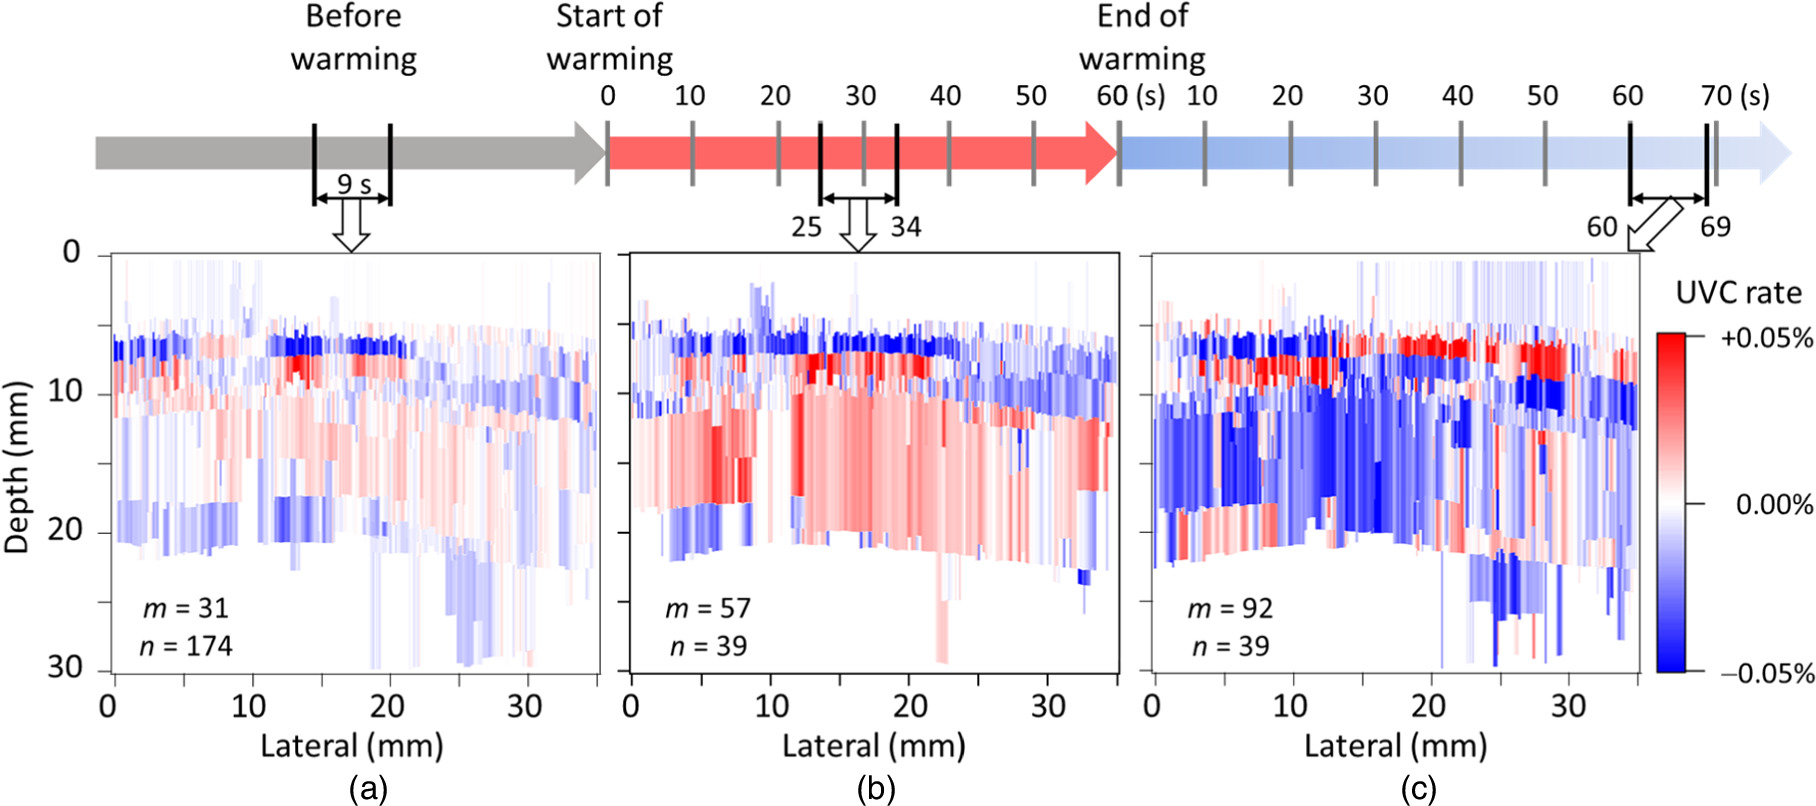
Fig. 7. UVC images of the human forearm obtained from echo data collected (a) before, (b) during, and (c) after warming. UVC, ultrasonic velocity change.
Download figure:
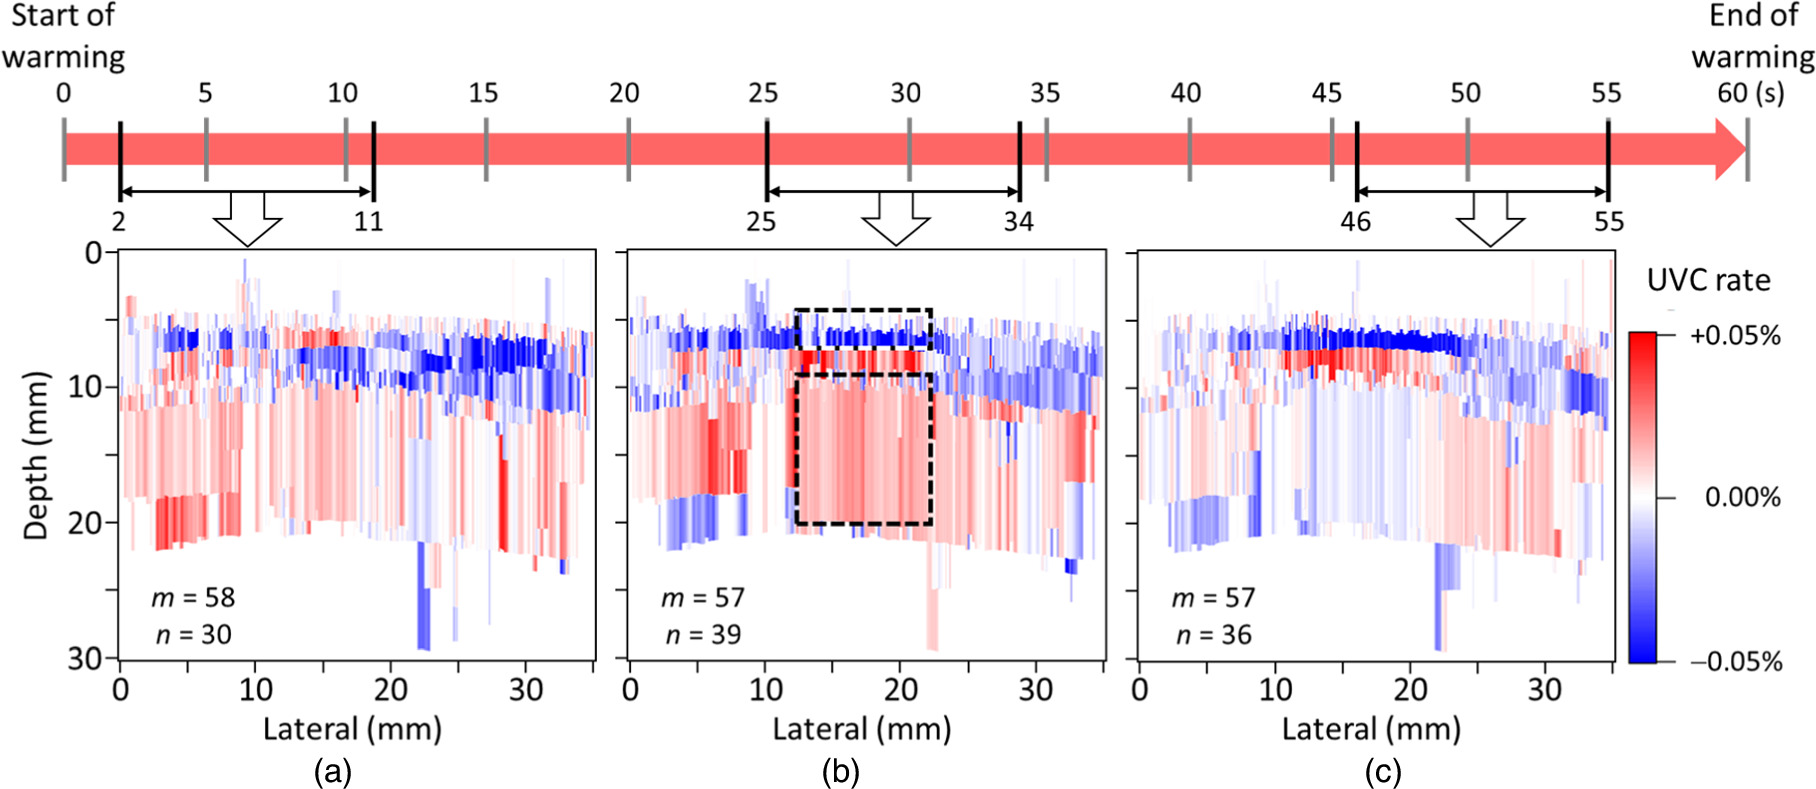
Standard image High-resolution imageFigure 8 shows the average UVC images obtained at three distinct 9-s intervals: (a) 2–11, (b) 25–34, and (c) 46–55 s after the start of warming during a 1 min warming period. To mitigate the influence of the heartbeat, the m values were set to (a) 58, (b) 57, and (c) 57, respectively. This implies that the time difference between paired images was approximately 1.9 s, corresponding to a time difference of two heartbeat periods. The n values were (a) 30, (b) 39, and (c) 36, respectively, under the condition of a ZNCC value >0.995.

Fig. 8. UVC images obtained from echo data collected from (a) 2–11 s, (b) 25–34 s [same as those shown in Fig. 7(b)], and (c) 46–54 s after the start of warming. UVC, ultrasonic velocity change.
Download figure:
Standard image High-resolution imageFigure 9 shows the results of a continuous measurement capturing the temporal temperature changes at three distinct locations. Each measurement is spaced 5 mm apart from the output end of the ultrasonic warmer over a 1 min duration. This was accomplished by exposing the TMM phantom to the output of the warmer, which is characterized by an intensity of 0.7 W cm−2 and a frequency of 1 MHz.

Fig. 9. Temporal changes in temperature at three positions (5, 10, and 15 mm in depth) when the TMM phantom was irradiated with ultrasonic output (intensity: 0.7 W cm−2, frequency: 1 MHz) from the ultrasonic warmer for 1 min. TMM, tissue-mimicking material.
Download figure:
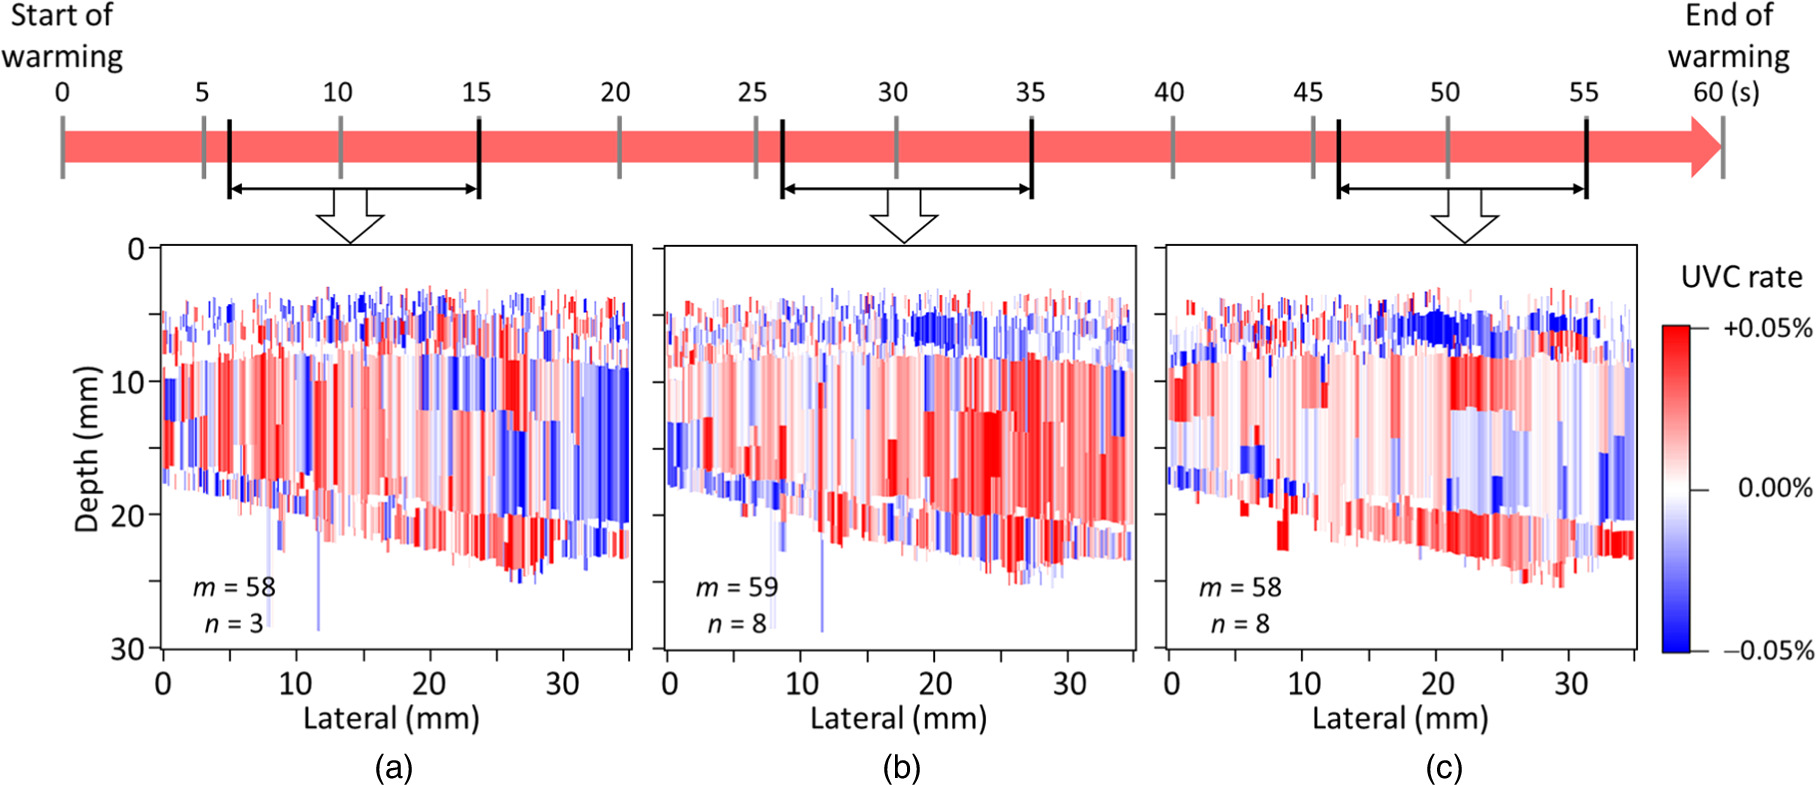
Standard image High-resolution imageFigure 10 shows the average UVC images of the forearms of a distinct subject. Similar to Fig. 8, each image was generated from 9-s interval data obtained approximately (a) 10, (b) 30, and (c) 50 s after the start of warming. The m values were set to (a) 58, (b) 59, and (c) 58, respectively. The ZNCC thresholds were set as (a) 0.984, (b) 0.987, and (c) 0.997, respectively, and the n values were (a) 3, (b) 8, and (c) 8, respectively.
Fig. 10. UVC images of the forearms of different subjects. Each image was depicted from the echo data obtained approximately (a) 10, (b) 30, and (c) 50 s after the start of warming. UVC, ultrasonic velocity change.
Download figure:
Standard image High-resolution image
4. Discussion
The areas shown in Fig. 5 are empirically recognized to correspond to regions of subcutaneous fat and muscle. However, they cannot be conclusively identified solely in the B-mode image. In addition, even if the region shown in Fig. 5 lacks large blood vessels, it remains susceptible to heartbeat effects during the acquisition of the UVC image, as shown in Fig. 3.
In Fig. 6, with the m value set to a large value of 236, we anticipated effectively detecting the pulse-echo shift induced by temperature changes as a signal component. However, in the central part of the target area, which should have been efficiently warmed with the ultrasonic warmer (lateral 10−20 mm), the fat region (depth 5−10 mm) appeared in white, indicating no temperature changes, whereas the muscle region (depth 8−20 mm) was colored in blue, signifying a significant temperature decrease. Additionally, the adjacent muscle region (lateral 20−35 mm, depth 10−20 mm), was colored in red, indicating a temperature increase. This is believed to be attributed to the occurrence of eight heartbeats during the time interval between paired images (one heartbeat period corresponds to m = 28), aligning with the case when the average ZNCC value in Fig. 3 decreased to 0.975 at m = 236. This implies that the pulse-echo shift caused by tissue movement became a noise component, masking the signal component.
In the average UVC image shown in Fig. 7(a) before warming, the m value was reduced to 31, corresponding to one heartbeat period, to minimize the impact of tissue movement. Under these conditions, the UVC image is expected to ideally display a uniform white appearance across the entire area, as there is no temperature variation. Nevertheless, the human forearm undergoes slight cooling upon contact with room-temperature ultrasonic gel and the ultrasonic probe. Subsequently, it returns to its original body temperature through blood flow. Consequently, in the UVC image, although the contrast is subtle, the effects of cooling and warming become apparent based on the timing of the measurement. In Fig. 7(a), the presence of the fat region colored in blue and a broad area of the muscle region colored in red indicates that the UVC image was obtained during the warming phase. However, due to the minimal temperature changes, the contrast in the UVC image remains low. Additionally, as the amplitude of the echo signals from regions deeper than 25 mm was small and fell below the set threshold, estimating the UVC quantity for those areas became unfeasible. Consequently, these areas were depicted in white.
In contrast, in Fig. 7(b) derived from echo data obtained during ultrasonic warming, the subcutaneous fat and muscle regions are distinctly colored in blue and red, respectively, providing high contrast. It is presumed that a clear UVC image reflecting the effects of temperature increase was obtained in comparison to Fig. 7(a). In this scenario, a trade-off exists between capturing the effects of warming and suppressing the influence of tissue movement. Consequently, the m value was set to 57, corresponding to two heartbeats.
Finally, in the average UVC image shown in Fig. 7(c) derived from postwarming echo data, the gradual temperature changes due to heat conduction within the body necessitated a substantial m value of 92 to effectively capture the temperature increase. Thus, in the centrally warmed region (lateral 10−20 mm), the subcutaneous fat and muscle regions are colored in red and blue, respectively, indicating the successful acquisition of a meaningful UVC image. However, with a larger m value, the influence of tissue movement becomes more prominent. Compared with the warming phase in Fig. 7(b), the entire observed area exhibits increased noise.
Based on the findings from Fig. 7, the effectiveness of generating UVC images from echo data during warming was confirmed. Subsequently, we investigated the optimal timing for data acquisition to produce UVC images during a 1 min warming period, as shown in Fig. 8. In Fig. 8(a), the UVC image obtained from echo data immediately after warming (2−11 s) displayed subcutaneous fat and muscle regions in colors indicative of an overall warming trend. However, due to the immediate postwarming period, the separation of subcutaneous fat and muscle regions was unclear, potentially influenced by factors, such as ultrasonic gel, resulting in low contrast. Conversely, in Fig. 8(b), drawn approximately 30 s after warming (25−34 s) [same as Fig. 7(b)], the UVC image exhibited a distinct separation of subcutaneous fat and muscle regions with increased contrast. The estimated temperature difference between paired images in the region enclosed by the dashed line in Fig. 8(b) was 0.14 °C ± 0.04 °C, corresponding to (7.3 ± 2.2) × 10−2 °C s−1. Additionally, in Fig. 8(c), depicting the UVC image approximately 50 s after warming (46−55 s), subcutaneous fat appeared in blue, indicating a temperature increase, whereas the central muscle region shifted to blue, signifying a temperature decrease. This often-observed phenomenon suggests that during the temperature saturation period caused by warming, the body's response—attempting to return to the original temperature through blood flow—surpasses the temperature increase, resulting in a temperature decrease. In conclusion, it was determined that utilizing echo data approximately 30 s after warming is crucial for obtaining effective UVC images.
Table I compiles the mean values and standard deviations of the UVC rates derived from the average UVC images presented in Figs. 7 and 8. The computations focused on the subcutaneous fat (lateral 13−23 mm, depth 5−8 mm) and muscle regions (lateral 13−23 mm, depth 10−20 mm), which are delineated by the dashed lines shown in Fig. 8(b). From the data in Table I, it is apparent that the standard deviations of the UVC rates are relatively large compared with the mean values, emphasizing the modest magnitude of the echo shift. Notably, in the narrow subcutaneous fat region, where the echo shift is relatively small, the standard deviation tends to increase. Across all UVC images except Fig. 8(b), the standard deviations of the UVC rates for the subcutaneous fat and/or muscle regions exceed the mean values, indicating a reduction in reliability for determining the fat region. As discussed above, for effective fat region determination, it is imperative to generate UVC images under the conditions of Fig. 8(b), utilizing echo data approximately 30 s after warming.
Table I. Average and standard deviation of the UVC rates of the average UVC images under ultrasonic warming.
| Figure 7(a) | Figure 8(a) | Figure 8(b) | Figure 8(c) | Figure 7(c) | |
|---|---|---|---|---|---|
| Before | 2−11 sec. | 25−34 sec. | 46−55 sec. | After | |
| Subcutaneous fat | |||||
| Average (%) | −0.0199 | 0.0017 | −0.0278 | −0.0319 | 0.0199 |
| Standard deviation (%) | 0.0209 | 0.0016 | 0.0248 | 0.0256 | 0.0264 |
| Muscle | |||||
| Average (%) | 0.0014 | 0.0048 | 0.0136 | −0.0036 | −0.0227 |
| Standard deviation (%) | 0.0090 | 0.0095 | 0.0083 | 0.0051 | 0.0125 |
Figure 9 shows the temperature progression in the TMM phantom measured at various thermocouple positions, showing an almost proportional increase from the start of warming. Temperature elevations of 2.16 °C, 1.86 °C, and 1.02 °C were observed at depths of 5, 10, and 15 mm, respectively, after a 1 min warming period at 1 MHz ultrasonic power of 0.7 W cm−2. When this result is compared with the temperature change in the muscle region enclosed by the dotted line shown in Fig. 8(b), it becomes evident that an overestimation by a factor of 2–4 occurs in Fig. 8(b). However, it is crucial to consider that the thermal time constant of the TMM phantom is larger than that of biological tissue. Additionally, the biological response leading to the saturation phenomenon observed in Fig. 8 does not manifest in the TMM phantom. Consequently, the temperature increase estimated from the UVC image in Fig. 8(b) was attributed to ultrasonic warming, confirming the validity of the UVC image in Fig. 8(b).
Figure 10 shows the UVC images captured from different subjects. The m value, corresponding to two heartbeat periods, was applied to obtain each UVC image. This subject demonstrated a more noticeable motion effect. Despite the influence of subject variations on UVC image quality, the highest contrast was consistently achieved around 30 s after the start of warming, mirroring the outcomes shown in Fig. 8. Consequently, it is inferred that data acquisition approximately 30 s after the start of warming is most effective for UVC image depiction. Similar to Fig. 8(b), when estimating temperature changes in the muscle region, increases of 0.15 °C ± 0.16 °C were observed. These values align with the reasonable range established by experimental results using the TMM phantom as shown in Fig. 9, affirming the validity of the UVC images presented in Fig. 10. Additionally, before and after applying the ultrasonic warmer, skin temperature was monitored using a thermal imaging camera. The observations revealed a temperature rise of 1.5 °C within a span of 1 min. In accordance with the World Federation for Ultrasound in Medicine and Biology guidelines, 38) this increase is deemed clinically acceptable. This finding substantiates the conclusion that UVC imaging can be safely conducted within established safety parameters. However, caution should be exercised when bones are in close proximity to the target site. Bones have a high thermal index and can experience a significant temperature increase. Therefore, in accordance with the ALARA (As Low As Reasonably Achievable) principle, it is advisable to perform warming with the lowest possible ultrasonic output in such scenarios
5. Conclusions
The present study aimed to identify conditions for consistently obtaining effective UVC images from the human body. The UVC method, in conjunction with ultrasonic warming, was applied to the human forearm, which is less affected by heartbeats. Consequently, by aligning the time difference between paired images to two heartbeat periods based on the echo data obtained approximately 30 s after the start of warming, we successfully obtained valid UVC images that clearly reflected the subcutaneous fat and muscle regions. Our final goal is to obtain UVC images capable of depicting unstable plaques in the carotid artery, and we will apply the measurement conditions acquired in this study to achieve the goal.
Ethics
This study was approved by the Ethics Committee of Osaka Prefecture University (Approval No. 17-3).