

Abstract
This paper reports the results from a student-led Search for Extraterrestrial Intelligence (SETI), also known as technosignatures, targeting the plane of the Milky Way as a part of the Goldstone Apple Valley Radio Telescope (GAVRT) collaboration between the Lewis Center for Educational Research (LCER) and the Jet Propulsion Laboratory. Students associated with LCER submit analytic reports of spectral data targeting specific regions of the Milky Way, identifying interference, noise, and Candidate signals potentially originating from intelligent sources. GAVRT-SETI's search is guided by the assumption that a narrow-band radio signal (<1.5 Hz) from a fixed location in the sky, occurring across multiple observation periods, is unlikely to be caused by instrument noise or by a natural source. Thus, we searched the reported data for similar signals occurring during different observation periods within the same region of sky. No such signals were found. However, our analysis of the frequency distribution of Candidates suggests that at least a few percent of the Candidates are associated with low-level radio-frequency interference.
Export citation and abstract BibTeX RIS

Original content from this work may be used under the terms of the Creative Commons Attribution 3.0 licence. Any further distribution of this work must maintain attribution to the author(s) and the title of the work, journal citation and DOI.
1. Introduction
Until recently, searches for intelligent life as revealed by detectable technologies, dubbed "technosignatures," have played little part in various efforts in the field of astrobiology. This in spite of the fact that the often-used banner heading "Are we alone?" evokes in most people a quest for mathematicians, not microbes. Abundant evidence supports the hypothesis that given the correct environment and enough time, life will evolve through chemical evolution. The main ingredients of life and the processes that lead to the origin of life appear to be widespread throughout the Galaxy. On Earth, once life was established, natural selection and environmental pressures eventually led to complexity and intelligence. It remains to be seen whether the trend toward complexity was a simple drift or an evolutionarily driven trend (e.g., Marino et al. 2004). Given the major impact-events that have repeatedly stressed life on Earth, this distinction is crucial and likely leads toward scarcity of intelligent life rather than abundance. Thus, if intelligent civilizations are extremely rare, then our search space needs to contain a very large number of stars. For example, if one makes optimistic assumptions for most of the factors in the Drake equation (Drake 1962), such that an intelligent civilization develops around every star, and all such civilizations attempt to communicate with us, but also assumes that the lifetime of a detectable intelligent civilization is 1000 yr (perhaps due to the aforementioned impact events or self-destruction) and assumes a range of a billion years for the time in which a civilization began, then at this moment in time only one in a million stars will have a detectable intelligent civilization. Thus humanity's overall search strategy must allow for the possibility that intelligent life is exceedingly rare. Fortunately recent discoveries by the Kepler Space Telescope (Thompson et al. 2018), showing that almost every star is likely to have a planet, lead to the conclusion that there must be solar system analogs associated with most of the ∼400 billion stars in our Galaxy. This in turn sets up two general approaches to searches for technosignature.
Over the last four decades, the search for extraterrestrial intelligence (SETI) signals has been undertaken across the electromagnetic spectrum, with ever increasing sensitivity (Tarter et al. 2010; Wright et al. 2018). But with the advent of the results from the Kepler Space Telescope (and other observatories and techniques) identifying individual stars that have planets as well as establishing the statistics that most stars likely harbor planets, those SETI efforts have coalesced around two broad approaches. One type of effort seeks to maximize the likelihood of detecting technosignatures by searching for signals from known exoplanet hosting stars (e.g., Pinchuk et al. 2019; Margot et al. 2021; Tremblay et al. 2022; Wandia et al. 2023).While the other type of effort seeks to find technosignatures by looking at a very large number of stars in the disk or bulge of the Milky Way (e.g., Isaacson et al. 2017; Gajjar et al. 2021) with the statistical expectation that most, if not all of those stars, will have one or more planets. These two approaches can be recontextualized into an approach where the first is a higher sensitivity search targeting fewer/closer targets and the second is a lower sensitivity search targeting more-numerous/farther stars. The more targeted searches are sensitive to weaker emitted signals which require less energy and so are more likely to be generated, even though the search contains fewer sources. While the broader search is sensitive to more powerful emitted signals which require more energy, and thus are perhaps less probable, but compensated for by the vast numbers of stars being scanned. We do not claim that either of these searches is superior to the other, but merely argue that each provides an insight into fc which is the factor of the Drake Equation that quantifies civilizations that develop interstellar communication.
Here we present a SETI survey motivated by the second approach outlined above which aims to search a substantial percentage of stars in our Galaxy with sensitivity to more powerful emitted signals. About 90% of the stars in the the Milky Way are concentrated near the Galactic plane that occupies approximately 10% of the sky, making the plane an ideal part of the sky to start a non-targeted SETI sky survey. Looking within ±5° of the Galactic plane, DSS-28, a NASA 34 m antenna located at the Deep Space Network (DSN) site in Goldstone, California, can survey the Galactic Longitude from 0° to 270° and then again from 340° to 360°. The Goldstone Apple Valley Radio Telescope (GAVRT) collaboration between the Lewis Center for Educational Research (LCER) and the Jet Propulsion Laboratory (JPL) has allowed for this SETI search to be done primarily by students. GAVRT aims to provide both educational and scientific opportunities to middle and high-school students (ages ∼10–18 yr old). While students learn scientific skills in the classroom through directing telescope observations and analyzing data from these observations, GAVRT fulfills its scientific directive by using observation and analysis conducted by these students to contribute to the scientific community beyond the classroom. One of the key issues with this type of search is recognizing the patterns that indicate the presence of radio frequency interference (RFI). Human beings are very good at pattern recognition, but looking at all the data in hand is very labor intensive. Here we take the opportunity to involve a large number of students in that process. Students participating in this project submit analytic reports of spectral data targeting specific regions of the Milky Way, identifying interference, noise, and Candidate signals potentially originating from intelligent sources.
GAVRT-SETI's search is guided by the assumption that a narrow-band radio signal (<1.5 Hz) from a fixed location in the sky, occurring across multiple observation periods, is unlikely to be caused by a natural source. During each of the students' repeated observations of the Galactic Plane, the radio telescope is constantly moving, observing any fixed location on the sky for less than four seconds. Students examine the data and create reports identifying as RFI any potential Candidates which are visible for longer than a few seconds, but marking as potential Candidates signals which are consistent with an origin from a fixed point on the sky. Thus, we searched the student report data for similar Candidate non-RFI signals occurring during different observation periods within the same region of sky, and report the statistical findings in the following sections.
2. Observations
The science goal of GAVRT-SETI is to search for radio signals that may have originated from intelligent extraterrestrial sources. To accomplish this, students command observations of DSS-28, a repurposed 34 m beam waveguide antenna at the Goldstone DSN complex (Imbriale et al. 2011; Jones 2011).
SETI observations are conducted at 8.45 GHz with the telescope scanning a rectangle 5 2 in Galactic longitude by 07 in Galactic latitude, at the rate of 0052 s−1. The region scanned is termed a "skyframe," with the pointing center of the telescope following a "race-track" pattern across the skyframe (Figure 1). The antenna scans the full skyframe in 2480 s, during which 21 scanlines are traversed for 100 s each and 19 s is spent in between each pair of scanlines.
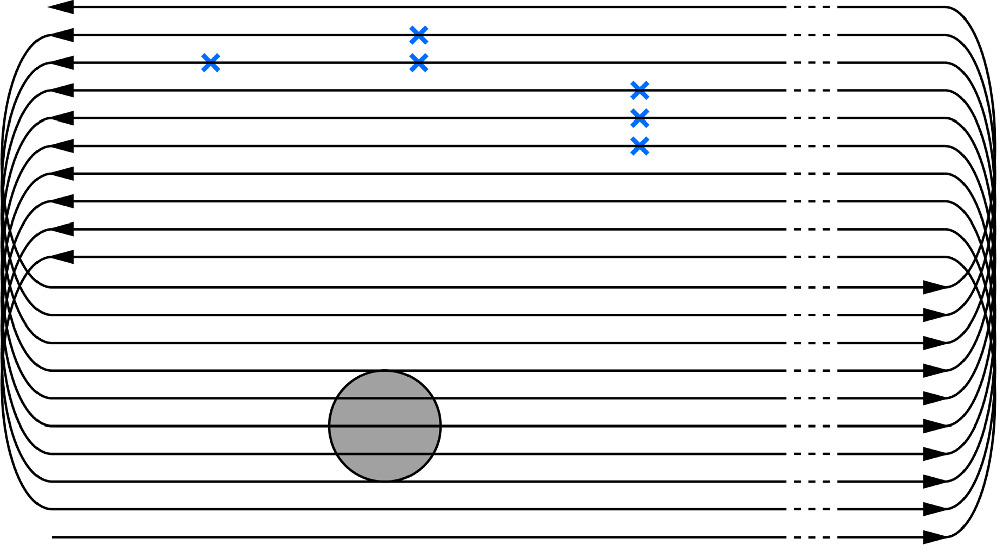
Figure 1. The racetrack scan pattern accommodates a simple technique for matching repeated observations. Arrows indicate the direction in which scanlines are observed. The racetrack is shortened for illustrative purposes. Skyframe width is approximately 7.5 times the height. The gray circle indicates the beam size, and the Xs indicate possible detections. A single X indicates a well centered signal on a scanline. The two X'es on top of each other indicate a signal source between the scanlines. The three X'es on top of each other indicates a very bright source that spills over multiple scalines.
Download figure:
Standard image High-resolution imageThe motivation for this race-track pattern is that a constant radio signal, originating from a fixed location on the sky, will be observed for a short time (<4 s) as the telescope sweeps past it. In a subsequent visit to the same skyframe, this constant signal from a fixed location would be seen again at the same interval of time from the beginning of a scan. There is a possibility that the source may fall in between two adjacent scanlines, so that it is detected in one scanline, and then detected again 238 s later in the adjacent scanline. Finally if the signal is strong enough then it may even be picked up in three neighboring sweeps due to the size of the telescope's beam. All these potential signals are represented in Figure 1 as Xs on the notional racetrack pattern.
Data from these observation sessions are processed with a spectrometer based on the BEE2 architecture (Chang et al. 2005) that has 200 MHz bandwidth and 134,217,728 frequency bins. This number of frequency bins allows the selection of extremely narrow (<1.5 Hz) signals as originating from non-natural sources as natural phenomena have a much wider width in frequency emission.
Out of the ∼134 million frequency bins in each spectrum, the highest-power bins (approximately 1000 bins per spectrum) are displayed on waterfall plots on the GAVRT-SETI website's data viewer (Figure 2). When (as is often the case) the choice of display settings results in pixels wide enough to contain more than one bin, the brighter bin is displayed. Students analyze these plots, identifying and rejecting RFI and noise which are signals identified by the fact that they occupy a wider time range than expected for a signal that may have come from an intelligent extraterrestrial source. After rejecting RFI and noise, the student selects the most credible Candidates which are signals that occupy one frequency bin and are not longer than 4 s, thus guaranteeing both that the signal is narrow in frequency (<1.5 Hz) and that the source is fixed on the sky as the telescope sweeps by. Setting a single bin as our detection requirement for a Candidate signal is also motivated by increasing our sensitivity as signals that are varying in frequency due to Doppler shift would be spread across multiple bins and hence weaker. To aid in this Candidate detection process, when a student selects "display markers," the brightest 10 bins in the data file (excluding those which the student has marked as RFI) are highlighted on the display. The number of Candidates to report is left up to the student, and the number of Candidates reported per session ranges from 0 to 16.
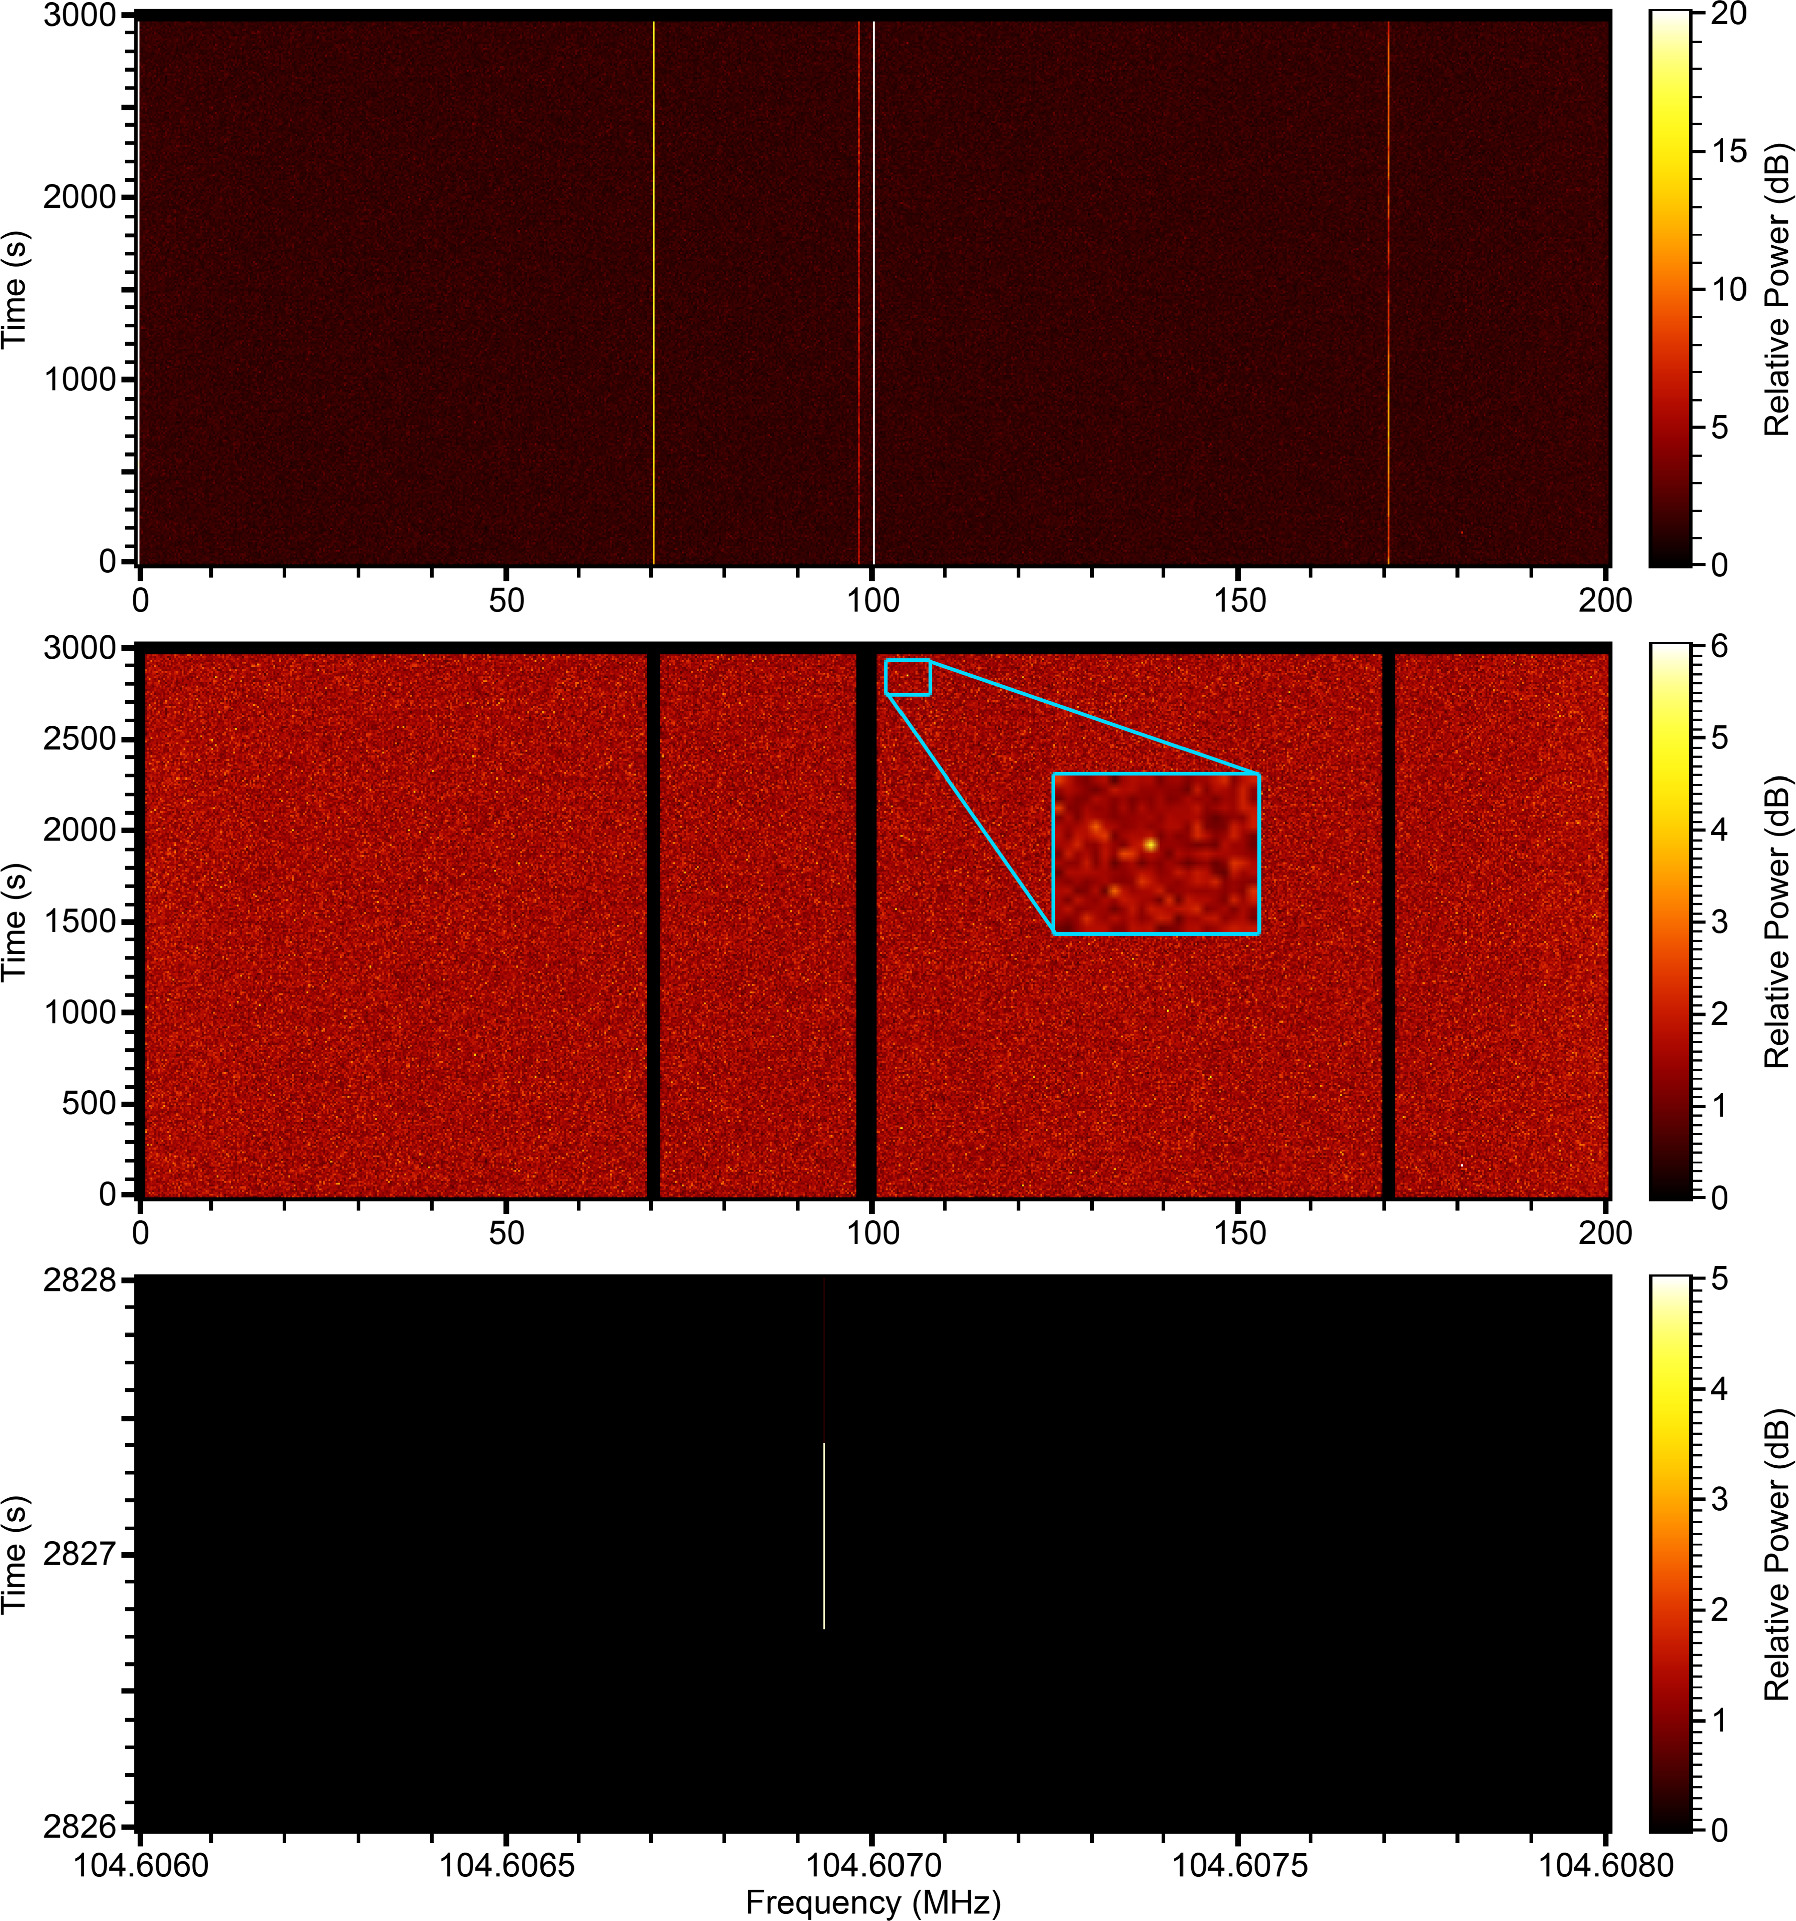
Figure 2. Illustration of a waterfall plot generated by the GAVRT-SETI project and analyzed by the students. The top waterfall plot is the original. The middle plot is where the RFI has been masked to bring out lower power signals. The exploded square in the middle waterfall plot shows a view of a potential Candidate signal. The lower waterfall plot is a highly zoomed-in version of the same signal shown in the exploded square where the signal spans slightly less than one second and is at 104.60695 MHz.
Download figure:
Standard image High-resolution imageOf course, GAVRT's observation alone would not be able to confirm that a signal is evidence of extraterrestrial intelligence, but finding such a signal with the above noted characteristics would warrant further investigation of that location. As noted in the introduction, SETI projects either closely examine a narrow swath of sky or broadly examine a wide swath of sky. If GAVRT-SETI were to find any potentially non-natural signals, projects that operate under the former paradigm may be able to follow-up with further observations.
The purpose of student analysis of scan data is to manually filter out interference and identify reliable Candidate signals. Until recently, submitted student-reports (around 280 of them) remained in unstandardized PDF form and thus had not yet been fully analyzed to see if any reported Candidate signals constitute such a match. Here, after having standardized the submitted reports, we assess the current body of data and analyze the data, looking for signals that are less likely to originate from human interference or natural radio sources.
Teachers who have used GAVRT-SETI in their classes have found it to be a great complement to their traditional approach to teaching graphing and graph interpretation since waterfall plots are great examples of x, y plots, but with the added motivation that the students' efforts could have a payoff that other graphing activities could not have: the chance to find an extraterrestrial signal from an intelligent source.
Figure 3 shows the "exposure map" from all of the skyframes observed during the interval 2013 to 2021, reported here. The darker the gray, the more observations have been taken of that tile. The figure shows that there are 39 skyframes that have visits of two or more which covers 142 square degrees of sky.
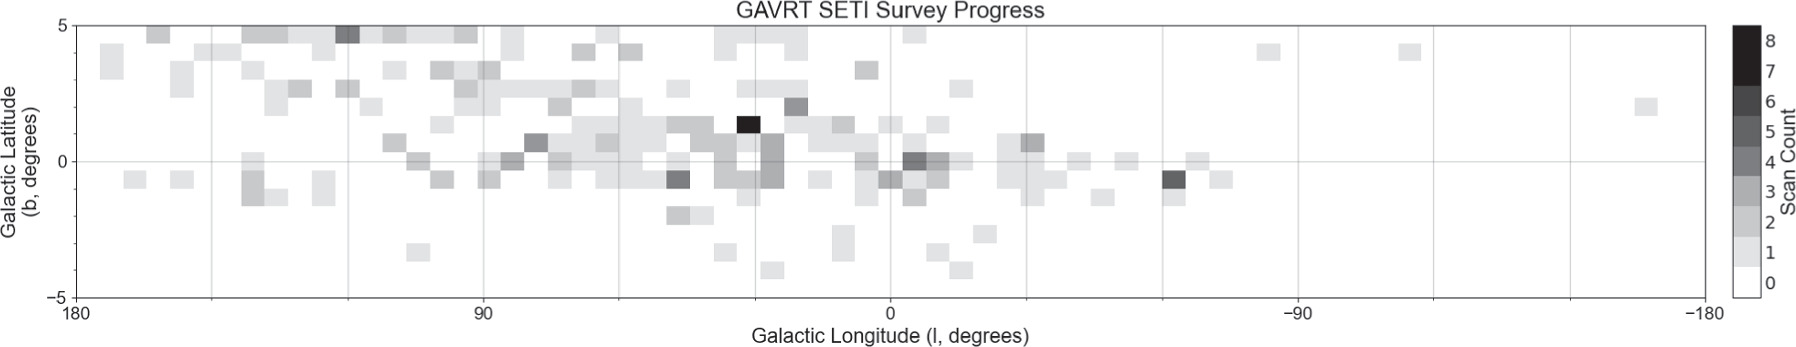
Figure 3. Exposure map showing the skyframes that are rectangles 52 in Galactic longitude by 07 in Galactic latitude, observed by the GAVRT-SETI project during the interval 2013 to 2021. The area covered with 2 or more visits is 142 square degrees.
Download figure:
Standard image High-resolution image2.1. Methods
For the creation of student reports and analysis of student report data we outline the basic steps in the enumerated list below and then provide greater details after the list.
- 1.Teachers and students chose a skyframe to observe.
- 2.Students analyzed the skyframe in the GAVRT online waterfall plot.
- 3.Students recorded times and frequencies of RFI, Noise, and Candidate signals into files which were saved as PDFs.
- 4.These lists were compiled at JPL and a master list of RFI, Noise, and Candidate signals was created.
- 5.A sub-list of the Candidate signals was created where a Candidate signal is matched with one or more Candidate signals that were separated by less than 1 MHz in frequency. Note that this matching is independent of whether these Candidates originated at the same exact position on the sky, but it was required that the Candidates were in skyframes that were observed at least twice so that there could be the possibility that they originated at the exact same location in the sky.
- 6.All these Candidates were searched for position-dependent, scan-independent, and position-independent matches. A position-dependent match would make the Candidate a likely technosignature Candidate.
Individual student reports, originally archived in PDF format, were converted into a standardized Excel format. Data fields were left the same with the exception of an additional field for RFI power. Reports containing obviously erroneous data beyond the scope of the telescope's observations were separated into a discard folder so as not to affect our analysis. Once all individual reports were converted to Excel, they were compiled into separate RFI, Noise, and Candidate master Excel files, on which all analysis scripts were conducted.
A file containing only reported Candidate signals that occupied one bin (<1.5 Hz) and lasted no more than 4 s was created so that analysis scripts could reference only data that actually met the baseline requirements of a potential SETI signal. The signal would be considered a potential SETI signal if the two Candidate signals originated from the same location in the sky in two independent visits to the same skyframe. A criterion of a difference of 1 MHz was set as the standard to compare between Candidates identified between revisits of the same skyframe because it was wide enough to accommodate for a relative rotational Doppler shift between the Earth and the transmitting planet of almost two orders of magnitude (1 MHz/8.45 GHz ∗ c = 36 km s−1 as compared to the Earth's equatorial rotational velocity of 0.46 km s−1.) yet it was narrow enough not to generate false positives.
For each category of signal data (RFI, Noise, Candidate), scripts to search for position-dependent, scan-independent, and position-independent matches were written, each using the same matching algorithm with parameters adjusted as needed. This matching algorithm also included looking for matches in adjoining scanlines as described in Figure 1. Because it was unlikely that any position-dependent Candidate signal matches would be found, and ultimately none were found, this script was tested on a data set that included an artificially introduced match to ensure proper functioning of the code.
2.2. Instrumentation Calibration and Sensitivity
The system was calibrated using data from GAVRT's observations of spacecraft transmissions. GAVRT observed downlink from the Mars Odyssey spacecraft several times in 2019 July 4 (Figure 4). Several low-noise GAVRT scans were selected and analyzed to compare the observed GAVRT signal power with the known/official signal power observed by the DSN.

Figure 4. Waterfall plot showing the radio signal from the Mars Odyssey mission which was used for calibration.
Download figure:
Standard image High-resolution imageThe sensitivity of our survey is set not only by the instrumental sensitivity, but also by the ability of students to identify potential signals. That sensitivity is derived from student choices, and so we took the average over all the reports of the lowest dB Candidate signals identified by students in each report which was 4 dB. Then to see how representative that 4 dB value was as a sensitivity limit, we injected 43 artificial signals of varying time-spans and powers across sixteen of our waterfall plots and asked a new group of students that had not previously examined waterfall plots to see which signals they would identify as Candidates. Their analysis recovered 19 out of 20 (95%) of the artificial signals of 4 dB or greater but failed to identify signals lower than 4 dB. Thus we are confident of our 4 dB limit. To translate that dB value into a flux sensitivity we took a ratio of the student Candidate limit signal and the Mars mission calibrated downlink signal (noted above) to derive our flux sensitivity. However, the spectrometer has varying gain across the spectrum and so a signal with the same power would be detected at varying dBs depending on the frequency bin that detected the signal. This gain variation is not random and has a specific pattern across the spectrum analyzer. We have fit this pattern and chosen an instrumental limit such that, for a given flux at any frequency, and hence any gain, 95% of the bins would be above our student determined detection threshold. The above efforts result in a sensitivity of 1.4 × 10⁻²⁰ W m−2 for detecting 95% of signals, assuming that the signal is narrower than the 1.5 Hz bandwidth of our spectrometer bins. A signal which is split over multiple frequency bins would of course require proportionally greater power to reach our detection threshold.
Finally a note on the signal to noise of our detections. The power levels reported by the spectrometer are already divided by the average power, with a scale factor where 0 dB corresponds to 12 times the average power, hence our sensitivity limit of 4 dB corresponds to 30 times the average power in a bin. This is not, however, a very meaningful way to look at the data set. There are 134 million channels, and we are selecting less than 1 event per spectrum. So we are very far out on the tail of the distribution, and it is highly unlikely to look Gaussian.
2.3. Sensitivity as a Function of Number of Stars and Distance
In and of itself, the above noted sensitivity does not give great insight into how sensitive we are to potential technosignatures, since we do not have a good sense of how strong those signals might be or how many civilizations would be capable of emitting such signals. But what affects both of those questions is how many stars we are looking at. The larger the number of stars, the greater the probability that there would be a civilization capable of sending a radio signal that we would be able to detect.
In blind SETI searches, the metric used to determine the likelihood of detecting a signal depends on the volume that is surveyed, but we would like to highlight the number of stars that are surveyed within the volume of the GAVRT-SETI search. This, of course, is a difficult task and one of the reasons why so many other surveys have chosen the volume-searched as their metric, because there has been no large-scale and reliable star-count versus distance catalog for our Galaxy, especially in the plane. This has begun to change. Portail et al. (2017) made a dynamical model of the Milky Way and in the process included number-counts of red clump giants (RCGs) in various directions near the plane and the bulge of the Galaxy (Figure 18 of Portail et al. 2017).
Another effort at number counts of stars versus distance is facilitated by the Gaia mission (Gaia Collaboration et al. 2016). Smart et al. (2021) used Gaia data to try to identify all stars within 100 pc (320 LY) of Earth and claimed a 92% confidence in their final sample of 331,312 stars. Of this sample, 443 are RCGs.
So although the ratio of RCGs to all stars within 100 pc of Earth is not a perfectly representative ratio for the whole Galaxy, it does allow us to calculate a first order approximation to the number of stars versus direction by applying that ratio to the number of RCGs in various directions calculated by Portail et al. (2017) thus arriving at a first order estimate of the number of stars within a GAVRT-SETI skyframe and their distance distribution.
The final step of estimating the number of stars from Portail et al. (2017) in a GAVRT-SETI skyframe is finding the ratio of the areas covered by a GAVRT-SETI skyframe (a rectangle 52 in Galactic longitude by 07 in Galactic latitude) to that modeled by Portail et al. (2017) (circular regions with a radius of 1°). This is a ratio of 1.16.
Figure 5 provides a visualization of the number of stars versus distance in a GAVRT-SETI skyframe toward two lines of sight. One near the plane, but away from the bulge (l = 28°, b = −1°) and one near the plane, but closer to the bulge (l = 6°, b = −1°). The Equivalent Isotropic Radiated Power (EIRP) to which GAVRT-SETI would be sensitive at those distances is also noted on the figure. So even at a relatively close distance of 1 kpc, we are looking at hundreds of millions of stars, and that number increases significantly as we get farther from the Earth within the plane of the Galaxy, particularly near the bulge.

Figure 5. Star counts per GAVRT-SETI frame at two differing locations in the Galaxy (one close to the bulge (l = 6°, b = −1°), and one further from the bulge (l = 28°, b = −1°) plotted against distance and Equivalent Isotropic Radiated Power (EIRP).
Download figure:
Standard image High-resolution imageAs a way to put the above EIRP numbers in relation to Earth's transmission capabilities, we can consider the distance to which a planetary radar system such as the Goldstone Solar System Radar (GSSR) could be detected. While less powerful than the former Arecibo Observatory planetary radar, the GSSR operates at a frequency similar to those at which these observations were conducted. This maximum distance is

The first line provides the basic equation, with F being our flux sensitivity, P being the power of a planetary radar system, and the factor Δν/δ ν accounts for a potential mismatch between the transmitted bandwidth δ ν and the processed bandwidth Δν, with the constraint that δ ν/Δν never exceeds unity. The second line uses a notional value from the GSSR, which has an EIRP of approximately 10 TW (1013 W) (Rodriguez-Alvarez et al. 2022). The GSSR has multiple possible transmit bandwidths, up to a 40 MHz mode (linear frequency modulation "chirp"); for the purposes of this illustration we adopt δ ν/Δν ≈ 1, as this provides an upper limit.
Clearly, our current limits provide no significant constraints on nearby planetary radars. Indeed, any planetary radar in the solar neighborhood, say within 10 pc, would have to be substantially stronger than the GSSR, of order 10 PW (1016 W), in order to be detected with our current system.
Finally to put our results into the broader current and past SETI searches, we plot our results relative to other surveys using the Continuous Waveform Transmitter Rate (CWTFM) figure of merit, as introduced by Enriquez et al. (2017), which also works for narrow-band signals:

Here, νfrac is the fractional bandwidth Δν/ν, ζAO is the normalization factor such that CWTFM = 1 when the EIRP is equivalent to the EIRP of the Arecibo radio telescope's planetary radar (∼1013 W), νfrac = 0.5, and Nstars = 1000. We have plotted our results with respect to the compilation and results presented by Enriquez et al. (2017) adding the result from Gajjar et al. (2021) that also uses the same figure of merit (Figure 6).
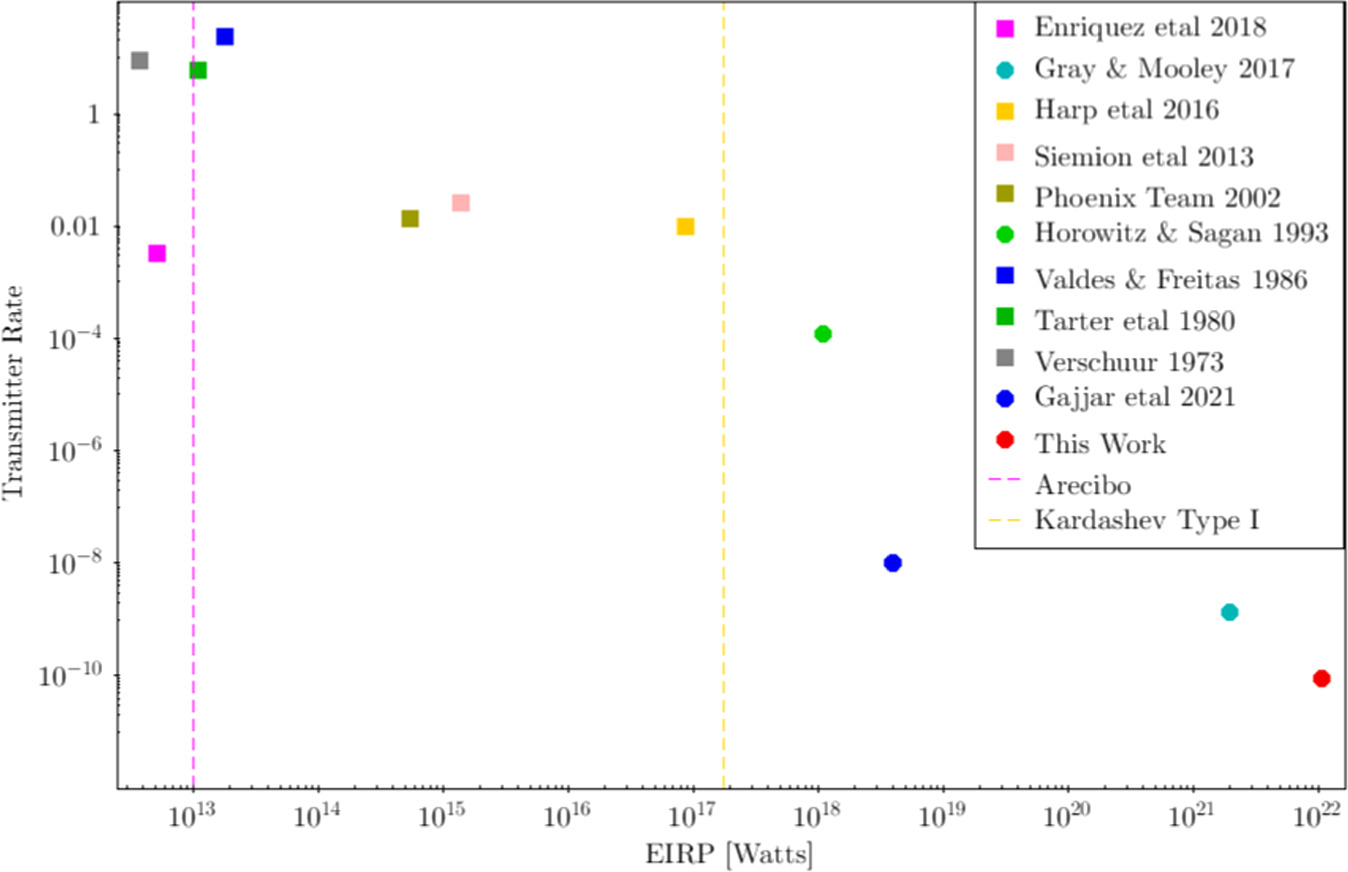
Figure 6. CWTFM plot similar to Enriquez et al. (2017) showing relative statistics for various surveys. In cases where a single paper reported multiple surveys, we have plotted the one with the highest EIRP. The left magenta dotted line represents the Arecibo EIRP and the center orange dotted line represents the EIRP for the full energy at the Earth received from the Sun (Kardashev Type I). Squares indicate surveys of targeted types of stars (either spectral types or with known exoplanets) while circles denote non-targeted surveys like this one.
Download figure:
Standard image High-resolution image3. Results
There were 772 candidate signals that were identified by the above noted criteria: less than 4 s in length and narrower than 1.5 Hz in width. To test the likelihood that these signals were random, we generated 772 signals at randomly selected frequencies. We repeated this to obtain distributions of 100 such sets of random signals, with some of these shown superimposed with the distribution of student-identified candidate signals in Figure 7. The distribution of our simulated sources is consistent with the distribution of random noise. There is a 2.5σ outlier at the very tail end of the distribution, due to the fact that there were 16 Candidates in the very lowest 1 MHz frequency bin. Since there is a known source of RFI which frequently is found in this frequency bin, we surmise that the excess is due to undetected low-level RFI. Thus our distribution of Candidates is consistent with random noise or low level RFI, and we can not claim detection of any reliable signals consistent with being technosignatures.
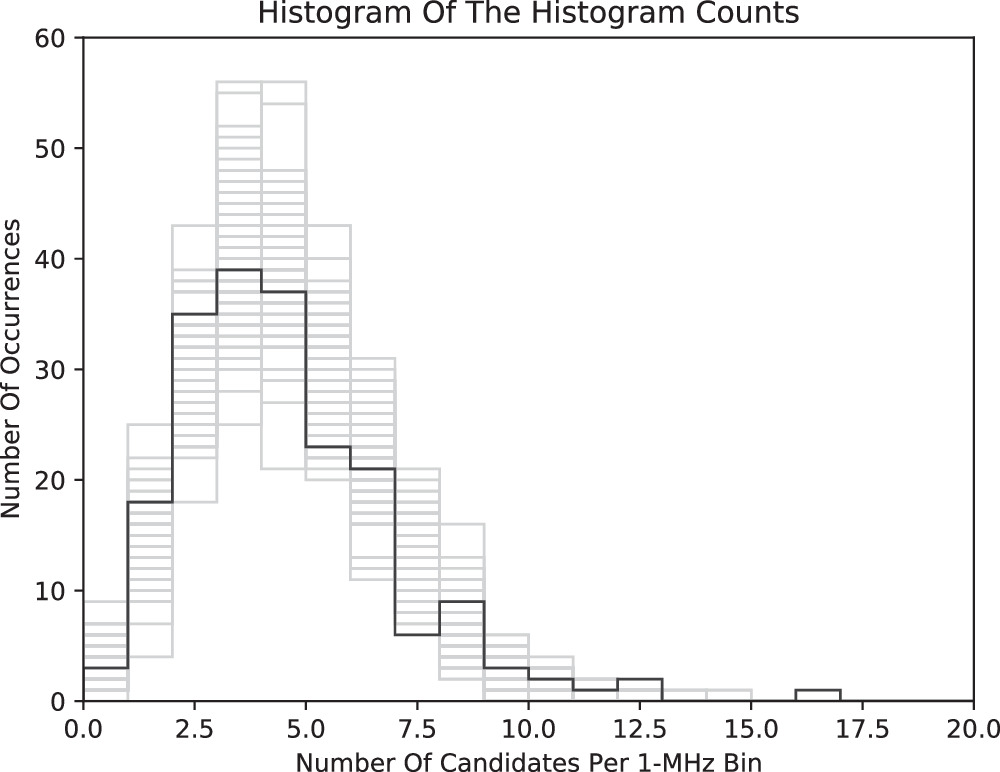
Figure 7. Histogram of our Candidate sources (black line) vs. histograms of multiple simulations (light gray) that were generated with random frequencies assigned to a similar number of Candidate signals.
Download figure:
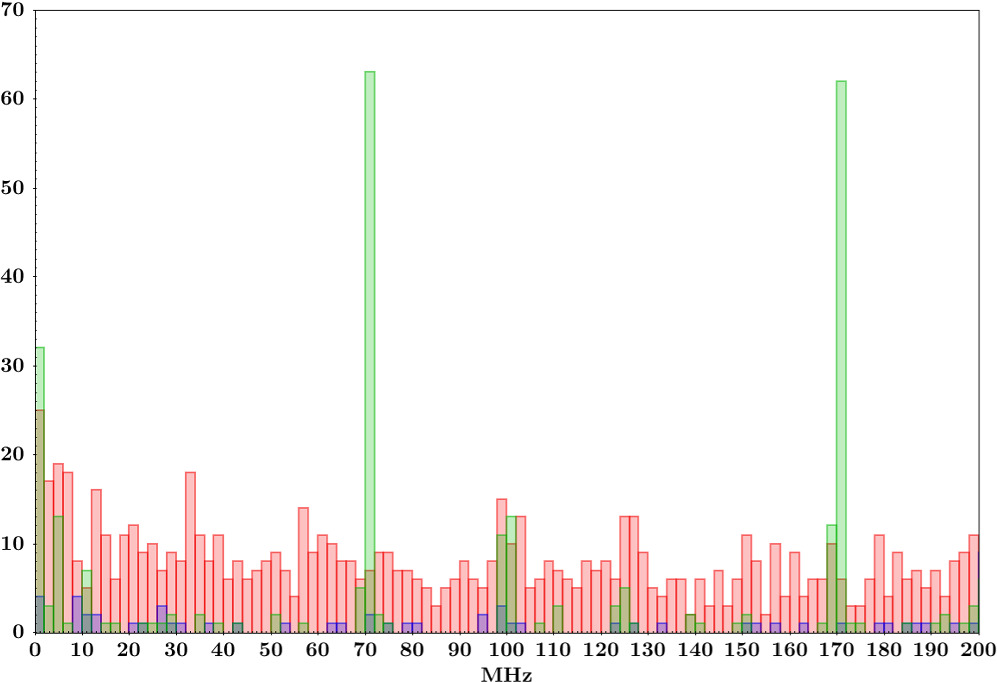
Standard image High-resolution imageAdditionally we have plotted all of the detected RFI, noise, and Candidate signals in Figure 8. There are moderately high Candidate detections where there are some RFI and noise signals, principally around 1, 100, and 170 MHz. These overlaps would of course make us more suspicious of the Candidates in those frequencies, but as noted above, since the distribution of Candidates is consistent with a random distribution, the additional detections at locations of RFI and noise are not significant enough to change the random statistical distribution shown in Figure 7.
Figure 8. Histogram of the frequencies of the 772 Candidates (red), noise (blue) and the RFI (green).
Download figure:
Standard image High-resolution image
4. Summary
No obvious signal from an intelligent extraterrestrial origin has been detected in this first analysis at 8.45 GHz with a sensitivity of 1.4 × 10⁻²⁰ W m−2. Since this is the first part of the survey covering a fraction of the Galaxy (see Figure 3) with the remainder to be surveyed in the coming years, the results are complex to interpret as each observation contains a different number of stars depending on which direction in the Galaxy we are looking. Observations toward the Galactic Center contain much larger numbers of stars, most of which are at ∼8 kpc, while observations off of the Galactic Center have fewer stars and are dominated by stars potentially as close as ∼100s of parsecs. Still, since an advantage of this survey is that it is conducted in a blind fashion across the plane of the Galaxy, it does allow us to say that for the regions that have been covered, the noise characteristics are similar and so there are no astrophysical sources that are mimicking extraterrestrial signals.
What we have also shown is that with the proper online tools, specifically a waterfall plot (Figure 2) which allows students, 5th through 12th grade (∼10–18 yr old), to dynamically explore the data and isolate noise and RFI, they can provide the necessary analysis of the data to potentially identify real signals. This approach has great educational benefits for the students because this process requires not only training in pattern recognition, but also understanding the basics of plotting so that the students understand waterfall plots and what they represent. Also the interaction with the waterfall plots introduces the concepts of dynamic range as well as the fact that any scientific data has noise and interference embedded in it, and it is vital to understand what those look like before being able to separate them from an actual signal. Additionally the nature of searching for rare events in a large number of channels and a large number of stars helps the students grasp concepts of probability and statistics.
GAVRT-SETI will continue the survey of the Galactic Plane, reaching greater sensitivity and completing the coverage of the Galactic Plane as visible from Goldstone over the next few years.
Acknowledgments
We acknowledge the support of LCER staff for all their infrastructure and observational support to data presented in this paper. Data were collected and analyzed with the assistance of the following schools and museums: AAE HS, AAE Space Camp, AAE Space Science, Ansonia HS, Astra Nova Online School, Bert Lynn MS, Brandeis HS, Branford HS, Broadwater Academy, Brookfield Academy, Camp Airy MD Boy Scouts, Centre Ridge Elementary, Colegio Concepcion, Colegio San Ignacio, Colegio Santa Teresita, Culver City HS, Culver City MS, Discovery Cube Museum, Dwight Bellizzi Acadaemy, Estes Park HS, Fort Street HS, Ideaventions Academy, Irvine HS, James Wood HS, Ken Caryl MS, Komagane Tech HS, Lincoln Leadership Acad., Los Osos HS, Manheim Township HS, Migrant STEAM Academy, Milan MS, Monrovia HS, Mountain Home HS, Netzaburg MS, Newnan HS, Newport MS, Newsome Sr. HS, Niles West HS, North HS, NSLA, NSLA Space Camp, Perris HS, Pine Ridge HS, Slauson MS, Somerset Intermediate, St. Leo the Great, St. Mary Catholic School, St. Mary's Hall, St. Mary's School, St. Teresa of Avila CS, Town of Apple Valley, Valencia Comm. College, West Career Tech Acad., Worcester Preparatory.
This work was performed in part at the Jet Propulsion Laboratory, California Institute of Technology, under contract with NASA.
This work has made use of data from the European Space Agency (ESA) mission Gaia (https://www.cosmos.esa.int/gaia), processed by the Gaia Data Processing and Analysis Consortium (DPAC, https://www.cosmos.esa.int/web/gaia/dpac/consortium). Funding for the DPAC has been provided by national institutions, in particular the institutions participating in the Gaia Multilateral Agreement.
Facility: DSN:GAVRT, Gaia - .
Software: astropy (Astropy Collaboration et al. 2013).
Footnotes
- 4
GAVRT's spc00789_20190713_153830 and spc00789_20190722_154106 data files of Mars Odyssey 2019 July observations can be viewed using GAVRT visualization tool (http://galileo.gavrt.org/cgi-bin/seti/seti.cgi).