


Abstract
Design basis accidents are investigated continuously for the European DEMO reactor accompanying its development. One selected postulated initial event (PIE) is a loss of vacuum (LOVA) in vacuum vessel (VV) with large ingress of air induced by rupture in a VV penetration. It has been investigated for the helium cooled pebble bed (HCPB) blanket concept according to the DEMO baseline 2017. The associated primary heat transfer system (PHTS) and the related systems in the tokamak building, from the VV to the PHTS vault and galleries, are considered for the investigation. The LOVA is postulated to occur at a port seal of the electron cyclotron equatorial port plug on the side of the closure plate with (i) a small leak of 1.0 × 10⁻³ m2, or (ii) a large break size of 1.0 × 10⁻² m2. Air ingress from one port cell into the VV leads to the VV pressurization and the fusion power termination followed by an unmitigated plasma disruption. A loss of off-site power for 32 h is assumed to coincide with the disruption. An in-vessel loss of coolant accident (LOCA) is considered as a consequence if the affected first wall (FW) reaches the defined temperature of 1000 °C. The radioactive inventories in the VV (tritium, W-dust) can mobilize towards the VVPSS, the affected systems in the building and the environment due to pressurization, venting and leak conditions. MELCOR 1.8.6 for fusion is applied for this deterministic safety analysis. The resulting releases of radioactivity to the environment are then provided for dose calculation using the computer systems UFOTRI and COSYMA. Outcomes of this LOVA analysis are critically discussed: the transient evolutions of different cases are compared; hydrogen production is detected in case of aggravating FW failure; the source terms (tritium, W-dust) are transported to the connected systems; and the dose results from the environmental releases are provided.
Export citation and abstract BibTeX RIS

Original content from this work may be used under the terms of the Creative Commons Attribution 4.0 license. Any further distribution of this work must maintain attribution to the author(s) and the title of the work, journal citation and DOI.
List of acronyms
| A | Area |
| Ab | Break size |
| ACB | Advanced Ceramic Breeder |
| B3 | Level B3 |
| BB | Breeding Blanket |
| BDBA | Beyond Design Basis Accident |
| BL | Bleed Line |
| BSS | Back Supporting Structure |
| BZ | Breeding Zone |
| CB | Cassette Body |
| CF | Control Function |
| CFD | Computational Fluid Dynamics |
| COB | Center OB |
| CV | Control Volume |
| DBA | Design Basis Accident |
| DEC | Design Extension Condition |
| DEMO | DEMOnstration fusion reactor |
| DH | Decay Heat |
| DHRS | Decay Heat Removal System |
| DIV | Divertor |
| dp | Pressure drop |
| EC | Electron Cyclotron |
| ED | Effective Dose |
| EF | EUROFER |
| Env | Environment |
| EPP | Equatorial Port Plug |
| EV | Expansion Volume |
| FFMEA | Functional Failure Mode and Effect Analysis |
| FL | Flow path |
| FW | First Wall |
| GSSR | Generic Site Safety Report |
| HCPB | Helium Cooled Pebble Bed |
| He | Helium |
| HS | Heat Structure |
| HVAC | Heating Ventilation and Air Conditioning |
| I/II | Flow distributed in the FW |
| IB | Inboard |
| ICD | Indirect Coupling Design |
| IHTS | Indirect Heat Transfer System |
| IHX | Intermediate Heat Exchanger |
| IML | Inner Midplane Limiter |
| ITER | International Thermonuclear Experimental Reactor |
| IVC | In-Vessel Component |
| L1 | Level 1 |
| LIB | Left IB |
| LOB | Left OB |
| LOCA | Loss of Coolant Accident |
| LOOP | loss of Off-site Power |
| LOVA | Loss of Vacuum |
| LP | Lower Port |
| LPC | Lower Pipe Chase |
| m | Mass |
| m· | Mass flow rate |
| MF | Manifold |
| MI | Module IB |
| MO | Module OB |
| MS | Molten Salt |
| NMM | Neutron Multiplier Material |
| OB | Outboard |
| OLL | Outboard Lower Limiter |
| OML | Outboard Midplane Limiter |
| p | Pressure |
| PAR | Passive Autocatalytic Recombiner |
| PC | Port Cell |
| PCH | Plasma Chamber |
| PCS | Power Conversion System |
| PD | Plasma Disruption |
| PFU | Plasma Facing Unit |
| PHTS | Primary Heat Transfer System |
| PIE | Postulated Initiating Event |
| PP | Port Plug |
| PRS | Pressure Relief System |
| RD | Rupture Disk |
| RIB | Right IB |
| RN | Radionuclide |
| ROB | Right OB |
| RP | Reflector Plate |
| S-DS | Standby Detritiation System |
| SDL | Safety Data List |
| SEC | Sector |
| SL | Shielding Line |
| SMS | Single Module Segmentation |
| SS | Stainless Steel |
| ST-VS | Suppression Tank Venting System |
| SV | Safety Valve |
| T | Temperature |
| t | Time |
| TF | Table Function |
| UL | Upper Limiter |
| UP | Upper Port |
| UPC | Upper Pipe Chase |
| VS | Vertical Shaft |
| VV | Vacuum Vessel |
| VVPSS | VV Pressure Suppression Tank |
| W | Tungsten |
| WPSAE | Work Package Safety and Environment project |
1. Introduction
In the pre-conceptual design phase of the European DEMO reactor (2014–2020) [1], a series of deterministic safety analyses of the Design basis accidents (DBAs), as well as beyond design basis accidents (BDBAs), have been investigated for the helium cooled pebble bed (HCPB) blanket concept following the design development [2]. References [3–5] reported the events of the loss of coolant accidents (LOCAs) in the breeding blanket (BB), in-vessel or ex-vessel for the first designs up to DEMO baseline 2015 with 18 toroidal field coils. After that, the loss of heat sink and the in-vessel LOCA have been investigated for DEMO baseline 2017 with 16 toroidal field coils [6]. During the on-going conceptual design phase (2021–2025), the accident analyses are continued and started with a selected postulated initial event (PIE) for loss of vacuum (LOVA) in vacuum vessel (VV). The PIE of the LOVA is a large ingress of air induced by rupture in a VV penetration, which is called VVA1 in [7]. This is one of 21 most representative PIEs, which have been identified for EU DEMO in terms of challenging conditions for the plant safety based on the functional failure mode and effect analysis (FFMEA). The FFMEA is a suitable methodology for DEMO design at system level, since the detailed design at component level is still on-going [6]. The rupture in a VV penetration is assumed to be a small leak or a large break in a port seal of the electron cyclotron (EC) equatorial port plug (EPP) on the side of the closure plate (figure 7), which is identified as a critical place. The LOVA in DBA (with the anticipated frequency between 1.0 × 10⁻⁴ and 1.0 × 10⁻² [6]) has been investigated for the HCPB blanket concept according to the baseline 2017. The associated primary heat transfer system (PHTS) and the related systems in the tokamak building, such as the VV, the VV pressure suppression system (VVPSS), the port cell (PC), the PP, the cryostat and cryostat space, the galleries at different levels, the PHTS vault, the the upper and lower pipe chases (UPC and LPC) are considered. The system code MELCOR 1.8.6 for fusion is the qualified code for the deterministic safety analyses within the EUROfusion work package safety and environment project (WPSAE) [6, 8]. For estimating the transport of the source terms (tritium, W-dust for the HCPB concept) MELCOR RN package is applied. Relevant parameters, assumptions and inventories for the LOVA analysis are taken from DEMO safety data list (SDL), which is a living database for providing information required in the accident analyses [6]. The resulting releases of radioactivity to the environment are then provided for dose calculation using the computer systems UFOTRI for assessing the consequences of accidental tritium releases and COSYMA for the activation products (W-dust) [9, 10]. Hydrogen production can be detected by oxidation with tungsten as plasma facing component, if steam from the wet EV enters the VV.
The paper is organized as follows: section 2 presents the reference designs required for the accident analysis. Section 3 shows the defined accident scenarios with relevant assumptions. Section 4 describes the system modeling using MELCOR. Section 5 discusses the simulation results for steady state, tranisent, raiologicial releases and hydrogen production. Section 6 presents the dose assessement. Section 7 presents the summary of this analysis.
2. Reference designs
2.1. HCPB-BL2017-v2 and limiters
In the baseline 2017, the reference designs are the HCPB-BL2017-v2 [2], the associated PHTS [11] connecting both in- and outlet of the BB located in the VV upper port (UP) and the VVPSS including wet and dry expansion volumes (EVs) [6]. The whole blanket system is divided into 16 sectors. Each sector (22.5°) contains 5 blanket segments: 3 outboard (OB) and 2 inboard (IB) segments (figures 1 and 2). The Single Module Segmentation (SMS) is modularized in the poloidal direction, which is labeled as ROB, COB, LOB, RIB or LIB in figure 2. The plasma facing side of the first wall (FW) is designed to have a roof-shaped form with a gradient of ∼2° to protect the edges of the blanket module at the gaps against thermal loads. It is covered with a 2 mm thick functionally graded tungsten armor. The FW encloses He cooling channels with a size of 12 mm × 12 mm and a poloidal pitch of 16.5 mm. The FW is attached with a back wall and back supporting structure (BSS). The internals are shown in the cross-sections A–A and B–B (figures 1). The fuel-breeder pin in the breeding zone (BZ) consists of three coaxial tubes, which are filled with the advanced ceramic breeder (ACB in pebbles) in the inner annular volume and beryllide (Be12Ti) in form of prismatic block as neutron multiplier material (NMM) (figures 1). The ACB is based on a mixture of Li4SiO4 and Li2TiO3. All structural elements of the blanket are manufactured with Eurofer97 (EF) [12]. The design temperatures of the materials are limited at 550 °C for EUROFER97 (TEF_lim), at 900 °C–1000 °C for Be12Ti (TBe12Ti_lim) and at 920 °C for ACB (TACB_lim). The flow scheme from the FW manifold MF1 to the BZ outlet manifold MF4 according to figure 1 is schematized in figure 3.

Figure 1. Reference HCPB BB design [2].
Download figure:
Standard image High-resolution image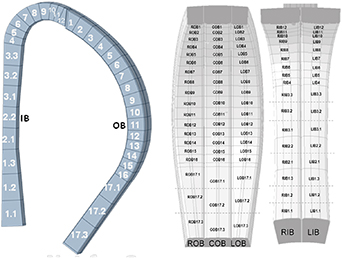
Figure 2. The modularized SMS [2].
Download figure:
Standard image High-resolution image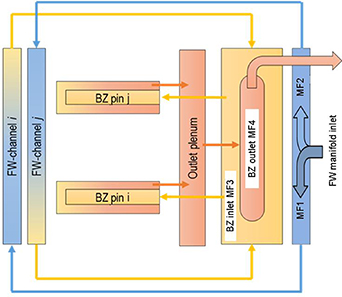
Figure 3. Flow scheme of HCPB BB [2].
Download figure:
Standard image High-resolution imageThe limiter concept is adopted for the European DEMO to protect the FW from extreme heat flux due to off-normal plasma instabilities [13]. Figure 4 shows the positions of the limiters. Specific heat loads on the limiters are considered. The total power deposited on the limiters are 0.252 MW, 3.324 MW, 0.649 MW and 1151 MW for the OML, UL, OLL and IML, respectively.
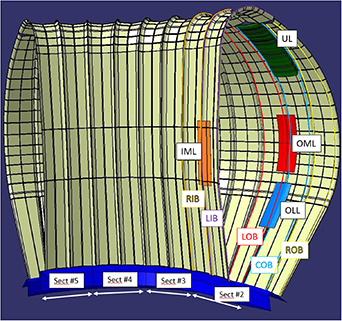
Figure 4. Limiters equipped in sector 2: inner midplane limiter (IML), upper limiter (UL). outer midplane limiter (OML), outboard lower limiter (OLL) [13].
Download figure:
Standard image High-resolution image2.2. BB PHTS for the HCPB
The indirect coupling design (ICD) is the reference design for the HCPB, since the direct coupling between the BB PHTS and the power conversion system (PCS) via the steam generator is not recommended for the pulsed operation due to heat transfer constraints [11]. The BB PHTS consists of eight independent cooling loops that each loop serves two sectors, and its total power is 2.029 × 10³ MW for normal operation (figure 5). The averaged mass flow rate of each loop is 222.2 kg s−1. The BB in- and outlet temperature are designed at 300 °C and 520 °C respectively, and the inlet pressure is 8 MPa. The pressure drop is about 8.0 × 10⁴ Pa for the BB based on the 3D computational fluid dynamics (CFD) analysis in [14], and 2.7462 × 10⁵ Pa for one loop [11]. An indirect heat transfer system (IHTS) is equipped with an energy storage system and operated with molten salt (MS). It is coupled with the BB PHTS via an intermediate heat exchanger (IHX), and with the PCS via the steam generator. The material of all ex-vessel components and piping is stainless steel (SS).
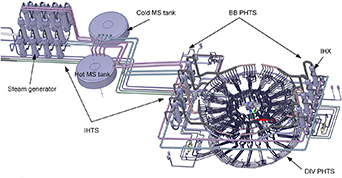
Figure 5. Reference HCPB BB PHTS design with 8 cooling loops [11].
Download figure:
Standard image High-resolution imageA pressure relief system (PRS) is mandatory to control the blanket pressure below the design limit of 9.2 MPa. The PRS contains two-train safety valves (SVs) introduced on the cold leg of each loop with the pressure set points shown in table 2 (section 3). It is assumed that 2 s is required for full opening/closing the SV. Pressurization of the cooling loop is detected when the pressure signal exceeds the set points. If the SV opens He is vented to a tank. The PRS is connected to Class III emergency power from standby diesel generators.
2.3. The related systems in the tokamak building
The tokamak building is arranged at different levels (figure 6). Figure 7 shows the main arrangement at the equatorial level used for this study. The main data of the related systems such as the VV, the VVPSS, cryostat, cryostat space, PC and its vertical shaft (VS), UPC, LPC, galleries and PHTS vault are listed in table 1. The VV consists of the main plasma chamber (PCH), the UP and lower port (LP) volumes (figure 9). The double walled VV shell is cooled with water in the VV PHTS. In accident case, the temperature of the shell inner structure remains at 195 °C by means of a decay heat removal system (DHRS) as emergency cooling system. The initial volume temperature of the VV is set at 300 °C. The maximum pressure of the VV is limited at 200 kPa (pVV_lim) due to the designed diamond windows for transmission of high power microwave beams. Six bleed lines (BLs) and three rupture disks (RDs) are designed in the pipe connection between the VV and the wet EV of the VVPSS. The cross section of each BL is 0.05 m2 and 1.0 m2 for each RD. The pressure set point is at 90 kPa for the BL (pBL) and at 150 kPa (pRD) for the RD. The pressure of the VVPSS is 4.5 kPa and its temperature is 30 °C. The wet EV has a volume of 3000°m3 including 5% water for heat exchange, and the dry EV of 13 500 m3. The EVs are placed in the gallery at levels B3 and B4. The leak rate assumed from the VVPSS to the gallery is ⩽1%/day if the EV pressure becomes larger than the gallery pressure. The suppression tank venting system (ST-VS) provides sub-atmospheric conditions in the VV trapping tritium and airborne dust (99.9% efficiency). ST-VS processing flow rate is 3000 m3 h−1 with a delay time of 5 min for startup. The cryostat is a structure encapsulating the VV and the superconducting magnets. It has a free volume of 29 050 m3, pressure of 10 × 10−4 Pa, temperature of 20 °C and the design pressure of 109 kPa. The leak rate assumed from the VV to the cryostat is ⩽1% volume per day if the VV pressure gets larger than the cryostat pressure. The cryostat space is an annular gap of 1 m between the cryostat and the bioshield. It is connected to the gallery bottom via passages. The leak rate from the gallery to the environment is ⩽ 100% volume per day at ±0.3 kPa as function of the pressure difference, which is adopted from ITER. During the LOOP that the heating ventilation and air conditioning (HVAC) stops, the stand-by detritiation system (S-DS) will maintain negative pressure in the room and trap tritium (99% efficiency) and airborne dust (99.9% efficiency). S-DS processing flow rate is 150 m3 h−1 with a delay time of 3 min for startup.
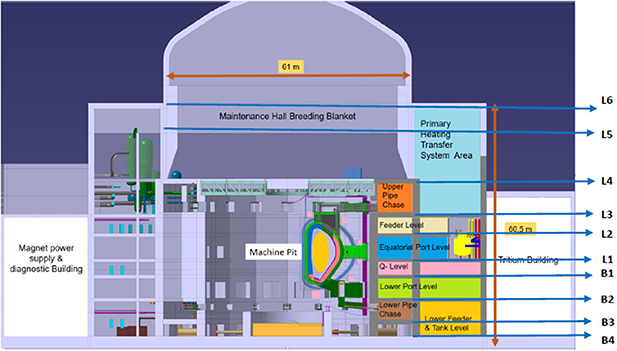
Figure 6. DEMO Tokamak building with the complex level arrangement [15].
Download figure:
Standard image High-resolution image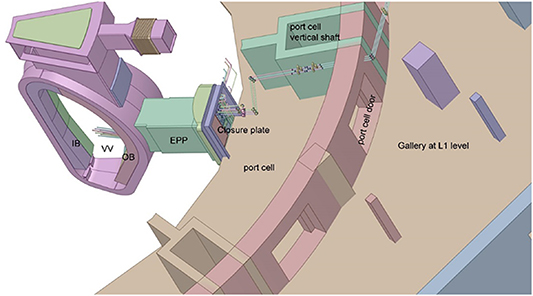
Figure 7. VV—EPP—PC—gallery arrangement at the equatorial level.
Download figure:
Standard image High-resolution imageTable 1. Main data for the VV, VVPSS and the related rooms.
| Component | Free volume (m3) | Temp (°C) | p (kPa) | p limit (kPa) | Leak rate | Flap | Detritiation efficiency | Venting flow rate (m3/h) | |
|---|---|---|---|---|---|---|---|---|---|
| VV | UP | 1664 | 300 | 10 × 10−8 | 200 (pVV_lim) | ⩽1%/day if pVV > pcryostat (to cryostat) | See BL and RD | — | — |
| PCH | 2964 | ||||||||
| LP | 1630 | ||||||||
| Cryostat | 29 050 | 20 | 10 × 10−7 | 109 | 4× flaps to cryostat space, 0.5 m × 0.5 m each, if p > p_limit | — | — | ||
| Cryostat space | 2413.22 | 20 | 99.95 | — | — | Passages 4 × 2.4 m2 (to gallery at B3&B4) | — | — | |
| Gallery at L1 | 20 784.6 | 20 | 99.95 | — | ⩽100%/day at ± 0.3 kPa (to environment) | — | S-DS: dust 99.9%, tritium 99% | 3000 (5 min delay) if p_gallery > 100 kPa, cross section of 1.0 m2 | |
| Gallery at B3&B4 | 33 494.4 | ||||||||
| VVPSS | 1xBL | 2.0 | 30 | 4.5 | 90 (pBL) | — | — | — | — |
| 1xRD | 40.0 | 150 (pRD) | |||||||
| Wet EV | 2850 air, 150 H2O | 20 | 4.5 | pVV_lim | ⩽1%/day pEV > pgallery (to gallery at B3&B4) | — | — | — | |
| Dry EV | 13 500 | ST-VS: dust 99.9%, tritium 99.9% | 150 (3 min delay) if pEV > 150kPa, cross section of 0.02 m2 | ||||||
| PHTS vault | 73 147.5 | 20 | 99.95 | — | ⩽100%/day at ± 100 kPa (to environment) | 4 flaps to the dome, 0.5 m x 1.0 m each, if p > 150 kPa | S-DS: 99.9% for dust & ACP, 99% for tritium | 3000 (5 min delay) if p_PHTS-vault > 100 kPa, cross section of 1.0 m2 | |
| UPC | 10 957 | 20 | 99.90 | 120 | — | 2 flaps to PHTS vault 0.5 m x 1.0 m each, if p > 120 kPa | — | — | |
| LPC | 7073 | 20 | 99.90 | — | 2 flaps to gallery at B3&B4, 0.5 m x 1.0 m each, if p > 120 kPa | — | — | ||
| 1 × PC at L1 | 491.40 | 20 | 99.90 | ⩽100%/day at ± 0.3 kPa (to gallery at L1) | 1 flap to VS, 0.5 m x 0.5 m, if p > 150 kPa | — | — | ||
| 1 × VS for PC | 225 | 20 | 99.90 | — | Connection to UPC & LPC | — | — | ||
2.4. Divertor
Besides the BB, divertor (DIV) is another relevant in-vessel component (IVC). The so-called 'single-null' divertor concept is the current adopted baseline configuration, in which the divertor is located at the bottom of the VV [16]. It consists of 48 separate cassette modules arrayed along the toroidal direction. One cassette design is shown in figure 8. The inboard and outboard target plates receive high heat fluxes (⩾10 MW m−2) on the plasma facing unit (PFU). The targets are designed with tungsten monoblock armor and copper alloy cooling pipe. The shielding liner (SL) and reflector plates (RPs) protect the VV and pipes. The cassette body (CB) holds the targets and the shielding components. The DIV PHTS is intended to feed coolant to the PFU and the CB in separate loops [17]. The divertor is used to investigate structure conditions to the VV.
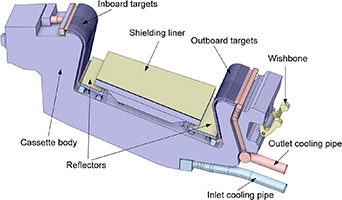
Figure 8. One cassette design of the divertor.
Download figure:
Standard image High-resolution image3. Scenarios and assumptions
Two cases of a LOVA in the VV are defined in table 2: (i) CaseI with a small leak (Ab) is assumed in a port seal of the EC EPP on the side of the closure plate, and (ii) CaseII for the large break at the same position (figure 7). The LOVA is initiated at the beginning of the transient during normal operation. It leads to air ingress from one PC into the VV that fusion power is terminated by an unmitigated plasma disruption. The disruption induces a maximum heat flux of 335 MW m−2 on the FW surface area of 1.0 m2 (AFW) for 1.0 ms (tPD). AFW is assumed to be shaped in a square and it is shared in two adjacent sectors (Nr. 6 and 7), which are located in two different cooling loops (Loop3 & Loop4) to achieve high He inventory discharged to the VV. A loss of off-site power (LOOP) for 32 h (tLOOP) is assumed to coincide with the disruption that all compressors and pumps in the BB PHTS and DIV PHTS, and the HVAC system stop running. An in-vessel LOCA is assumed as a consequence if the affected FW on the plasma side reaches 1000 °C (TEF). At this temperature the FW structure integrity cannot be assured any more due to the yield strength behavior of EUROFER97 [12]. The FW failure complies with a double break size of 1.76 × 10⁻² m2 in total. Pressure relief from the VV to the wet EV via the BLs and via the RDs will be triggered passively by reaching the defined set points. A delay time of 2 s (tBLd) is assumed for the BL opening. The VV pressurization may allow transport and release of mobilizable radioactive source terms (tritium and W-dust) to the VVPSS, the cryostat and the followed systems, and to the environment with respect to the leak rate conditions. The used inventories of the source terms are shown in table 2, and the mobilization fraction is 1.0. Test simulation showed that tPD of 1 ms is too short to increase the FW temperature. Since frequent disruptions may damage the FW, the repeatable disruptions are assumed to affect the same FW position. Test simulation showed that the accumulated disruption time of 3.7 s (equivalent to 3700 disruptions) is required to reach TEF for the FW failure. This case is considered as CaseIII in table 2 while other conditions are same as CaseII. The aim of CaseIII is to estimate the consequences of the aggravating FW failure. With the frequency below 1.0 × 10⁻⁴ CaseIII is a scenario of design extension condition (DEC). The DEC was defined in the Generic Site Safety Report 2022 (GSSR [6], living document) considering an aggravating event or an event with multiple failures, and replaced the BDBA events.
Table 2. Assumptions and accidental sequences for three scenarios.
| Case | I | II | III | |||
|---|---|---|---|---|---|---|
| Modeled loops | Loop3, 4, 5, 6 (5 loops) | |||||
| Failure of port seal | At steady state (s) | 0.0 | ||||
| Break size Ab (m2) | 1.0 × 10⁻³ | 1.0 × 10⁻² | ||||
| Air ingress into | VV | |||||
| Unmitigated plasma disruption tPD (s) | 1.0 × 10⁻³ | 3.7 | ||||
| Compressor shutdown (s) | After the disruption | |||||
| FW failure | Affected area AFW (m2) | 1.0 | ||||
| EF temperature (TEF) (°C) | 1000 | |||||
| Break size (m2) | 1.76 × 10⁻² | |||||
| Pressure of PRS (MPa) | 1st train, SV1 | Open | 9.08 | |||
| Close | 8.8 | |||||
| 2nd train, SV2 | Open | 9.5 | ||||
| Close | 8.8 | |||||
| Loss of off-site power time tLOOP (h) | 32 | |||||
| BL delay time tBLd (s) | 2.0 | |||||
| Source term inventory | W-dust (kg) | VV: 1034 + 5 disruption | ||||
| Tritium (g) | VV: 2673 (averaged) | |||||
| BB coolant: 4.176 × 10⁻² | ||||||
| PHTS coolant: 5.824 × 10⁻² | ||||||
4. System modeling using MELCOR
The system code MELCOR is a fully integrated, engineering-level computer code to simulate postulated severe accidents in light water reactor [18]. MELCOR 2.2 is the current fission release. However, it does not include some physical models required for fusion safety analyses [19]. For special fusion application, MELCOR 1.8.6 for fusion [20, 21] is selected for the deterministic safety analyses of the blanket concepts within the WPSAE. For this study, the HCPB blanket, the associated PHTS and the related systems in the tokamak building have been modeled using the selected MELCOR version. Figure 9 shows the nasalization scheme of the related systems connected to the loops.

Figure 9. Nodalisation scheme of the systems in the tokamak building.
Download figure:
Standard image High-resolution imageFor the BB PHTS and the integrated HCPB blanket, three single cooling loops are modeled individually as Loop3 with sectors 5&6, Loop4 with sectors 7&8 and Loop5 with sectors 9&10, while the remaining five loops with 10 sectors are lumped to one loop (Loop6). The nodalization scheme of Loop3 is shown in figure 10. The SMSs and loop components are lumped due to the code capacity. In the poloidal direction, the SMS is subdivided in three grouped modules with comparable mass flow rates shown in table 3. Three OB SMSs of one sector at each poloidal level are grouped together, and four IB segments of two sectors are grouped. In one loop, control volumens (CVs) are modeled for the compressor, the connected pipe to the cold leg, cold leg, cold headers distributed to each of two OB sectors and two IB sectors, inlet MFs, horizontal and vertical pipes of the BB inlet, FW MF1&MF2 for counter flow (I&II), FW1&2, FW-BZ MF3, pins in forward direction/front return/backward direction, BZ plenum, BZ MF4, vertical and horizontal pipes of the BB outlet, outlet MFs, hot headers, hot leg, IHX and pipe connecting the compressor that a closed loop is modeled. Flow paths (FLs) define the flow connecting CVs with respect to the velocity, momentum sources (compressor), or control logic (valve, variable control) using control function (CF) and table function (TF). Components of the VV and the VVPSS are modeled with CVs as well. Friction coefficient and roughness determine the pressure drop and mass flow distribution. Heat structures (HSs) associated to CVs are modeled with respect to materials (EUROFER, ACB, NMM, SS, etc), surface heat flux, nuclear power and decay heat data from [22], gap insulation in the pin, surface radiation with the emissivity of 0.3 for EUROFER and structure to structure radiation (figure 12). Loop4 and Loop5 are modeled as duplication of Loop3 by changing the numbering of CV, FL, CF etc. Loop6 modeled for the remaining five loops is simplified that the FW is grouped in one CV in each flow direction and pins are grouped in one flow due to the limited MELCOR entries of 40 000. A volume (CV928) equivalent to the dry EV (CV918) is modeled as the PRS. To run MELCOR the initial VV pressure is set to be 56 Pa with hydrogen. Hence the initial hydrogen mass in the VV is 0.14 kg (mH2_ini).

Figure 10. Nasalization scheme of Loop3 of the BB PHTS.
Download figure:
Standard image High-resolution imageTable 3. BB subdivision in Loop3.
| Loop3 | SMS (figure 2) | Position in Figure 11 |  _I/II (kg s−1) _I/II (kg s−1) | |
|---|---|---|---|---|
| OB | Sector 5/6 | L&C&ROB1-7 | MO1 | 12.6684 |
| L&C&ROB8-16 | MO2 | 13.3822 | ||
| L&C&ROB17.1-17.3 | MO3 | 13.7545 | ||
| IB | Sectors 5 & 6 | L&RIB5-12 | MI1 | 9.9968 |
| L&RIB2.2, 3.1-3.3, 4 | MI2 | 10.5419 | ||
| L&RIB1.1-1.3, 2.1 | MI3 | 10.9697 | ||
For the divertor with water cooling, the CB loop for the SL and the RPs, and the PFU loop are modeled as simplified open loops with respect to the data for geometry, cooling, nuclear power and decay heat in order to perform structure conditions to the VV (figure 12).
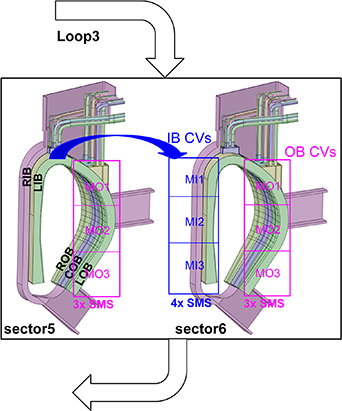
Figure 11. Subdivision of SMSs for MELCOR modeling.
Download figure:
Standard image High-resolution image
Figure 12. HS radiation in MELCOR modeling.
Download figure:
Standard image High-resolution imageThe MELCOR RN package is used for radiological releases. This package calculates the release and transport behavior of fission product vapors and aerosols, and it operates on the basis of material classes [18]. Dust and HTO are defined as new classes. A model for transporting HTO is implemented in the RN package [23]. The dust inventory is defined as aerosol source with the time rate specified by a TF. Pool scrubbing is considered for the flow paths to the wet EV. In contact with humid air in the VV after the LOVA, and subsequently in the VVPSS, gallery, PHTS vault and the environment, tritium is converted to HTO. HTO is the main contribution to the tritium dose for licensing. Concequently, HTO is used for the assessments. When converting HTO from the amount released given in grams by MELCOR, a factor of 6.64 is used representing the difference from tritium gas due to atomic masses difference.
5. MELCOR simulation results
5.1. Steady state
The steady state results of the simulation for 2000 s are comparable with the design data, as they are shown for Loop3 in table 4. The loop mass flow rate is controlled with a deviation of 3.34% and 0.20% for the compressor. The deviation for the flow distribution in 3 SMSs of OB, 4 SMSs of IB and FW subdivisions is less than 0.5%. The pressure drop of the blanket components is adjusted by the friction coefficient and roughness in the FL to achieve the defined blanket pressure drop of 8.0 × 10⁴ Pa. He temperature at the blanket inlet is well controlled by the heat power removal in the IHX. The He temperatures at the FW and blanket outlets are well comparable with the reference values. The maximum EUROFER temperature on the boundary to tungsten of the FW, as well as the maximum temperatures of EUROFER, ACB and Be12Ti in the pin are within the maximum reference temperatures from the CFD study [14]. The mass flow rates of Loop6 from 5 lumped loops are enlarged proportionally. He inventory of all loops is 1.0166 × 10⁴ kg. The inventory of the affected loops has impact on the VV pressurization.
Table 4. Comparison of the MELCOR results for Loop3 with the design data.
| Component |
 (kg s−1) (kg s−1) | Reference | Deviation | ||
|---|---|---|---|---|---|
| Loop3 | 229.2880 | 222.2370 | 3.34% | ||
| Compressor I | 111.3378 | 111.1185 | 0.20% | ||
| OB | Cold head1 (FL303) | 79.9401 | 79.6100 | 0.41% | |
| MF1/2 (FL304) | 39.9706 | 39.8085 | 0.41% | ||
| FW1 (FL306) | 12.6415 | 12.6684 | −0.21% | ||
| FW2 (FL308) | 13.4474 | 13.3882 | 0.44% | ||
| FW3 (FL310) | 13.8795 | 13.7545 | 0.91% | ||
| Pin (FL318) | 79.9174 | 79.6100 | 0.39% | ||
| IB | Cold head3 (FL367) | 63.0138 | 63.0170 | −0.01% | |
| MF1/2 (FL368) | 31.5069 | 31.5085 | −0.01% | ||
| FW1 (FL370) | 10.0043 | 9.9968 | 0.08% | ||
| FW2 (FL372) | 10.5338 | 10.5419 | −0.08% | ||
| FW3 (FL374) | 10.9673 | 10.9697 | −0.02% | ||
| Pin1 (FL382) | 62.9938 | 63.0170 | −0.07% | ||
| dp (Pa) | Reference | Deviation | |||
| Loop3 | 2.6776 × 10⁵ | 2.7462 × 10⁵ | −2.50% | ||
| OB | MF1/2 + FW (p_303-p_317) | 4.9157 × 10⁴ | 4.8543 × 10⁴ | 1.27% | |
| pin (p_317-p_325) | 5.5580 × 10³ | 5.6120 × 10³ | −0.96% | ||
| BB (p_303-p_327) | 8.0082 × 10⁴ | 8.0 × 10⁴ | 0.103% | ||
| IB | MF1/2 + FW (p_367-p_381) | 4.9550 × 10⁴ | 6.0835 × 10⁴ | −18.54% | |
| pin (p_381-p_389) | 4.4140 × 10³ | 4.8198 × 10³ | −8.42% | ||
| BB (p_367-p_391) | 8.0319 × 10⁴ | 8.0 × 10⁴ | 0.40% | ||
| T (°C) | Reference | Deviation | |||
| OB | He | Inlet (CV303) | 299.35 | 300.0 | −0.22% |
| FW (CV317) | 378.14 | 380.0 | −0.49% | ||
| Outlet (CV327) | 522.51 | 520.0 | 0.48% | ||
| FW | EF (HS for CV308) | 470.98 | 549.8 | — | |
| BZ | EF (HS for CV322) | 547.93 | 613.2 | — | |
| ACB (HS for CV318) | 628.95 | 969.8 | — | ||
| Be12Ti (HS for CV322) | 683.50 | 900.8 | — | ||
| IB | He | Inlet (CV367) | 299.35 | 300.0 | −0.22% |
| FW (CV381) | 384.11 | 380.0 | 1.08% | ||
| Outlet (CV389) | 524.47 | 520.0 | 0.86% | ||
| FW | EF (HS for CV372) | 457.17 | 539.0 | — | |
| BZ | EF (HS for CV386) | 554.76 | 602.7 | — | |
| ACB (HS for CV382) | 683.94 | 903.4 | — | ||
| Be12Ti (HS for CV386) | 723.05 | 931.6 | — | ||
5.2. Thermal hydraulic transient results
The transient of the initiating LOVA event starts after the steady state (t = 0.0 s). Since in the used MELCOR version He and water cannot be used as working fluids in a common system, He has to be used like air as non-condensable gas due to water in the wet EV. The simulation time is ended at the end of the LOOP (tend). Time evolutions of three scenarios are summarized in table 5, including the start time of dust and tritium released to the affected system. The main results of the mass flow rate, pressure, temperature and releases are shown from figures 13–16 respectively.
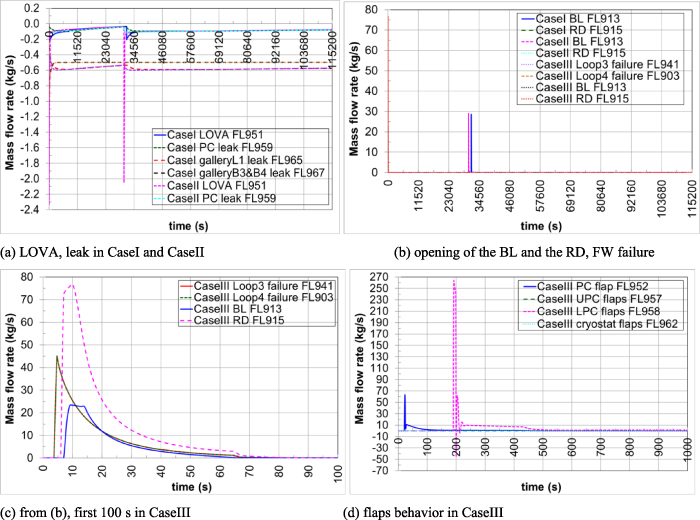
Figure 13. Main mass flow results.
Download figure:
Standard image High-resolution image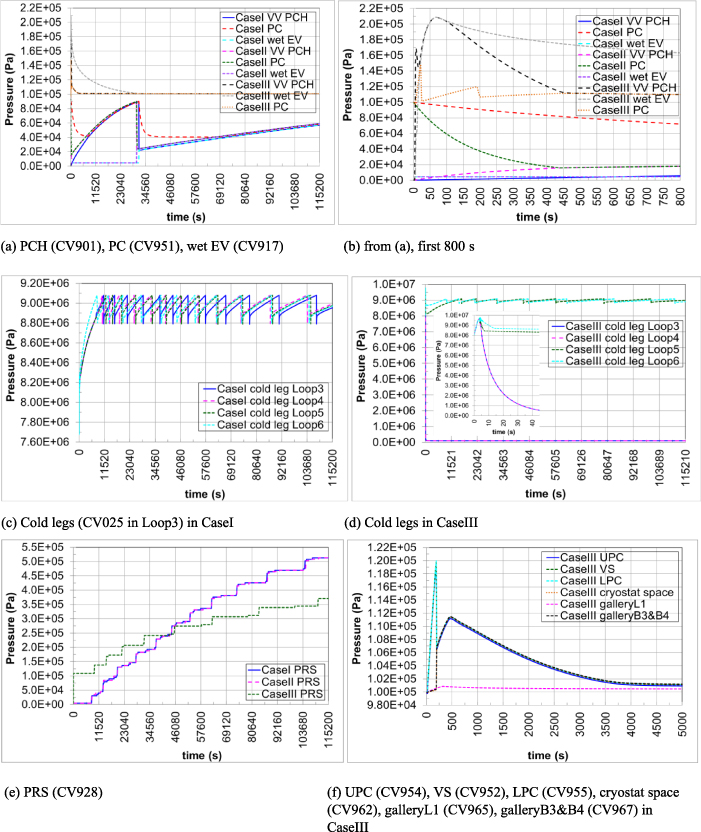
Figure 14. Main pressure results.
Download figure:
Standard image High-resolution image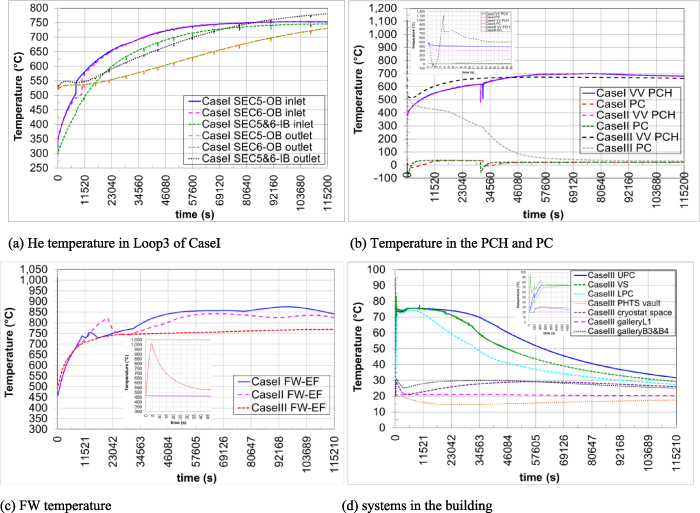
Figure 15. Main temperature results.
Download figure:
Standard image High-resolution image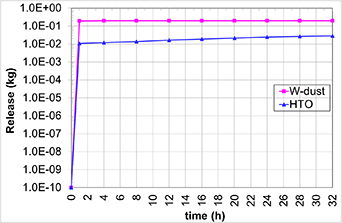
Figure 16. Environmental release in CaseIII as time integrated curve.
Download figure:
Standard image High-resolution imageTable 5. Time evolution of the scenarios in transient.
| Sequence | Time (s) | |||
|---|---|---|---|---|
| Case | I | II | III | |
| LOVA (FL951) | 0.0024 | 0.0030 | ||
| End of unmitigated dissruption/LOOP/DH start | 0.0034 | 3.7030 | ||
| tEF at TEF (in-vessel LOCA) | Not happen | 3.7042 | ||
| Open BL (FL913) | 31 522.0 | 30 482.2 | 7.3725 | |
| Open RD (FL915) | Not open | 6.2623 | ||
| pVV > pVV_lim | Not happen | 46.206 | ||
| Max. pVV | 31 522.0 (9.0 × 10⁴ Pa) | 30 482.2 (9.0 × 10⁴ Pa) | 66.87 (2.088 × 10⁵ Pa) | |
| Open flaps PC to VS (FL952) | Not open | 21.44 | ||
| Open flaps LPC to galleryB3&B4 (FL958) | Not open | 190.31 | ||
| Open flaps UPC to PHTS vault (FL957)/cryostat to cryostat space (FL962) | Not open | |||
| Open ST-VS (FL970) | Not open | 201.37 | ||
| Open galleryL1 S-DS (FL971) | 314.59 | 314.98 | 317.20 | |
| Open galleryB3&B4 S-DS (FL972) | 317.77 | 317.79 | 321.45 | |
| Open PHTS vault S-DS (FL973) | 2574.1 | 2574.1 | 2577.8 | |
| W-dust/HTO | VV | 0.0074 | 0.0074 | 0.008 |
| PC | No | No | 5.5 | |
| Wet/dry EV | 31 525.0 | 30 485.0 | 7.0 | |
| Cryostat | 0.008 | 0.008 | 3.8 | |
| Cryostat space | No | No | 14.0 | |
| VS/UPC/LPC | No | No | 22.0 | |
| PHTS vault | No | No | No | |
| GalleryL1 | No | No | 7.0 | |
| GalleryB3&B4 | No | No | 14.0 | |
| Env1 (leak) | No | No | 192.0 | |
| Env2 (venting) | No | No | 202.0 | |
| End of simulation after LOOP (tend) | 115 200 | 115 200 | 115 204 | |
5.2.1. CaseI and CaseII.
In these two case the LOVA starts at 0.0024 s. Compressor shutdown is followed by the unmitigated plasma disruption at 0.0034 s. The large break size in CaseII leads to an earlier and larger negative peak mass flow rate of −2.336 kg s−1 at 1.0 s compared to CaseI with a small break size (−0.235 kg s−1 at 2.001 s, FL951 as blue/magenta curve in figure 13(a)). Consequently, the PC pressure drops and reaches to a minimum of 1.6 × 10⁴ Pa at 445 s (PC as red/green curve in figure 14(a)), which is 7550 s earlier than it in CaseI. The PC temperature drops to a negative value (minimum of −85.88 °C at 439.0 s in CaseII vs. −18.16 °C at 2336.0 s in CaseI) due to gas expansion (PC as red/green curve in figure 15(b)). Due to air ingress into the VV, the PCH pressure increases and reaches the minimum PC pressure (PCH as blue/magenta curve in figures 14(a) and (b)). The pressure of the interconnected VV and PC increases continuously until pBL is reached at 30 480.2 s, which is 1039.7 s earlier than in CaseI. 2 s (tBLd) later the BL opens that the mass flow rate reaches the peak value of 29.0 kg s−1 at 30 485.0 s in CaseII, and 28.4 kg s−1 at 31 525.0 s in CaseI (FL913 as blue/magenta curve in figure 13(b)). The connection to the VVPSS leads to the abrupt drop of the VV pressure and the pressure increase in the wet EV (PCH as blue/magenta curve and wet EV as cyan/violet curve in figure 14(a)). The temperature in the PCH drops accordingly due to gas expansion (PCH as blue/magenta curve in figure 15(b)). The RD is not opened since pRD is not reached (FL915 as green/cyan curve is 0.0 in figure 13(b)). The mass flow rates at the locations of the LOVA and leak rate conditions are varied due to the BL opening as well (figure 13(a)). The blanket pressure is well controlled by the PRS, as shown in figure 14(c) for CaseI. Thus, He temperatures in the FW and blanket are controlled near 800 °C in the long term (figure 15(a)). Since the maximum FW temperature of all sectors does not exceeds TEF (figure 15(c)), neither due to short tPD nor due to the decay heat in the long term, the FW does not break in CaseI and CaseII. The pressure of the PRS increases gradually by controlling the blanket pressure (figure 14(e)). With the assumed volume size same as the dry EV the pressure exceeds pVV_lim at 37 240 s, and reaches 5.13 × 10⁵ Pa at tend. Since all flaps are closed, the UPC, LPC, VSs and PHTS vault are not affected. The negative mass flow rates due to the leak rate conditions avoid the source terms releasing to the environement (figure 13(a)). In the long term, the parameters of CaseI and CaseII have similar behavior.
5.2.2. CaseIII.
In CaseIII, with the extended plasma disruption time of 3.7 s under the maximum heat flux, the FW temperature reaches TEF at 3.8 s (red curve in figure 15(c)) that the FW of sector 6 (Loop3) and sector 7 (Loop4) fails with AFW. The He enters into the PCH with a peak mass flow rate of 45.041 kg s−1 at 4.7 s (FL941 as red curve and FL903 as green curve in figure 13(c)). The in-vessel LOCA leads to a flow drop in the blanket close to zero. The pressures of the unaffected Loop5 and Loop6 are well controlled by the PRS, while the pressure of the failed Loop3 and Loop4 drops below pVV_lim at 115 s and below the atmospheric pressure at ∼3336 s (figure 14(d)). The PCH pressure increases stronger after He ingress and it reaches the first peak of 1.686 × 10⁵ Pa at 8 s (PCH as black curve in figure 14(b)). The PCH temperature exceeds TEF_lim after 3.0 s, reaches a maximum of 1102.56 °C at 3.7 s, and returns below TEF_lim at 13.0 s (PCH as black curve in figure 15(b)). The RD is opened at 6.26 s due to pRD, which is 1.11 s earlier than the BL opening due to tBLd (FL915 as magenta curve vs. FL913 as blue curve in figure 13(c)). The mass flow rate due to the RD opening reaches the peak value of 76.8 kg s−1 at 10.0 s, and it is 23.4 kg s−1 due to the BL opening. After the pressure drop due to opening of the RD and BL, the PCH pressure increases together with the EVs to a maximum of 2.088 × 10⁵ Pa at 66.87 s (PCH as black curve in figure 14(b)). The PCH pressure returns below pVV_lim 45 s later (at 112 s) while the EVs return 57 s later (at 125 s). The PC pressure drops due to the LOVA shortly, then it increases due to He flow from the VV and reaches the pressure set point of 150 kPa that the flap from the PC to the VS (FL952) is opened at 21.44 s (PC as orange curve in figure 14(b), blue curve in figure 13(d)). The VS pressure increases to the peak value of 1.1990 × 10⁵ Pa at 190.0 s (green curve in figure 14(f)). The pressures of the interconnected UPC and LPC increase accordingly (blue and cyan curves in figure 14(f)). The flaps from the LPC to the galleryB3&B4 are opened at 190.3 s when the LPC pressure reaches the set point of 120 kPa (FL958 as magenta curve in figure 13(d)). Then the interconnected UPC, VS, LPC, cryostat space and galleryB3&B4 reach a common pressure level of ∼1.067 × 10⁵ Pa at ∼200 s (figure 14(f)). The pressure increases to the second peak value of ∼1.114 × 10⁵ Pa at ∼468 s and then decreases below the atmospheric pressure (1.013 × 10⁵ Pa) at 3894 s. The PRS pressure increases to 3.7094 × 10⁵ Pa at tend (green curve in figure 14(c)), which is lower than it in other two cases, since the pressure relief control for Loop3 and Loop4 is not required after the FW failure. The FW temperature reaches the maximum of 1011.51 °C at 4.0 s and decreases after the disruption, then it increases to the maximum of 769.0 °C at tend due to the decay heat (red curve in figure 15(c)). The temperatures in the UPC, LPC, PHTS vault, cryostat space and galleries are kept below 100 °C (figure 15(d)).
5.3. Radiological resleases
The releases of three cases at tend are compared in table 6, in which the VV value means the summation of the masses in the PCH, VV UP, LP and PP volumes. The releases in CaseI and CaseII are comparable. The most of the dust is remained in the VV (CaseI 99.8%, CaseII 99.7%), while the most HTO is located in the dry EV (CaseI 92.32%, CaseII 92.30%). In these two cases there are no releases to the galleries and the PHTS vault and no venting of the ST-VS, thus no releases to the environment. There are also no releases to the PHTS vault in CaseIII since its flaps are closed. The behavior of the radiological releases to the environment in CaseIII is shown in figure 16 as time integrated curve, which is due to the venting of the galleries and the ST-VS (Env2 in table 6), and the leak rates of the EV and the galleryB3&B4 (Env1). The activities are mostly released in the first hour to the environment (dust 0.189 kg h−1, HTO 0.0107 kg h−1). Then the dust release remains nearly constant in the long term, while HTO release increases till tend due to the venting. The release data to the environment in CaseIII are used as the input data in the following dose calculation.
Table 6. Releases at tend (kg).
| Case | I | II | III | |
|---|---|---|---|---|
| Dust | Inventory | 1039.0 | ||
| VV | 1036.9 | 1035.9 | 488.9 | |
| PC | 0.0 | 0.0 | 4.4378 | |
| BL & RD | 8.1641 × 10⁻³ | 9.1051 × 10⁻³ | 0.264 | |
| Wet EV | 1.0784 | 1.1493 | 345.32 | |
| Dry EV | 0.6445 | 0.7864 | 158.84 | |
| Cryostat | 1.5807 × 10⁻² | 1.7222 × 10⁻² | 1.2052 × 10⁻² | |
| Cryostat space | 0.0 | 0.0 | 6.7371 × 10⁻² | |
| UPC | 0.0 | 0.0 | 14.253 | |
| LPC | 0.0 | 0.0 | 11.923 | |
| 8x VS | 0.0 | 0.0 | 0.7606 | |
| GalleryL1 | 0.0 | 0.0 | 0.2839 | |
| GalleryB3&B4 | 0.0 | 0.0 | 4.4379 | |
| PHTS vault | 0.0 | 0.0 | 0.0 | |
| Env1 (leak) | 0.0 | 0.0 | 0.19106 | |
| Env2 (venting) | 0.0 | 0.0 | 4.0266 × 10⁻³ | |
| Env1 + 2 (total) | 0.0 | 0.0 | 0.1951 | |
| HTO | Inventory | 17.7455 | ||
| VV | 0.6358 | 0.5233 | 1.5843 | |
| PC | 0.0 | 0.0 | 2.0358 × 10⁻² | |
| BL & RD | 0.1342 | 0.1271 | 3.4941 × 10⁻² | |
| Wet EV | 0.5821 | 0.6931 | 3.0048 | |
| Dry EV | 16.383 | 16.379 | 6.8185 | |
| Cryostat | 5.1218 × 10⁻³ | 5.2904 × 10⁻³ | 3.6078 × 10⁻² | |
| Cryostat space | 0.0 | 0.0 | 7.6812 × 10⁻² | |
| UPC | 0.0 | 0.0 | 0.4940 | |
| LPC | 0.0 | 0.0 | 0.2502 | |
| 8x VS | 0.0 | 0.0 | 7.2523 × 10⁻² | |
| GalleryL1 | 0.0 | 0.0 | 3.4273 × 10⁻² | |
| GalleryB3&B4 | 0.0 | 0.0 | 1.2336 | |
| PHTS vault | 0.0 | 0.0 | 0.0 | |
| Env1 (leak) | 0.0 | 0.0 | 1.0927 × 10⁻² | |
| Env2 (venting) | 0.0 | 0.0 | 1.7754 × 10⁻² | |
| Env1 + 2 (total) | 0.0 | 0.0 | 2.8682 × 10⁻² | |
5.4. Hydrogen production in CaseIII
In CaseIII, steam is found in the VV, which is from the wet EV due to the reversed pressure differential (black and gray curves in figure 14(a)). Hence the tungsten armor is oxidized not only with air due to the LOVA but also with steam. The hydrogen behavior including the produced hydrogen due to W-steam reaction and the initial amount in the VV (mH2_ini) and the steam behavior are shown in figure 17. The VV includes the PCH, UP, LP and PP. Steam enters the VV at 90 s (figure 17(b)). The maximum hydrogen mass found in the VV is below 260 g. Hydrogen transported to the other systems of the tokamak building is small (e.g. <18 g in the UPC or gallery B3&B4, <10 g in the PC, and futher lower values). 419 g of hydrogen is generaged due to W-steam reaction in total. Since the galleries are sub-atmospheric in the long term, there is no hydrogen released to the environment.

Figure 17. Masses of steam and hydrogen in CaseIII.
Download figure:
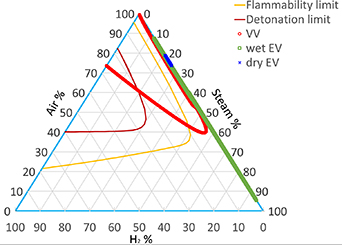
Standard image High-resolution imageThe ternary diagram in figure 18 shows H2-air-steam mixtures after steam entering the VV. He in the same CV is not counted, since it is an inert gas that is neither flammable nor explosive. The flammability limit uses the correlation in equation (1) [24]:
Figure 18. Ternary diagram of the H2–air–steam mixtures.
Download figure:
Standard image High-resolution image
The mole percent is calculated based on moles of each component regarding each molar mass. The detonation limit is drawn based on the figure for 100 °C and air density of 41.6 mol m−3 in [25]. In the VV, the detonation risk is found till ∼461 s and the flammability till ∼900 s, then no risks in the long term. There are no flammability risk in the wet and dry EVs. Even the ternary diagram as a function of mixture coordinates provides the risk ranges, however, the densities of hydrogen and steam are less than 0.0153 mol m−3 and 0.0321 mol m−3 respectively with respect to the huge volume (6298 m3). Thus, the risks are unlikely in the VV. The detonation limit is also a function of geometric scale, initial pressure and temperature that a detonation code is required for more detailed analysis.
6. Dose calculation and results
The aim of dose assessment is to analyze if potential releases of RNs into the environment would cause early emergency actions such as the evacuation of the public in the surroundings of the site. The dose calculation is performed by using the computer systems UFOTRI for assessing the consequences of accidental releases of tritium and COSYMA for activation product (dust) [26]. UFOTRI was validated in the frame of ITER studies [27]; COSYMA is used as European model for siting assessments [10]. The specific activity of tritium in form of HTO is defined based on chemical handbooks. To assess the consequences for these releases, typically a probabilistic approach is applied. This means that weather from one or more years is considered. Here, weather from one year with hourly measured data is taken. However, a sampling was performed first to categorize the one year into 144 weather sequences together with their probability of occurrence. Historic weather conditions from Cadarache (ITER) in 1991 were selected for the probabilistic assessment since the values of the 95% percentiles of the dose for the three available weather datasets (years 1991–1993) were quite similar. The release height is 10 m with building wake.
Table 7 shows the early dose (7 days) and the effective dose (ED) with ingestion for CaseIII. The early dose exceeds 1 mSv up to several kilometers from the release point. The ED near to the release is higher than 10 mSv, and drops below 1 mSv only at 10 km. The dose is dominated by HTO for the early dose whereas the contribution to the ED is similar for both with a higher contribution by HTO. Only at 0.5 km the ED exceeds 20 mSv/event, which is defined as an on-site individual effective dose as a design objective for events with low frequencies in DEMO [6]. In respect to such doses, the design might be revised or active mitigation measures implemented. However, this will be discussed as soon as the design is more advanced.
Table 7. Dose for CaseIII at several distances (mSv).
| 95% Percentile | 0.5 km | 1 km | 5 km | 10 km |
|---|---|---|---|---|
| Early dose | 6.6 | 3.9 | 0.17 | 0.063 |
| ED with ingestion | 31 | 17 | 1.3 | 0.85 |
7. Summary
The preliminary LOVA analysis in DBA has been investigated for the DEMO HCPB blanket concept with the associated PHTS and with the related systems in the tokamak building. The boundary conditions such as the unmitigated plasma conditions, head loads applied on the IVCs including limiters, leak conditions, detritiation efficiency, etc have been considered for the MELCOR modeling. The source terms transport and potential release to the environment have been investigated. The large He inventory in the system (1.0166 × 10⁴ kg in the BB PHTS) can challenge the pressurization of the VV and the connected VVPSS in case of an in-vessel LOCA.
The main differences between CaseI and CaseII are found due to the break sizes which affect the speed of the PC depressurization and the VV pressurization. The VV pressurization leads to opening of the BL, but it is below pRD that the RD is closed all the time. The common pressure level of the PC and the VV is achieved at 445.0 s in CaseII, which is 2.10 h earlier than in CaseI. TEF is not reached on the affected FW by the very short plasma disruption (1.0 ms) or due to the decay heat in the long term. Thus, there are no source terms released to the environment.
With the extended plasma disruption for 3.7 s in CaseIII (DEC), the aggravating FW failure leads to an in-vessel LOCA as consequence. The RD opens at 6.26 s, which is 1.11 s earlier than the BL opening due to tBLd. The VV pressure exceeds pVV_lim at 46.2 s, reaches the maximum of 2.088 × 10⁵ Pa at 66.87 s, drops below pVV_lim at 112 s, and decreases to 1.007 × 10⁵ Pa at tend. The flaps to the VS and LPC are opened while the UPC and the PHTS vault are not affected. The source terms are mostly released in the first hour to the environment. At tend, dust of 195.1 g and HTO of 28.68 g are released to the environment. Tungsten oxidation with steam in the VV leads to the hydrogen production of 419 g. The ternary diagram of the H2–air–steam mixtures shows the flammability and detonation risks in the VV. Due to small density of hydrogen and steam in huge volume (<0.0321 mol m−3) these risks become unlikely. The dose assessment shows that HTO has the highest contribution to the dose results. The early dose (7 days) exceeds 1 mSv up to several kilometers from the release point at the building level. The EDs from 1 km on are below DEMO design objective of 20 mSv/event.
Based on the above discussion, some issues learned from this study will be addressed in future investigation:
- Update the design for the VVPSS: (1) update the size of wet and dry EVs to control the VV pressure below the design limit; (2) update the BL set point for its opening before the RD; (3) mitigate hydrogen with the passive autocatalytic recombiner (PAR) package in MELCOR.
- Design the release height of a chimney in the building to reduce the dose results.
- Design the PRS in accordance with the pressure control system during operation.
- Determine more precise inventories of the source terms.
- Model the VV PHTS to obtain detailed VV behavior, however, the modeling of the BB has to be simplified due to the limited MELCOR entries.
- Improve codes application:
- -a common MELCOR version valid for both fission and fusion safety analyses is recommended to be developed, as it is illustrated in [19].
- -Tritium functionalities of UFOTRI are being integrated in the decision support system JRODOS [28] as an on-going WPSAE task. The updated JRODOS including state of the art dispersion models will be applied for fusion dose assessment in the future.
- -The flammability/combustion risk due to hydrogen production should be investigated in-depth with special code such as COM3D [29].
Acknowledgments
This work has been carried out within the framework of the EUROfusion Consortium, funded by the European Union via the Euratom Research and Training Programme (Grant Agreement No 101052200—EUROfusion). Views and opinions expressed are however those of the author(s) only and do not necessarily reflect those of the European Union or the European Commission. Neither the European Union nor the European Commission can be held responsible for them.